
Abstract
The transition to clean energy demands innovative low-carbon hydrogen production solutions, particularly in developing nations. This study explores the prospect of green hydrogen production in the Economic Community of West African States (ECOWAS) using solar photovoltaic (PV) and wind power technologies. The region, endowed with massive renewable energy resources, continues to face challenges in developing economically viable and low-carbon hydrogen production strategies. The study fills this gap by developing a comprehensive methodology combining renewable energy production, electrolysis, and economic analysis. The study examines the viability of hydrogen production in 15 West African countries according to primary indicators such as electricity production, density of hydrogen production, levelized cost of hydrogen, and reduction of carbon dioxide emission. This novel method offers a detailed geospatial and techno-economic analysis of green hydrogen production, revealing stark variations in production costs and green hydrogen potential for West African countries. The study revealed Niger, Mali, and Cape Verde to have great potential for green hydrogen development due to high renewable energy resources and low production costs. This study provides policymakers and investors with a critical roadmap based on the potential of green hydrogen as a low-carbon energy solution in West Africa. In addition, it presents a strategy for creating competitive, low-carbon hydrogen economies that can drive the energy transition and economic diversification based on the region's strengths and weaknesses.
Introduction
Global energy consumption has changed dramatically in response to the ongoing emphasis on economic growth and the rapid expansion of urban areas. However, this increased demand has largely been met by conventional energy sources that rely on finite and depleting fossil fuels, resulting in negative consequences such as the release of carbon dioxide (CO2) emissions. (Agyekum, 2024). Since the adoption of the Kyoto Protocol in 1992, the pursuit of safe, secure, and environmentally friendly energy resources has become essential for meeting global energy demand and mitigating climate change. In line with this goal, the United Nations Sustainable Development Goal 7 advocates universal access to modern, affordable, and reliable energy services (Frimpong et al., 2025). Despite significant progress in the energy sector, approximately 730 million people, mainly in Africa and Asia, have remained without electricity access as of 2020 (Elkadeem et al., 2024). In response to the ongoing challenges posed by fossil fuels, which remain a major driver of climate change, global efforts have increasingly turned toward renewable energy generation (Garud et al., 2023).
Nevertheless, despite the abundance of renewable energy sources, their inherent intermittency poses significant challenges to their effective utilization (Ekoue et al., 2025). To address this, introducing hydrogen as an energy carrier with its high storage density could help mitigate these fluctuations and reduce energy shortages (Guduru et al., 2025). Hydrogen supports decarbonization by replacing fossil fuels in heavy industry, transportation, and energy storage and provides clean energy from renewable sources (Paraschiv et al., 2025). As a flexible and environmentally friendly energy storage option, hydrogen technologies are suitable for applications ranging from small backup systems to large-scale energy demands (Odoi-Yorke et al., 2025). Its potential as a long-term energy storage solution lies in its ability to enhance system stability and facilitate the integration of renewable energy sources (Gül and Akyüz, 2023).
In Africa, where expanding renewable energy access and ensuring grid reliability (Migisha et al., 2023) are critical challenges, storage technologies could accelerate sustainable development and energy security (Gulagi et al., 2018). As a result, there is increasing interest in green hydrogen production across the continent (AbouSeada and Hatem, 2022), driven by Africa's growing reliance on renewables, abundant land availability, and significant water resources. These factors position Africa as a promising hub for green hydrogen export. Several countries, including South Africa, Namibia, Egypt, Morocco, and Niger, have already outlined plans to develop 18 GW of green hydrogen capacity (Nasser and Hassan, 2024a).
The Economic Community of West African States (ECOWAS) has committed to coordinating and harmonizing its energy strategies to promote regional integration and collective energy autonomy. A key step in this direction was the adoption of the ECOWAS Renewable Energy Policy (EREP) in 2012, which signaled the region's determination to address its long-standing energy crisis (ECREEE, 2013). As of 2017, about 175 million people in West Africa still lacked access to modern, reliable, and sustainable energy services. Nevertheless, the region has made notable progress over the past two decades in expanding energy access and increasing its mix's share of sustainable energy. Within the EREP framework, ECOWAS countries aim to balance energy supply and demand and promote renewable energy and energy efficiency. The goal is to achieve 100% energy access for all populations by 2030. In view of this, regulatory frameworks have been developed to strengthen regional integration and foster greater adoption of renewable energy technologies (Ishaku et al., 2022).
In parallel, international collaborations support the region's transition to a low-carbon energy future. One such initiative is the H2 ATLAS-AFRICA project, launched by the German Federal Ministry of Education and Research (BMBF) in partnership with countries in the Sub-Saharan region, including the Southern African Development Community (SADC) and ECOWAS members. The project aims to assess the potential of renewable energy resources in Sub-Saharan Africa for green hydrogen production. This initiative could significantly enhance the continent's role in global energy markets by positioning Africa as a future exporter of green hydrogen (SACREEE, 2023).
Based on the issues presented supra, it is clear that the ECOWAS region will need to double up its efforts in its quest to provide sustainable and affordable energy to meet its current and projected demands. It has already shown interest in developing its renewable energy resources, including green hydrogen, by formulating various policies to attract local and foreign investments into the sector. However, investors will need multiple support for investing in such projects, such as a sound economic environment, social support, and technical assistance. One aspect of the technical and economic assistance is providing a feasibility study on such projects’ technical and economic viability. With several renewable energy resources, the ECOWAS region offers great potential for producing green hydrogen.
A comprehensive feasibility approach is required to show possible regional areas for producing green hydrogen and present investment decision-making. This study provides unique value by presenting a comprehensive green hydrogen production potential analysis across the ECOWAS region. It distinguishes itself through its multi-dimensional approach integrating technological, financial, and environmental perspectives. Its unique contribution lies in developing country-specific atlases and detailed roadmaps for green hydrogen production using solar and wind energy, representing a pioneering effort to systematically evaluate and map hydrogen potential across 15 ECOWAS nations. The study supports energy security strategies and creates a robust framework for attracting local and international investments in the emerging hydrogen economy by providing an understanding of regional renewable energy variations. The study's methodological innovation is further underlined by its comparative analysis of hydrogen production potential through water electrolysis. It provides policymakers and investors a tool for informed decision-making in sustainable energy infrastructure development. Moreover, by highlighting the ECOWAS region's untapped potential as a potential green hydrogen exporter, the study contributes significantly to the global discussion on transitioning towards clean energy solutions and positioning Africa as a key player in the international renewable energy marketplace.
The study is organized as follows: Section “Literature review” presents a literature review on the subject, and the method used is presented in Section “Materials and methods.” The results and discussions are presented in Section “Results and discussion.” The study limitations are summarized in Section “Limitations.” The conclusion is highlighted in Section “Conclusion.”
Literature review
Nasser and Hassan (2024a) developed an Egyptian Atlas to analyze green hydrogen production using solar and wind energy via water electrolysis. The Atlas included CO2 mitigation, production costs, hydrogen density, and power density data from all 27 Egyptian governorates. The New Valley Governorate has the lowest power and hydrogen densities, while Sohag has the highest. The lowest levelized cost of hydrogen (LCOH) values are 2.60 $/kg in Sohag and 2.14 $/kg in the Red Sea. The study of Nasser and Hassan (2024b) also investigated the application of biomass, wind turbines, and photovoltaic (PV) energy as hybrid power sources for water electrolysis-based hydrogen production. It examined solar intensity and wind speed up to 11 m/s and 800 W/m2, respectively. Five configurations (Conf.) were presented in the study: PVs only (Conf. 1), WTs only (Conf. 2), PVs area equal to WTs area (Conf. 3), PVs have double WTs area (conf 4), and WTs area doubles PVs area (Conf. 5) powering the system. According to the findings, systems driven by PV cells generate the highest annual density of hydrogen production-13.21 kgH2/m2. As wind speed and solar intensity increase, so do the systems’ energy and exergy efficiencies, LCOH, and payback period. For Conf.1, Conf.2, Conf.3, Conf.4, and Conf.5, the LCOH ranges are 1.8 to 2.04 $/kg, 1.49 to 1.73 $/kg, 1.74 to 2.03 $/kg, 1.77 to 2.05 $/kg, and 1.7 to 1.99 $/kg. With 2050 serving as the benchmark year for European decarbonization, Wolf et al. (2024) looked at the possible LCOH for six nations in Europe and Northern Africa. Germany was used as a case study to assess whether low-cost imported hydrogen should reach market maturity or if domestic hydrogen production is more cost-competitive than other regions. With the exception of Norway, the findings showed that PV-based hydrogen is the most cost-effective alternative among the evaluated countries. Spain recorded the lowest LCOH, ranging from 1.66 €/kg to 3.12 €/kg, followed by Algeria (1.72–3.23 €/kg) and Morocco (1.73–3.28 €/kg). As such, Germany is recommended to prioritize PV-based hydrogen imports from these nations to optimize economic import options.
Likewise, Silva et al. (2024), employing 23 years of meteorological data from Portugal, analyzed PV-fed water electrolysis to produce hydrogen. Based on the results, producing 30 kg/kWp of specific hydrogen annually for less than €4.0/kg is possible. The study was the first to create an atlas for Portugal's capacity to produce solar hydrogen. Utilizing real, location-based data, Karayel and Dincer (2024) conducted a thorough analysis of Canada's solar energy resources to evaluate its water electrolysis potential for hydrogen production. According to the study, Canada can generate green hydrogen from onshore and offshore solar energy sources totaling 205.69 Mt, 201.12 Mt, and 211.17 Mt. There is a range of potentials from 0.34 to 39.54 Mt among the thirteen provinces and territories. Similarly, to power a solid oxide Electrolyzer (SOEC) to produce green hydrogen, Aravindan and Praveen Kumar (2024) combined a stand-alone municipal solid waste (MSW) with a solar thermal power cycle. This study investigated two system layouts: the Organic Rankine cycle (ORC) and the Kalina cycle. Solar thermal energy and MSW biogas generated electricity for the SOEC's activation. In terms of cost savings, CO2 penalties, and thermal efficiency, the ORC performed better than Kalina, which generated 32% more power and had a lower LCOH of $6.88. The optimal points for ORC and Kalina are 15.5% and 6.23%, respectively, with total investment costs of $130,833 and $135,235.
In the work of Messaoudi et al. (2024), the authors analyzed Algeria's wind resource availability using meteorological wind energy potential at wind turbine hub height. The authors found significant potential for producing hydrogen from wind energy, estimated at 1.093 Gt/year without constraints and 1.066 Gt/year with constraints. The cost of producing hydrogen from wind ranged from 1.51 to 15.37 $/kg, suggesting that wind energy could replace fossil fuel consumption in the transportation sector. Amjad et al. (2024) assessed Pakistan's hydrogen production capacity using a methodology that combined density-based clustering and spatial multi-criteria analysis. According to the study, the Surab-Gwadar alignment, the N-25 national highway, and the Quetta-to-D-I-Khan alignment are just a few of the possible locations close to national electricity transmission networks. Pakistan's capacity to produce hydrogen annually using solar PV is approximately 7 million tons.
Other notable studies include Al-Ghussain et al. (2024a), who revealed that wind-based hydrogen systems achieve lower carbon intensity (0.35–1.9 kg CO2eq/kg H2) compared to solar-based systems (1.58–2.95 kg CO2eq/kg H2), with production costs varying based on location and resource variability. Complementing these findings, Shboul et al. (2025a) evaluated hybrid solar dish-Brayton engine and fuel cell systems, achieving peak efficiency with 400 stacked fuel cells and demonstrating up to 390.8% CO₂ emissions reduction. The polygeneration approach in wastewater treatment plants, as assessed by Alrbai et al. (2024), showed economic viability, with net present values reaching 87.48 million USD while producing 15,417 tons of ammonia annually. The work of Al-Ghussain et al. (2025) found that while green ammonia production costs in Jordan (900–2500 USD/kg NH3) currently exceed grey ammonia costs (∼360 USD/kg NH3), the significantly lower carbon intensity (0.1–0.5 vs. 1.8 kg CO2eq/kg NH3) and potential 92% cost reductions through technological advancement make it economically competitive. Integration studies by Lee et al. (2024) and Al-Ghussain et al. (2024b) revealed that PV/wind-based electric vehicle charging stations with hydrogen production achieve costs of 6–13 USD/kg H2 and reduce electricity carbon footprints to 303 gCO2eq/kWh. Al-Dahidi et al. (2025) showed that long short-term memory-convolutional neural network forecasting models reduce LCOE by 4% through improved accuracy. In the work of Shboul et al. (2025b), the authors found that solar dish Stirling engines outperform conventional PV systems with lower LCOE ($0.104 vs. $0.396/kWh) and higher efficiency (27.03% vs. 20.7%).
Finally, applying wind energy resources, Dabar et al. (2022) investigated the green hydrogen potential of five Djiboutian cities, finding an LCOH of 1.79 to 3.38 $/kg. The study was conducted in the central African countries. For fifteen sites spread across five distinct South African provinces, Ayodele and Munda (2019) assessed wind energy's potential and economic viability for hydrogen production. The authors discovered that the cost of producing one kilogram of hydrogen ranged from 39.55 to 1.40 $/kg, with the amount of hydrogen produced annually varying based on the wind turbine size. A study by Douak and Settou (2015) used various wind turbines in Algeria to examine detailed energy generation and green hydrogen production. The outcomes demonstrated that the location and kind of wind turbine significantly impact the production of green hydrogen. The lowest cost of producing hydrogen was found to be 1.21 $/kg. Al-Sharafi et al. (2017) examined the possibilities for producing hydrogen and power using solar and wind energy resources at various sites throughout the Kingdom of Saudi Arabia. Their findings indicated that $43.10/kg was the ideal price for hydrogen. The study by Mostafaeipour et al. (2019) explored wind energy's economic and practical applications in four Iranian cities. They found Ardebil and Namin have the best wind energy resources, with wind power densities of 258.99 W/m2 and 261.68 W/m2, respectively. The study also found that 5 kW and 100 kW wind turbines were the best options for Ardebil in terms of hydrogen and electricity production with a 13- and 5-year payback period.
Materials and methods
This section presents an overview of the method and materials used for the analysis.
Description of study region and climate data
The ECOWAS is a regional organization that includes 15 countries in West Africa, as illustrated in Figure 1. The region is situated between latitudes 4°N and 28°N and longitudes 15°E and 16°W (Makinde et al., 2024). It spans approximately 5.2 million square kilometers (Aikins, 2024), bordering the Atlantic Ocean to the south and the Sahara Desert to the north. The region includes various geographical features, like the Sahel zone, tropical forests, savannas, and coastal plains. The Niger, Senegal, and Volta are among the most notable river systems (Aikins, 2024). The climate of the ECOWAS region is diverse, ranging from tropical along the coast to arid in the north. Most regions experience distinct rainy and dry seasons. Mangroves and rainforests typically characterize the southern regions, while the northern areas are characterized by semi-arid terrain and savannas (Makinde et al., 2024).
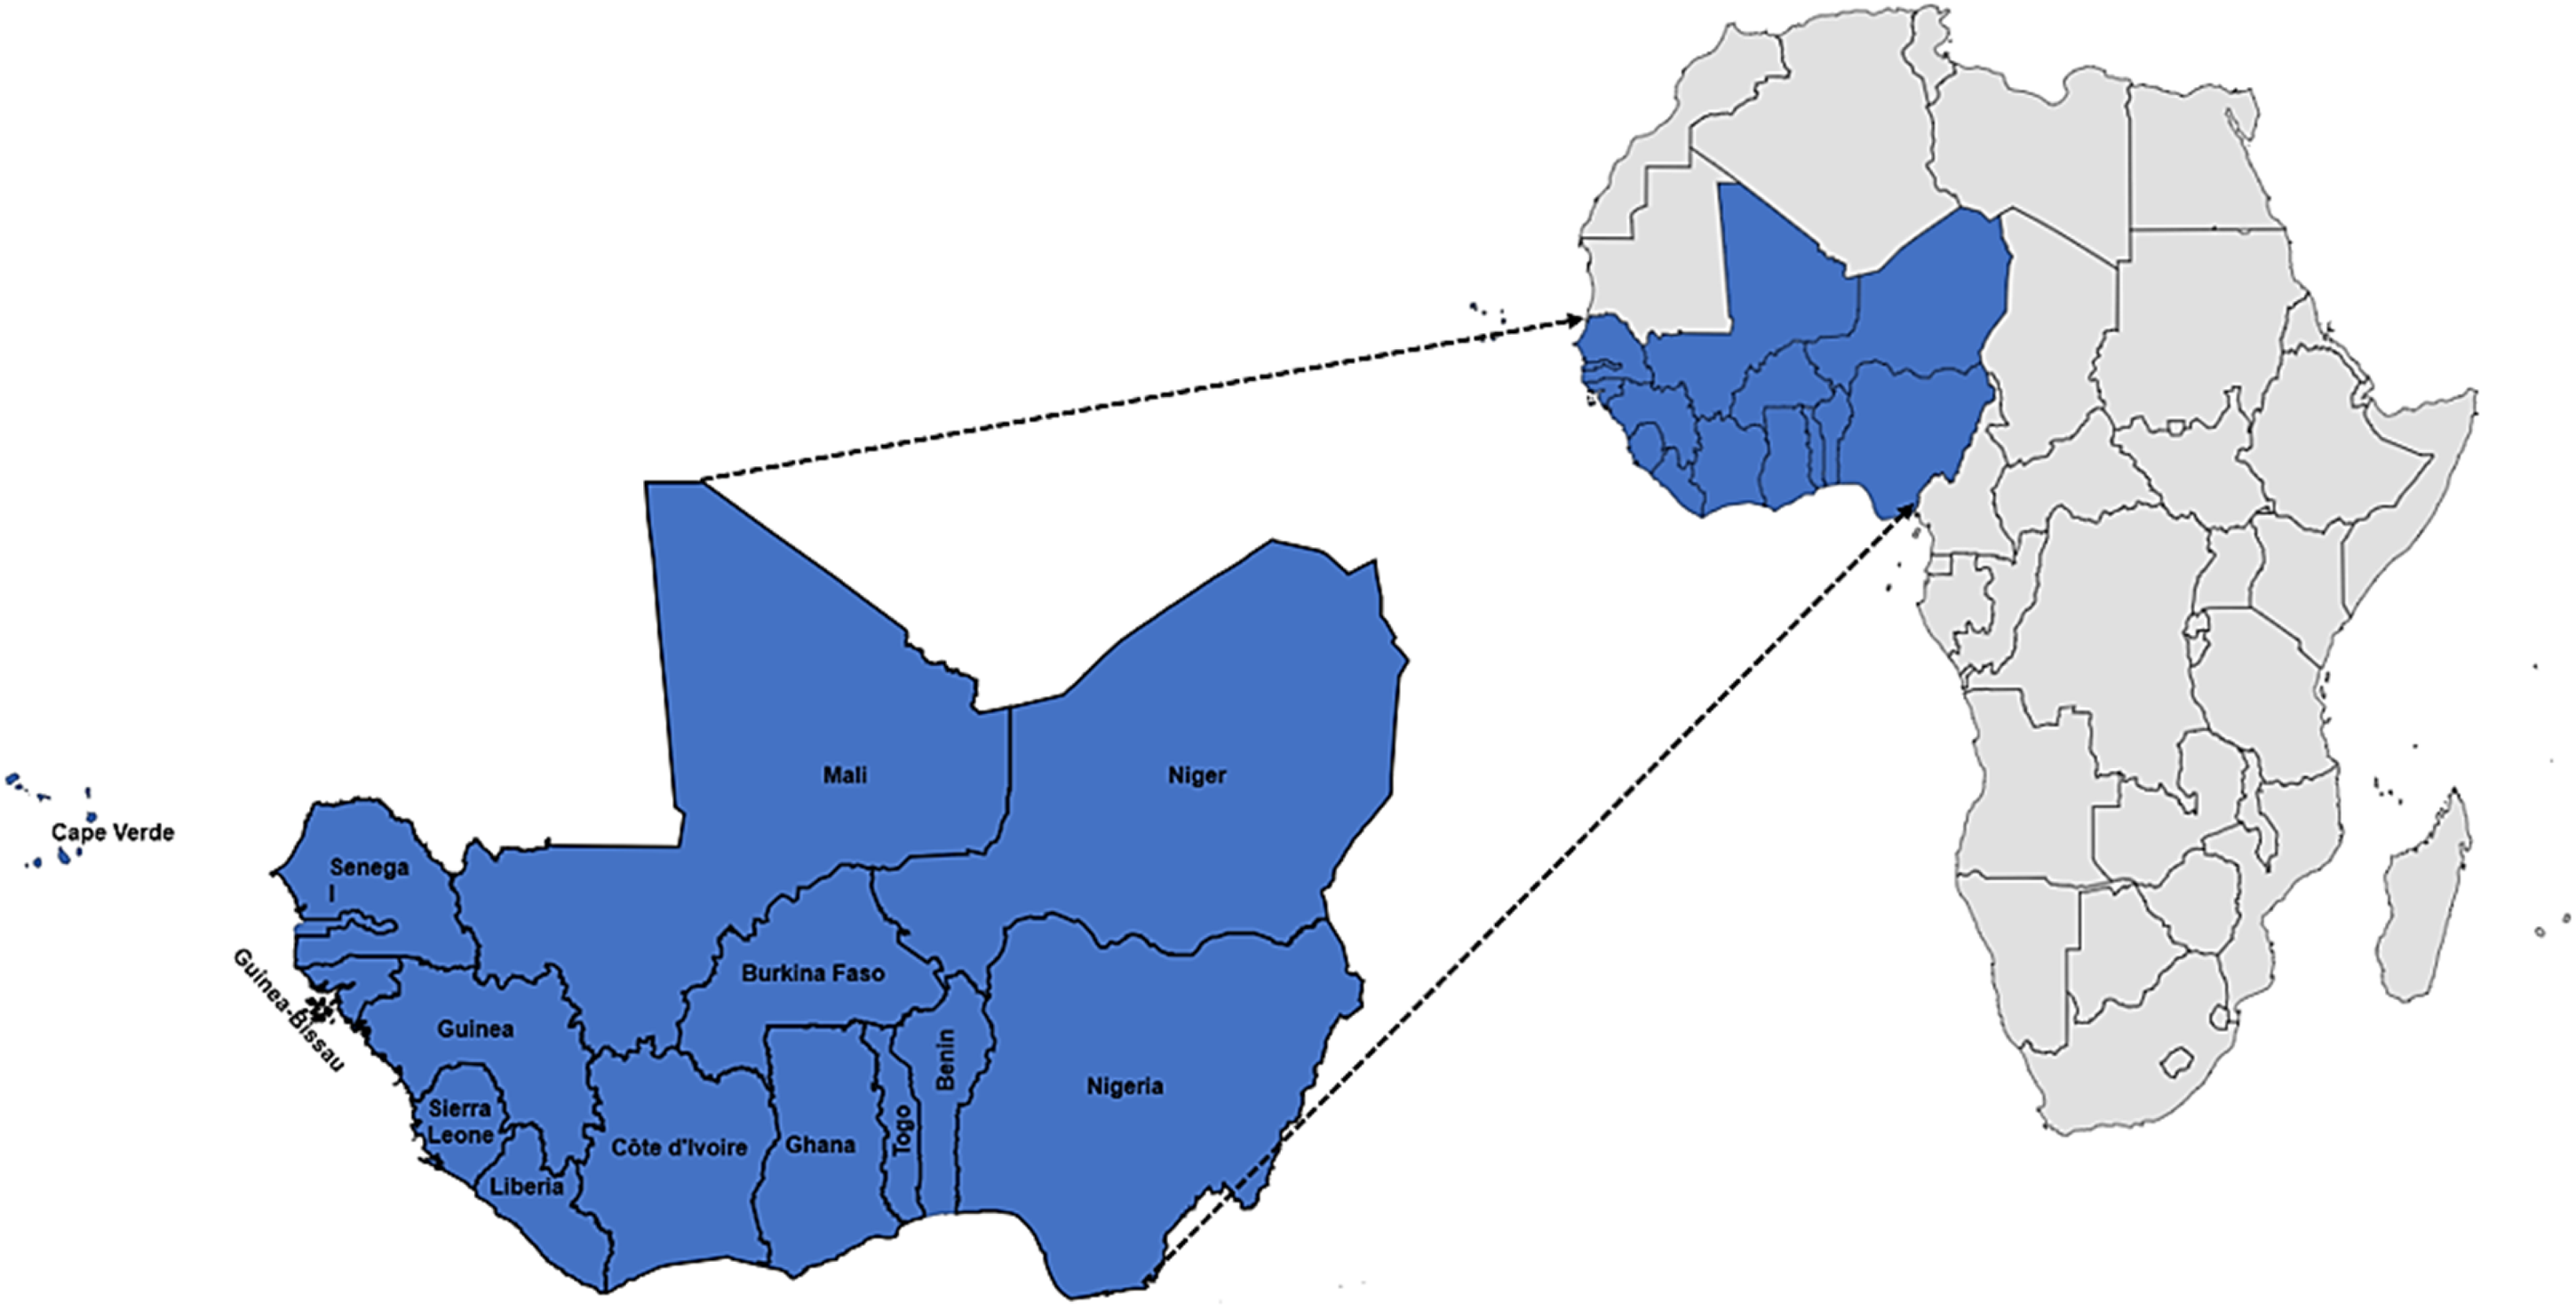
(Left) Map showing countries in the ECOWAS region. (Right) Map of Africa displaying the ECOWAS region.
Figure 2 shows the region's total daily global horizontal irradiance (GHI) and wind speed data at 50 m height. The data was obtained from the Global Solar and Wind Atlas by selecting the country in the database. The GHI data for ECOWAS countries reveals solar energy potential across the region, with values ranging from 4.70 kWh/m2/day in Liberia to 6.42 kWh/m2/day in Niger (Figure 2(a)). The average GHI of about 5.54 kWh/m2/day indicates generally high solar potential throughout West Africa. Countries closer to the Sahara Desert, such as Niger and Mali, show the highest GHI values, likely due to less cloud cover and more consistent sunlight. Coastal countries near the equator, like Liberia and Côte d’Ivoire, show slightly lower values, possibly due to increased cloud cover and precipitation.
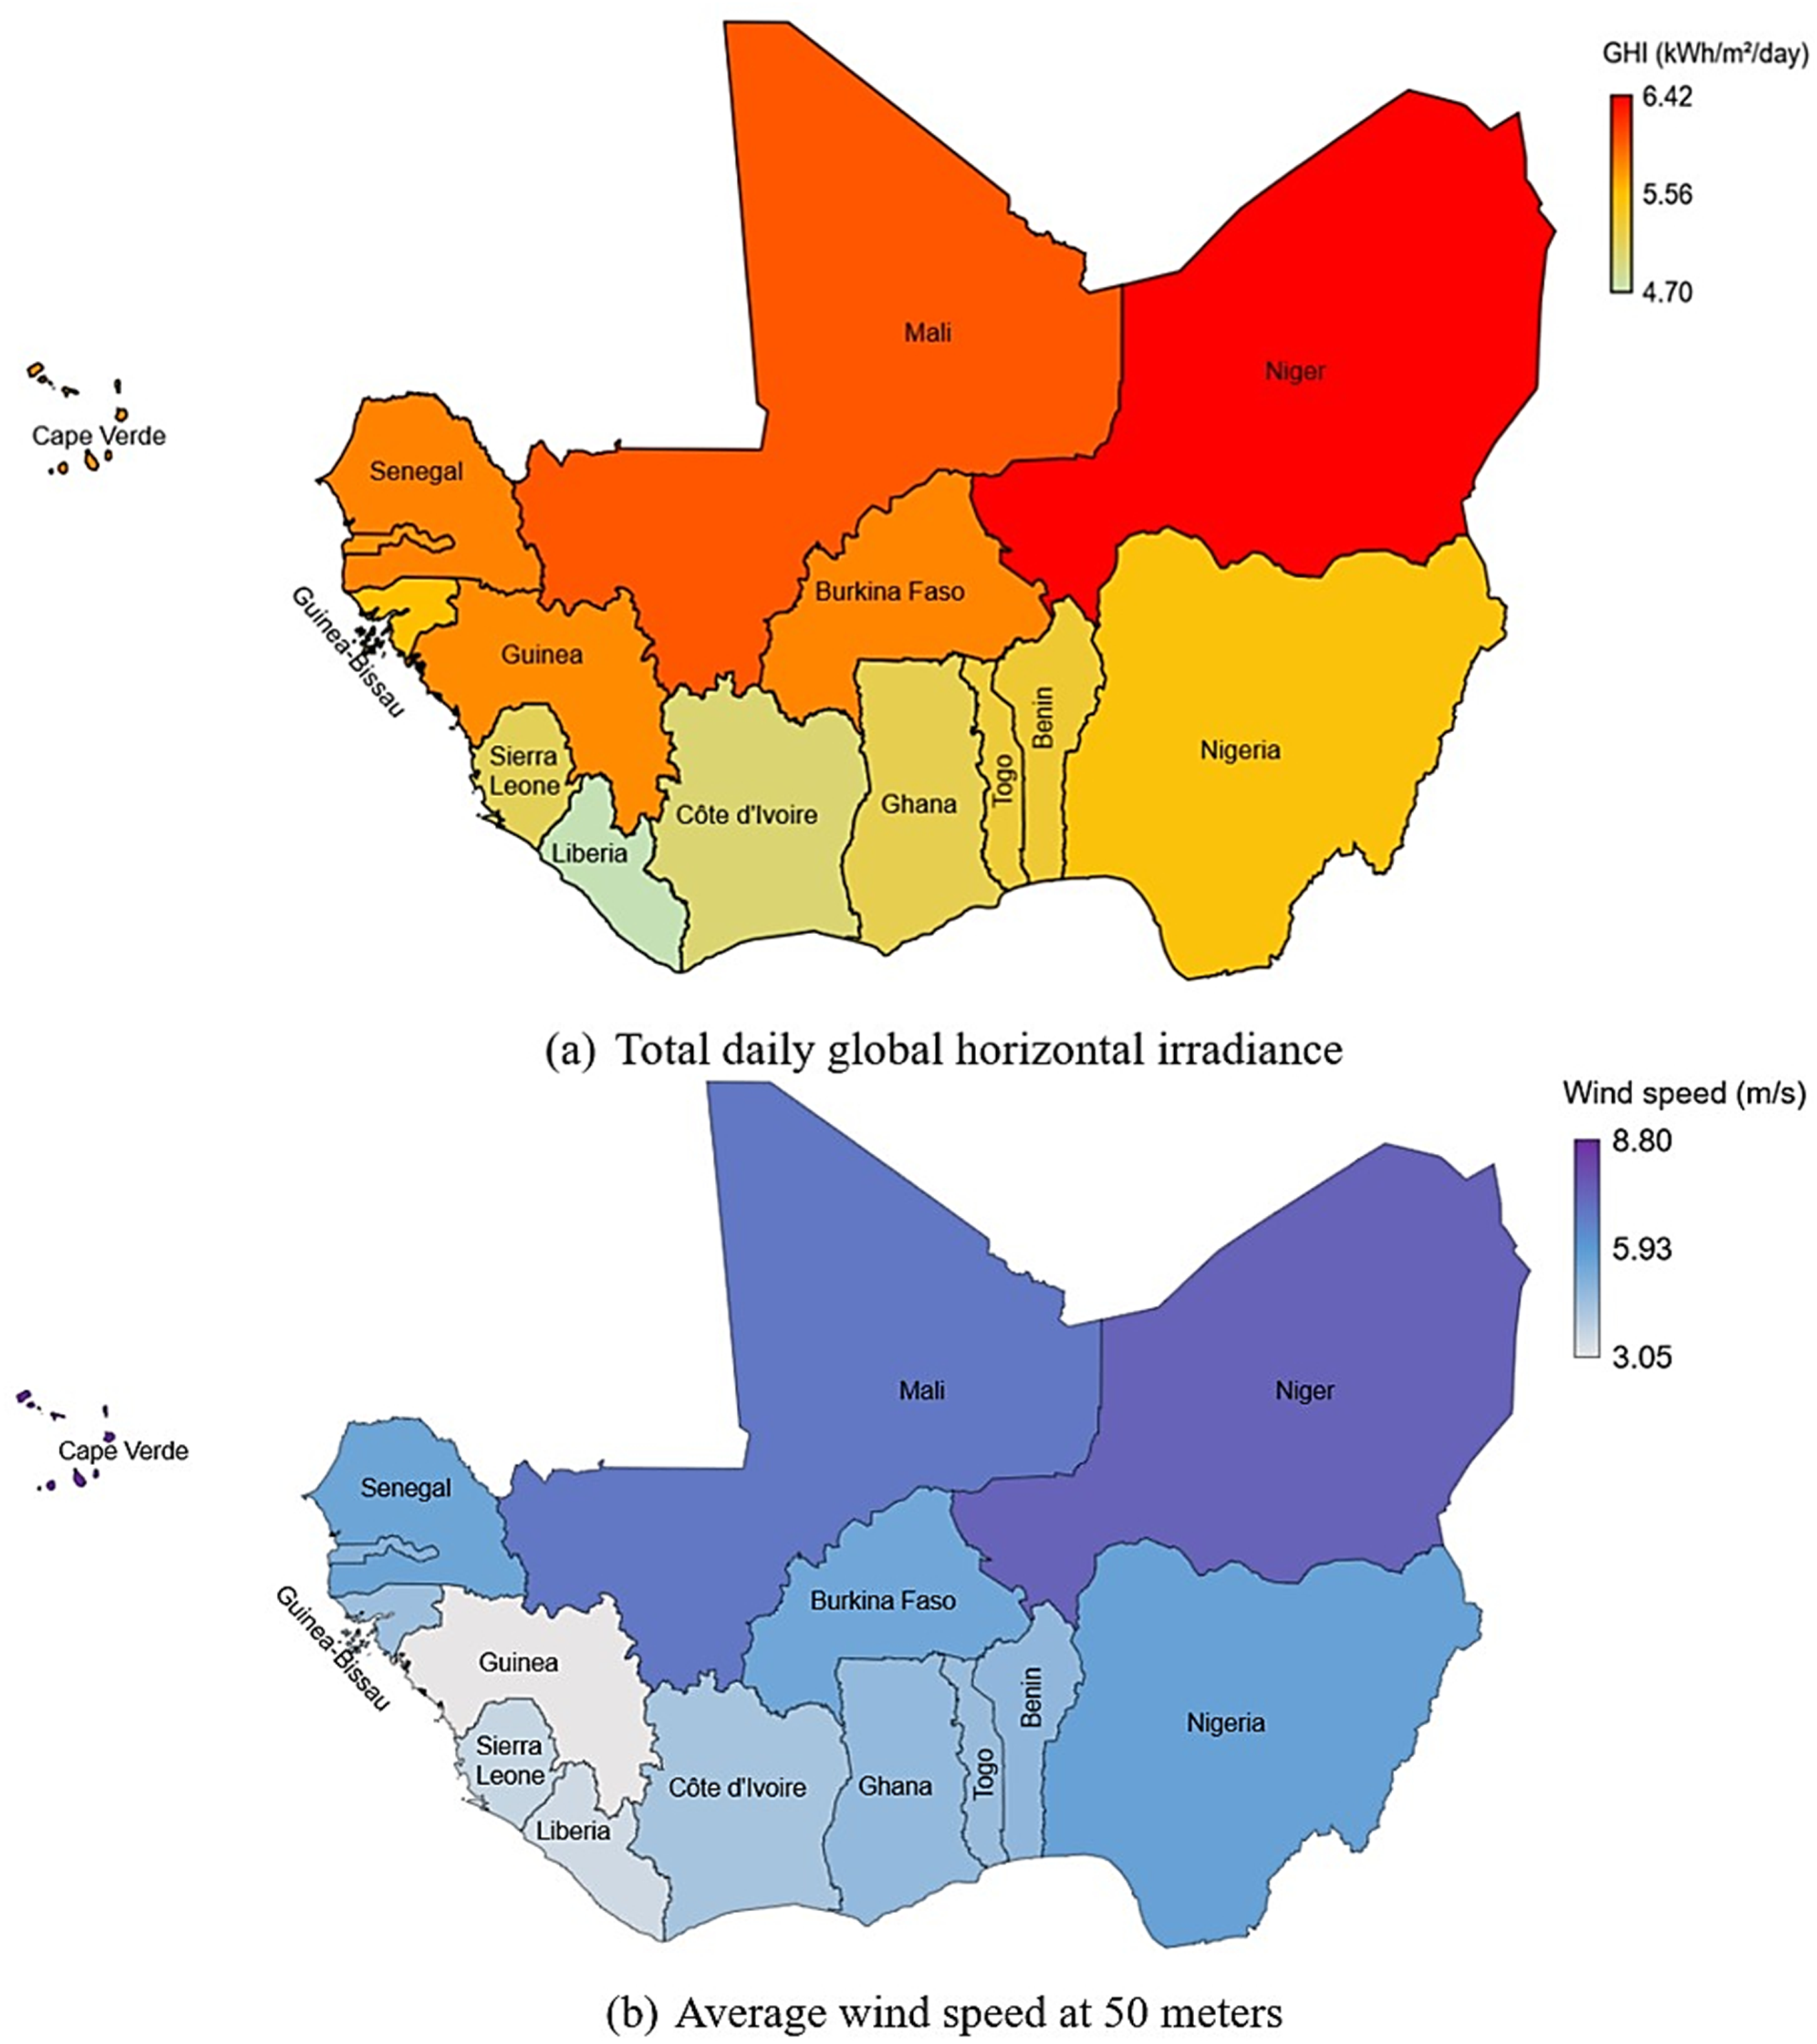
Average daily solar irradiation (Solargis, 2022) and wind speed (DTU Wind Energy and The World Bank Group, 2024) in the ECOWAS region.
The wind speed data at 50 m height for ECOWAS countries shows considerable variation across the region, ranging from 3.05 m/s in Guinea to 8.80 m/s in Cape Verde, as displayed in Figure 2(b). Countries with higher wind speeds, such as Cape Verde, Niger, and Mali, demonstrate substantial potential for wind energy development. The geographic locations of Cape Verde, which benefits from strong Atlantic winds, and Niger and Mali, which have vast expanses of land in the Sahel region, are likely the reasons for the higher wind speeds.
Conversely, countries like Guinea, Liberia, and Sierra Leone show lower wind speeds, which may limit large-scale wind energy projects but could still support small-scale or localized wind power solutions. Most countries fall in a moderate range between 4 and 6 m/s, suggesting potential for wind energy development with careful site selection and technology matching. It is important to note that wind speeds can vary significantly within countries, and this data represents average or characteristic values. Factors such as coastal effects, topography, and seasonal variations are crucial in determining local wind resources (Murthy and Rahi, 2017). Though countries with higher wind speeds may find it easier to implement utility-scale wind farms, those with moderate wind speeds could still benefit from wind energy as part of a diversified renewable energy portfolio, especially when combined with other sources like solar power.
Green hydrogen production system description
Figure 3 illustrates the process for green hydrogen production utilizing solar PV and wind power systems. This integrated system represents a sustainable approach to hydrogen generation, addressing the growing demand for clean energy solutions. The process begins with harnessing renewable energy from solar PV modules and wind turbines. Solar panels capture sunlight and convert it into electricity through the PV effect (Tang et al., 2023), while wind turbines harness the kinetic energy of wind to generate power (Yadav et al., 2023). These renewable sources provide a variable and intermittent power supply, which is then directed to converters. The converters play a crucial role in transforming and conditioning the electrical output from the PV or wind power systems, ensuring it meets the specific requirements of the subsequent stages. This may involve DC-to-DC conversion, DC-to-AC conversion, voltage regulation, and power quality improvements. The electricity converted then flows to the electrolyzer.
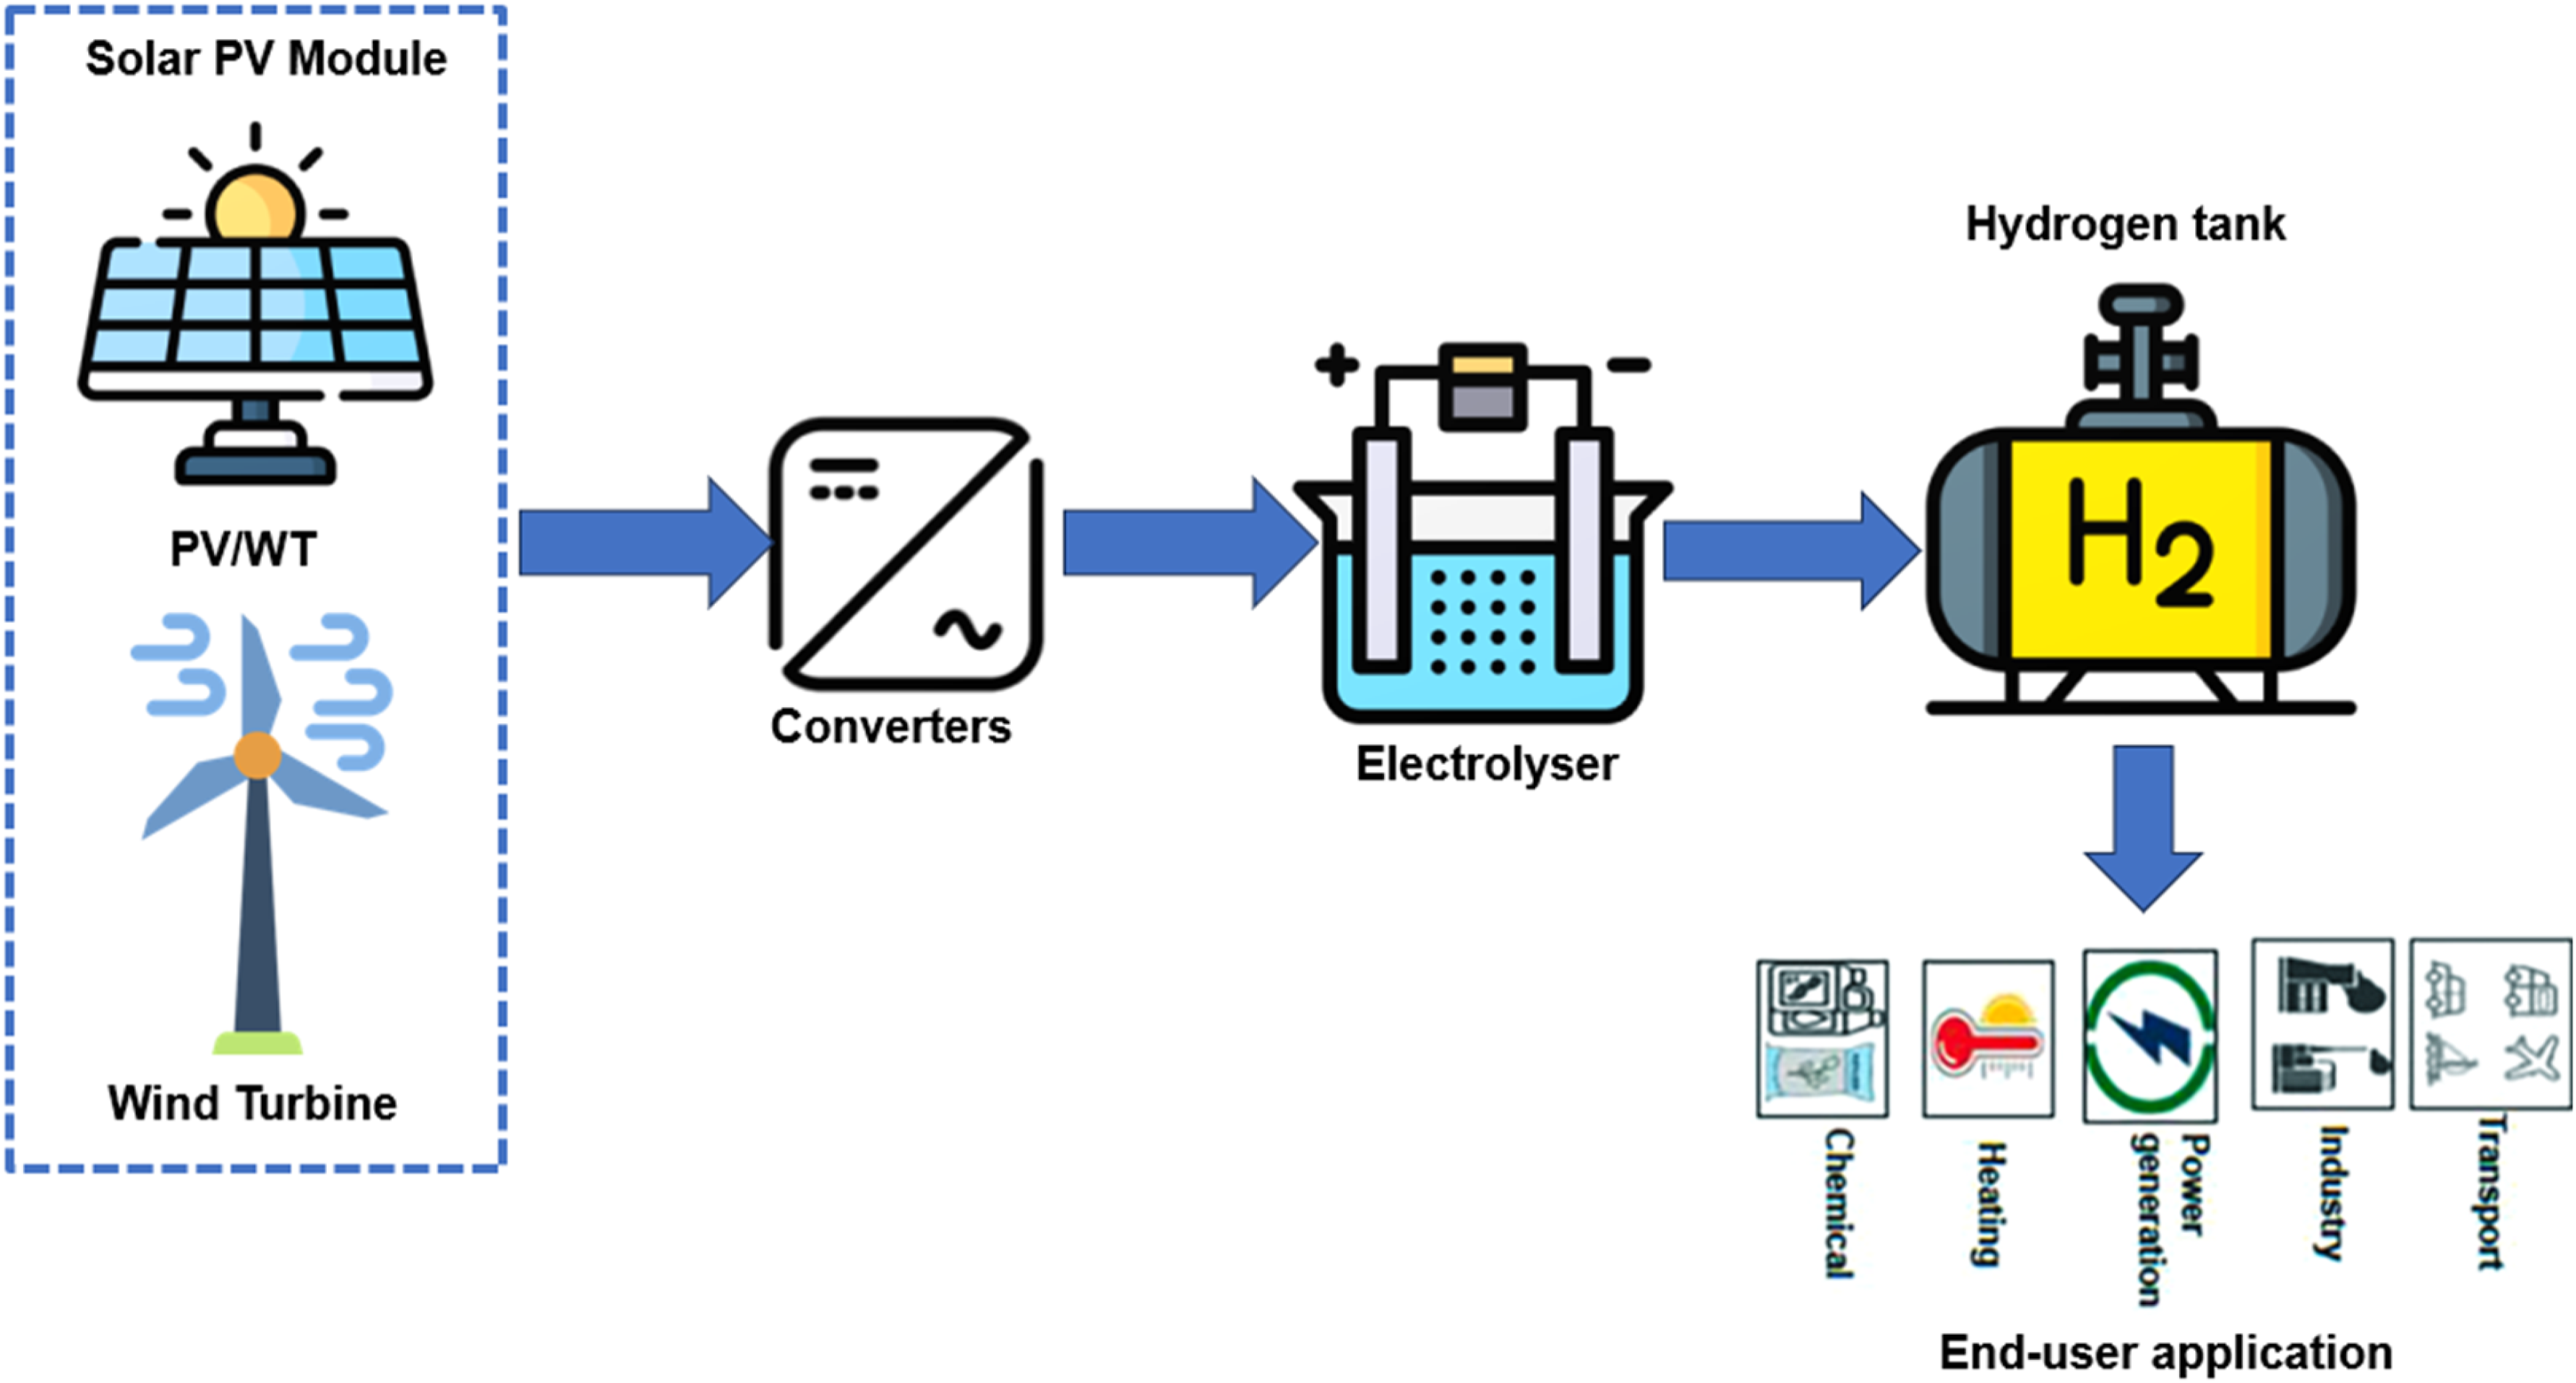
Flowchart of hydrogen production system.
The electrolyzer uses electricity to split water (H2O) into its constituent elements: hydrogen (H2) and oxygen (O2) (El-Shafie, 2023). This electrochemical process, known as electrolysis, typically occurs in a cell containing water and electrolyte, with electrodes applying an electric current to facilitate the separation (Ba et al., 2023). The positively charged anode attracts oxygen, and the negatively charged cathode attracts hydrogen. The hydrogen produced through this method is considered “green” because the entire process is powered by renewable energy sources, resulting in minimal to zero carbon emissions. The newly generated hydrogen is then compressed and stored in a dedicated hydrogen tank, represented in the figure as a large cylindrical vessel labeled “H2.” This storage solution allows for the accumulation of hydrogen, providing a buffer between the production and utilization phases. The ability to store hydrogen efficiently is vital for managing the intermittent nature of renewable energy sources and ensuring a steady supply for various applications.
The final stage of the process, as depicted in the figure, indicates the versatility of green hydrogen through multiple end-user applications. The applications include chemical processes, where hydrogen serves as a feedstock for various industrial syntheses (Mosca et al., 2020); heating, utilizing hydrogen as a clean-burning fuel for residential, commercial, or industrial heating systems (Rosenow, 2022); power generation, employing hydrogen in fuel cells or combustion turbines to produce electricity (Hwang et al., 2023); industrial uses, such as in steel production or as a reducing agent in various manufacturing processes (Glenk and Reichelstein, 2019); and transportation, powering fuel cell vehicles or potentially being used in aviation and maritime sectors (Agyekum et al., 2024).
Governing equations for modeling the green hydrogen production system
This section elaborates on the mathematical equations that form the foundation of the proposed system configuration and methodology. The study utilized widely recognized equations from existing literature to assess the viability of green hydrogen projects in the ECOWAS region under different scenarios. The assumptions and parameters employed in the computational process are explicitly outlined.
Solar PV system
This study suggests a 10-MW solar PV installed capacity for electricity generation for each country in the ECOWAS region. The electricity generated from this proposed capacity is calculated using Equation (1) (Odoi-Yorke et al., 2024):
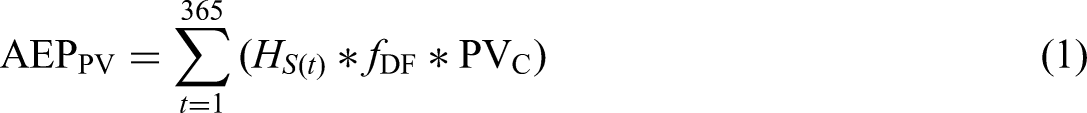

Wind turbine
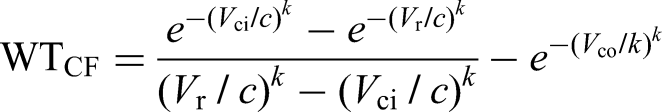
The annual power output from the wind turbine can be calculated as follows (Nasser and Hassan, 2024a):


Controllers
The controller is used to adjust the required power for the electrolyzer (

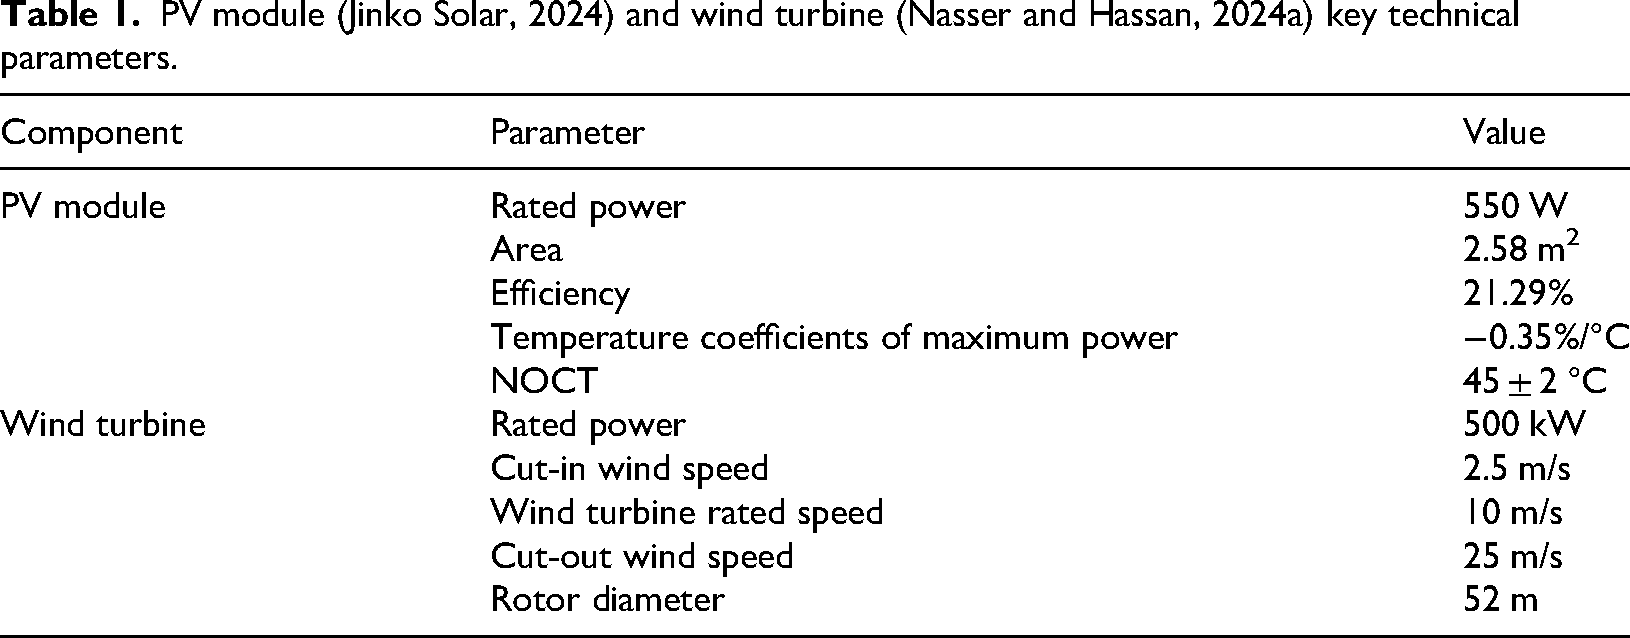
This study assumed a 95% efficiency for AC/DC and DC/DC converters (Nasser and Hassan, 2023). The solar PV module and wind turbine specifications are shown in Table 1.
PV module (Jinko Solar, 2024) and wind turbine (Nasser and Hassan, 2024a) key technical parameters.
Hydrogen production
Figure 3 illustrates the process of hydrogen production using solar PV and wind power systems. The electrical energy generated by the PV and wind turbine powers a proton exchange membrane (PEM) electrolysis unit to split water into hydrogen and oxygen. The PEM technology was chosen for this application due to its durability, high efficiency, and ability to handle fluctuating power inputs typical of renewable energy sources such as solar and wind (Touili et al., 2022). Based on industry standards, the PEM electrolyzer is estimated to consume 52.5 kWh of electricity per kilogram of hydrogen produced, with hydrogen having a higher heating value of 39.4 kWh/kg (Asare-Addo, 2023). The system operates at approximately 75% (Nasser and Hassan, 2024b). These figures are consistent with values reported in multiple scientific studies (Asare-Addo, 2023). Equation (7) is used to calculate the quantity of green hydrogen generated from the PV and wind power systems electrical output (Odoi-Yorke et al., 2024):
Economic analysis
The LCOH is a key metric for assessing the economic feasibility of hydrogen production methods over their operational lifespan (Ding et al., 2024). This comprehensive measure incorporates all expenses, including initial investments, operational costs, financial charges, and raw material expenses. The LCOH provides a unified cost per unit, enabling meaningful comparisons between various hydrogen production techniques such as electrolysis, natural gas reforming, and coal or biomass gasification by distributing these costs across the total hydrogen output. This metric is crucial for decision-makers, investors, and policymakers in determining the most economically viable and sustainable approaches to expand hydrogen production and related infrastructure. The LCOH can be calculated using the following equation (Mensah et al., 2024):
This analysis assumes a 25-year project lifespan and employs a discount rate of 8% for similar studies conducted within the ECOWAS region (Akpahou et al., 2023; Odoi-Yorke et al., 2022, 2024). The PV system costs include $858/kW for capital cost and $9/kW/year for operation and maintenance (Nasser and Hassan, 2024a; Odoi-Yorke et al., 2024). Likewise, the wind turbine capital cost and O&M cost are assumed to be $1000/kW and $55/kW-yr (IRENA, 2023; Odoi-Yorke et al., 2023). Similarly, the converter capital, replacement, and O&M costs are $300/kW, $300/kW, and $6/kW-yr (Afonaa-Mensah et al., 2024). Correspondingly, PV, wind, and converter lifespans are 25 years, 20 years, and 10 years, respectively (Nasser and Hassan, 2024a).
Furthermore, the electrolyzer investment cost (
The electrolyzer's capital is calculated based on its hydrogen production capacity. Thus, the electrolyzer's capital cost 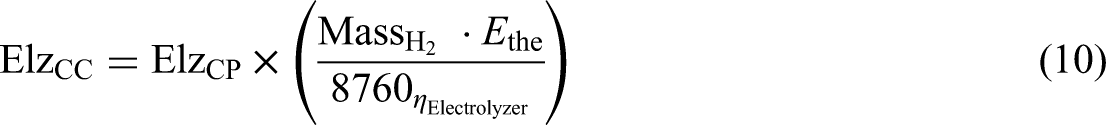
Carbon dioxide emissions analysis
This section estimates CO2 emissions’ reductions from using PV systems and wind turbines in electricity production. Equation (11) is employed to compute the reduction in CO2 emissions (Gado et al., 2024):
Sensitivity test
In this study, a sensitivity test is conducted to assess the impact of key variables on the LCOH. The objective is to determine the effects of these parameters on the LCOH by carefully adjusting them within their defined ranges. This analysis evaluates the economic viability of the hydrogen production system under varying technical and financial conditions by examining three key variables: degradation rate, discount rate, and electrolyzer efficiency. Table 2 presents the range of values considered for each variable. The degradation rate, which accounts for the annual system efficiency reduction, varied from 0% to 10% in 2% increments. This range includes optimistic scenarios with minimal degradation and more conservative estimates with higher degradation rates. In addition, the discount rate, a key financial parameter that indicates the time value of money and project risk, was examined across a range of 2% to 12% in 2% increments. This span covers low-risk scenarios (lower discount rates) to higher-risk or opportunity-cost situations (higher discount rates). Furthermore, the electrolyzer efficiency ranges from 45% to 95%, with incremental steps of 10%. Electrolyzer efficiency varies due to differences in technology type (alkaline, PEM, solid oxide), operating temperature, system integration, and scale. Lower efficiencies (around 45%) reflect older or less optimized systems and higher efficiencies (up to 95%) are achievable in advanced or high-temperature systems with effective heat and energy recovery. The selected range captures realistic variations in commercial and emerging electrolyzer technologies, allowing assessment of their impact on system performance and economics.
Variables and ranges for sensitivity test.
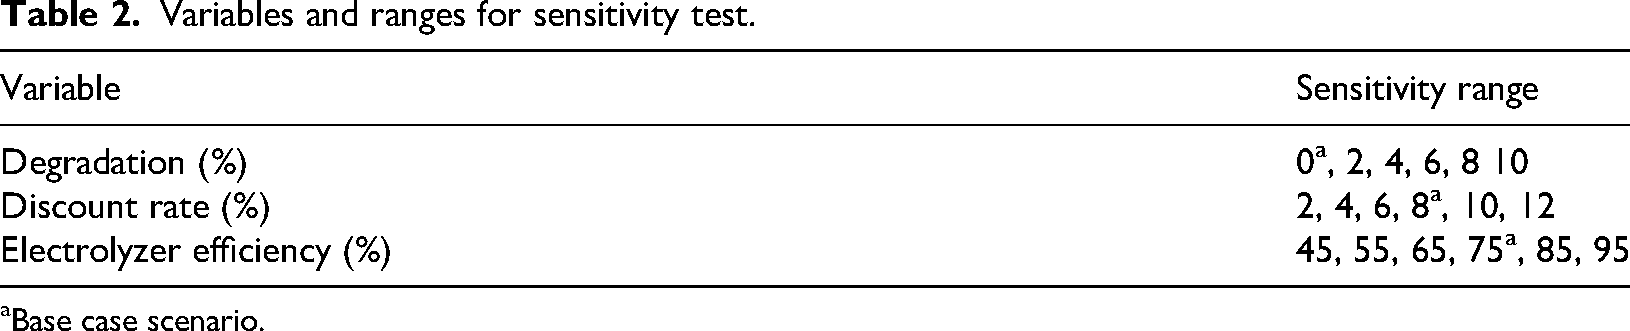
Base case scenario.
Results and discussion
This section presents the results and comprehensively discusses their implications. Three critical aspects were analyzed: production capacity, costs, and emission mitigation. The results are visualized using a series of maps that show the spatial distribution of these factors among the ECOWAS nations.
Electricity production and power density
The solar PV and wind power systems’ electricity production per year are shown in Figure 4. The results show a fluctuating renewable energy production potential in the region. This highlights significant differences between the two power systems. It can be observed that the PV system electricity production ranges from 12.85 GWh in Liberia to 17.57 GWh in Niger. This variation might be due to geographic and climatic factors, such as solar irradiance and sunshine hours, which differ across the region. The results indicate that Niger leads PV electricity production, which could be attributed to its vast deserts and high solar irradiance. On the other hand, Liberia's lower output can be attributed to its more tropical climate with higher cloud cover, which reduces the efficiency of PV systems. In addition, Burkina Faso (15.93 GWh) and Cape Verde (15.80 GWh) also show high PV electricity production levels. Ghana and Côte d’Ivoire, with PV productions of 14.16 GWh and 13.72 GWh, respectively, have moderate outputs, which could be improved with better solar panel technology and optimized installations.
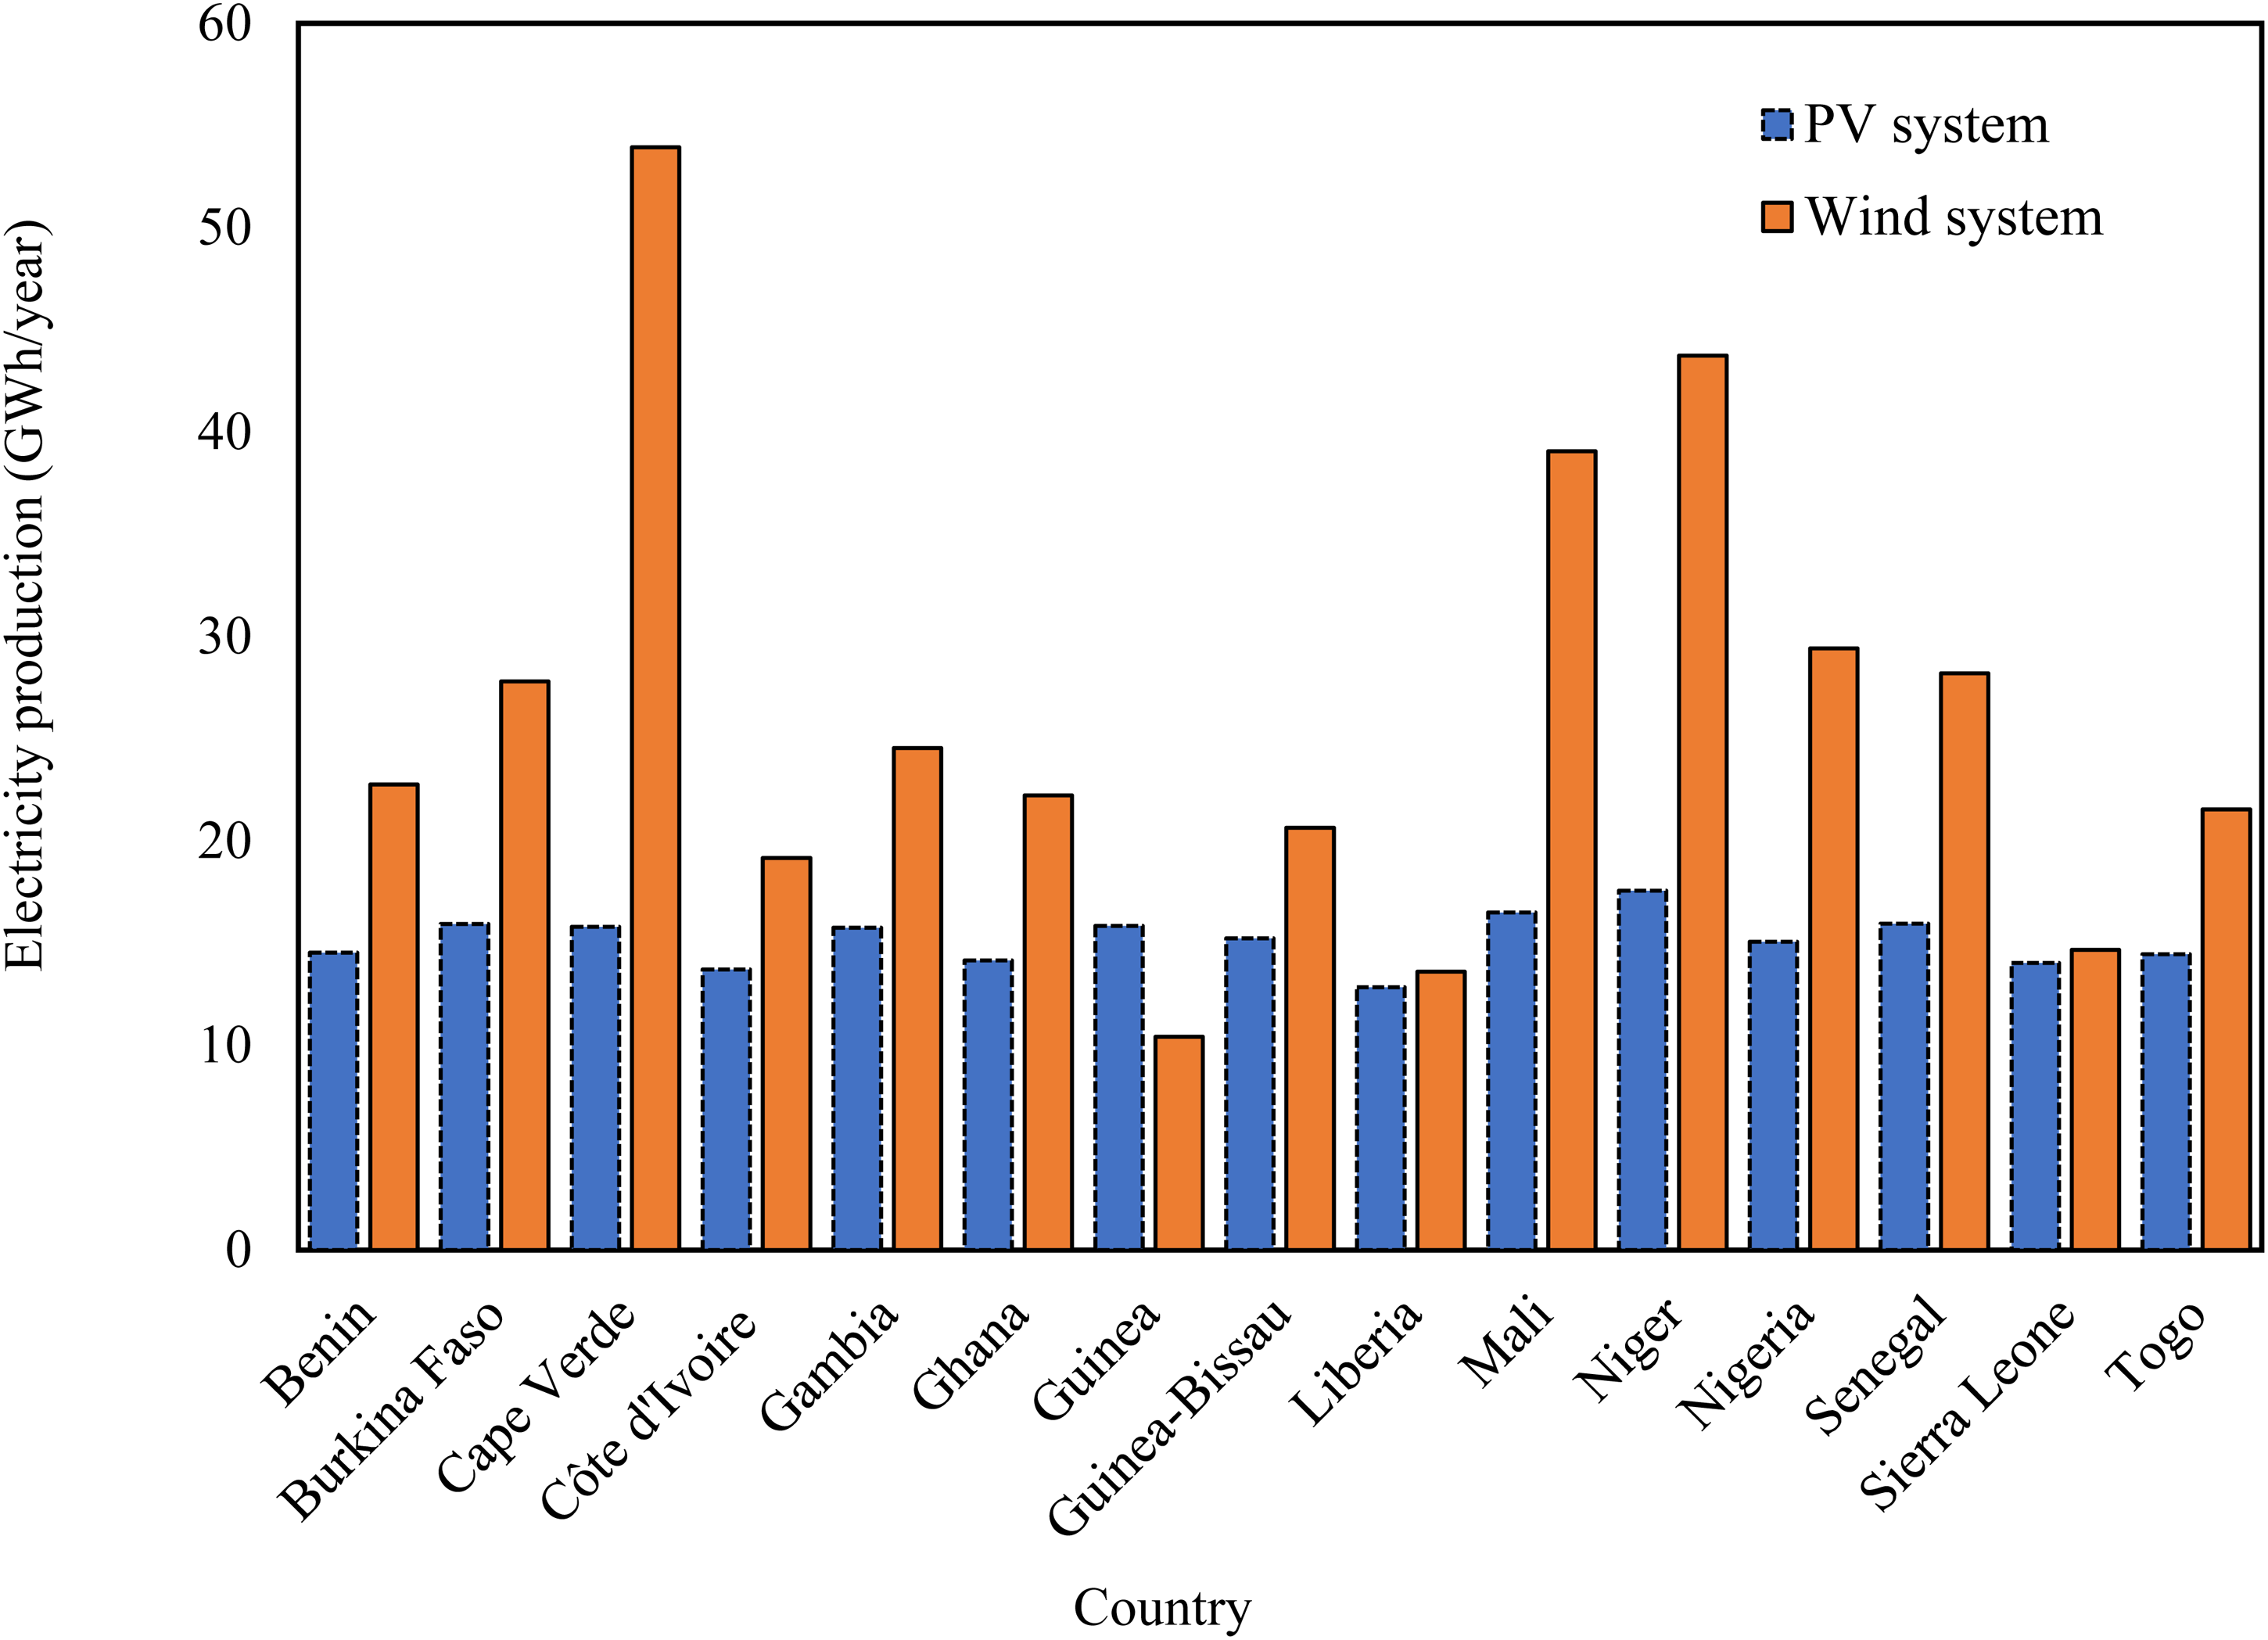
Yearly electricity generation in the studied ECOWAS nations.
In the context of wind power systems, Cape Verde recorded the highest annual electricity production of 53.92 GWh. This is higher than the other countries, indicating that Cape Verde has particularly advantageous wind conditions, such as consistent and strong winds, making wind energy a more dominant and reliable renewable energy source. Also, Niger and Mali recorded high wind energy potentials of 43.73 GWh and 39.07 GWh, respectively. These results demonstrate that these countries have favorable wind speeds that can be harnessed effectively with appropriate wind power infrastructure. In contrast, Guinea recorded the lowest wind electricity production at 10.43 GWh, indicating that wind conditions in Guinea are less favorable than in other countries. This points out the need for Guinea to accelerate its efforts to develop solar energy or investigate alternative renewable energy sources to meet its energy needs. In addition, Liberia and Sierra Leone recorded comparatively low wind energy potentials of 13.64 GWh and 14.67 GWh, respectively, suggesting that wind energy may not be the most efficient renewable resource for these countries.
The results suggest that some countries have a balanced potential for PV and wind energy, while others have a distinct advantage. For example, Nigeria has a high PV production but a relatively moderate wind production, suggesting a more substantial reliance on solar energy. In contrast, Cape Verde has high wind production, making wind energy the more favorable option. The figure shows that countries like Mali and Niger have potential for both PV and wind energy. The implication is that a hybrid approach could be the most effective strategy for maximizing renewable energy production. This dual potential can provide a stable and reliable energy supply, reducing reliance on a single source and mitigating the impacts of variability in weather conditions. Furthermore, the moderate PV and wind energy productions in countries like Nigeria and Burkina Faso indicate a balanced potential for both energy sources. Nigeria can capitalize on that balance by developing a diverse renewable energy mix that will meet the country's increasing energy demands, thereby improving energy security and sustainability.
Figure 5 presents the power densities of PV and wind power plants across various West African countries. Power density is a vital metric in evaluating the efficiency and feasibility of renewable energy sources in different regions. It indicates the amount of power generated per unit area, directly impacting the energy projects’ land use and cost-effectiveness (Bolinger and Bolinger, 2022). The result shows that PV power densities range from 274.05 kWh/m2 in Liberia to 374.48 kWh/m2 in Niger, with Niger, Mali, and Burkina Faso recording particularly high values, indicative of their strong potential for solar energy projects due to high solar irradiance. Conversely, Liberia's low PV density suggests less solar energy feasibility, likely due to higher cloud cover and rainfall.
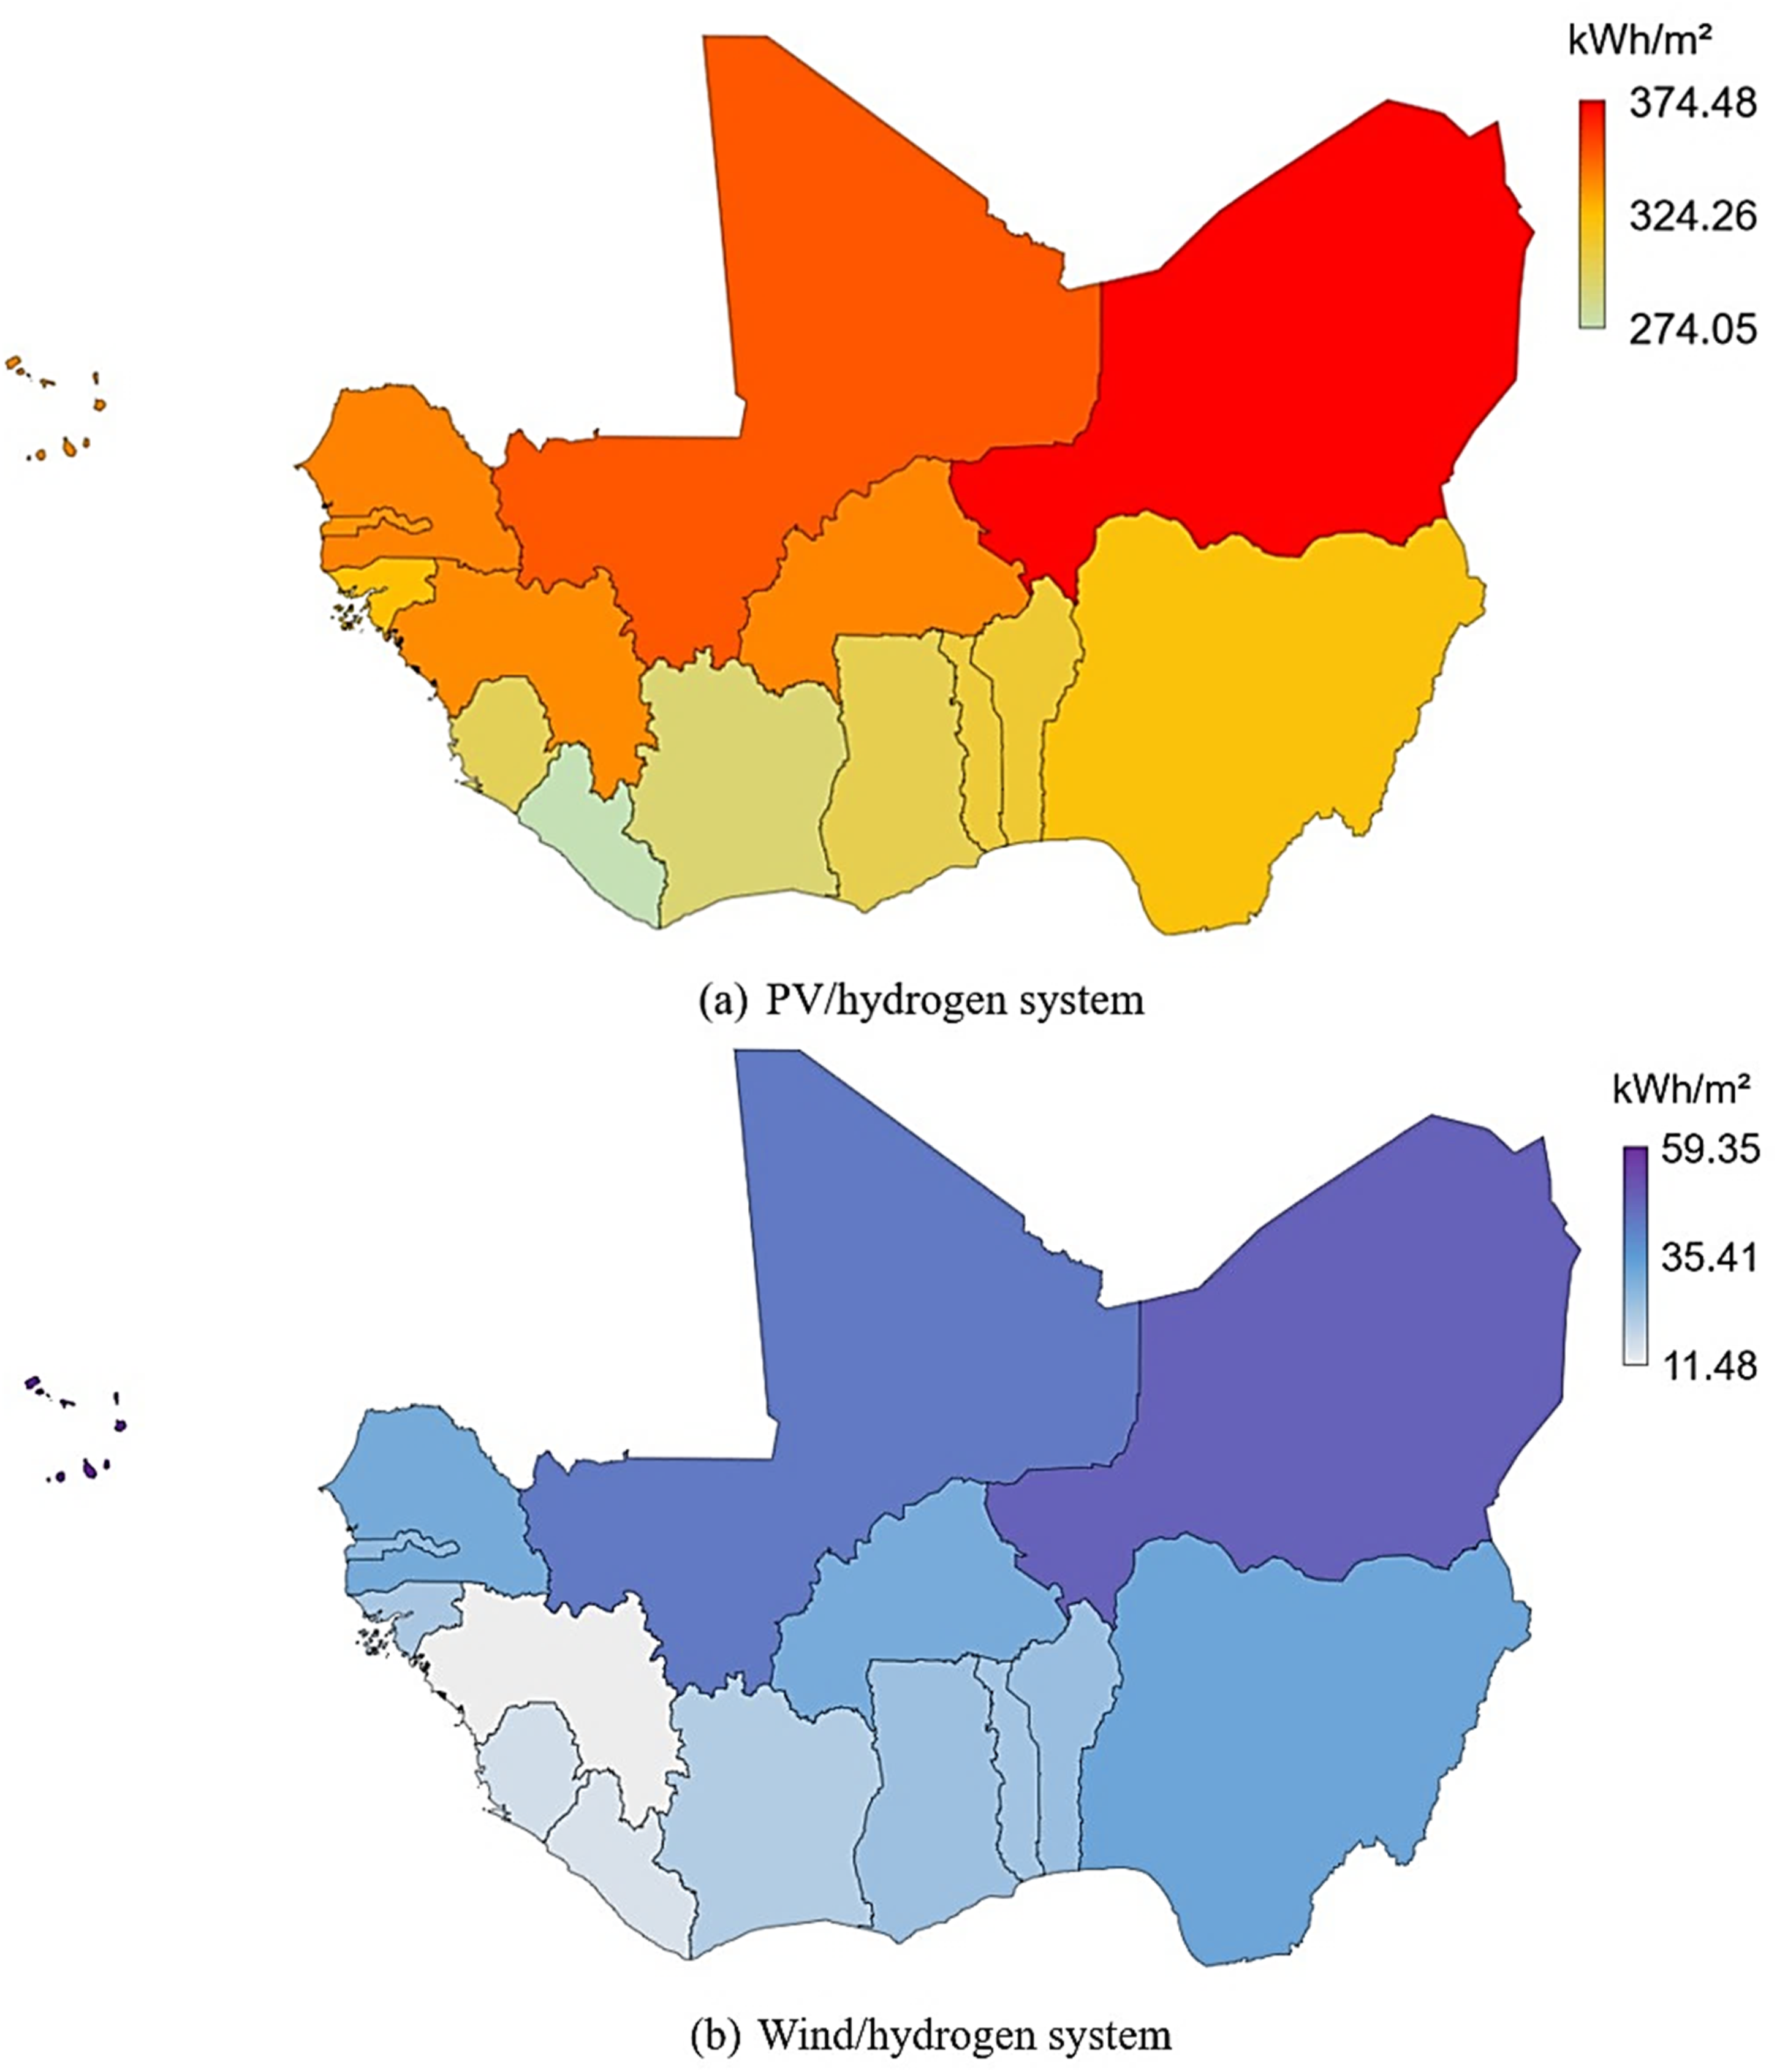
Electricity produced annually for each square meter.
Wind power densities show more significant variability, from 11.48 kWh/m2 in Guinea to 59.35 kWh/m2 in Cape Verde, where the island's geography and favorable wind conditions make it ideal for wind energy. Niger and Mali also recorded high wind densities. This demonstrates that inland areas in the Sahel region are suitable for wind projects due to consistent trade winds. The comparative analysis emphasizes Niger's versatility, as it has high PV and wind densities. Contrary to this, Cape Verde's excellent wind density implies that wind energy needs to be prioritized. Guinea's high PV but low wind density indicates a clear preference for solar projects. It is worth mentioning that these findings are vital for optimizing resource allocation, guiding policy and planning, and enhancing economic impact through efficient energy production. As seen, PV systems produce more energy than wind systems in this region for a given area. This is because solar panels can be packed closely together, utilizing most of the land area they occupy. On the other hand, wind turbines require significant spacing between them to avoid interfering with each other's wind flow, resulting in lower power output per unit of land area. The region is likely to have high solar irradiance, favoring PV systems. Wind resources may be less consistent or strong in this area than solar resources. Although PV systems have higher power density, wind systems might still generate significant total power if deployed over larger areas. The choice between wind and solar would depend on available land, local resources, and economic considerations.
Hydrogen production density and cost density
The estimated annual hydrogen production density (kg/m2) from each power system is shown in Figure 6. It is worth noting that hydrogen production density is vital in evaluating the potential for renewable energy development, specifically in hydrogen production, a key player in the transition to sustainable energy systems. The comparison across these nations highlights variations influenced by geographic and climatic factors. Niger stands out with the highest production density at 6.76 kg/m2, as shown in Figure 6(a). This indicates that Niger has a favorable environment for solar energy capture, likely due to its high solar irradiance and extensive sunlight hours. Mali follows closely with 6.36 kg/m2, suggesting similarly optimal PV/hydrogen production conditions. Other notable countries include Burkina Faso and Senegal, with 6.14 kg/m2, and Guinea, with 6.10 kg/m2, indicating a robust potential for PV/hydrogen production in these regions. Cape Verde also has a high PV/hydrogen production density of 6.09 kg/m2 (Figure 6(a)). Despite its smaller land area than continental countries, its geographic position and climate make it a leading country for solar energy projects. Gambia (6.07 kg/m²) and Guinea-Bissau (5.87 kg/m2) also show significant potential. With substantial economic influence in the region, Nigeria exhibits a moderate production density of 5.80 kg/m2. Liberia recorded the lowest PV/hydrogen production density at 4.95 kg/m2, which could be attributed to higher cloud cover or less optimal solar conditions. Côte d’Ivoire (5.28 kg/m2) and Sierra Leone (5.41 kg/m2) also recorded lower hydrogen production density, indicating that solar potential may not be as high as in other West African countries.
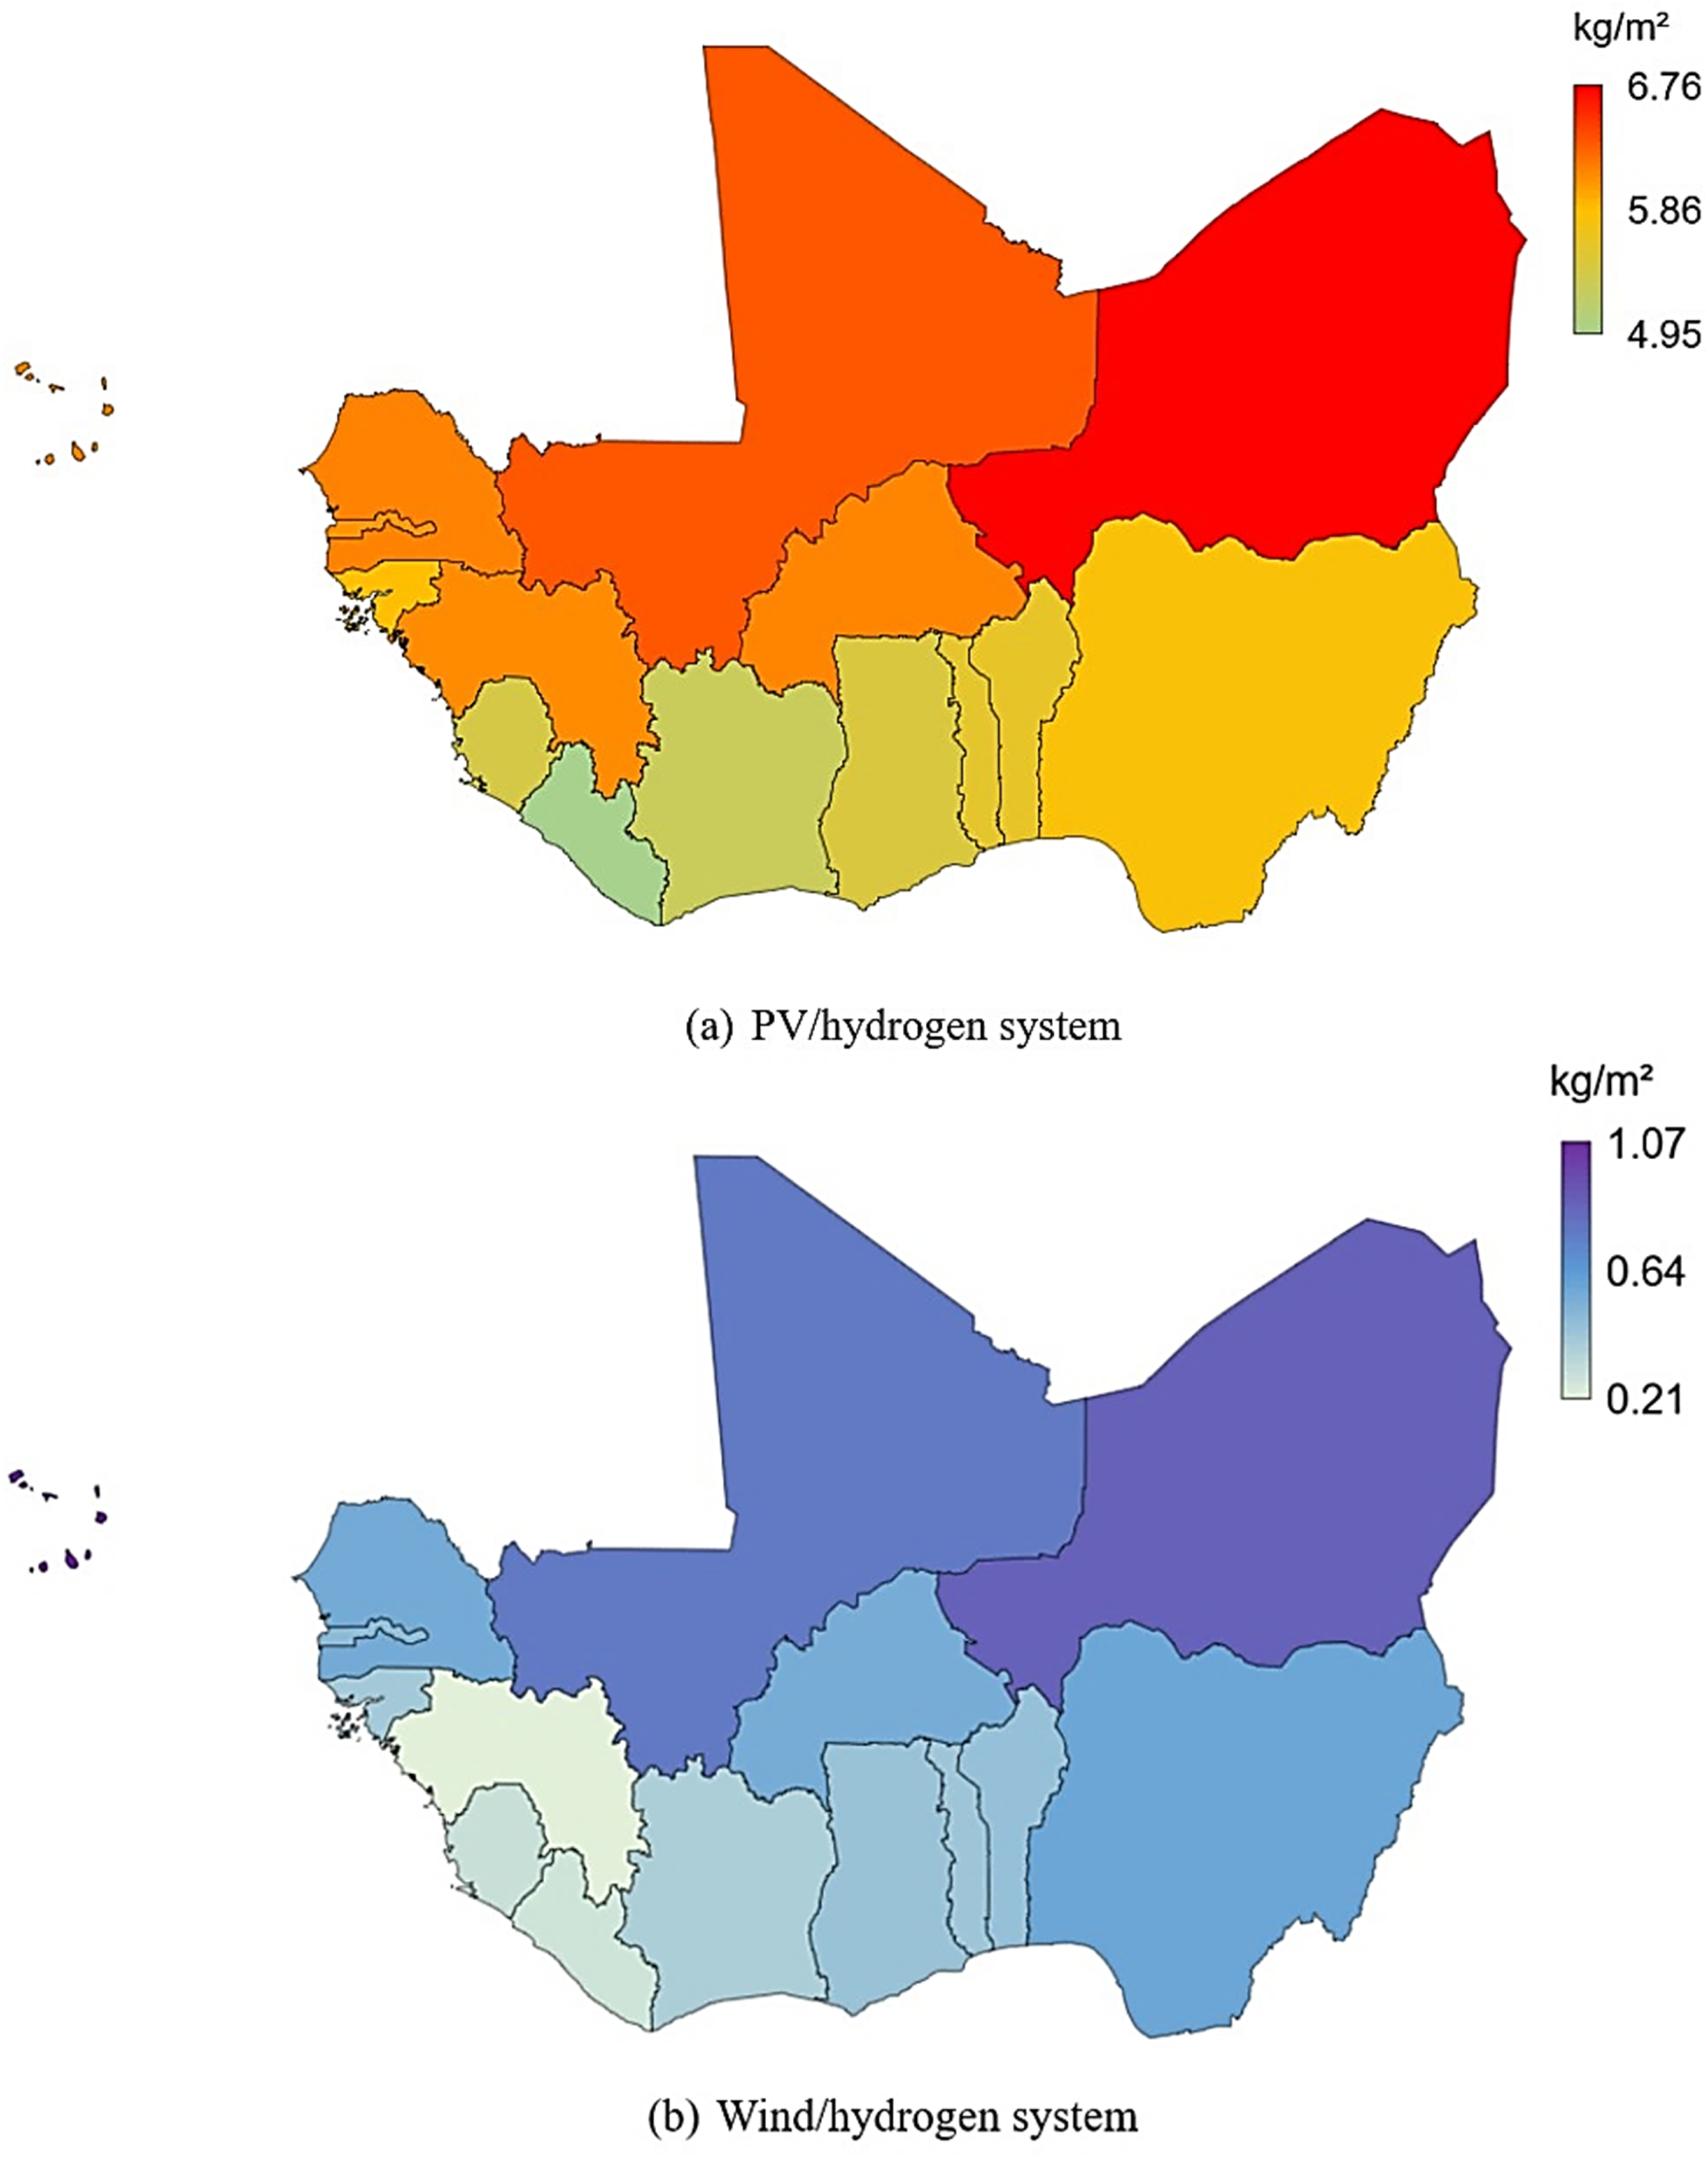
Hydrogen production density in ECOWAS nations.
However, Figure 6(b) displays a different pattern. Cape Verde has the highest hydrogen production density of 1.07 kg/m2. This high value might be due to the archipelago's favorable wind conditions, which are frequently more consistent and stronger than in mainland areas. Niger (0.87 kg/m2) and Mali (0.78 kg/m2) also show strong potential for wind/hydrogen production. This attests to the fact that these countries could benefit from solar PV and wind power systems. Burkina Faso (0.55 kg/m2) and Senegal (0.56 kg/m2) also have moderate wind potentials, which could complement their high solar capacities. Guinea recorded the lowest wind/hydrogen production density of 0.21 kg/m2. Liberia (0.27 kg/m2), Sierra Leone (0.29 kg/m2), and Côte d’Ivoire (0.38 kg/m2) also show lower wind potential, which suggests that these countries may need to focus more on solar resources for hydrogen production.
Based on these findings, Niger, Mali, and Cape Verde, which recorded high potential for PV and wind hydrogen production, could prioritize establishing hybrid renewable energy systems to maximize hydrogen output. This could bolster energy security, reduce dependency on fossil fuels, and create new economic opportunities in the green energy sector. Furthermore, comprehending these regional variations is vital for international investors and development organizations seeking to support sustainable energy projects.
Figure 7 displays the LCOH production. It can be seen in Figure 7(a) that Niger stands out with the lowest LCOH at $3.23/kg, indicating strong potential due to favorable climatic conditions. Mali follows closely with $3.41/kg, while Burkina Faso and Senegal, both at $3.51/kg, also show promising low costs. Liberia had the highest LCOH at $4.26/kg, likely due to lower solar irradiance, with Côte d’Ivoire ($4.02/kg) and Sierra Leone ($3.93/kg) also facing higher production costs. Mid-range LCOH countries like Benin ($3.81/kg), Togo ($3.83/kg), and Ghana ($3.91/kg) imply a balance of favorable and challenging factors.
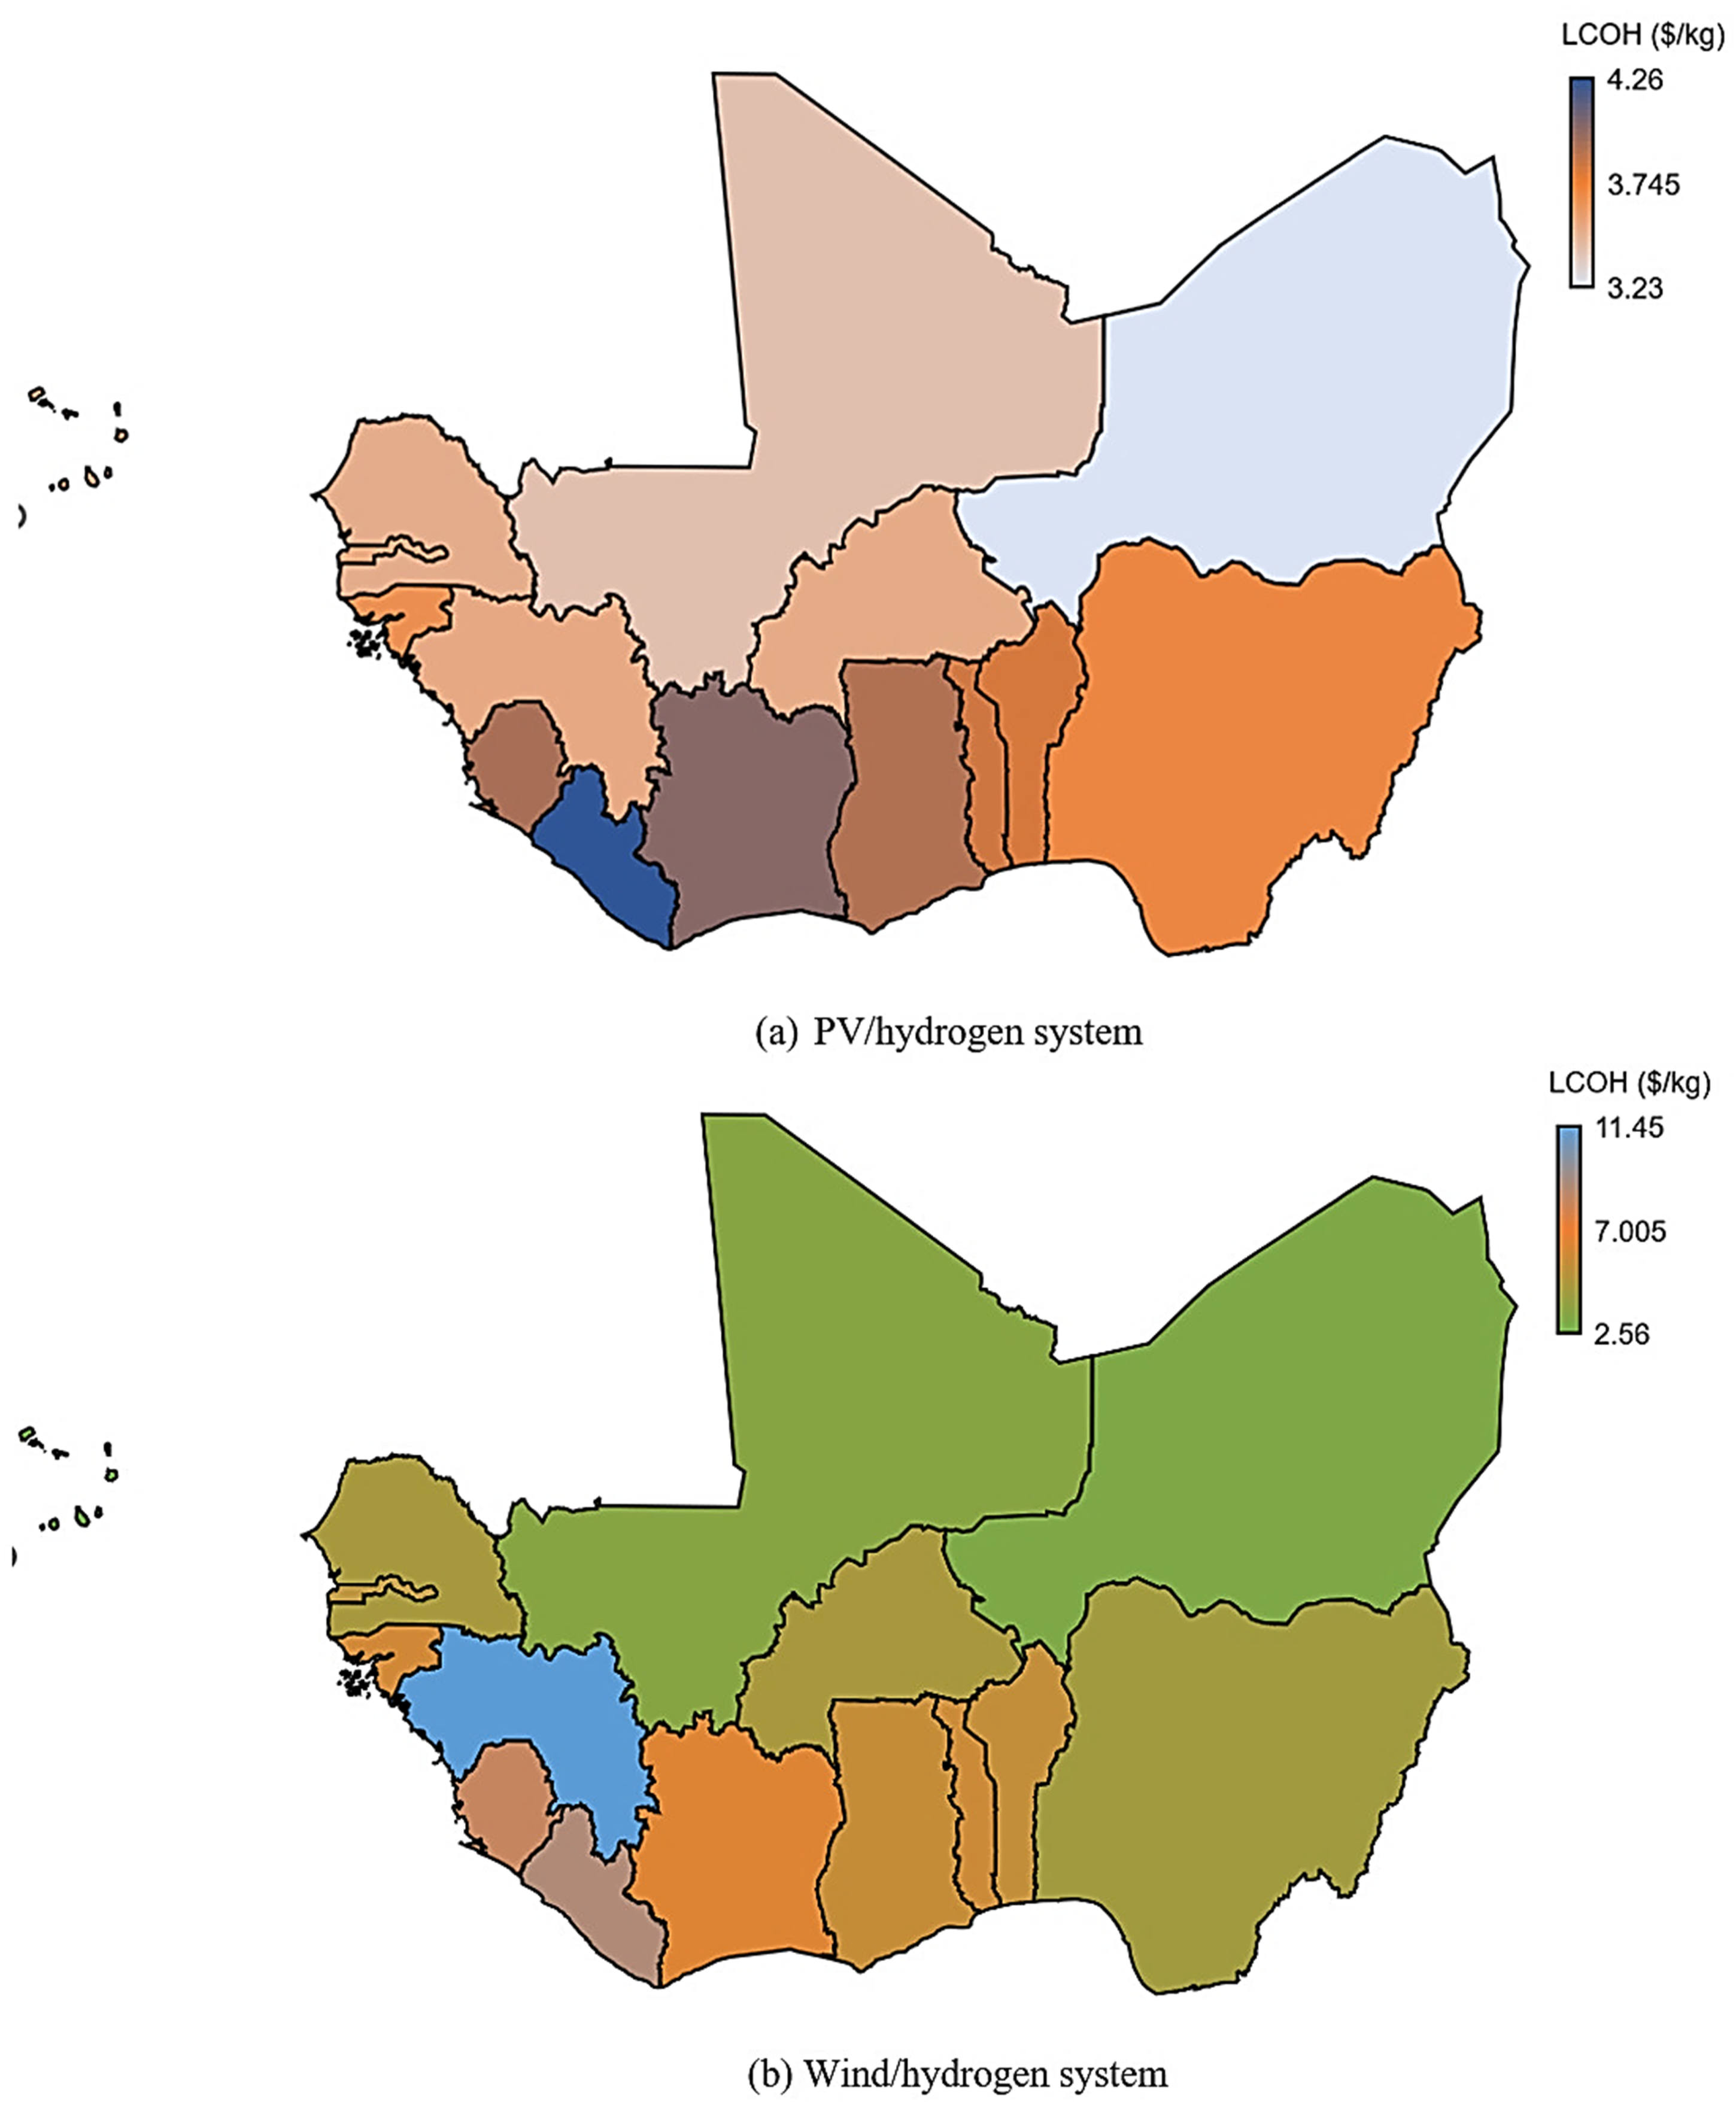
LCOH in ECOWAS region.
On the other hand, Cape Verde recorded the lowest LCOH at $2.56/kg, benefiting from strong wind resources, followed by Niger ($3.05/kg) and Mali ($3.37/kg), as displayed in Figure 7(b). Conversely, Guinea presents a starkly high LCOH at $11.45/kg, indicating significant hurdles, possibly due to poor wind resources, with Liberia ($8.87/kg) and Sierra Leone ($8.26/kg) also facing substantial barriers. Mid-range LCOH countries for wind systems include Nigeria ($4.33/kg), Senegal ($4.50/kg), and Burkina Faso ($4.56/kg), indicating balanced potential. Generally, PV/hydrogen systems show lower LCOH than wind systems, suggesting greater viability of solar energy in the region, except for Cape Verde, where wind is significantly cheaper. Country-specific observations reveal Cape Verde's exceptional wind energy potential and Guinea's major challenges with wind energy, highlighting the need for specific approaches based on unique geographical, economic, and infrastructural conditions. Economically, countries like Niger and Mali with low LCOH can attract more investment, fostering growth and energy independence. These results are significant for guiding strategic investments and policy decisions, prioritizing regions with competitive costs to optimize resource deployment and maximize the impact of green hydrogen projects.
Countries with high LCOH could focus on mitigating cost factors. Similarly, ECOWAS countries with a low LCOH could utilize this advantage to take the lead in producing green hydrogen. This can help attract international investments and promote sustainable development. This thorough analysis provides an essential framework for promoting green hydrogen initiatives in West Africa, contributing to worldwide endeavors to mitigate carbon emissions and foster the adoption of clean energy. West African countries’ geographical and climatic diversity influences their green hydrogen production potential, with solar and wind resources pivotal in determining economic feasibility. The variations in LCOH across different countries highlight the importance of location-specific renewable energy strategies. Factors such as solar irradiance, wind patterns, infrastructure development, and local economic conditions create a complex landscape for hydrogen production. The substantial differences in LCOH between solar PV and wind systems highlight the need for specific approaches in each country. For instance, while some nations like Niger and Mali demonstrate consistently low production costs across both solar and wind technologies, others show more pronounced disparities. These variations suggest that technology selection and investment strategies must be carefully calibrated to local conditions. Furthermore, the economic implications extend beyond mere production costs, potentially influencing broader regional development, energy independence, and international competitiveness in the emerging green hydrogen market. This analysis provides pathways for ECOWAS countries to leverage their comparative advantages, potentially transforming the region into a competitive green hydrogen production hub and supporting sustainable development objectives through targeted technological and infrastructure investments.
Table 3 comprehensively compares this study's LCOH with other studies in the existing literature. The LCOH estimates for Ghana, Benin, Cape Verde, Nigeria, Burkina Faso, Niger, and Mali in this study are consistent with previous studies, which offers credibility to the findings. Notably, the LCOH values from this study, ranging from $2.14/kg to $3.93/kg, are comparable to the broader literature range of $3.10/kg to $9.49/kg. This indicates that the study's methodology and assumptions are robust and consistent with established practices in the field. The current study reports the lowest LCOH in Cape Verde at $2.14/kg using wind energy, which is significantly lower than the $5.60/kg previously reported for the country by Gado et al. (2024). Similarly, this study's LCOH for Niger ($3.23/kg) and Burkina Faso ($3.52 kg) using PV is lower than those reported in the 2024 study ($4.81/kg and $5.32/kg, respectively) (Gado et al., 2024), indicating potential improvements in solar PV technology or more optimistic economic projections.
Comparison of LCOH with similar studies in literature.
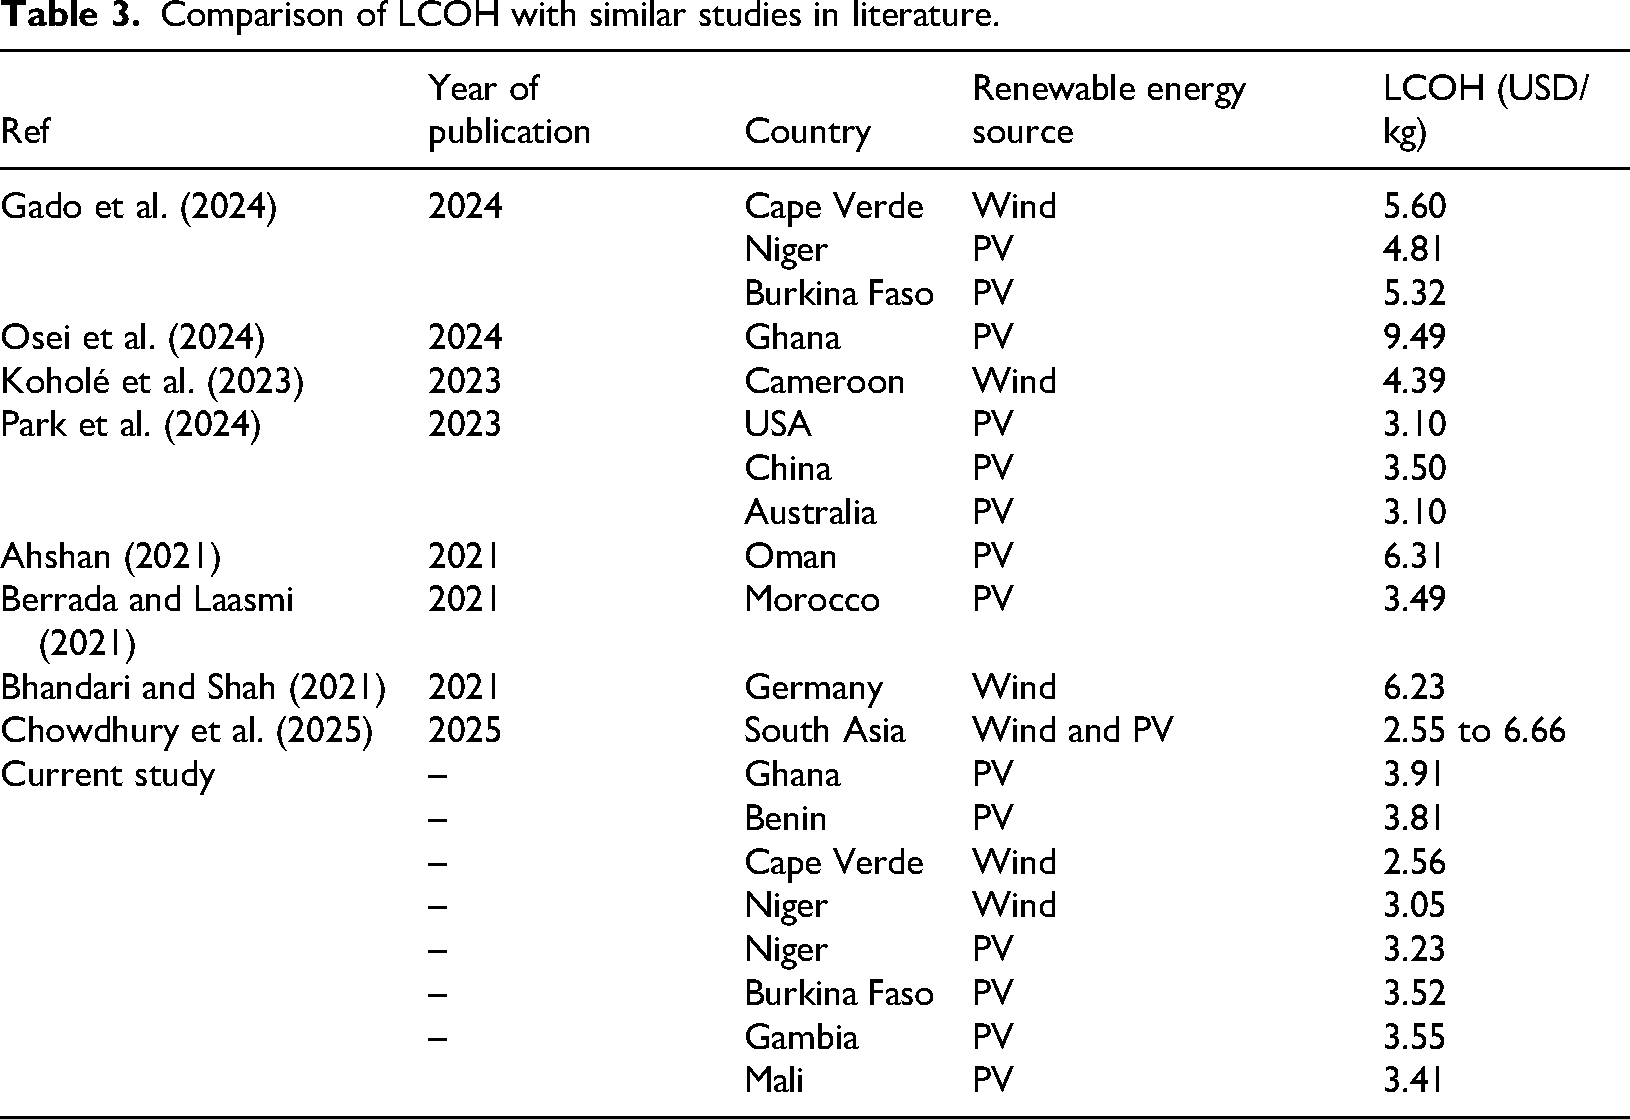
The variation in LCOH values across different countries highlights the importance of local factors such as renewable energy resource availability, technology costs, and economic conditions in determining the feasibility of hydrogen production. For instance, the lower LCOH values for wind-based hydrogen production in Cape Verde and Nigeria than PV-based production in other African countries suggest that wind energy may be more economically viable in specific locations. The current study's results also compare favorably with LCOH values reported for more developed countries. For example, in this current study, the LCOH values for the African countries are competitive with or lower than those reported for the USA, China, and Australia (3.10/-3.50 $/kg) (3.10/-3.50 $/kg) (Park et al., 2024) and lower than the $6.23/kg reported for wind-based hydrogen production in Germany (Bhandari and Shah, 2021). This comparison suggests that African countries have the potential to become competitive players in the global green hydrogen market, leveraging their abundant renewable energy resources.
The temporal aspect of the studies in Table 3 is also significant. The general trend shows decreased LCOH over time, with more recent studies reporting lower values. This trend is evident when comparing the current study's results with those from earlier years, reflecting ongoing improvements in renewable energy technologies and decreasing costs of electrolysis equipment. However, it is important to note that the current study's LCOH values are lower than some more recent studies, which could indicate either very optimistic assumptions or the potential for African countries to leapfrog in terms of technology adoption and cost reduction. The variation in LCOH values between different renewable energy sources within the same country or region is also significant. For instance, the current study shows that wind energy in Cape Verde yields a lower LCOH than PV in other West African countries. This highlights the importance of carefully selecting the most appropriate renewable energy source based on local resources and conditions to optimize hydrogen production costs.
The competitive LCOH values for African countries in the current study are essential in further developing the concept of a green hydrogen economy in the region. The findings point to the possibility of African nations using green hydrogen to satisfy their domestic energy demands and even selling it into the world market. This may open the nation to economic growth, job creation, and the security of energy supply in the countries. Furthermore, low LCOH values would imply that hydrogen prices from green hydrogen in Africa would be on the level with fossil hydrogen, thus contributing toward global decarbonization. However, it is important to recognize that LCOH represents only one feasibility factor for green hydrogen production. Other essential factors are infrastructure planning, water availability, political stability, and investment climate in establishing full-scale hydrogen projects. Further research could be carried out to treat these issues for a more comprehensive view of the potential for green hydrogen production in Africa.
Green hydrogen is dependent on water availability, especially in desert areas such as Niger and Mali. Water availability conditions for the other types of green hydrogen in these countries also call for innovative approaches that, on the one hand, maximize water efficiency and, on the other end, look for alternative sources. For instance, exploring and sustainably extracting groundwater from deep aquifers, coupled with solar-powered pumping systems to provide reliable water access within sustainable yield limits. Likewise, wastewater recycling and treatment plants can accept wastewater from urban centers and industrial processes for purification and reuse, ultimately developing closed-loop systems that reduce freshwater demands. Atmospheric water generation technologies, powered by abundant solar energy, could also harvest water vapor from desert air given that the energy balance is carefully optimized. Regional water partnerships with neighboring countries having better water resources can import water via either pipeline infrastructure or transportation networks, with the possibility of green hydrogen export revenues acting as funding. Besides, hybrid production schemes that marry water-efficient hydrogen production with water purification and distribution have double uses, whereby hydrogen plants double as joint-water treatment centers.
Carbon dioxide emissions mitigation
Figure 8 displays the reduction in CO2 emissions for PV/hydrogen and wind/hydrogen systems. Niger has the highest estimated mitigation potential of 119.08 kg/m2, followed closely by Mali at 111.88 kg/m2 and Burkina Faso at 108.01 kg/m2 (Figure 8(a)). Conversely, Liberia recorded the lowest mitigation potential for PV/hydrogen systems at 87.15 kg/m2. Its geographical location, experiencing more cloud cover and less intense solar radiation than Sahelian countries, might be the reason for this. Cape Verde also shows a potential of 107.15 kg/m2, which is notable given its insular location and the challenges associated with small island states. This result demonstrates that, despite its small size and potential logistical problems, Cape Verde can efficiently utilize solar energy to decrease its CO2 emissions. Senegal (108.15 kg/m2) and Guinea (107.47 kg/m2) demonstrate significant potential, suggesting promising opportunities for PV/hydrogen systems in both countries.
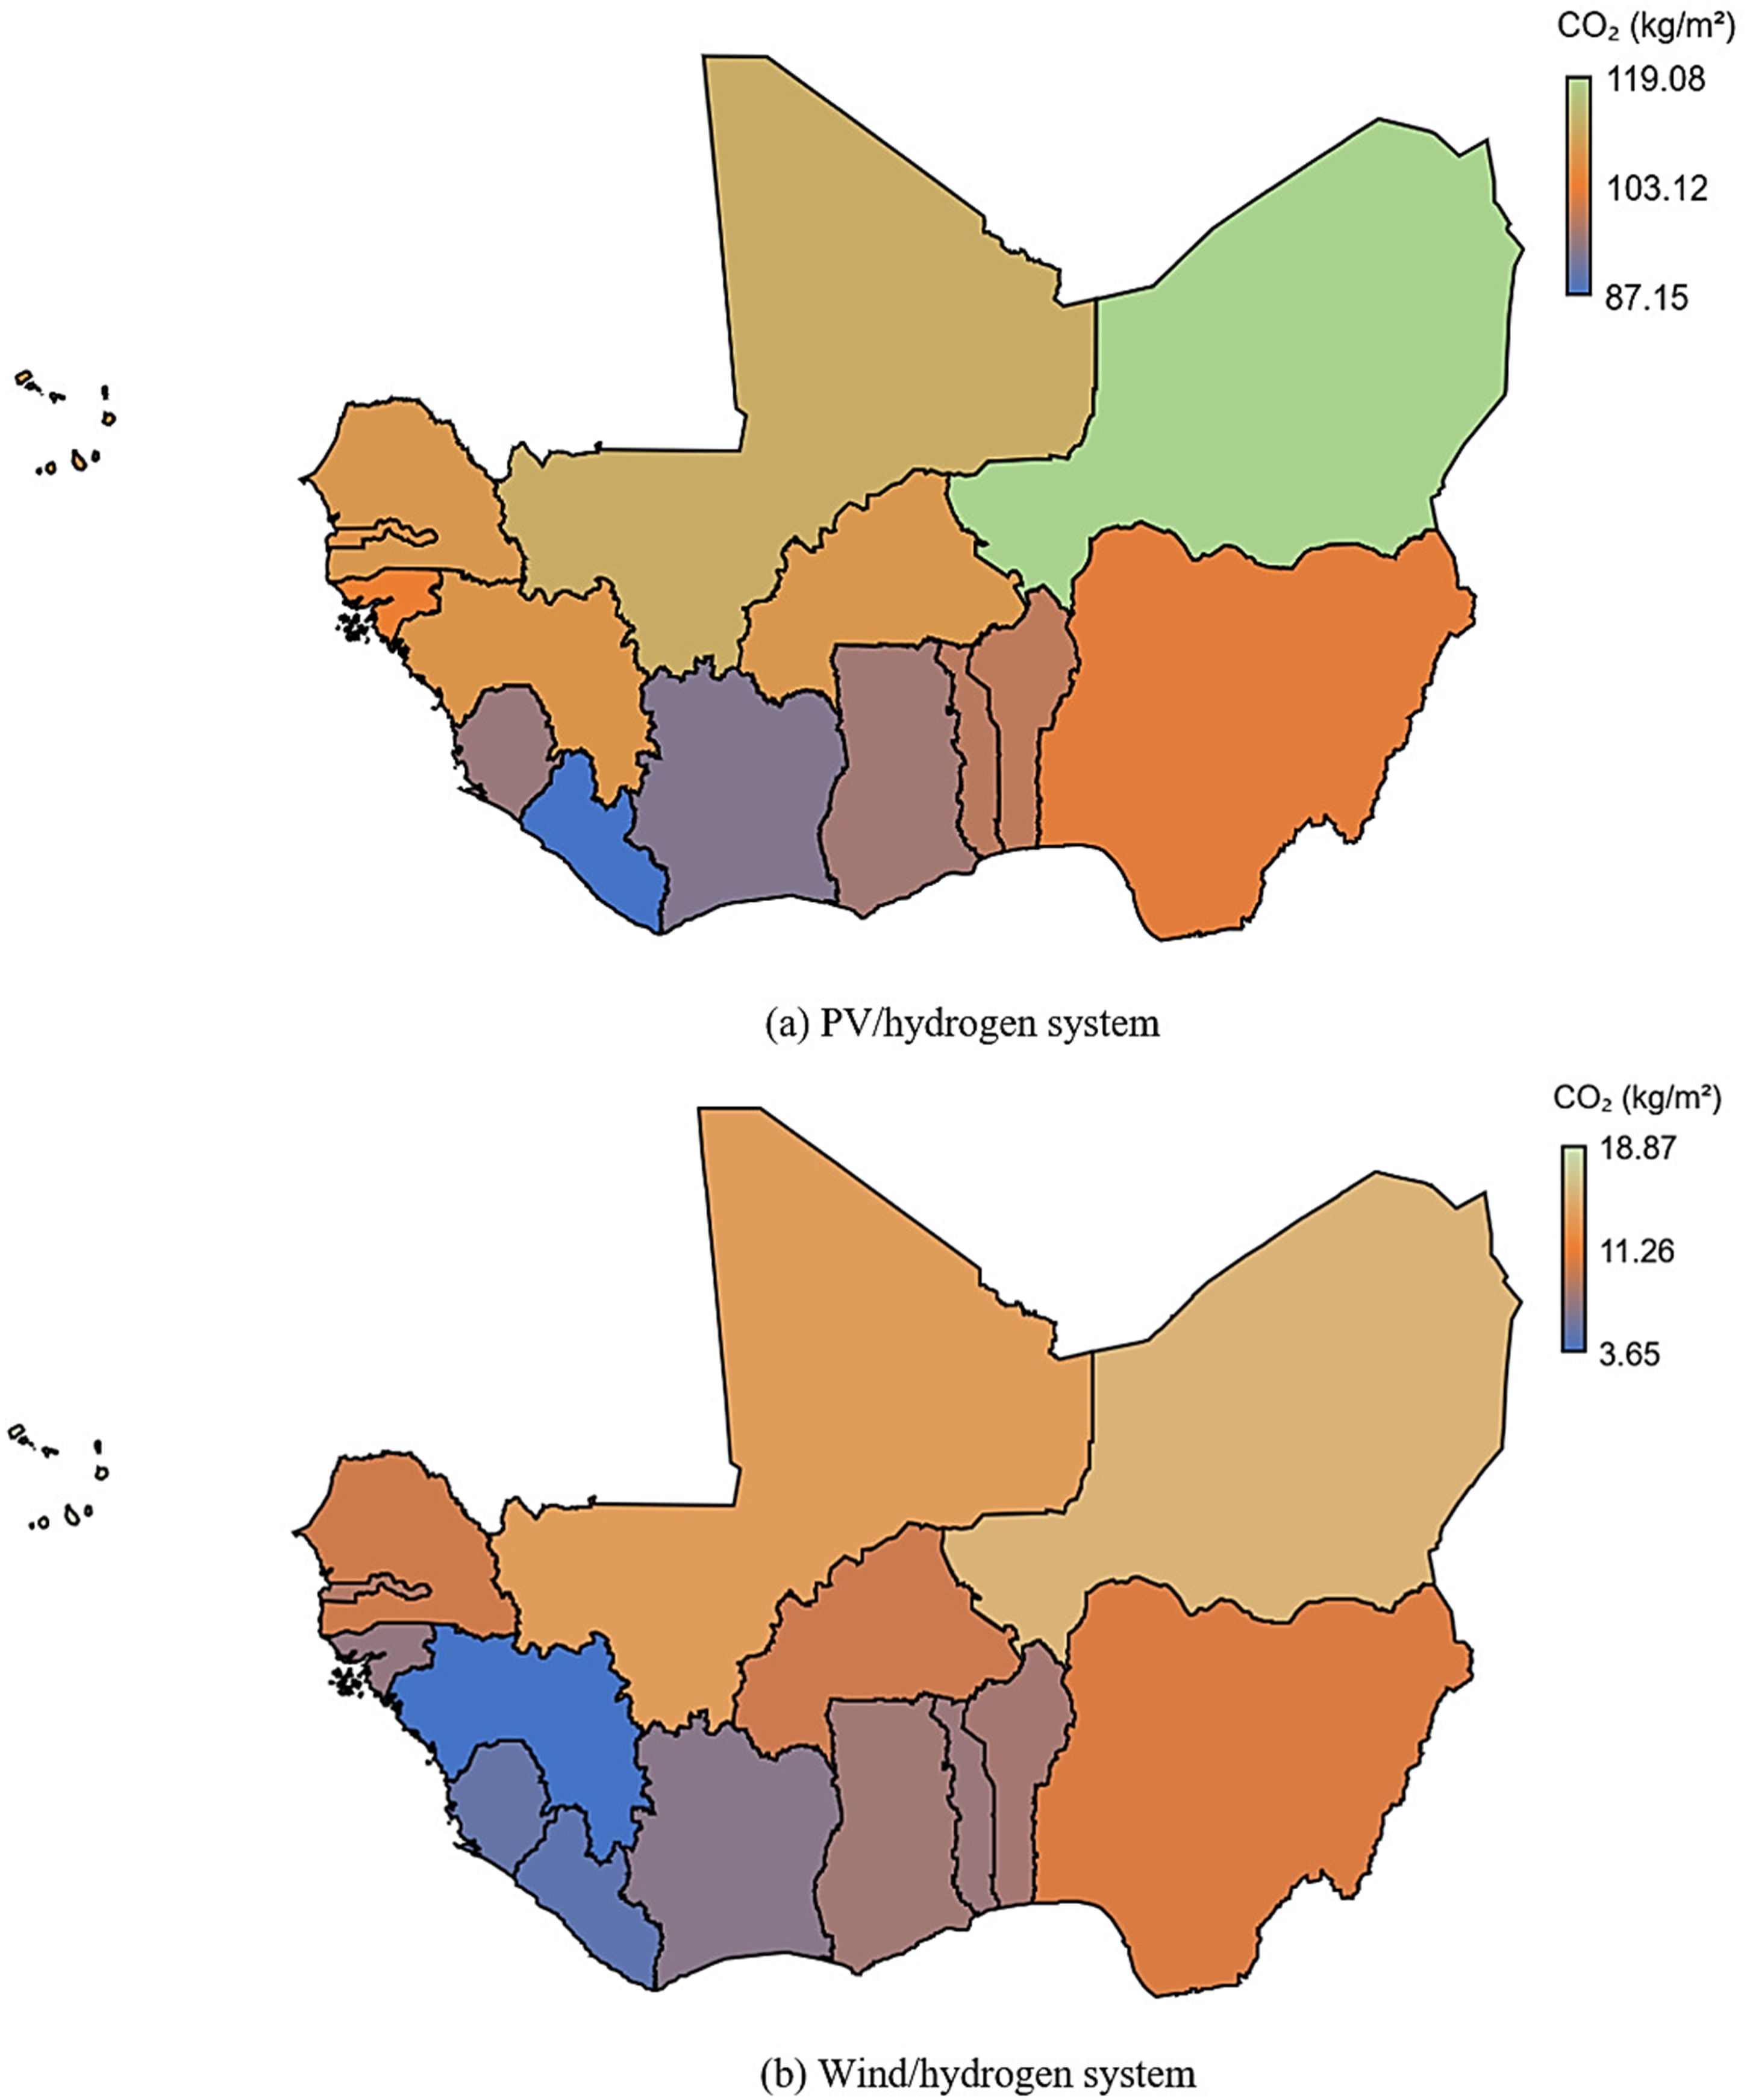
ECOWAS countries CO2 emissions mitigation potential.
On the other hand, Figure 8(b) displays a different CO2 mitigation potential distribution. As shown, Cape Verde had the highest mitigation potential of 18.87 kg/m2. Niger and Mali also recorded CO2 mitigation potential of 15.31 kg/m2 and 13.67 kg/m2, respectively. Countries like Guinea and Liberia recorded lower potentials for wind/hydrogen systems, with values of 3.65 kg/m2 and 4.76 kg/m2, respectively. These lower figures could be due to less favorable wind conditions, making wind energy less viable than solar energy in these regions.
Côte d’Ivoire also shows a relatively low CO2 mitigation potential for wind energy at 6.71 kg/m2. This indicates that PV/hydrogen systems might be an effective strategy for CO2 mitigation in this country. Nigeria, the region's most populous country, has a mitigation potential of 102.12 kg/m2 for PV/hydrogen systems and 10.30 kg/m2 for wind/hydrogen systems. These findings highlight Nigeria's substantial renewable energy potential, which, if effectively harnessed, could significantly reduce CO₂ emissions. Although the values for Ghana are comparatively lower, 96.00 kg/m2 for PV/hydrogen and 7.78 kg/m2 for wind/hydrogen, they still indicate promising opportunities for renewable energy deployment. Despite its small size, The Gambia exhibits notable potential for both PV/hydrogen and wind/hydrogen systems at 106.78 kg/m2 and 8.59 kg/m2, respectively, demonstrating that even smaller countries can advance the renewable energy transition and achieve substantial emission reductions.
The variations in mitigation potential across different countries emphasize the region's complex renewable energy ecosystem. Geographical factors, such as solar irradiance, wind patterns, and topographical characteristics, are pivotal in determining emission reduction capabilities. The results suggest that PV hydrogen systems consistently outperform wind-based systems in CO2 mitigation across most West African nations, highlighting the region's solar energy advantage. This differential performance is notable in countries like Guinea, Liberia, and Côte d'Ivoire, where wind energy proves significantly less effective for emission reduction. The findings are especially substantial for larger economies like Nigeria, demonstrating considerable potential for CO2 emissions reduction through strategic renewable energy investments. In addition, the analysis reveals that even smaller countries like the Gambia and Cape Verde can play meaningful roles in regional decarbonization efforts, challenging preconceived notions about the impact of smaller nations on global climate change mitigation strategies.
It is worth mentioning that the CO2 mitigation potential analysis offers opportunities for carbon credit generation under emerging global carbon markets. The emerging carbon markets, including mechanisms like the Paris Agreement's Article 6 and voluntary carbon markets (Cook et al., 2024), provide flexible frameworks for ECOWAS countries to monetize their emission reduction capabilities. These markets could offer financial incentives and position these nations as proactive participants in climate change mitigation efforts. The carbon credit potential could add a significant economic dimension to the renewable hydrogen strategy, potentially attracting international investments and supporting sustainable development objectives beyond direct energy production.
Sensitivity analysis
Table 4 shows the impact of degradation rates on the LCOH for PV/hydrogen and wind/hydrogen systems. As the degradation rate increases from 0% (base case scenario) to 10%, a consistent upward trend in LCOH is observed for both technologies across all countries. The results indicate that, for PV/hydrogen systems, increasing the degradation rate from 0% to 10% leads to an LCOH increase of about 8% to 12%. However, wind/hydrogen systems show a slightly higher sensitivity, with increases ranging from 10% to 15%. This discrepancy might be due to each technology's different operational characteristics and initial capital costs. The results highlight the critical need to consider degradation rates in long-term energy planning and investment decisions, as they could impact the cost-effectiveness of green hydrogen production over time. The study identifies significant differences in the LCOH for both systems. As seen in Table 4, countries like Niger, Mali, and Burkina Faso consistently demonstrate lower LCOH values across all degradation rates, likely due to their high solar irradiance levels and suitable land availability for the PV/hydrogen systems.
Impact of degradation rate on LCOH.
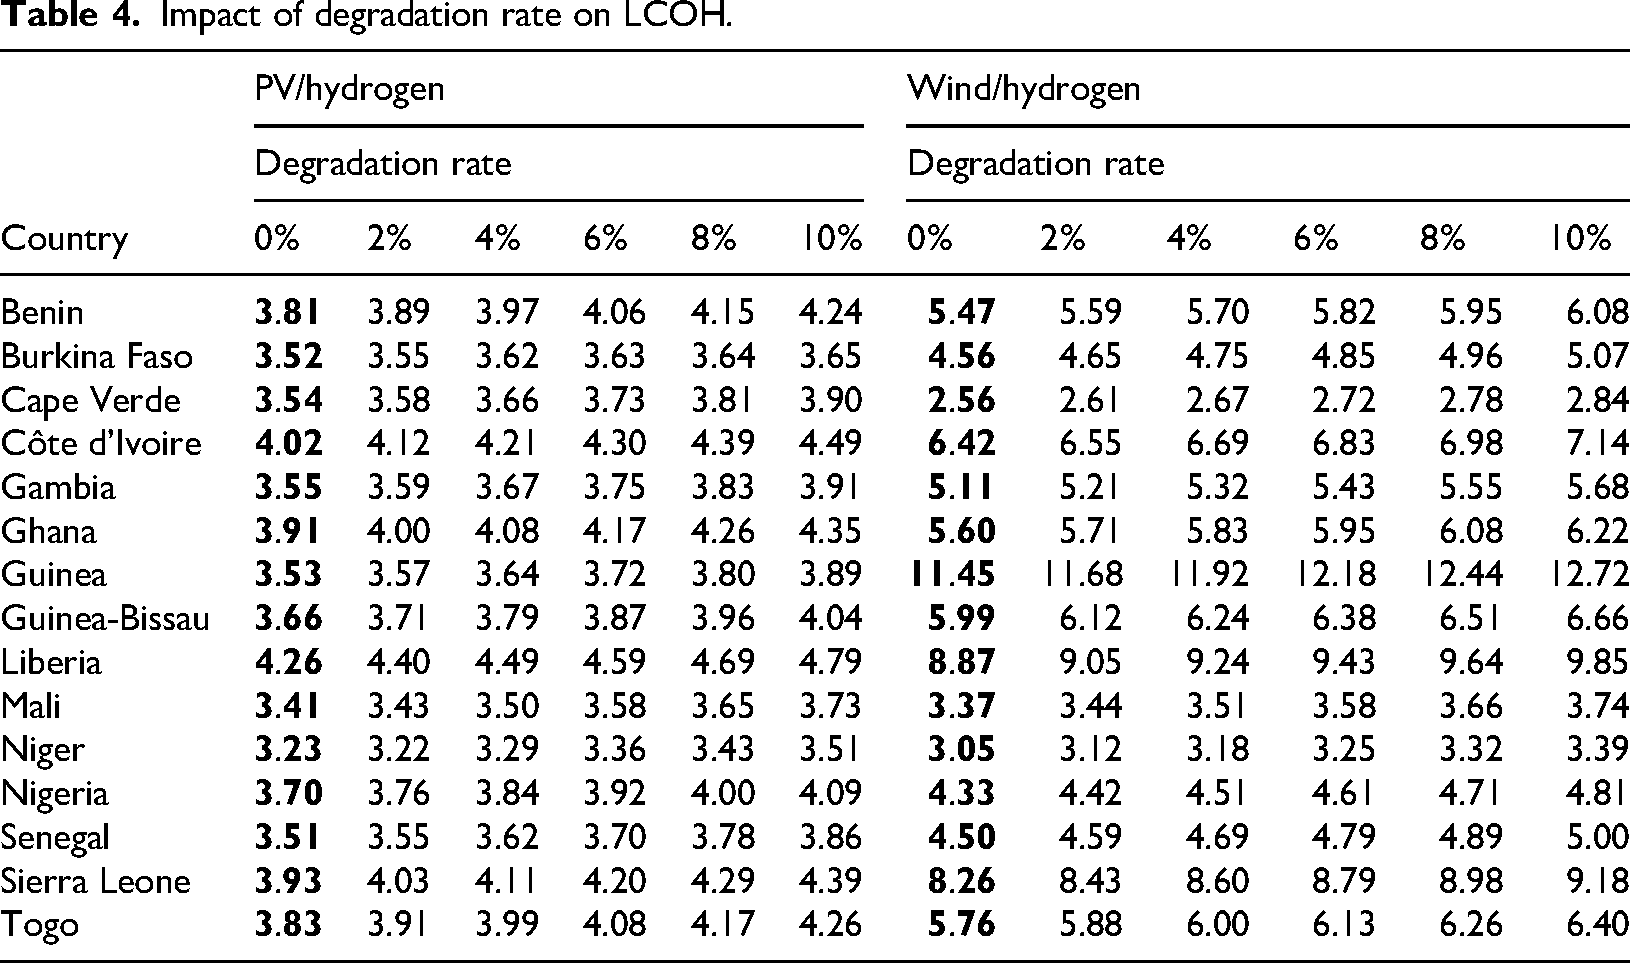
Nevertheless, countries such as Liberia and Côte d’Ivoire recorded higher LCOH values. In the case of wind/hydrogen systems, a noticeable variation is observed, with countries like Cape Verde, Niger, and Mali recording low LCOH values while others like Guinea, Liberia, and Sierra Leone recording higher costs. The difference between these factors emphasizes the importance of local wind resources and topographical conditions in determining the economic feasibility of producing hydrogen from wind power. Table 4 demonstrates that though most countries show lower LCOH values for PV/hydrogen systems, exceptions like Cape Verde, Mali, and Niger demonstrate a clear advantage for wind/hydrogen systems across all degradation rates. This finding emphasizes the need for country-specific assessments and renewable energy strategies that capitalize on the most abundant and cost-effective local resources.
Furthermore, the analysis reveals that the gap between PV/hydrogen and wind/hydrogen LCOH values tends to widen as degradation rates increase in most countries, signifying that PV systems may offer greater long-term stability and predictability in terms of hydrogen production costs. The findings of this study have multiple implications for governments, investors, and energy planners in West Africa. First and foremost, they emphasize the importance of strong maintenance and operational procedures to reduce the adverse impacts of degradation on renewable energy systems. Even little increases in degradation rates can result in significant increases in the LCOH over time. In addition, the analysis highlights the prospect of regional collaboration and energy trade, wherein countries possessing favorable conditions for PV or wind-based hydrogen generation could export to nearby nations with higher production costs. This could foster economic integration and energy security across the region. Furthermore, the findings emphasize the significance of technological advances and financial investments in mitigating degradation rates and enhancing system efficiency. These efforts can potentially bolster the economic competitiveness of green hydrogen production.
From a broader perspective, this analysis aligns with and builds upon existing literature on renewable energy economics and hydrogen production. The observed sensitivity of LCOH to degradation rates is consistent with findings from studies such as those by Nasser and Hassan (2024a), Nasser et al. (2022), Ameur et al. (2022), and Malvoni et al. (2020), which emphasize the importance of considering long-term performance degradation in renewable energy project assessments. The geographical variations in LCOH values corroborate research by IRENA (2022, 2023) on the regional disparities in renewable energy potential and production costs across Africa. Furthermore, the comparative analysis between PV and wind systems for hydrogen production echoes the work of Glenk and Reichelstein (2019), Neuwirth et al. (2022), and Ma et al. (2018), who highlighted the site-specific nature of optimal technology choices for renewable hydrogen production. The strengths of this analysis lie in its comprehensive coverage of multiple countries and technologies, allowing for detailed comparisons and insights. The inclusion of a range of degradation rates provides a robust sensitivity analysis, enabling stakeholders to assess risks and make informed decisions under various scenarios. Moreover, the focus on West Africa addresses a critical knowledge gap, as much of the existing literature on renewable hydrogen production has centered on more developed regions or global assessments.
The impact of the discount rate on LCOH is shown in Table 5. The results indicate that as the discount rate increases from 2% to 12%, there is a consistent upward trend in LCOH values for all countries and energy sources. This highlights the crucial role that financing costs play in determining the economic viability of renewable hydrogen projects. The base case scenario at a 0% discount rate serves as a reference point, with the 8% rate (bolded in the table) representing a mid-range scenario that could be considered more realistic for many investment contexts. Comparatively, PV/hydrogen systems generally demonstrate lower LCOH values than wind/hydrogen systems across most countries, suggesting that solar energy might be a more cost-effective option for hydrogen production in the region.
Impact of discount rate on LCOH.
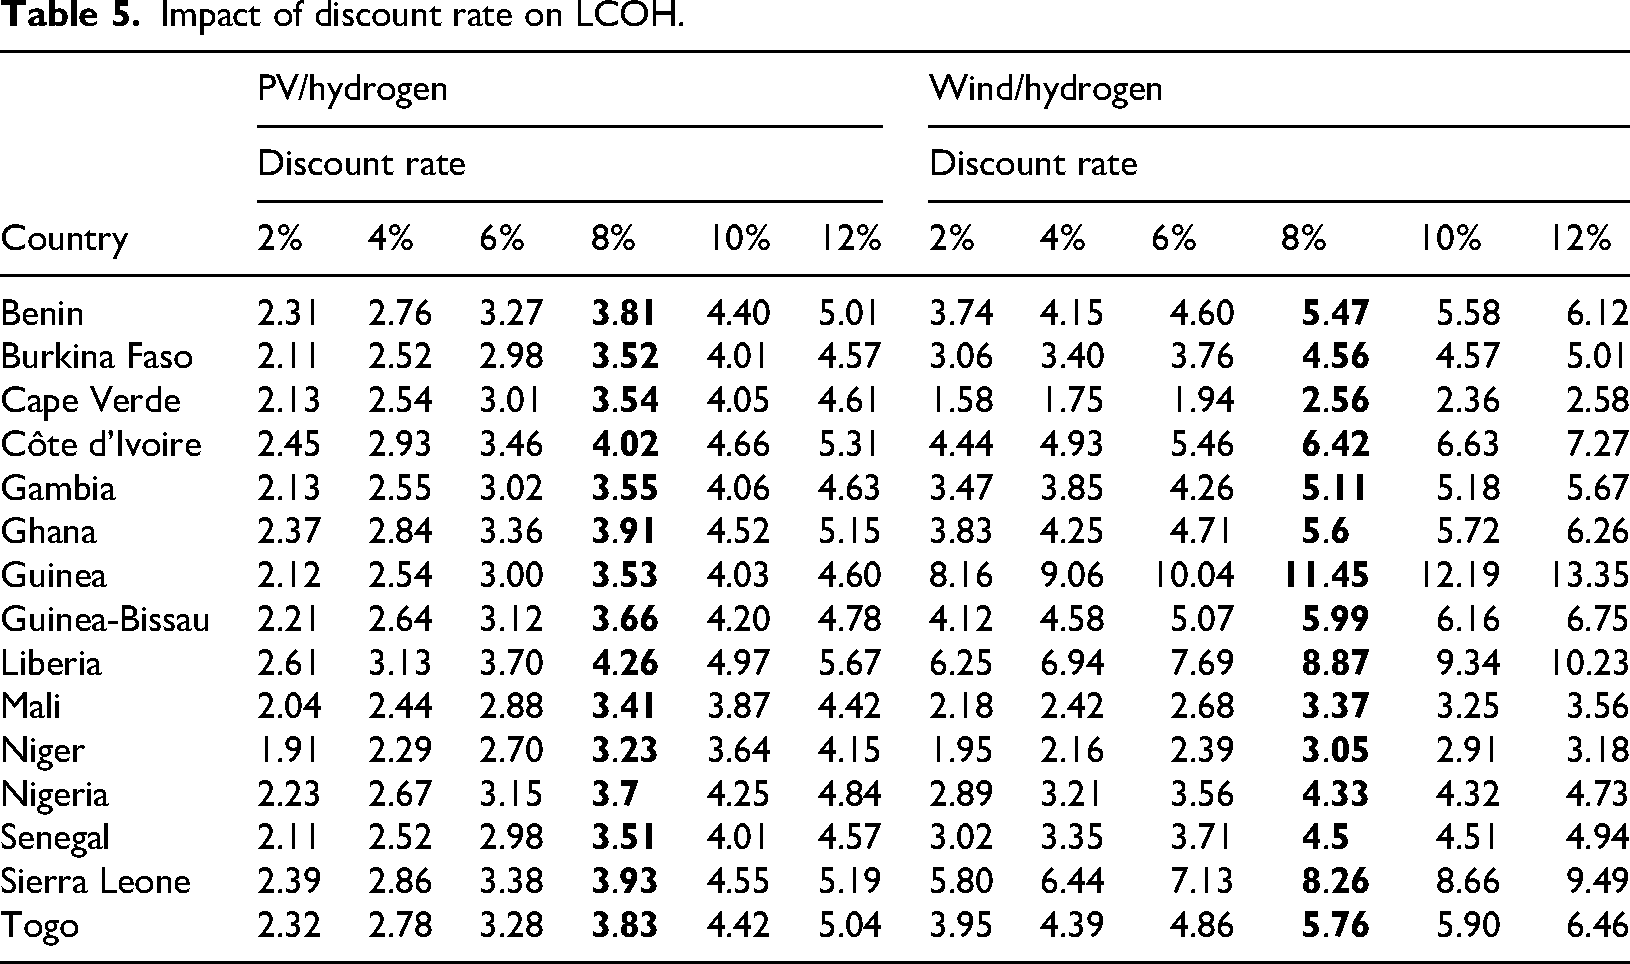
However, there are notable exceptions, such as Cape Verde, where wind/hydrogen systems show lower LCOH values (e.g. 2.56 $/kg at 8% discount rate) compared to PV/hydrogen (3.54 $/kg at 8%), indicating the importance of local resource availability in determining the optimal energy mix. Countries like Guinea and Liberia show exceptionally high LCOH values for wind/hydrogen systems, which could be attributed to lower wind resources or higher infrastructure costs in these areas. The sensitivity of LCOH to discount rates varies among countries, with some showing steeper increases than others as the rate rises. For instance, Benin's PV/hydrogen LCOH increases from 2.31 $/kg at 2% to 5.01 $/kg at 12%, while Niger's ranges from 1.91 $/kg to 4.15 $/kg over the same span. This variability emphasizes the importance of country-specific factors such as resource quality, infrastructure, and policy environments in determining project feasibility. The analysis also reveals that countries with lower baseline LCOH values tend to be less sensitive to changes in discount rates, potentially offering more stable investment opportunities.
From a policy perspective, these results highlight the critical need for governments and international organizations to focus on reducing financing costs for renewable hydrogen projects. Lower discount rates could enhance the competitiveness of green hydrogen against conventional fossil fuel alternatives. For example, at a 2% discount rate, several countries show LCOH values below 2.5 $/kg for PV/hydrogen, which approaches competitive levels with grey, black/brown, turquoise, blue, and aqua hydrogen production (Arcos and Santos, 2023). However, as rates increase to 10% or 12%, the LCOH values often double, potentially rendering projects economically expensive without substantial support or technological advancements. The analysis also underlines the potential for regional cooperation in West Africa. Countries with more favorable LCOH profiles could potentially become hydrogen production hubs, exporting to neighboring nations with higher production costs. This could lead to a more efficient allocation of resources and investments across the region.
Furthermore, the stark differences in LCOH between PV and wind systems in some countries (e.g. Cape Verde and Guinea) suggest that a diversified approach to renewable energy sourcing could help mitigate risks and optimize costs. The implications of these results extend beyond mere project economics. Lower LCOH values at reduced discount rates could accelerate the transition to green hydrogen economies, fostering industrial decarbonization, enhancing energy security, and creating new economic opportunities in the region. However, achieving these lower rates may require innovative financing mechanisms, public-private partnerships, and international climate finance support to de-risk investments and lower capital costs.
This analysis aligns well with findings in the literature on renewable energy economics and hydrogen production. Studies have consistently shown the significant impact of discount rates on the economic viability of renewable energy projects (Fregonara and Ferrando, 2023). For instance, a report by IRENA (2022) and IRENA (2023) emphasized how lower financing costs have been crucial in driving down renewable energy costs globally. The results presented here corroborate this trend, demonstrating how sensitive hydrogen production costs are to financing terms in the West African context. The comparative advantage of PV/hydrogen systems over wind/hydrogen in many analyzed countries aligns with global solar PV cost reduction trends. IRENA (2017) reported continued declines in solar PV costs, often making it the cheapest form of new electricity generation in many parts of the world. This analysis extends that insight to hydrogen production, showing how these cost advantages can translate into lower LCOH for solar-based systems in regions with good solar resources. The range of LCOH values observed across different discount rates provides vital input for policymakers and investors considering the long-term viability of hydrogen projects. The International Energy Agency (IEA) has emphasized the need for supportive policies and financing mechanisms to bridge the cost gap between low-carbon and conventional hydrogen production methods (IEA, 2023). The sensitivity analysis presented here quantifies this challenge for West African countries, offering a concrete basis for designing targeted interventions.
Table 6 displays the LCOH under varying electrolyzer efficiencies. Varying electrolyzer efficiencies are important for comprehensively understanding technological performance and economic feasibility across different operational conditions. Electrolyzers are the core technology converting electrical energy to hydrogen, and their efficiency directly impacts the overall economic viability of green hydrogen production. As electrolyzer efficiency increases from 45% to 95%, there is a consistent and substantial reduction in LCOH across both PV and wind hydrogen production pathways, with percentage reductions ranging from approximately 35–53% depending on the specific country and renewable energy source. PV-based hydrogen production generally shows lower LCOH values than wind-based hydrogen, indicating more cost-effective potential, though wind configurations show more variability across different national contexts.
Impact of electrolyzer efficiency on LCOH.
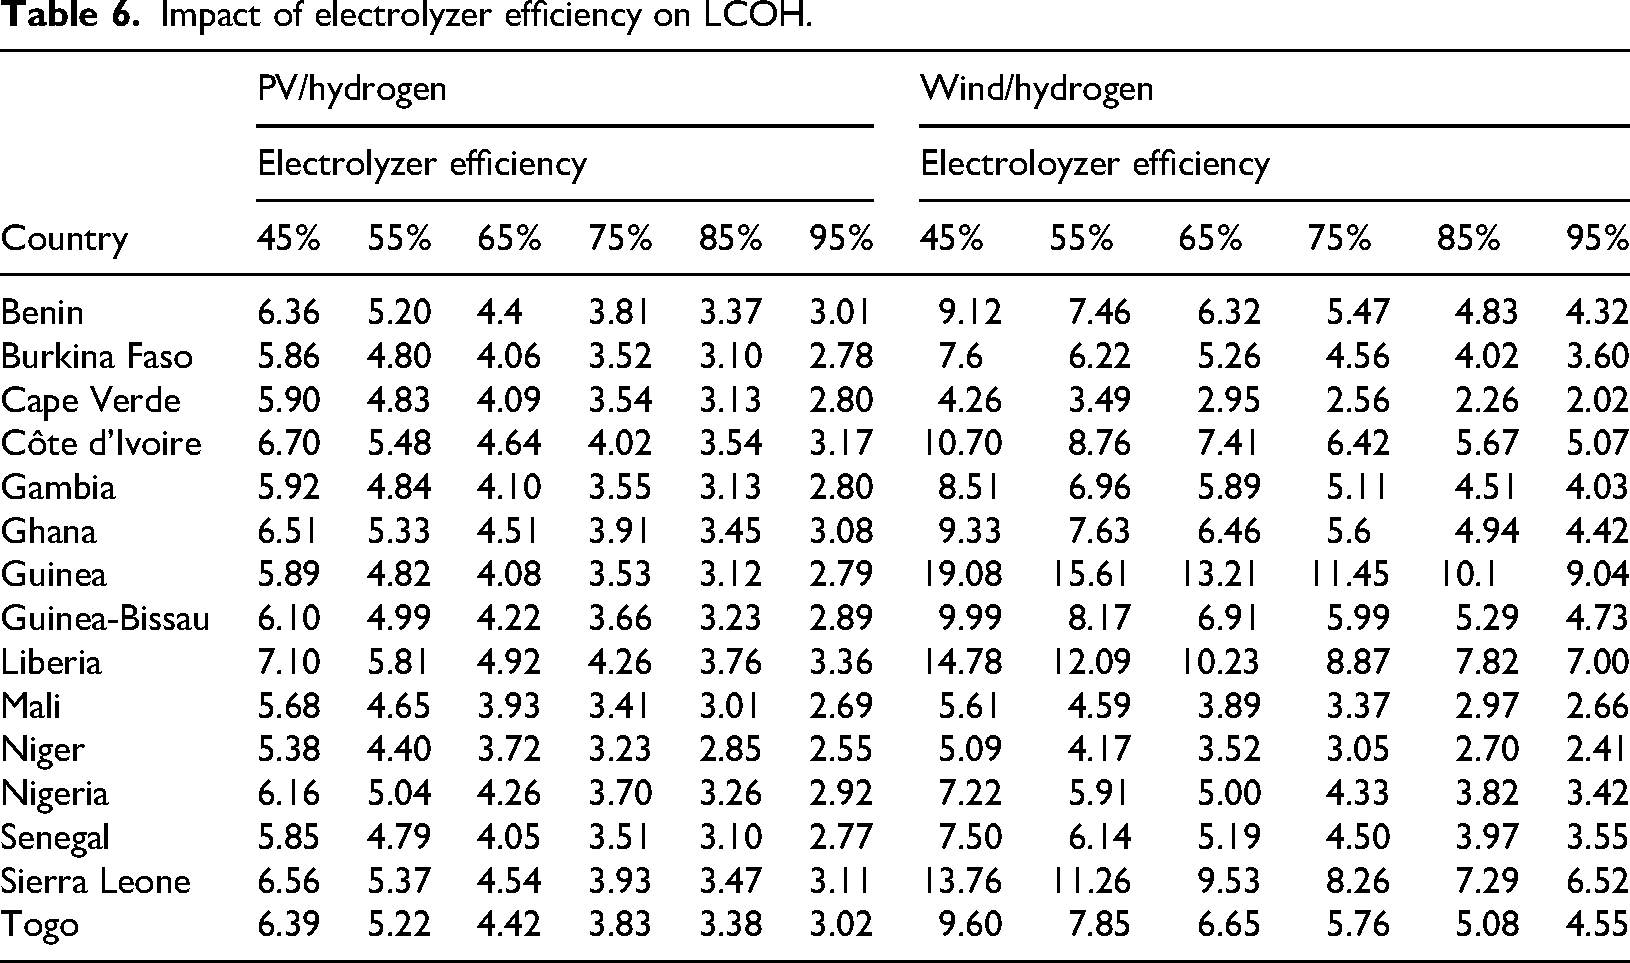
Countries such as Mali, Niger, and Cape Verde show the most significant cost reductions as electrolyzer efficiency increases, with LCOH values for PV-based systems falling from approximately $5.38–$6.10/kg to $2.55–$2.89/kg and even more substantial declines for wind-based systems, from $5.09–$9.99/kg to $2.41–$4.73/kg. Notably, countries with higher renewable energy potential, such as Guinea and Liberia, show more absolute LCOH variations, with wind-based hydrogen showing particularly dramatic cost ranges from $19.08/kg to $9.04/kg and $14.78/kg to $7.00/kg, respectively. These findings underline the critical importance of technological advancements in electrolyzer efficiency as a key lever for reducing hydrogen production costs, with marginal efficiency improvements potentially yielding economic benefits. The results strongly suggest that continued investment in electrolyzer technology optimization could enhance the economic viability of green hydrogen production in West African countries, mainly those with abundant renewable energy resources, positioning these nations as potential future hydrogen economy leaders by leveraging their significant solar and wind potential to create competitive, low-carbon hydrogen production capabilities. From a strategic perspective, this analysis provides a comprehensive roadmap for hydrogen development in West Africa. Countries like Guinea and Liberia, which have high-cost variability, represent significant opportunities for technological interventions. Conversely, countries like Niger and Mali, with more stable and lower costs, might benefit from more incremental technological improvements. The comparative analysis demonstrates that green hydrogen production is not a universal solution. Each country's unique combination of renewable resources, geographical conditions, and technological readiness creates a distinct economic landscape. Policymakers and investors must adopt a tailored approach, considering local contexts and the potential for technological advancement.
Limitations
The study has several methodological and contextual limitations that should be acknowledged. For instance, the study relies on standardized assumptions about renewable energy resources, electrolyzer efficiency, and economic parameters. These assumptions may not adequately capture the rapidly evolving framework of renewable energy technologies and the detailed technological variations across ECOWAS member states. Specifically, the study employs generalized technical parameters for solar PV modules, wind turbines, and electrolyzers that might not reflect recent technological advancements or locally available equipment specifications. Likewise, this study focuses on PV and wind technologies for hydrogen production, representing a notable constraint in the study's approach. Therefore, the analysis potentially neglects other renewable energy technologies or innovative hybrid systems that could provide alternative or complementary hydrogen production solutions. Although the study comprises multiple ECOWAS countries, it gives a broad, macroscopic overview that may not adequately address micro-level geographical variations within each national context. The generalized approach risks masking local differences in renewable energy potential, infrastructure capabilities, and technological readiness. It is worth mentioning that these limitations do not diminish the study's value but emphasize the importance of cautious interpretation and the need for continuous research and refinement in understanding hydrogen production potential within the ECOWAS region.
Conclusion
Transitioning to renewable energy solutions is critical for achieving sustainable development goals and reducing greenhouse gas emissions. This study investigated the potential of green hydrogen production systems powered by solar PV and wind energy within the ECOWAS region, providing a pathway toward cleaner energy systems. The results show variability in energy potential and economic feasibility across the region, with countries like Niger, Mali, and Cape Verde showing strong prospects due to their favorable climatic and geographic conditions. Integrating PV and wind systems highlights the region's renewable energy potential and emphasizes leveraging localized advantages to maximize efficiency and minimize costs. Solar PV systems generally showed higher feasibility and lower LCOH than wind systems, except in cases like Cape Verde, where wind energy demonstrated significant advantages. In addition, the capacity for CO2 mitigation illustrates the broader environmental benefits of transitioning to green hydrogen, providing a viable pathway to achieving global decarbonization targets.
Since degradation rates, electrolyzer efficiencies, and discount rates affect system performance and thus overall economic viability of green hydrogen projects, issues affecting system performance should be discussed. Countries with lower LCOH values and higher renewable energy densities are emerging as potential leaders in the green hydrogen economy; hence, they may attract investors and build up regional energy security. Nevertheless, on the utmost level, gaps need to be given foremost concern, advancing research and practical implementation instruments at various levels. Firstly, location-based data concerning both resource assessments and system configurations are required. Hence, future works need to incorporate high-resolution climatic, geographic, and infrastructure data to better capture local renewable energy potential as it varies across the ECOWAS countries. By relying on standard technical parameters, the study also points out the need for further probing into recent technologies, like high-efficiency electrolyzers, oxygen separation electrolyzers, and advanced energy storage systems that can greatly improve the economic feasibility and performance of producing hydrogen. In addition, the study's exclusive focus on solar and wind technologies limits the broader potential of integrating alternative renewable energy sources, such as biomass, geothermal, or tidal energy, and innovative hybrid systems. Such diversification could provide complementary solutions, especially in areas with less optimal solar and wind resources. Research into hybrid systems could explore interactions between multiple energy sources, improving reliability and efficiency.
The economic analysis could also be expanded to incorporate factors like water availability, transportation infrastructure for hydrogen distribution, and socio-economic impacts such as job creation and energy access. Investigating these dimensions can provide a holistic framework for decision-making. Future work should also prioritize the inclusion of dynamic models that account for policy, financing, and market conditions, as these factors critically influence the feasibility of large-scale hydrogen projects. Moreover, leveraging machine learning and artificial intelligence could enable predictive analytics and optimization for energy planning and system design. Collaborative, multi-disciplinary approaches involving governments, industries, and academia are necessary to address the region's unique challenges and opportunities. Finally, advancing these areas will strengthen the ECOWAS region's position in the green hydrogen market and contribute to global decarbonization efforts and energy equity.
Footnotes
Ethical considerations
Not applicable.
Funding
The authors received no financial support for the research, authorship, and/or publication of this article.
Declaration of conflicting interests
The authors declared no potential conflicts of interest with respect to the research, authorship, and/or publication of this article.
Data availability
Data are included in the manuscript.