
Abstract
The significant upscaling of wind turbine size (nameplate capacity, rotor diameter, and tower height) has, to date, been driven primarily by a goal of minimizing the levelized cost of energy. But with wind’s levelized cost of energy now comparable with that of other generating resources, other design considerations besides cost-minimization have grown in importance—particularly as wind’s increasing market penetration begins to impose challenges on the electric grid. We find that taller towers and larger rotors (relative to nameplate capacity) can enhance the value of wind energy to the electricity system and provide other “hidden” benefits. Specifically, in regions where wind penetration has reached around 20%, we find a boost in wholesale market value of US$2–US$3/MWh. This is augmented by transmission, balancing, and financing benefits that sum to roughly US$2/MWh. The aggregate potential value enhancement of US$4–US$5/MWh is comparable with a 10%–15% reduction in levelized costs.
Introduction
Wind energy has deployed rapidly on a global basis, growing from 24 GW at the end of 2001 to 198 GW at the end of 2010 and then to 591 GW at the end of 2018 (Global Wind Energy Council [GWEC], 2019). Technology advancement and related cost reductions have played a pivotal role in this achievement, but further innovation will be necessary if wind is to become a primary source of electricity worldwide (Barthelmie and Pryor, 2014; Mai et al., 2017; Veers et al., 2019; Zhang et al., 2016). This article contributes to a growing understanding of one innovation pathway—further upscaling in turbine size—by focusing on several less-recognized benefits of larger rotor and taller tower land-based wind turbines.
Wind technology has advanced since the industry’s commercial beginnings. Most obviously, turbines have not only become more-sophisticated in their design, manufacturing, and operations, they have also become much larger (Veers et al., 2019). A typical wind turbine installed in California in the 1980s featured a 0.1 MW generator, a tower height of 18 m, and a rotor diameter (RD) of 17 m. The resulting “specific power,” (SP) defined as the nameplate capacity of the generator divided by the swept rotor area of the blades, was 440 W/m2. In 2018, the average turbine installed on land in the United States was 2.4 MW in size, with a hub height (HH) of 88 m and a RD of 116 m (Bolinger et al., 2021; see Figure 1 for recent trends). The average SP had fallen to 230 W/m2, demonstrating that the wind industry has prioritized blade length and growth in swept rotor area even more than increased nameplate capacity. Even-larger wind turbines are deployed in some markets outside of the United States (International Renewable Energy Agency [IRENA], 2019). And, while turbine size varies by market, wind resource, and site topography such that there is no single “optimal” turbine, further upward scaling in average capacity, tower height, and RDs is anticipated in the years ahead (Wiser et al., 2016).
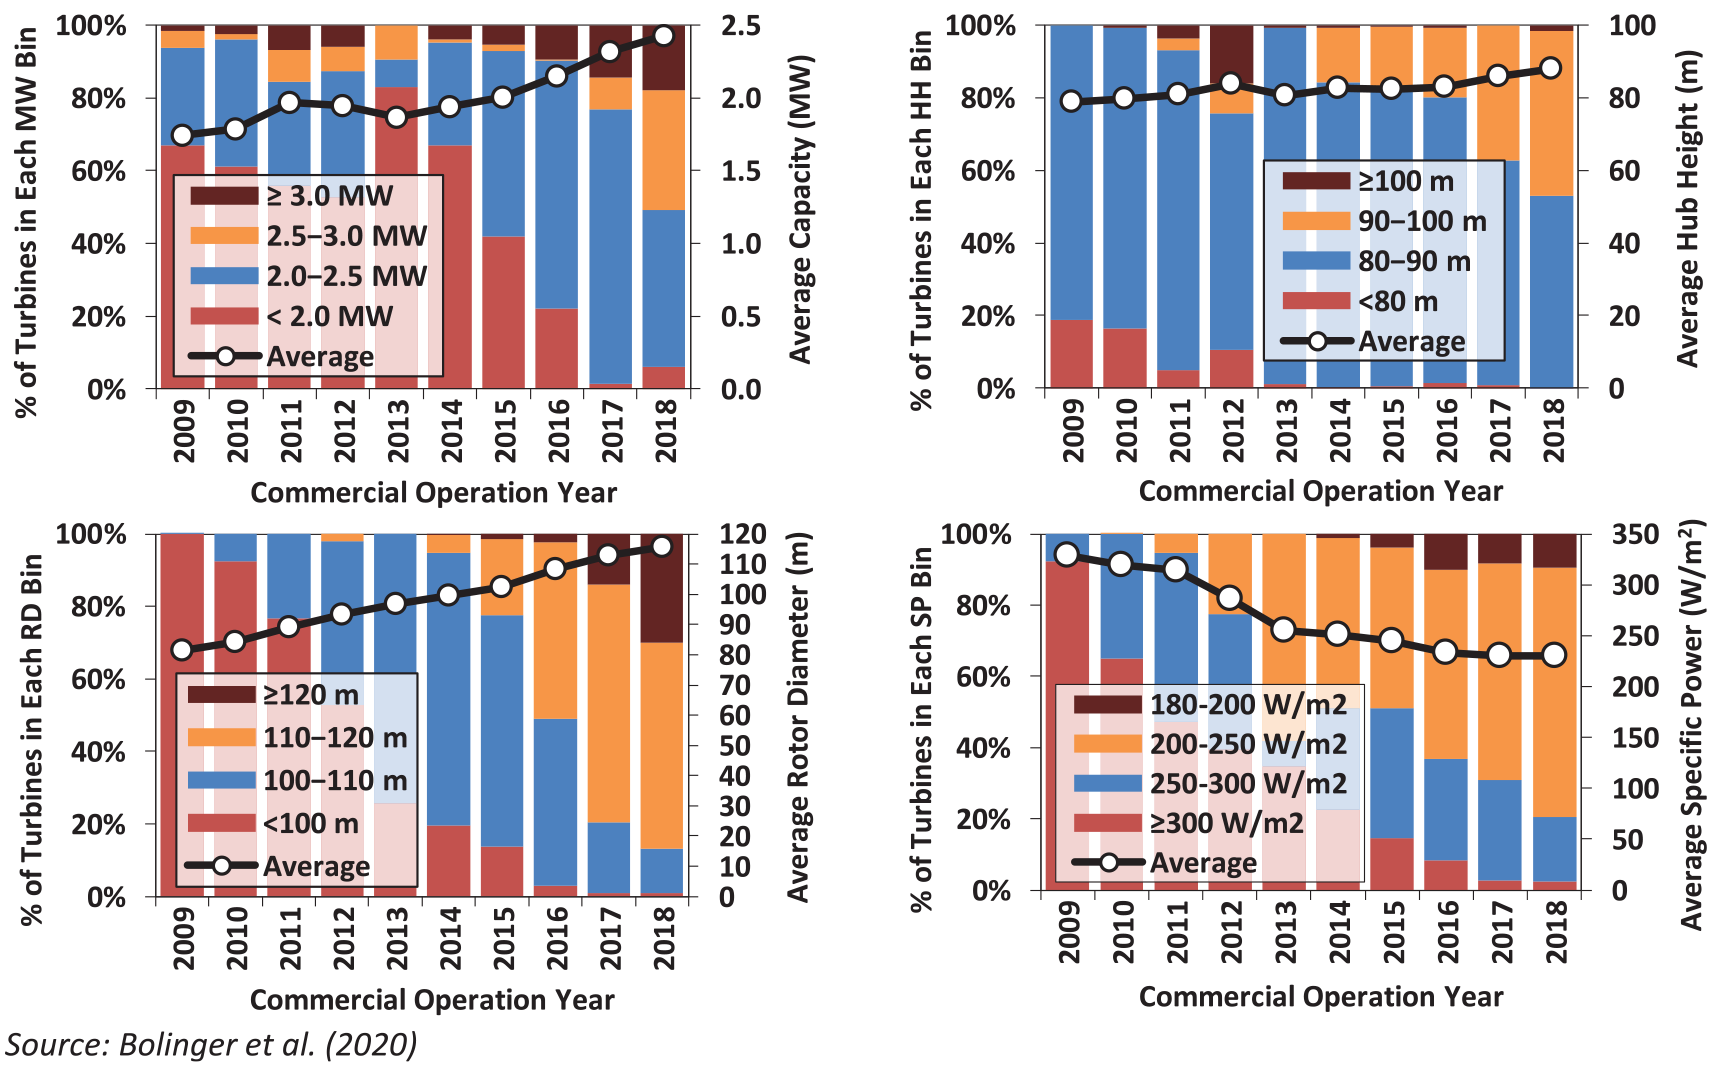
Trends in turbine capacity, HH, RD, and SP.
This growth in the size of wind turbines deployed on land has brought many benefits, not least of which has been a progressively lower levelized cost of energy (LCOE) (Bolinger et al., 2021; Wiser et al., 2011). Larger capacity turbines drive lower LCOE by spreading any per-turbine fixed costs—whether upfront capital expenditures or ongoing operating costs—over a larger number of megawatts. Taller towers enable turbines to access higher wind speeds, improving capacity factors. Finally, larger rotors increase energy capture and, if paired with a reduction in SP, also increase capacity factors. The latter is due to the fact that with a given turbine capacity, a larger rotor captures more of the energy in the wind flowing past a turbine, and therefore, runs the generator closer to or at its rated capacity a greater percentage of the time. The result is more megawatt hours of electricity generated per MW of capacity installed, yielding a higher capacity factor. The sum total of these turbine design trends has been a steep historical decline in the LCOE of land-based wind, from the early 1980s to the present (Bolinger et al., 2021; Duffy et al., in press; Veers et al., 2019; Williams et al., 2017).
While further turbine growth is expected, uncertainty remains on the magnitude of the continued trend. Previous research demonstrates that taller towers and larger rotors can further increase the performance of wind power plants, boosting capacity factors and potentially enabling economic wind development in lower wind speed areas (Burt et al., 2017; Capps et al., 2012; DOE, 2015; Lantz et al., 2019; Rinne et al., 2018). Wiser et al. (2016) surveyed some of the world’s leading wind experts, and found that continued growth in turbine size—capacity, rotors, and towers—is expected to be the single largest driver of LCOE reductions by 2030. More recently, Bolinger et al. (2021) employed geospatial analysis across the United States and found that, under reasonable assumptions, turbines sized at 5 MW and with a SP of 150 W/m2 and a HH of 140 m may have an LCOE advantage of US$6/MWh (on average), when compared with equivalent turbines with a SP rating of 230 W/m2. Yet, the degree to which these LCOE advantages are ultimately realized, and at what point turbine size plateaus, will be determined by the success of continued design and materials optimization, by social acceptance and regulatory hurdles, and by the logistical constraints and costs of transporting and erecting even-larger blades, towers, and nacelle components (DNV, 2019; DOE, 2015; McKenna et al., 2016).
Our analysis builds on and contributes to this literature on the benefits and challenges associated with taller, lower specific power turbines by focusing not on LCOE as commonly assessed, but instead on several somewhat-less-recognized potential advantages. Most significantly, we show that such turbines tend to have a higher “market value” in wholesale power markets, especially in regions with higher levels of wind penetration. We also show, through several first-order estimates, that such turbines deliver three additional smaller-scale benefits: reduced electric transmission expenditure, lower balancing costs for the electricity system, and lower financing costs. While other research has also assessed a number of these possible advantages (as discussed in detail in the next section), the extant literature has tended to use electric system models to predict future benefits at higher levels of wind penetration. In contrast, we demonstrate that these benefits can already be observed today in wholesale power markets across the United States, and that the scale of the advantage varies from one location to the next.
Background on “hidden” values
Market value
Reducing the LCOE from wind plants has been a fundamental driver in the industry. As a relatively new electric generation technology, achieving costs comparable with other sources of generation has been viewed as a pre-condition for significant market growth. The LCOE of land-based wind has, therefore, been a useful metric to assess progress over time and across geographic locations, and to quantify the potential for technological innovation to reduce the cost of wind in the future.
At the same time, wind plants operate within a broader electricity system that includes various types of generation facilities, each with distinct technical and economic characteristics. The plant-level LCOE of any one of these technologies must be weighed against the value that that technology provides to the broader electricity system, in terms of energy supply as well as other characteristics required to maintain economic and reliable operations. Ultimately, it is the overall cost of the entire electricity system that matters to planners and end-use consumers, encompassing considerations of both the cost and value of each individual grid component (Edenhofer et al., 2013; Joskow, 2011; Wiser et al., 2017). As we describe below, low-SP, tall-tower wind turbines potentially deliver more value to electricity systems than do higher-SP and shorter-tower turbine variants.
The value of a generation technology can be thought of as equating to the electric system costs that can be avoided because of utilizing the technology in question. A technology that delivers electricity supply during periods of peak demand and that provides quick-response flexibility will tend to offset more costs—and so provide more value—than a technology that lacks flexibility and only supplies power when load is modest and otherwise met with low-cost generation.
Costs that might be avoided (or incurred) include, but are not limited to, those related to energy supply, capacity adequacy, and short-term balancing. Competitive wholesale power markets of the form that exist in many regions of the world seek to provide price signals that approximate these avoided costs. Seven such markets—each run by an Independent System Operator (ISO)—exist in the United States. 1 While each market differs in its design, all feature an energy market through which wholesale power prices are established on a sub-hourly basis, and across a total of more than 60,000 pricing points. The “energy value” of a technology can, in this context, be thought of as equivalent to the ability of the technology to offset the production costs of other resources; within the seven US ISOs, sub-hourly locational marginal energy prices (LMPs) can be used to estimate this value. “Capacity value” measures a generator’s contribution to overall long-term resource adequacy via its ability to offset the need (and cost) for capacity from other sources. Six of the seven ISOs in the United States feature capacity markets or obligations, and thereby, deliver some value to generators based on their capacity contributions, albeit with very different designs from one market to the next. Electric Reliability Council of Texas (ERCOT; in Texas) does not have a capacity obligation, but instead allows energy-market LMP to rise to high levels during periods of system stress. Finally, each of the ISOs features balancing markets, through which flexibility services are purchased to manage short-term fluctuations in supply and demand.
The prices for electricity services (energy, capacity and balancing) and the quantity of services provided by a generator dictate the revenue that it might earn if it sells into wholesale markets—in effect, its “market value.” For wind power, energy and capacity markets are the most relevant; with few exceptions, wind does not yet participate in balancing markets, though this may change in the future.
Wind projects sometimes directly bid into wholesale markets, in which case the market value estimate equates to generator revenue. In other cases—especially when a power purchase agreement or feed-in tariff is in place—the wind energy purchaser may schedule the wind energy into the market, paying the wind project owner a pre-negotiated price but earning revenue from the prevailing wholesale market price. In either instance, the revenue earned (or that could have been earned) from the sale of wind into wholesale markets is reflective of the market value of that generation from the perspective of the electricity system. In the case of merchant wind projects, the link is direct and affects the revenue of the plant. In the case of wind projects sold under a fixed-price contract, on the other hand, the pre-negotiated contract price establishes plant revenue and, depending of the specifics of the contract, pricing may or may not be linked to wholesale market prices. In this latter case, however, the revenue earned or that would have been earned by the sale of wind in the wholesale market still reflects the underlying market value of that generation—i.e., it is the cost avoided by the purchaser, who could have, in theory, obtained power from the wholesale market instead of from the wind project. Thus, whether a wind project operates on a merchant basis (i.e., selling directly into wholesale power markets) or instead sells power under a long-term contract, its actual or estimated revenue, respectively, from participating in the wholesale market reflects its market value.
Though the wind sector has historically focused on minimizing LCOE, as wind energy supply increases there is a growing need to assess the impact of wind technology choices on market value (Duffy et al., in press). Research has shown that the market value of wind tends to decline as wind penetrations increase (e.g. Bistline, 2017; Hirth, 2013; Mills and Wiser, 2014). This is, in part, because low-marginal-cost wind plants push local wholesale energy prices lower when wind output is high. More generally, the temporal profile of wind output is not always well-aligned with system needs, potentially further reducing the energy market value of wind generation. And, because wind power deployment is sometimes concentrated in areas with limited transmission capacity, wholesale energy prices at the local pricing points to which wind plants interconnect are often suppressed even further. Some of these tendencies apply equally well to wind’s capacity value, which is impacted by the cost of capacity but also by regional rules that define the credit that wind receives for providing capacity during periods of system need. In sum, these trends suggest that the wholesale energy and capacity value of wind will decline with penetration, and may in general be somewhat lower than the market value of other generation sources.
Wiser and Bolinger (2019) calculate the market value of existing wind plants in the United States. They show that the market value of wind has generally declined over the last decade, with lower values experienced in regions of the country with higher levels of wind penetration. The average market value of wind in 2018 was the lowest in Southwest Power Pool (SPP; US$17/MWh), ERCOT (US$18/MWh), and Midcontinent Independent System Operator (MISO; US$22/MWh), whereas the highest value market was ISO-New England (ISO-NE; US$41/MWh). Energy value represented the largest share of the total, with capacity value varying widely regionally and being considerably lower in absolute magnitude.
Various options exist to increase the market value of wind. Some are outside the direct control of the wind industry: for example, the flexibility of other supply options, transmission expansion, storage, and load flexibility (Bistline, 2017; Denholm et al., 2016; Hirth, 2016; Mills and Wiser, 2015; Obersteiner, 2012; Winkler et al., 2016). Yet other options, however, can be impacted by the wind industry. Developers might optimize the siting of wind plants, focusing on areas where the output profile better matches system needs, or might instead pair wind with storage as part of a hybrid plant (Ederer, 2015; Fripp and Wiser, 2008; Mills and Wiser, 2015).
Of relevance to this article is that the higher capacity factors associated with low-SP, tall-tower turbines should improve the market value of wind energy. This is because such turbines tend to shift wind generation from high wind hours—when wholesale power prices are more likely to be depressed by an oversupply of wind generation—to lower wind hours, when there is generally less wind generation and so less suppression of local wholesale power prices. The reason for this relative shift in wind production is that such turbines are specifically tuned to maximize generation in lower wind speeds (capturing more energy due to larger rotors), whereas maximum wind production is more likely to be capped (due to relatively lower nameplate capacity, relative to energy production).
Modeling studies from Europe (summarized in Table 1) confirm this intuition. At low wind penetration levels, with little wind-induced suppression of wholesale power prices, most of these studies find little or no incremental market value provided by low-specific-power, tall turbines. Above 5−15% wind penetration, however, these turbines provide meaningful incremental market value that grows with penetration. At penetration levels of 30−50%, as shown in the table, taller turbines with lower SP ratings are found to increase market value by 8−30% (US$3−US$15/MWh), depending on the scenario.
Impact of low-SP, tall-tower turbines on market value in the electricity system.
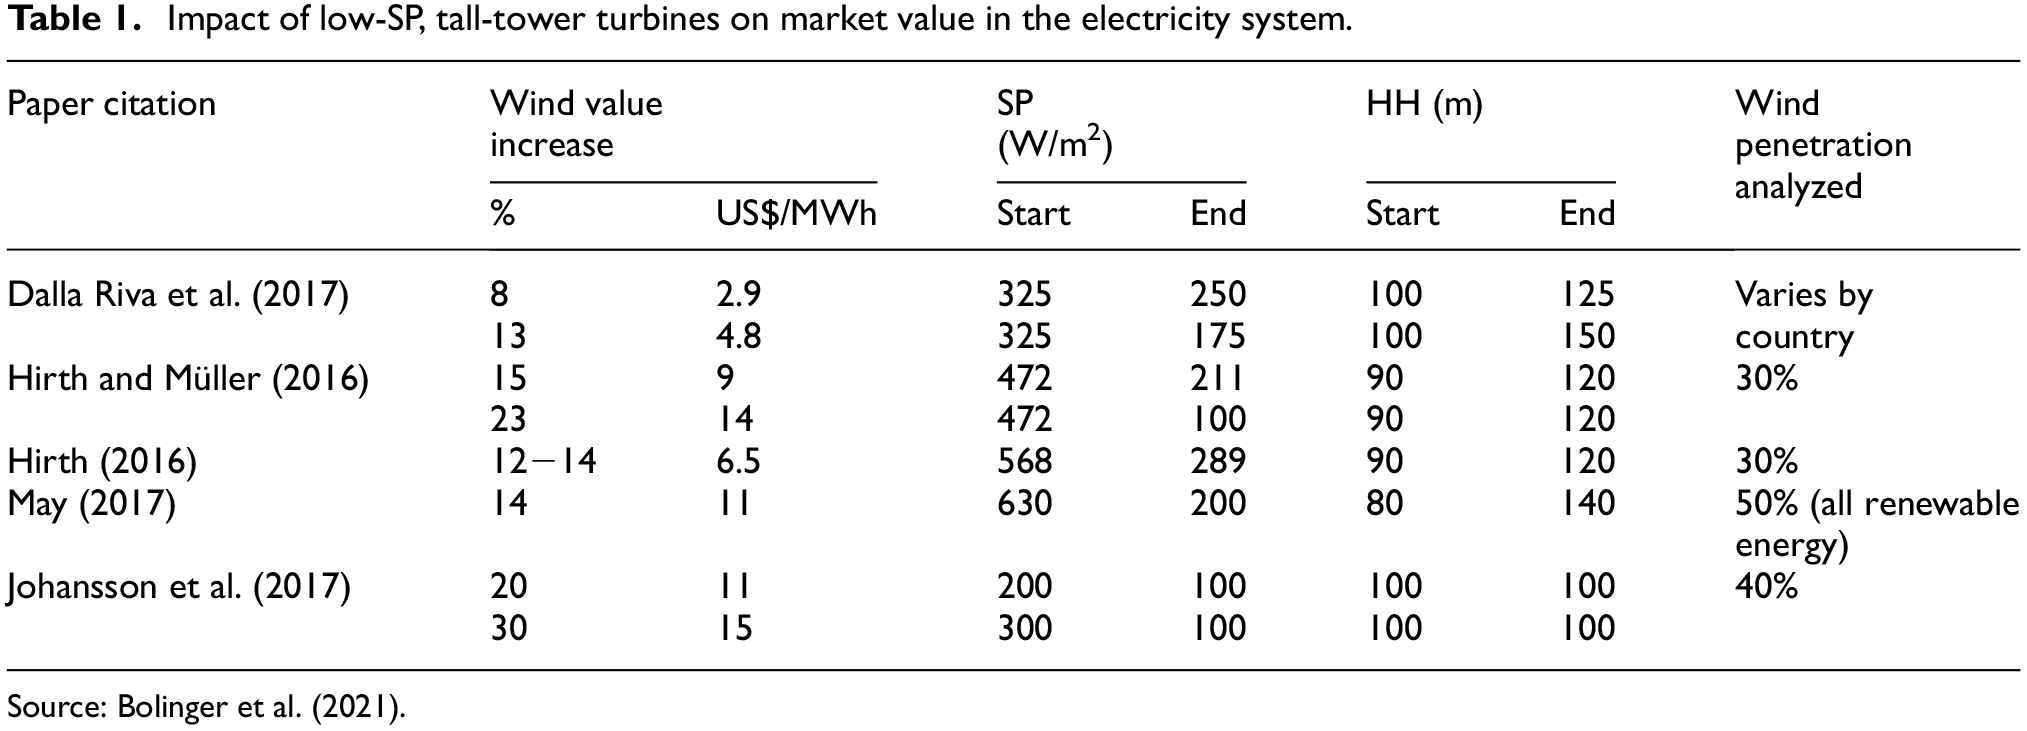
Source: Bolinger et al. (2021).
Our primary focus in this article is to build on the European literature summarized in Table 1 by demonstrating that the impacts theorized in this modeling literature can already be observed in US wholesale power markets today. In doing so, we bolster the case that turbine designers, project developers, and wind power purchasers should consider these value-based impacts in their decisions. We also illustrate the regional variability in the value enhancement from low-SP, tall-tower turbines; we parse the impact of SP and tower height on the results; and we separately show the impacts on energy and capacity value—each adding depth and nuance to our core messages.
Transmission, balancing, and financing
While our principal focus is on market value differences, we also conduct a first-order assessment of three other potential benefits that are not normally covered in LCOE-based comparisons:
First, in part following Hirth and Müller (2016), we posit that the higher capacity factors enabled by low-SP, tall-tower turbines can increase transmission utilization. Gorman et al. (2019) find that wind can, in some cases, impose relatively sizable incremental transmission needs. By spreading these transmission costs across a greater amount of generation, low-SP turbines incur lower transmission expenses on a US$/MWh basis—an impact that is not captured fully in the market value comparisons described earlier.
Second, following conceptually from Hirth and Müller (2016), we also assess the potential impact of low-SP, tall-tower turbines on wind power forecast errors and ramps associated with sub-hourly variability. Large errors and ramps increase the amount of balancing reserves needed to maintain grid operations in real time. The steeper power curve of low-SP, tall-tower turbines can increase the size of large forecast errors and ramps. However, by spreading these balancing costs across a greater amount of generation, such turbines may result in lower balancing costs on a US$/MWh basis.
Finally, we assess the potential for low-SP, tall-tower turbines to reduce the cost of financing wind assets. Wind projects face variation in wind resource conditions from one year to the next, and therefore, inter-annual changes in wind generation. Lenders account for this variability when determining how much debt a project can service without risking default during low wind years. Because they spend more time operating at rated capacity, low-SP, tall-tower turbines face less inter-annual variability (IAV) in output, potentially enabling greater use of low-cost debt in place of higher cost equity capital, which leads to a lower weighted-average cost of capital (WACC).
Data and methods
Turbine configurations
Our analysis considers multiple turbine configurations intended to illustrate past, current, and potential future designs—varying nameplate capacity, tower (aka hub) height, RD, and SP (Table 2). We feature two of these designs in our analysis: a turbine with characteristics similar to the average turbine newly installed in the United States in 2018 (2.4 MW, 88 m HH, and 230 W/m2 SP), and a scaled-up low-SP, tall-tower turbine (5 MW, 140 m HH, 150 W/m2 SP). A SP of 150 W/m2 is aggressive as it is at or below the low end of the range of commercially available machines today; the 140 m HH is, in part, based on ground clearance needs for 5 MW turbines fitted with the large blades necessary to achieve very low-SP. In addition to these two core turbines, portions of our analysis include a turbine similar to the average design employed in 2009, to contrast the benefits of current designs with those of the past. We also include two turbines that have similar characteristics to those employed in 2018, but with different HHs and SP, respectively, to assess whether SP or tower height are more important in boosting market value. Finally, we include a higher SP turbine that also features a larger capacity and HH; this design is generally commensurate with the latest turbine offerings by the major global wind turbine manufacturers. Power curves for each turbine configuration were created using the National Renewable Energy Laboratory (NREL) System Advisor Model (version 2018.11.11 r3).
Turbine configurations considered in analysis.
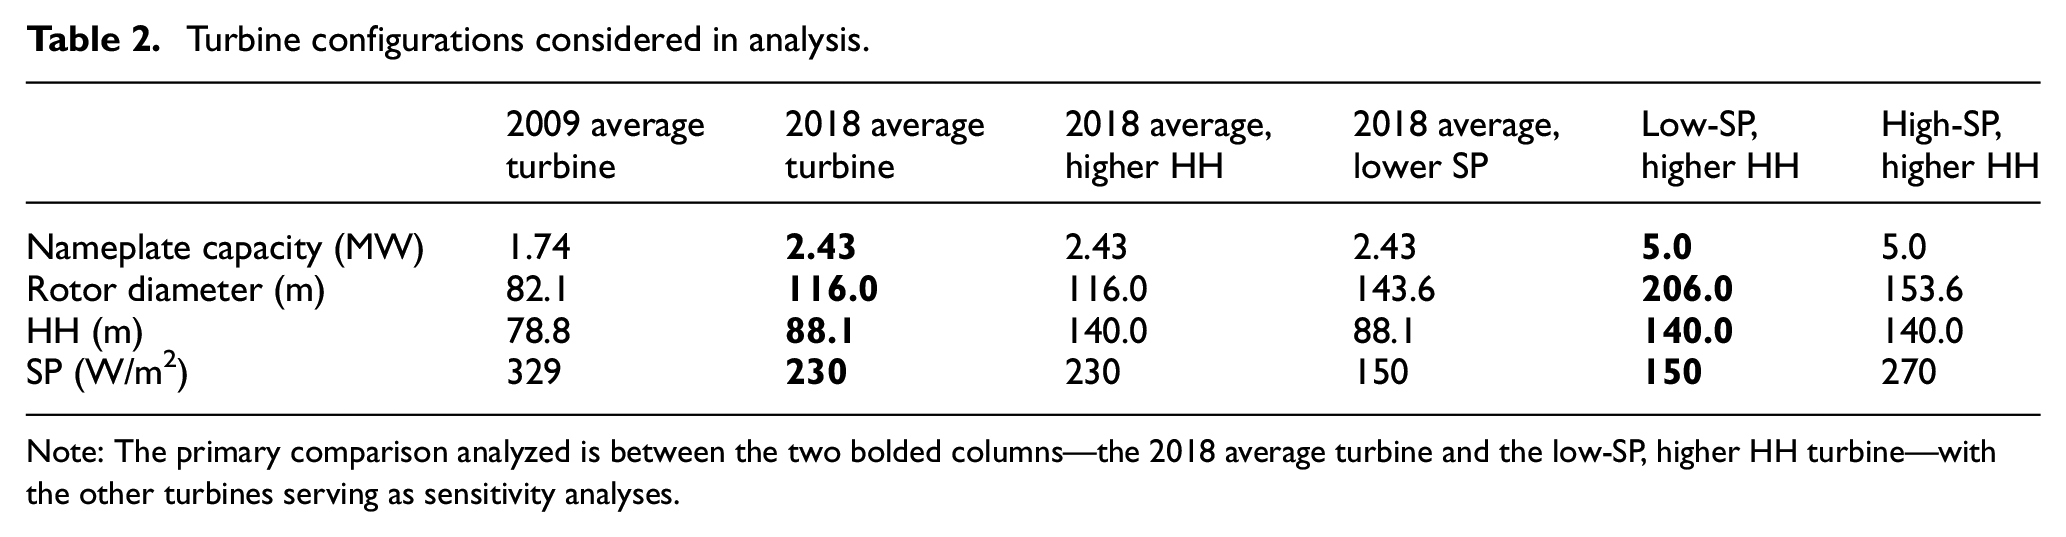
Note: The primary comparison analyzed is between the two bolded columns—the 2018 average turbine and the low-SP, higher HH turbine—with the other turbines serving as sensitivity analyses.
Hourly wind output
We focus the market value assessment on 2018, using hourly wind output and wholesale energy and capacity prices, costs and rules for that year. We only include the regions covered by the seven ISOs, and conduct our analysis across 687 individual wind-project sites, each consistent with the location of an existing project. Hourly wind output for each turbine is estimated using hourly wind speed data as described below, turbine-SP curves as described above, and under the simplifying assumptions of zero losses and that plants curtail output when wholesale prices are negative (see Figure 2).
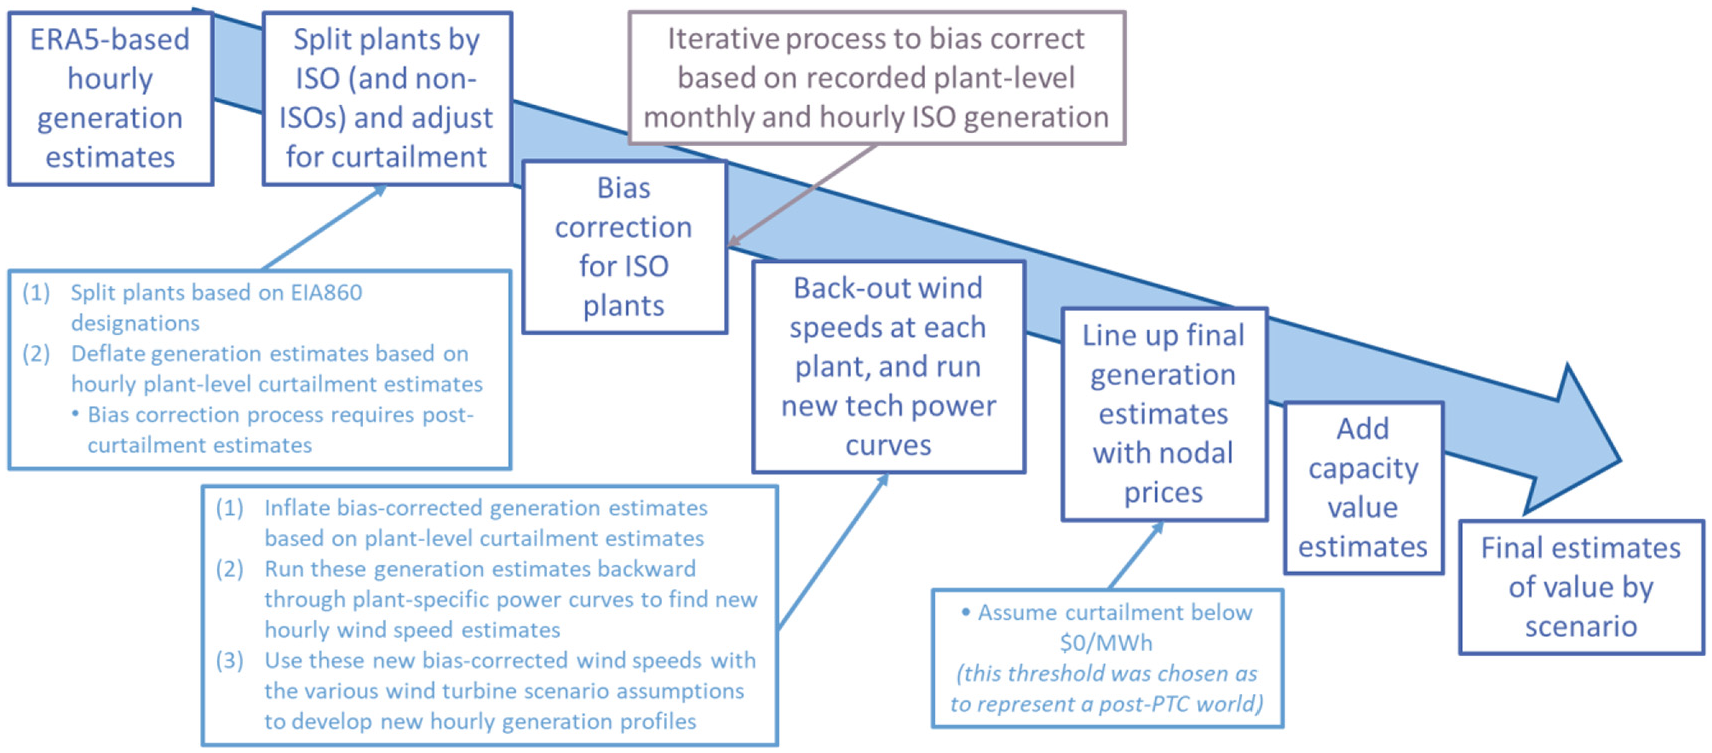
Visual representation of market value assessment, with focus on wind speed simulations.
Public data do not broadly exist for plant-level hourly wind speeds at HH. As such, after validation of several alternative approaches considering inter-annual, seasonal, and diurnal trends, we opted to simulate plant-level wind speeds by leveraging ERA5-based reanalysis modeled wind speed data. Because reanalysis data, including ERA5, has coarse geographic representation and may contain bias, we adjust and bias-correct the data using available recorded wind generation. The resulting estimates therefore incorporate publicly available information on actual generation as well as site-specific ERA5-modeled wind speeds, improving the accuracy of the simulations.
Specifically, we start with site-level hourly wind speeds (i.e. from ERA5) and determine plant-level generation using the power curve of the dominant turbine type actually in use at the pre-existing wind project site. We then adjust this hourly generation estimate to be consistent with available recorded generation, after first accounting for any plant-level curtailment in the generation records. 2 Available generation records include monthly plant-level generation from the Energy Information Administration (EIA) and hourly region-wide ISO-level wind generation. An iterative process was used to ensure that each plant’s generation estimate matches the monthly totals while the sum of plants over an ISO match the hourly ISO-wide records. After this adjustment, we then back-calculate wind speed using the adjusted generation estimate and plant-specific turbine power curve. We then scale these back-calculated wind speed estimates to different HHs based on the wind shear estimated by ERA5 for particular hours and locations. Finally, we apply these back-calculated wind speed estimates to the multiple turbine variants shown earlier to determine hourly generation for each design and location.
Market value
Once hourly generation for each turbine design and location is simulated, we are then ready to calculate the market value of that generation in 2018, considering energy and capacity value. To do so, we apply hourly wholesale energy prices and ISO-specific capacity rules and costs in 2018.
Specifically, we estimate the energy market value of each turbine design by pairing the hourly wind output profile described above with real-time hourly wholesale energy prices at the nearest pricing node (price data come from ABB’s Velocity Suite database). Capacity values are estimated based on the modeled wind profiles and ISO-specific rules for wind’s capacity credit and ISO location-specific capacity prices or costs. 3 No capacity value is calculated for ERCOT because it runs an energy-only market that does not require load-serving entities to meet a resource adequacy obligation. Energy and capacity values are then summed for each turbine. In some cases, market value estimates are averaged regionally and nationally. Ultimately, our approach considers the output profile of wind for each turbine design and location, and how those characteristics interact with local wholesale energy and capacity prices and rules, yielding an estimate of the revenue that would have been earned had wind sold its output at the hourly LMP and also considering any available capacity-based revenue.
A few additional points of clarification are important. First, our analysis is conducted on a marginal “price taker” basis, in effect assuming that the modeled turbines are deployed on the margin and do not affect the underlying wholesale prices differently from those observed historically; this may tend to over-state impacts from what would otherwise be anticipated. Second, our analysis allows the modeled wind turbines to be deployed at any existing site in the United States, regardless of the suitability of the site for the turbine in question; in reality, the lowest SP turbines would not be expected to deploy in the highest-wind sites. Third, our assessment of capacity value is based on the market rules, capacity credit, and capacity costs consistent with historical practice and rules in each ISO. Of note is that rules in California Independent System Operator (CAISO) do not enable turbine design variations to impact capacity value, and that ERCOT has no capacity requirement (and, therefore, no capacity value). Fourth, our analysis is restricted to 2018 in the seven ISO regions; market value estimates would be expected to differ in other years and regions, though we posit that the 2018 results presented here are broadly representative of current conditions.
Transmission, balancing, and finance costs
We also include first-order assessments of three other benefits of low-SP, tall turbines. In each case, we focus on only the two core turbine variants: the 2018 average turbine, and the low-SP, tall-tower turbine.
Transmission costs
Our analysis considers the three types of transmission expenditures that can be associated with wind plants and that might benefit from low-SP, tall wind turbines. (1) Spur-lines reflect any transmission between the wind plant and the substation, and are covered by the project owner. We assume an average spur-line distance of 10 miles (16 km), consistent with past US experience, and a cost of ∼US$4000/MW mile, resulting in an upfront cost of US$40/kW. This expenditure is assumed to be financed over 30 years at a 3.5% real WACC, commensurate with private-power debt and equity in the United States in 2018. (2) Interconnection costs reflect the cost (after the spur line) of connecting a plant to the bulk transmission network, including any substation upgrades as well as any transmission network upgrade costs that are specifically assigned to wind plant owners. Gorman et al. (2019) find that these costs have averaged ∼US$70/kW year historically, which are assumed to be paid for and financed by the project owner in the same way as spur-line costs. (3) Finally, bulk network expansion represents any broader upgrades or additional transmission that may be needed for the overall electric network, driven by wind development, often in remote areas. Though these (and the other two categories of), costs can span a very broad range in practice, Gorman et al. (2019) estimate additional network expansion costs of ∼US$390/kW year on average; these are assumed to be socialized and amortized over 60 years by a utility investor at a typical 4.4% real WACC. Note that while the costs associated with the first two transmission needs (spur lines and interconnection costs) are generally borne by wind plant owners, the third category is often socialized, and not paid directly by the wind plant owner. Finally, to estimate the benefits of increased transmission utilization (and so lower transmission build, for a given MWh of wind), we assume an average capacity factor of 42% for the 2018 average turbine and 55% for the low-SP, tall turbine (Bolinger et al., 2021). This results in different estimates of the US$/MWh cost of transmission depending on the turbine employed. Note that we only consider transmission capital costs, and therefore, conservatively assume that differential utilization does not influence transmission operating costs.
Balancing costs
Practices for maintaining a balance between electric supply and demand in the face of uncertainty and variability vary from region to region. Our analysis estimates the impact of low-SP, tall wind turbines on balancing costs based on practices and parameters from the ERCOT market. In ERCOT, two types of reserves depend, in part, on the uncertainty and variability of wind output: (1) non-spinning reserve service, which is established based on the 95th percentile of the net load forecast error and (2) regulation reserves, which are used to manage variability between the 5-min real-time market dispatch interval. Current practice in ERCOT (2019) is to increase non-spinning reserves by about 40 MW per GW of incremental wind. We assume that incremental non-spinning reserves for wind change in proportion to the ratio of the 95th percentile of ERCOT-wide aggregate 3-h persistence forecast errors for the 2018 average turbine and the low-SP, tall turbine. Because large forecast errors increase with the steeper power curve of the low-SP, tall turbine, we find that the incremental non-spinning reserve requirement would increase by 3.6% to about 42 MW per GW of wind. The additional cost of incremental non-spinning reserves is based on the average price in 2018 of US$9.20/MWh (Potomac Economics, 2019). These incremental reserve costs, however, are spread over a greater amount of energy, assuming the same average capacity factor of 42% for the 2018 average turbine and 55% for the low-SP, tall turbine as above.
For regulation, current practice in ERCOT is to increase regulation up by ∼3 MW and regulation down by ∼2 MW per GW of wind. We assume that incremental regulation reserves for wind change in proportion to the 95th percentile of ERCOT-wide aggregate 5-min ramps for the 2018 average turbine and the low-SP, tall turbine. Using a 5-min time series of wind in ERCOT, we find that the incremental regulation up requirement would increase by 1.8% and the regulation down requirement would increase by 1.3%. The average price for regulation up and down was US$14.0/MWh and US$5.2/MWh, respectively, in 2018 (Potomac Economics, 2019). With the low-SP, tall wind turbines, these incremental reserve costs are again spread over a greater amount of energy, reducing the cost per MWh of wind. These balancing costs are currently socialized and are not paid directly by the plant owner. Finally, note that these estimates are based on rules of thumb used by ERCOT for estimating incremental reserve requirements. Actual regulation reserve requirements have decreased over time due to broader operating reforms (Zarnikau et al., 2019).
Financing costs
In a project finance environment, the debt service coverage ratio (DSCR) measures the amount of revenue generated by a project that is available to service debt. Lenders typically require wind projects to maintain a minimum DSCR of around 1.35–1.40 (i.e. a cushion of 35%–40%), which, in turn, limits the amount of debt that wind projects can support. The size of the cushion imposed by the minimum DSCR is directly tied to uncertainty over how much revenue a wind plant will earn, which is driven primarily by uncertainty over how much electricity a wind plant will produce. This uncertainty in annual energy production derives in part from imperfect wind speed measurements, plant losses and component reliability, and IAV in the strength of the wind resource. Based on an analysis of multiple wind sites, we find that the component of overall annual energy production uncertainty that is attributable to IAV is less for the low-SP, tall turbine than it is for the 2018 average turbine (with coefficients of variation of 3.8% vs 5.8%, respectively). This is because the low-SP, tall turbine operates at rated capacity more often than the 2018 average turbine. Assuming that all other remaining contributors to uncertainty in annual energy production aggregate to a coefficient of variation of 6.5% regardless of turbine type, then total production uncertainty comes to 7.5% for the low-SP, tall turbine versus 8.7% for the 2018 average turbine. If recognized by lenders, this small reduction in uncertainty could reduce the minimum required DSCR by 3.5%—meaning that less revenue is required to service a given amount of debt (or conversely, that a given amount of revenue can service a greater amount of debt). For example, this modest reduction in DSCR enables a small increase in the share of debt in the capital stack: from 76.9% for the 2018 average turbine to 78.4% for the low-SP, tall turbine. To estimate the LCOE benefits from this increased leverage, we further assume a US$1400/kW upfront cost for the wind plant, US$40/kW-year in ongoing operations costs, a 45% capacity factor, a debt interest rate of 4.0%, and a 10% rate of return on equity (assumptions largely derived from Wiser and Bolinger, 2019).
Market value enhancements
Starting with the impact of low-SP, tall-tower turbines on market value, we find that the impacts theorized in the earlier modeling literature can already be observed in US wholesale power markets today. In particular, we find that employing low-SP, tall-tower turbines tends to boost summed energy and capacity value, albeit to a much greater degree in regions with high penetrations of wind and/or that face transmission constraints. We further show that, at least for the specific turbine configurations that we compare, this value-enhancement is driven more so by SP than by tower height and that impacts on energy value tend to be larger than impacts on capacity value.
Before describing the results in full, we illustrate the mechanism for how low-SP, tall-tower turbines enhance value using data from a single wind plant in SPP (in Oklahoma specifically). Generally, as tower height increases, average wind speed also increases. If a turbine has a lower SP, it generally requires a lower wind speed to run at its rated capacity. These two effects result in low-SP, tall-tower turbines operating at rated power more of the time compared with standard turbines, and generating relatively more electricity at lower wind speeds. These effects are illustrated in Figure 3(a), which shows the power curve for the average 2018 turbine and for a low-SP turbine, along with the average wind speed (shown by the vertical lines) at the example plant in SPP both at the 2018 average tower height (88 m) and at a taller tower height (140 m). A consequence of these effects is that low-SP, tall-tower turbines feature higher overall capacity factors, and have less variability of output from hour to hour (given the greater proportion of time spent at rated capacity). For the same total energy generated, such turbines shift output away from the windiest hours toward other hours. These effects are illustrated in Figure 3(b), in which the generation from the two turbines is shown across a sample of hours in 2018. The output has been scaled so that total output from each turbine is equal. Figure 3(b) illustrates how a lower proportion of the total output from the low-SP, tall-tower turbine is concentrated in the windiest hours. Finally, as wind penetration in a region increases, the windiest hours generally see the greatest wholesale price declines. Figure 3(c) and (d) illustrates this effect at a single price node in SPP. Here the prices at the example plant are plotted against the relative level of regional wind generation across SPP. In SPP, wind generation accounted for 5.5% of total load in 2011, but 23.9% of total load in 2018. Prices are roughly twice as sensitive to the relative level of wind penetration at this particular node in 2018 compared to 2011 (i.e. the slope of the linear fit is roughly twice as steep in 2018 vs 2011). This illustrates how, especially in a region with high wind penetration, a low-SP, tall-tower turbine can shift generation away from the windiest hours, and thereby increase the average wholesale price it receives for energy generation.
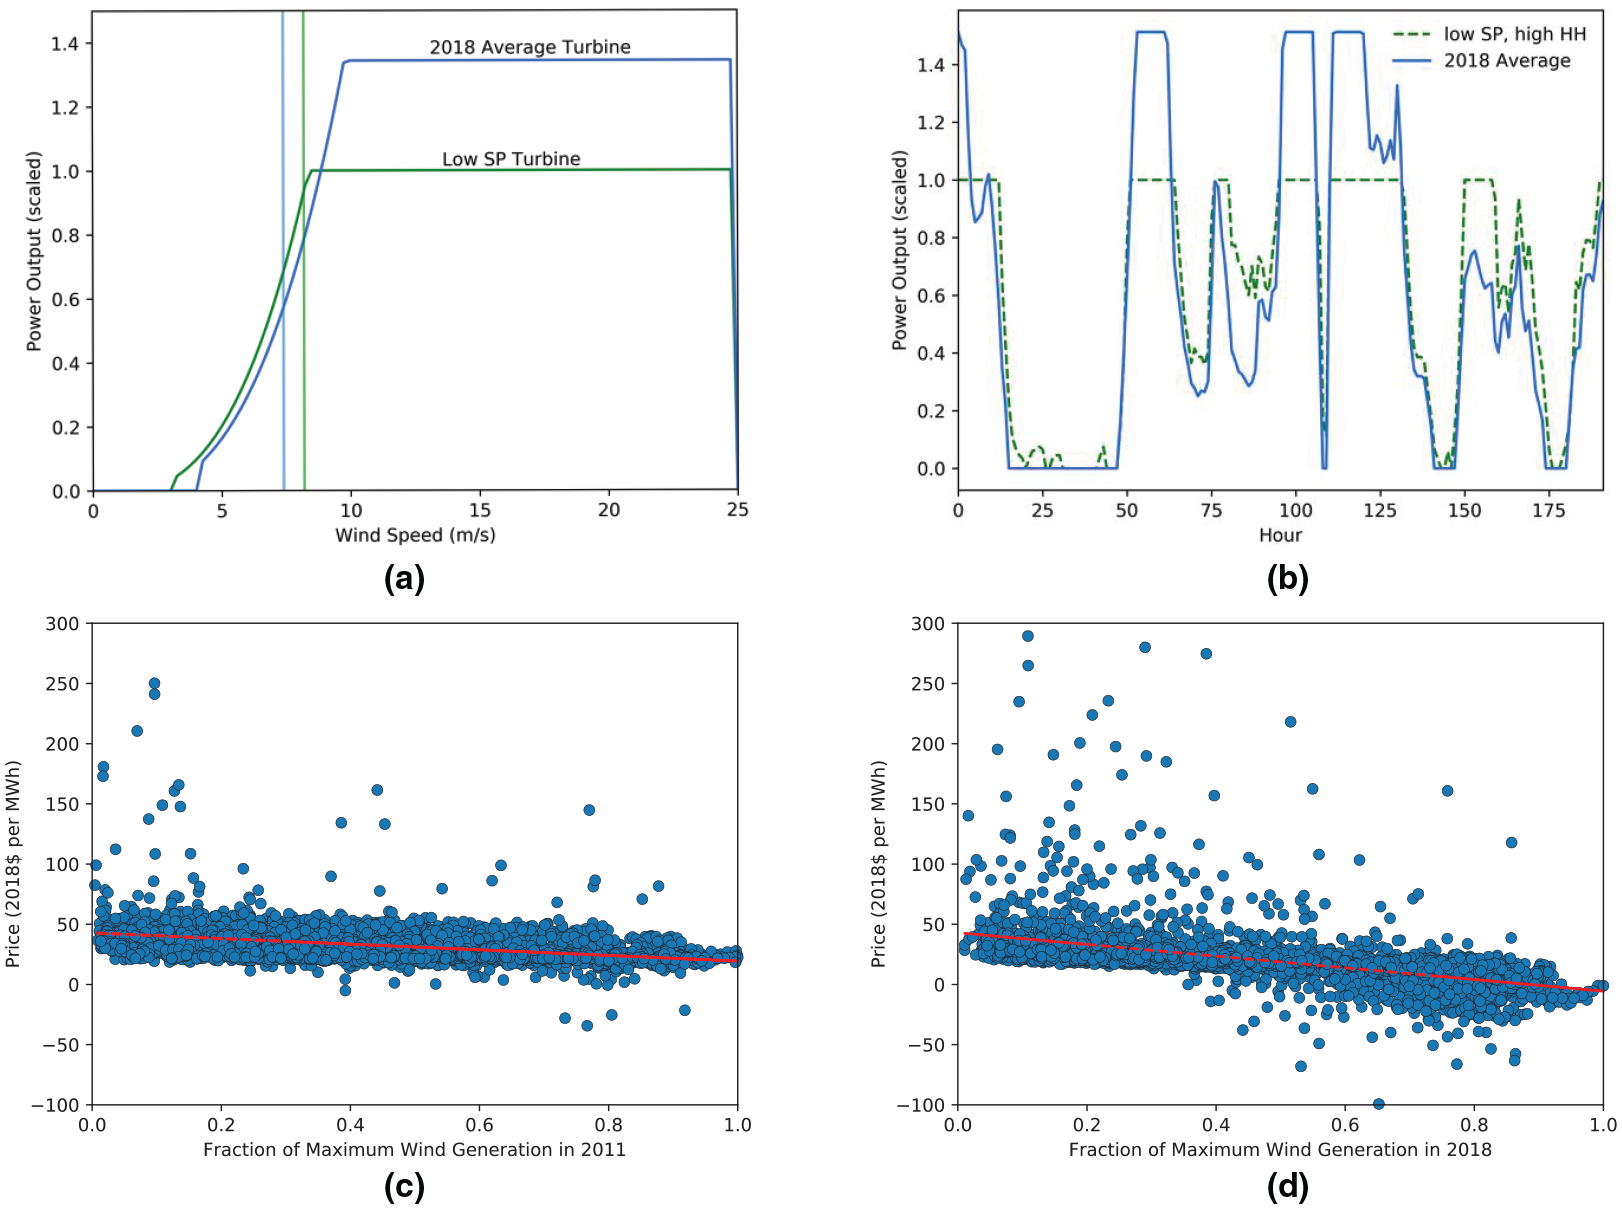
Low-SP, tall-tower turbines shift generation away from the windiest hours toward hours with lower wind resources and higher average wholesale prices. (a) Turbine power curves and average wind speed (vertical lines) at the example site in Oklahoma. Wind speed is shown at 88.1 and 140 m, in blue and green, respectively. Power curves are scaled such that plants with equal total capacity would produce the same output at the example site in 2018. (b) Scaled power output for a sample of hours at the example site. Hourly wholesale real-time price at the example site as a function of SPP-wide wind generation in (c) 2011 and (d) 2018. For readability, hours are sampled from each hundredth of the maximum wind generation, with a maximum of 50 h allowed in each bin.
Low-SP, tall turbine versus 2018 average turbine
Turning to the results of the analysis, we first compare the market value of the 2018 average turbine to the low-SP, tall-tower turbine (5 MW, 150 W/m2, 140 m tower). Figure 4 presents our results for the percentage change in market value associated with the low-SP, tall-tower design relative to the 2018 turbine, in map form and at a project level. Figure 5 presents the same basic results regionally, in histogram form, but here focusing on absolute US$/MWh value changes as opposed to percentage differences.
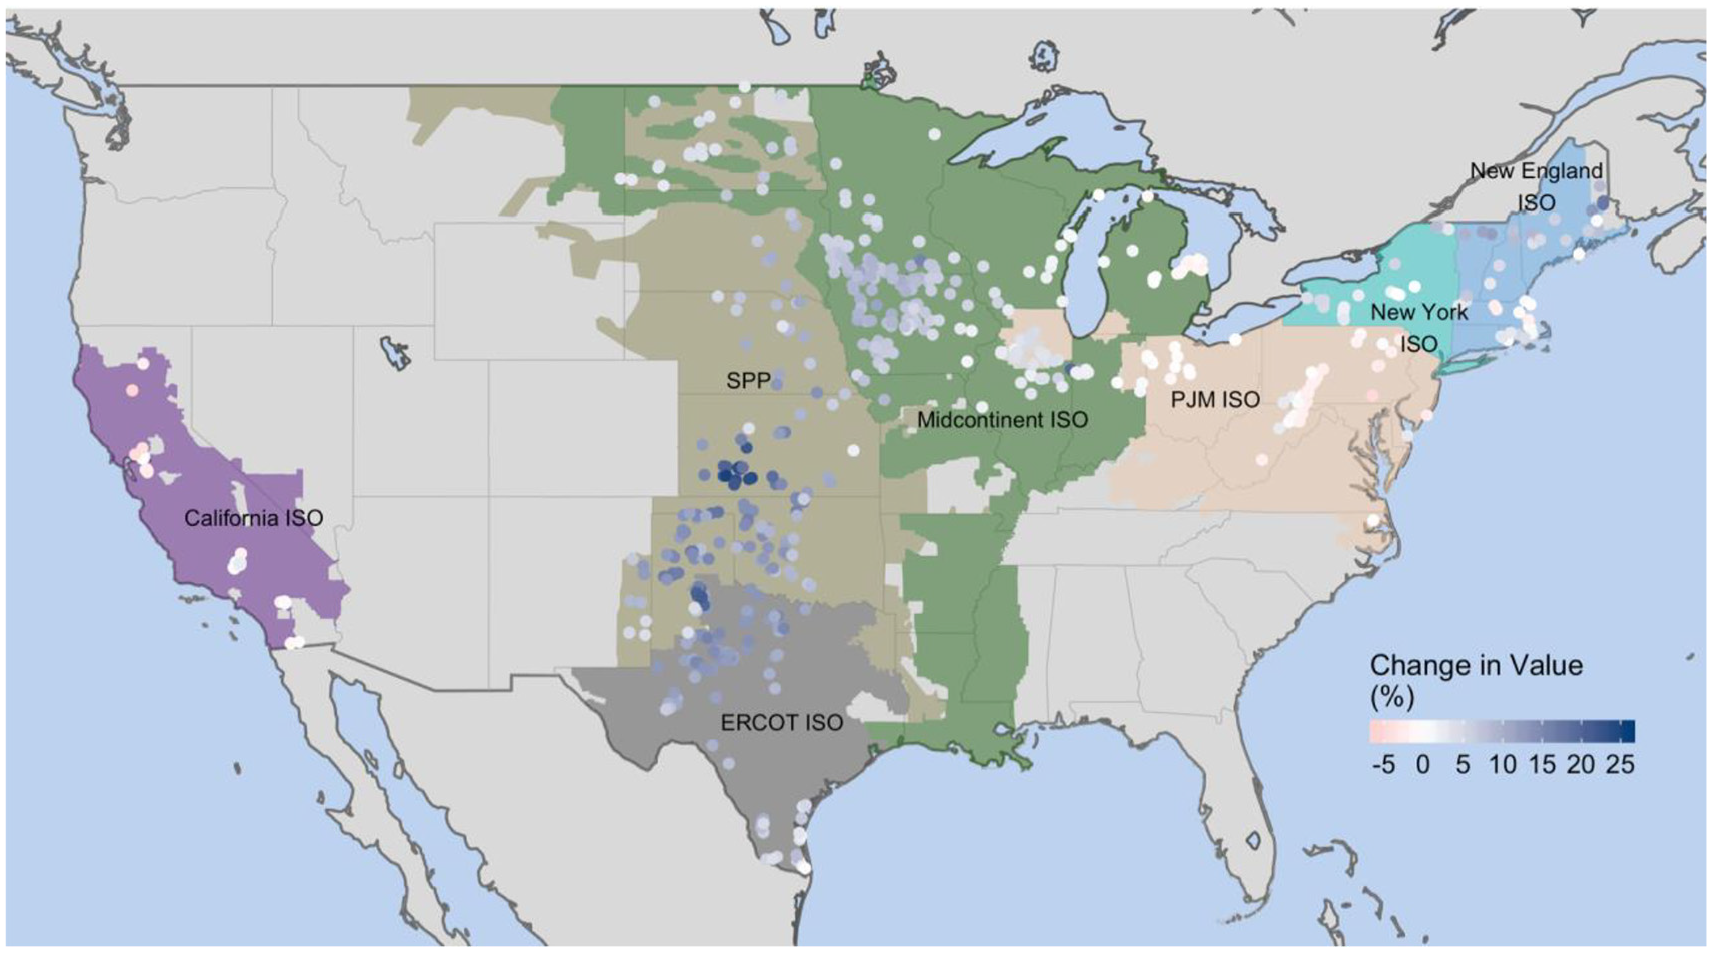
Percentage change in 2018 market value from low-SP, tall turbine versus 2018 average turbine.
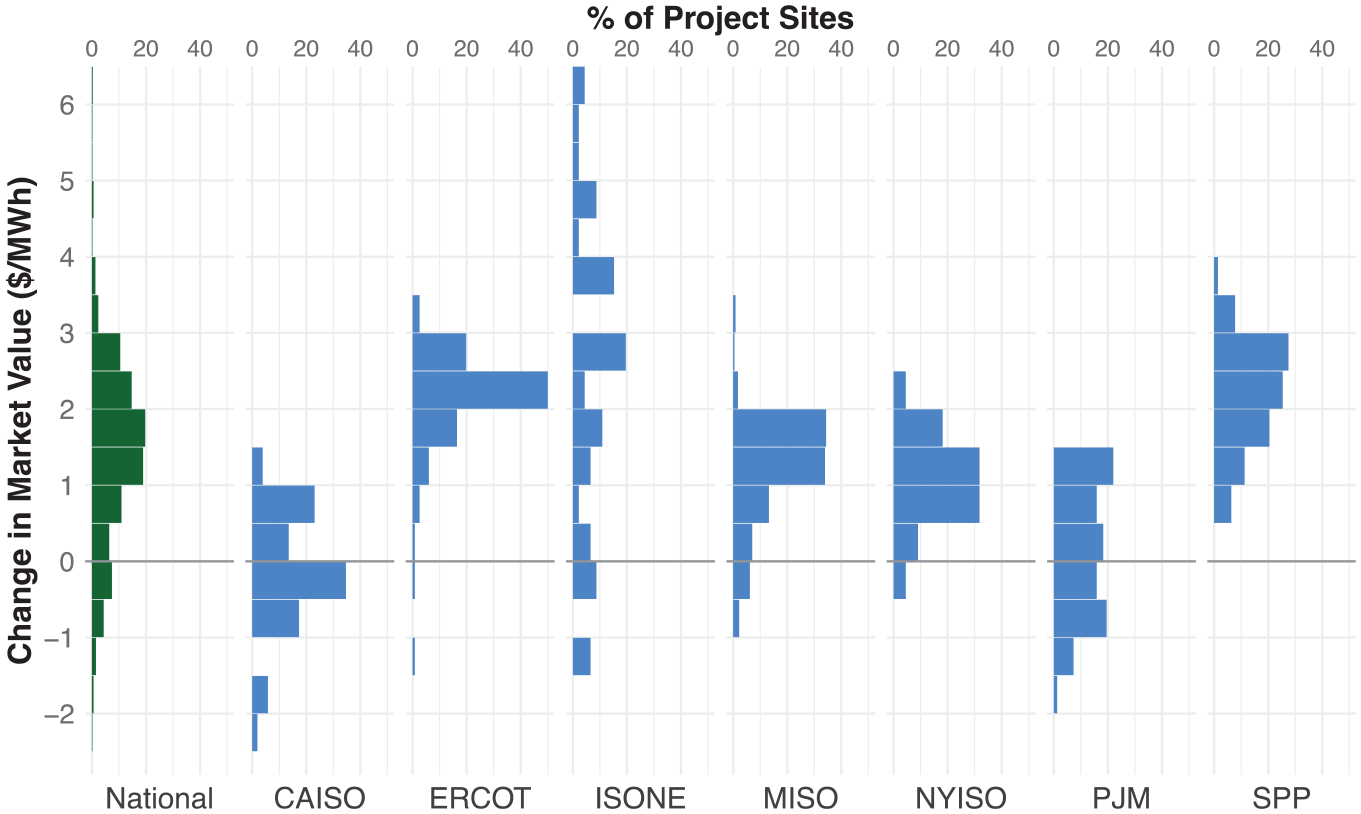
Absolute change in 2018 market value from low-SP, tall turbine versus 2018 average turbine.
As shown in Figure 4, the low-SP, tall-tower turbine tends to have higher market value than the 2018 average turbine. At the same time, there is considerable variability in this value enhancement, both across ISOs and within ISO regions. The value enhancement is as large as + 25% for some projects, while for others there is a reduction in market value by as much as –5%. The greatest value enhancement occurs in ERCOT and SPP, with moderate impacts in MISO, highly variable impacts in New England, and relatively little value enhancement for most sites in CAISO, PJM Interconnection (PJM), and New York Independent System Operator (NYISO).
The absolute value enhancement is impacted both by the percentage increase shown in Figure 4 and also by average regional wholesale prices. As depicted in Figure 5, nationally, there is a normal distribution of absolute change in market value centered between a US$1/MWh–US$2/MWh increase in value, equivalent to a 5%–10% value boost from the low-SP, tall turbine. ERCOT and SPP are centered on a US$2/MWh–US$3/MWh increase, reflecting roughly a 10%–15% increase. Results from ISO-NE vary across an exceptionally large range; higher effects of as much as US$6/MWh are found in northern New England where transmission constraints have been severe. Modest value enhancement is apparent in MISO and NYISO; results from CAISO and PJM are centered on no change in market value.
The results shown in Figures 4 and 5 are impacted, to a degree, by the level of wind generation in each region. For example, wind represents ∼20% of total electricity supply in both SPP and ERCOT, and the value boost from low-SP, tall-tower turbines is most pronounced in those two areas of the country (Figure 6).
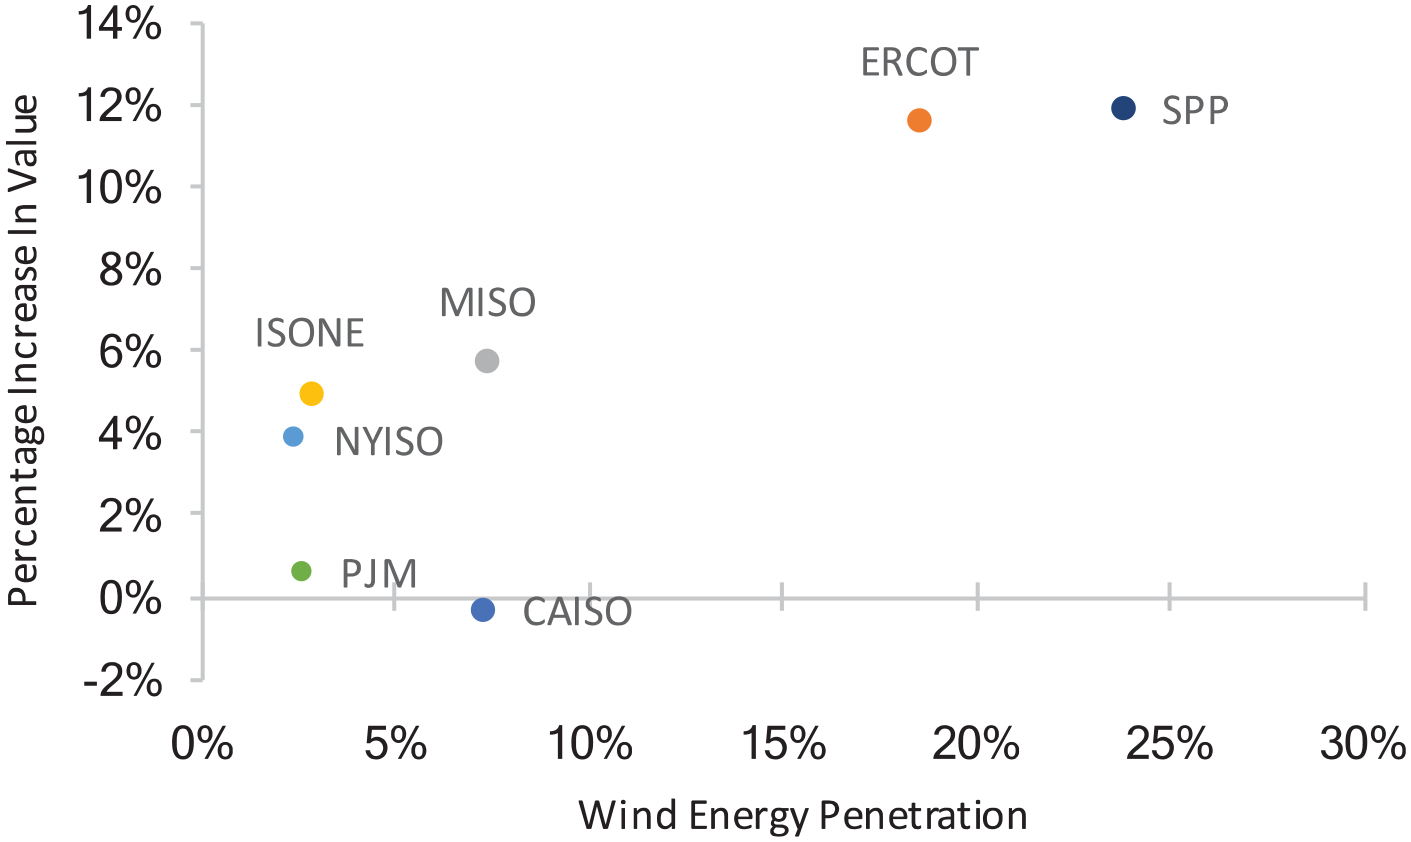
Average percentage change in value from low-SP, tall turbine is correlated with regional wind penetration levels.
These results are primarily driven by changes in energy value, and to a lesser extent capacity value. ERCOT, for example, runs an energy-only market, and the value enhancement shown above is, therefore, exclusively the result of changes in energy value. In SPP, meanwhile, we find that 77% of the value enhancement derives from the energy market, and 23% from estimated capacity value. On a national average basis, energy value represents 82% of the value boost, and capacity value 18%.
Analysis with additional turbine design variants
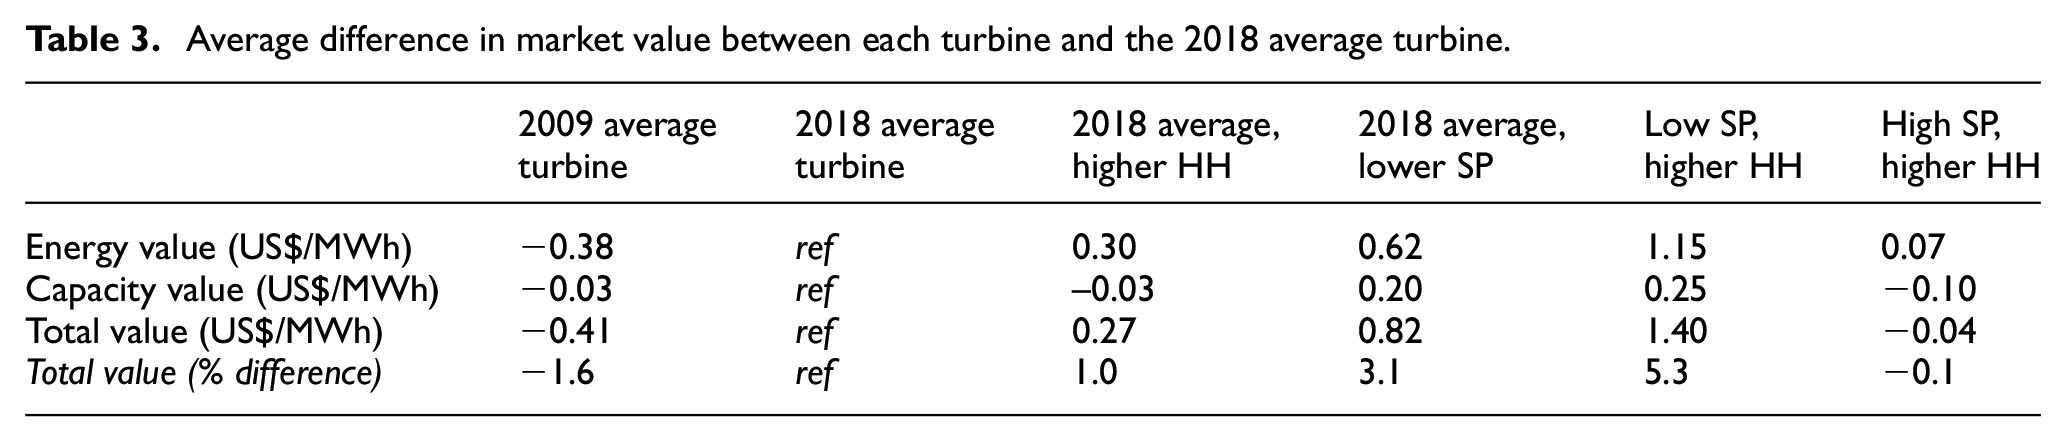
Table 3 summarizes a more complete set of results across all turbine variants, albeit focused on national averages where each turbine design is contrasted with the 2018 average turbine. Figure 7 highlights percentage changes in market value, also inclusive of all turbines designs and relative to the 2018 average turbine, and incorporates regional average results as well as national.
Average difference in market value between each turbine and the 2018 average turbine.
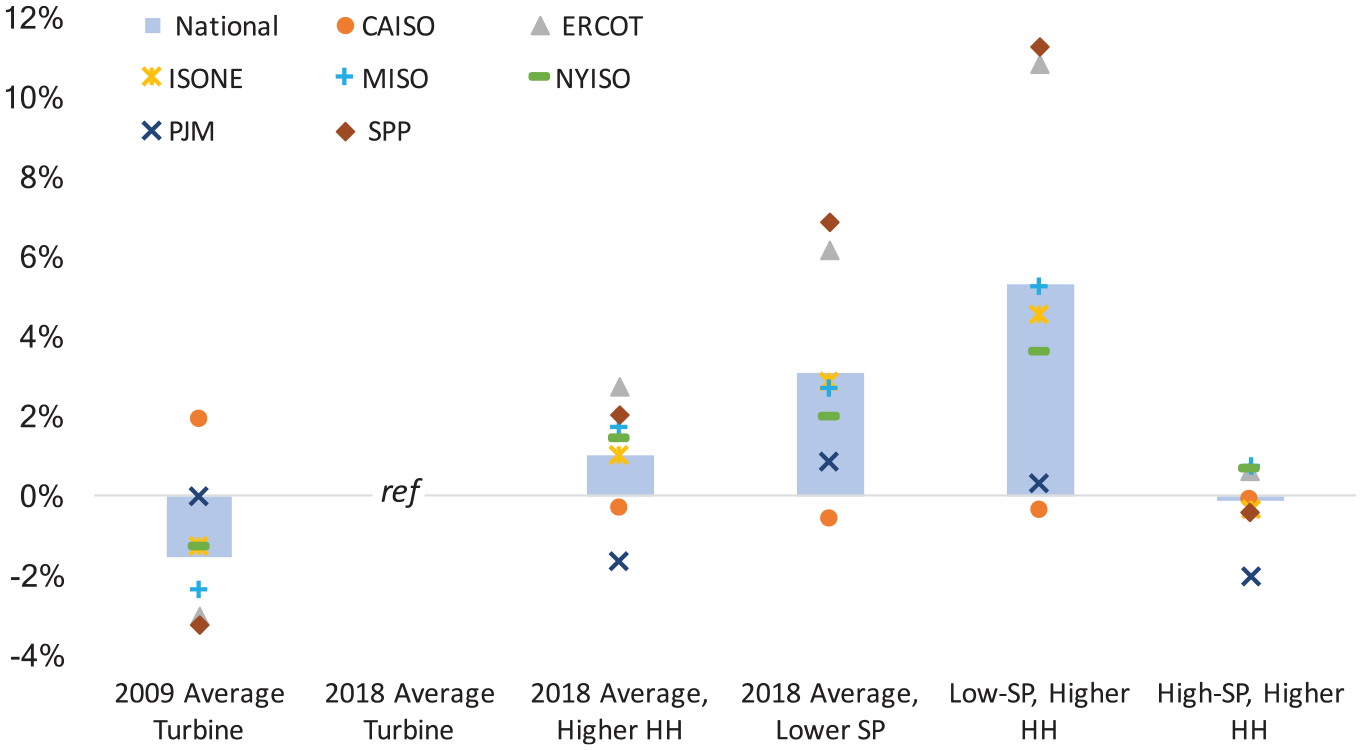
Average percentage change in market value of each turbine relative to 2018 average turbine.
The low-SP, tall-tower turbine is found to produce the greatest increase in market value. The 2009 average turbine, meanwhile, produces less value than the 2018 turbine, indicating that the wind industry has already made strides in boosting value. At least for the turbine configurations that we analyzed, SP plays a larger role in enhancing market value than does tower height: the SP effect is ∼2–3 times greater than the HH effect. In the last column of Table 3, the high-SP turbine features a taller tower than the 2018 average turbine, but a higher SP; these two effects offset each other such that market value is roughly the same as for the 2018 average turbine. Finally, as already indicated earlier, the value boost is due to both energy and capacity value, but energy value dominates on average.
Additional possible benefits
Of the three additional potential benefits noted earlier, transmission savings represent the single largest opportunity (see Figure 8). Using 2018 average turbine characteristics and the assumptions described earlier, total incremental transmission costs for wind in the United States are found to equal roughly US$6.7/MWh. Applying the low-SP, tall-tower turbine drops these costs to US$5.1/MWh, for a savings of US$1.6/MWh. Of the US$1.6/MWh of savings, roughly 25% (US$ 0.4/MWh) accrues to the wind plant owner due to lower spur-line and interconnection costs. The remaining 75% (US$1.2/MWh) reflects a socialized benefit from lower network expansion costs.
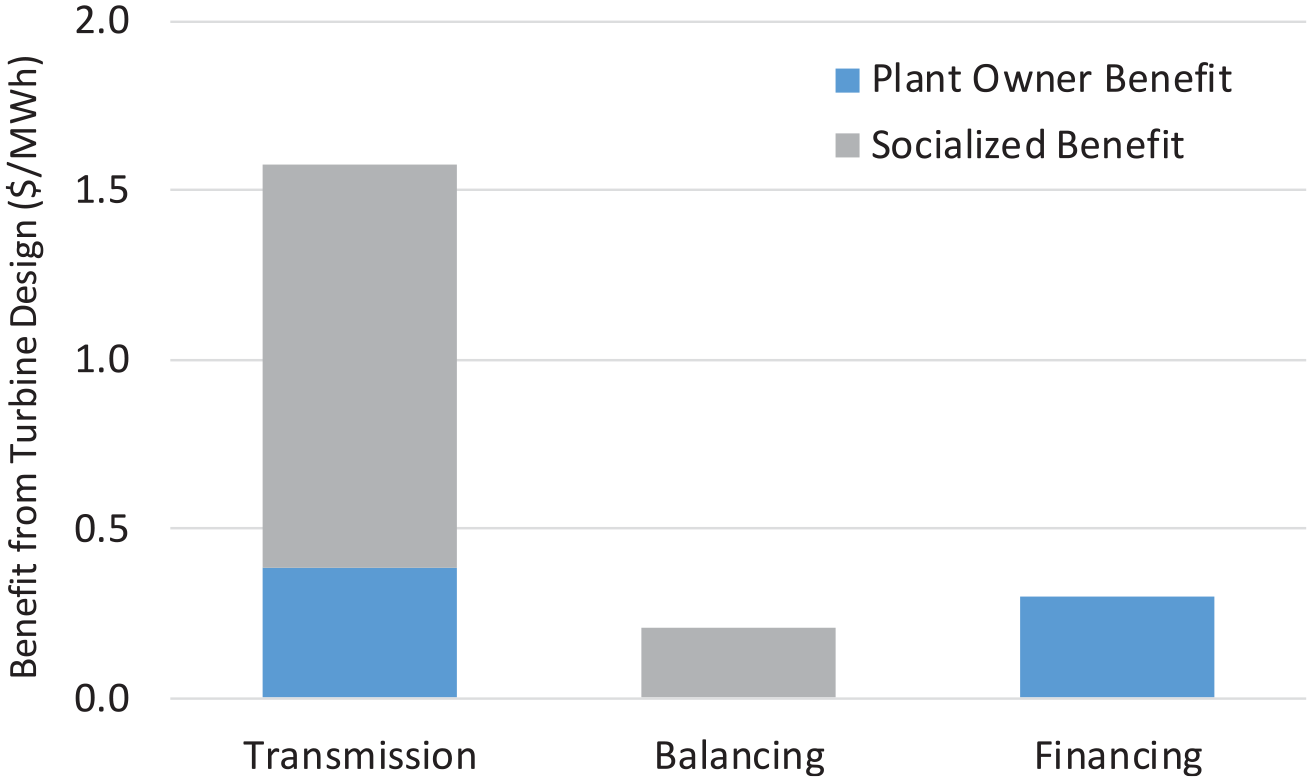
Transmission, balancing, and financing cost savings from low-SP, tall turbines.
The potential balancing and financing advantages of low-SP, tall-tower turbines are small. For balancing, spreading the slightly greater balancing reserve requirements over much more energy with low-SP, tall-tower turbines leads to a benefit of about US$ 0.2/MWh. For financing costs, the small increase in leverage enabled by the low-SP, tall-tower turbine reduces the LCOE of wind by US$ 0.30/MWh.
Conclusion
Though wind power has expanded rapidly, continued technical advancements will be necessary if it is to reach its full potential. Thus far, the industry has focused on minimizing the direct cost of its product, the levelized cost of wind energy. In contrast, in this article, we illustrate the importance of expanding the design space to focus not only on direct LCOE minimization—as historically defined, and applied—but also to consider a broader set of factors, including the underlying value of wind to the electric grid.
Our focus has been on turbine size for land-based wind installations: nameplate capacity, RD, and tower height. Turbine upscaling has been a primary driver of lower LCOE historically, and still greater LCOE reductions may be possible, though design, manufacturing, and transportation constraints may slow turbine growth. Regardless, our results are suggestive of a possible double dividend: that taller towers and lower SP might not only reduce LCOE as commonly applied, but also enhance the value of wind energy and provide other heretofore “hidden” benefits.
The scale of the potential additional benefits are, in aggregate, relatively sizable, but also highly variable. When wind penetration reaches around 20%, we find a market-value boost of US$2–3/MWh (10–15%). This is augmented by transmission, balancing, and financing benefits, which sum to roughly US$2/MWh. For the turbines we analyzed, SP is found to be a larger driver for these benefits than is tower height. The average LCOE of new wind projects in the United States in 2018 was US$36/MWh (Wiser and Bolinger, 2019). As such, this aggregate potential value enhancement of US$4–5/MWh from low-SP, tall-tower turbines is comparable with a 10%–15% reduction in LCOE. While other research has previously used models to assess a number of these possible advantages, we demonstrate that these benefits can already be observed empirically today in wholesale power markets across the United States.
Narrowly, the primary contribution of this article comes from its further analysis of one possible land-based wind innovation pathway, focusing on several somewhat less-recognized benefits of larger rotor and taller tower wind turbines. Our more general purpose, however, was to illustrate the growing importance of factors beyond LCOE in turbine and project design and operations. Up to this point, with limited wind deployment, a near-exclusive focus on LCOE may have been appropriate. However, as wind penetrations continue to grow, the output profile and characteristics of wind begin to impose challenges to the electric system. A narrow focus on LCOE ignores these impacts. However, by expanding the analysis scope to consider supplementary factors that influence the economics of wind—wholesale market value, transmission, balancing, and financing—turbine designers, project developers, and wind R&D experts can help ensure that wind plants of the future seek a balance between minimizing costs and maximizing value. In some cases, this may lead to lower SP and/or taller turbines, or to different project siting decisions. In other cases, it may yield hybrid projects that combine wind with various forms of storage, or wind plants that directly provide various kinds of short-term grid services. Regardless of where it leads, this expanded scope will ensure that wind turbines and plants are designed and operated to minimize overall system costs rather than solely the direct cost of the individual plant.
Footnotes
Declaration of conflicting interests
The author(s) declared no potential conflicts of interest with respect to the research, authorship, and/or publication of this article.
Funding
The author(s) disclosed receipt of the following financial support for the research, authorship, and/or publication of this article: This work was authored by Lawrence Berkeley National Laboratory, under contract number DE-AC02-05CH11231 with the US Department of Energy. Funding provided by the US Department of Energy Office of Energy Efficiency and Renewable Energy Wind Energy Technologies Office. The views expressed in the article do not necessarily represent the views of the DOE or the US Government. The US government retains and the publisher, by accepting the article for publication, acknowledges that the US government retains a non-exclusive, paid-up, irrevocable, worldwide license to publish or reproduce the published form of this work, or allow others to do so, for US government purposes.