
Abstract
Current work focusses on the wind potential assessment in South Punjab. Eleven locations from South Punjab have been analyzed using two-parameter Weibull model (with Energy Pattern Factor Method to estimate Weibull parameters) and five years (2014–2018) hourly wind data measured at 50 m height and collected from Pakistan Meteorological Department. Techno-economic analysis of energy production using six different turbine models was carried out with the purpose of presenting a clear picture about the importance of turbine selection at particular location. The analysis showed that Rahim Yar Khan carries the highest wind speed, highest wind power density, and wind energy density with values 4.40 ms−1, 77.2 W/m2 and 677.76 kWh/m2/year, respectively. On the other extreme, Bahawalnagar observes the least wind speed i.e. 3.60 ms−1 while Layyah observes the minimum wind power density and wind energy density as 38.96 W/m2 and 352.24 kWh/m2/year, respectively. According to National Renewable Energy Laboratory standards, wind potential ranging from 0 to 200 W/m2 is considered poor. Economic assessment was carried out to find feasibility of the location for energy harvesting. Finally, Polar diagrams drawn to show the optimum wind blowing directions shows that optimum wind direction in the region is southwest.
Keywords
Introduction
Wind energy, being a significantly economical and renewable form of energy, is seeking attention throughout the world these days (Rehman et al., 2018; Shoaib et al., 2017a, 2017b). Currently, the global wind installed capacity reaches about 597 GW in 2019 (World Wind Energy Association, 2019) with China as the leading one having a share of 37.01% in global installed capacity followed by USA (16.14%), Germany (9.93%), India (5.46%), and Spain (3.85%) (ETEnergyWorld, 2019). According to International Renewable Energy Agency (IRENA) report, 2019 (IRENA, 2019), India has total installed capacity of 35 GW, whereas Pakistan has only 1186 MW which was 106 MW in 2014 (Khahro et al., 2014a). As Pakistan is energy deficient country, having a huge reliance on fossil fuels for both the primary energy (with 87% and 80% share as of 2014 and 2019, respectively) and electrical energy generation (with 61% and 64% share as of 2014 and 2019, respectively) (Baloch et al., 2016; Sarim, 2019), therefore, to achieve the sustainable development, there is a need to harness wind energy (Khahro et al., 2014c). Before the exploitation of wind energy, accurate estimation of wind potential is important (Bilir et al., 2015b). So far, numerous sites throughout the world have been investigated. Oyedepo et al. (2012) investigated the wind potential at three locations (Enugu, Owerri, and Onitsha) in Nigeria using wind speed data measured at a hub height of 10 m. Analysis showed that Enugu has maximum wind speed while Owerri has least. Furthermore, the energy generation by using typical turbines was also determined.
Wind potential estimation of Rwanda was made using hourly wind data over a period of 20 years (1974–1993) at a hub height of 10 (Safari and Gasore, 2010) using Weibull and Rayleigh distributions. Furthermore, wind characteristics were also investigated on higher heights to evaluate the wind shear effects. Weisser (2003) used two-parameter Weibull probability density model to investigate the wind characteristics and to evaluate wind power density (WPD) and wind energy density (WED) at Grenada, West Indies. Hourly wind data were utilized and diurnal variations were observed.
Uludağ (a region in turkey) was investigated using wind data collected over a span of seven years (2000–2006) (Ucar and Balo, 2009). Shape and scale parameters were estimated and it was found that mean wind speed at investigated location is 7.06 m/s. Moreover, economic feasibility of certain wind power projects was also carried out. Wind characteristics in Kayathar, Tamil Nadu, India were investigated using wind speed data measured by SODAR technique (Chaurasiya et al., 2017) along with a comparative analysis of nine different Weibull parameters estimation methods. Furthermore, the study compared the accuracy of data collected using sonic detection and ranging (SODAR) technique and cup anemometer method.
Wind potential at Kumta and Sirsi (India) was investigated (Ramachandra et al., 1997) by using two years wind data and two-parameter Weibull distribution with power density method (PDM) used to estimate Weibull parameters. Seasonal variation was investigated and the analysis showed that the period from May to August is a good period to obtain wind energy.
Hong Kong, an island in China was investigated to assess the wind potential and to determine the suitability of certain wind turbine models, presented in Lu et al. (2002). A potential site in Brazil i.e. Paraiba was investigated and presented in Lima and Filho (2012). Similarly, Firouzkooh county of Iran (Pishgar-Komleh et al., 2015), Arizona (Acker et al., 2007), Tehran, Iran (Keyhani et al., 2010), and many others have been studied. In Pakistan, Gharo, Sindh (Khahro et al., 2014c), Baburband, Sindh (Shoaib et al., 2017a), Jiwani, Balochistan (Shami et al., 2016), and other potential sites have been investigated so far.
However, province of Punjab has not been investigated as no literature is available for that. The aim of current work is to investigate the true wind potential using surface measured data in South Punjab and the determination of suitability of various turbine models. The output from this study is useful to determine the effectiveness of certain wind project planned to be launched in future.
Materials and methods
Wind data modeling
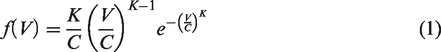
There are a number of distributions available to model various phenomenon in nature such as three-parameter Weibull distribution, two-parameter Weibull distribution, Rayleigh Distribution, two-parameter lognormal distribution, and two-parameter gamma distribution (Baseer et al., 2017; Bassyouni et al., 2015b) but two-parameter Weibull model has been most widely used throughout the literature to estimate the wind potential. Two-parameter Weibull model is given as follows (Aized et al., 2019; Hulio et al., 2019; Shoaib et al., 2019)

Weibull parameters estimation methods
There are a number of methods available to estimate Weibull distribution parameters graphical method (GM) (Bilir et al., 2015b), maximum likelihood method (MLM) (Shoaib et al., 2017a), empirical method (EM) (Bilir et al., 2015b; Ouammi et al., 2010), method of moments (MOMs) (Shoaib et al., 2017a), etc. In this study, Energy Pattern Factor Method (EPFM) is used.
Energy Pattern Factor Method (EPFM)
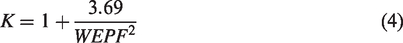
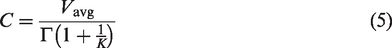
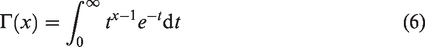
In EPFM, Weibull parameters can be estimated using Wind Energy Pattern Factor (WEPF) (Akdağ and Dinler, 2009; Akdağ and Güler, 2015)

Wind potential
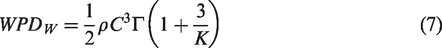
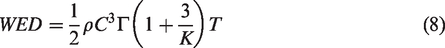
Wind potential is not only determined by wind speeds but also from WPD and WED because average wind speeds can be identical for different locations irrespective of whether they possess same or different wind power or wind energy densities. WPD and WED can be estimated using following mathematical relationships (Azad et al., 2014; Pishgar-Komleh et al., 2015)
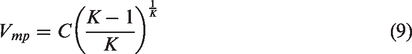
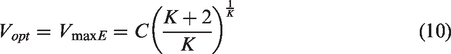
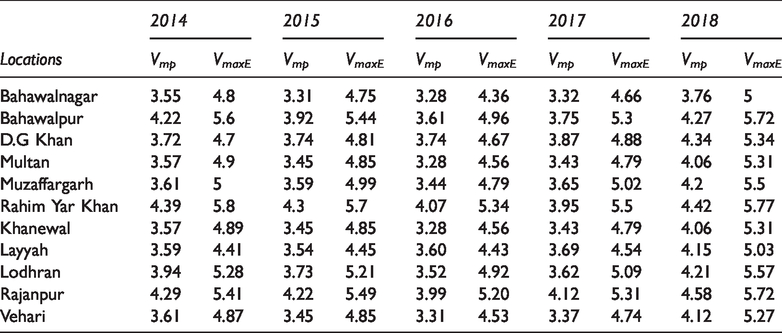
Two important speeds in the estimation of wind resource are most probable wind speed (Vmp) and the optimum wind speed (Vopt) also known as the speed carrying the maximum wind energy (VmaxE) (Bagiorgas et al., 2016; Bassyouni et al., 2015a). Vmp is the wind speed with highest frequency for a given wind speed distribution and Vopt is the speed which carries the maximum energy as wind energy (over a period of time) does not depend only on average wind speed but also its distribution characterized by K and C (Rehman et al., 2012). Once the Weibull parameters are calculated, these speeds can be calculated using following mathematical relationships (Keyhani et al., 2010; Khahro et al., 2014c)
Measure of goodness of fit
In order to measure goodness of fit of Weibull distribution to actual wind data, correlation coefficient can be used.
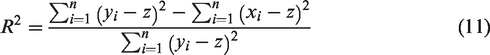
yi = actual wind speed probability value
xi = wind speed probability calculated from Weibull distribution
z = mean of actual data
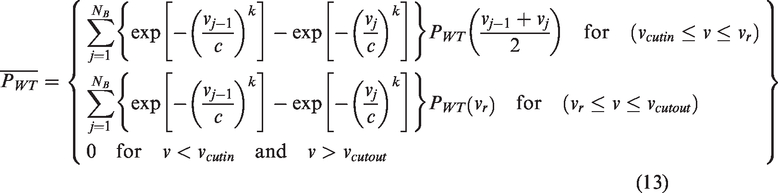
Energy production through turbines
Along with WPD and WED, power or energy produced through a wind turbine in a particular time period is also significant (Khahro et al., 2014b). According to Betz criterion, maximum theoretical efficiency or power coefficient (CP) of a wind turbine is 59% (Khahro et al., 2014c). However, actual efficiency does not depend only upon wind characteristics of a particular location but also on turbine design characteristics i.e. rated speed, cut-in speed, cut-out speed, rotor area, and hub height. An important factor to quantify the ratio of actual power produced from a turbine to rated power is called capacity factor (CF). CF and power generated can be calculated using equations (12) and (13), respectively

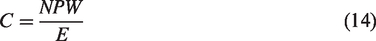
Economic assessment
Unlike conventional power sources, wind energy utilization does not require fuel supply. However, investment in turbines and others are involved which must be taken into account to estimate the economic feasibility of wind power project. Total cost involves the initial investment cost (I) and operation and maintenance cost (Com). Today, most commercially available turbines cost from $1.3 to 2.2 per watt (WindIndustry). Unit cost of electricity (C) and payback period (PP) are two important parameters, which need to be evaluated. Unit cost is estimated using following relationship (Khahro et al., 2014a, 2014b)
NPW is calculated using equation (15)
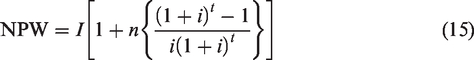
Additional 30% take into account the initial cost associated with civil work, grid connections etc.
Payback period (PP)
The PP is the length of time (usually measured in years) required to recover the cost of an investment

Many regions are left untouched because of their moderate or low wind potential. With recent developments in the field of wind turbine technology and wind harvesting machines, number of wind turbine designs are available which can operate under medium to low wind conditions. Therefore, it is necessary to make careful assessment using preestablished methods like EPFM. Thus, this study focused on Southern Punjab which has never been assessed so far using two-parameter Weibull Distribution Function and EPFM. Wind data were obtained from Pakistan Meteorological Department (PMD) and no missing data points occurred during the data recording. Statistical analysis was performed to determine WPD and WED. Techno-economic analysis of actual power produced from six turbine models from different manufacturers along with energy generation per year was conducted. Finally, polar diagrams were drawn to demonstrate optimum wind direction at each of the investigated location.
Results and discussion
Wind speeds
Yearly average wind speeds have been shown in Table 1 along with shape parameter, scale parameter, and average WPD values. The analysis of Table 1 and Figure 1 shows that Rahim Yar Khan (RYK) has maximum wind speed averaged over five years period i.e. 4.40 ms−1 (with the highest value observed in 2018 as 4.56 ms−1 and minimum value in 2016 was 4.20 ms−1). On the other hand, Bahawalnagar carries the minimum wind speed as 3.60 ms−1 (with the highest value of 3.90 ms−1 in 2018 and the lowest value of 3.38 ms−1 in 2016).
Annual average wind speeds, shape (K), scale (C) parameters, and wind power densities (WPD) for South Punjab.
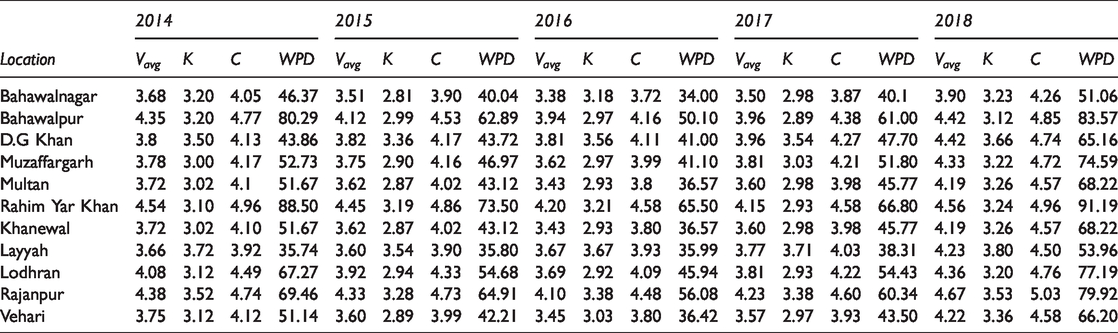
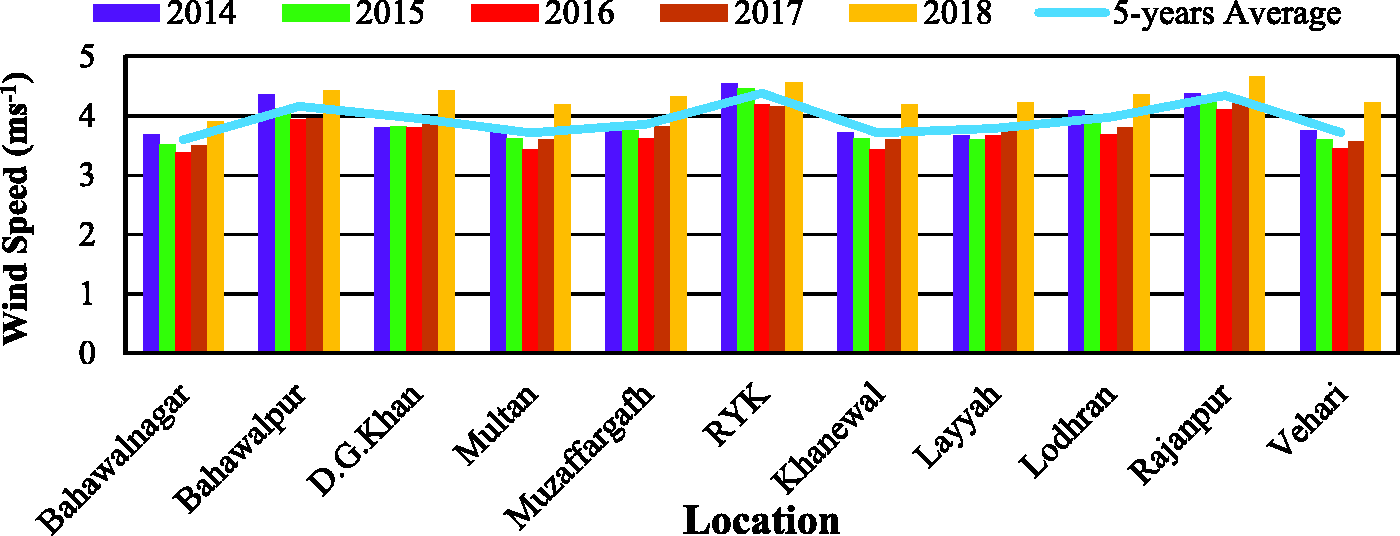
Yearly average and five-years’ average wind speeds (ms−1).
Wind power and energy density
It has been observed from Table 1 and Figures 2 to 3 that RYK possesses both the maximum WPD and maximum WED as 77.2 W/m2 and 677.76 kWh/m2/year, respectively. On the other hand, the minimum values of both the WPD and WED have been observed for Layyah as 38.96 W/m2 and 677.76 kWh/m2/year, respectively. The important point to note here is that minimum wind speed has been observed for Bahawalnagar but it is not the location having minimum WPD and WED which shows that wind speed is not the true representative of wind potential but wind potential also depends upon the frequency distribution and probability of occurrence of certain wind speed.
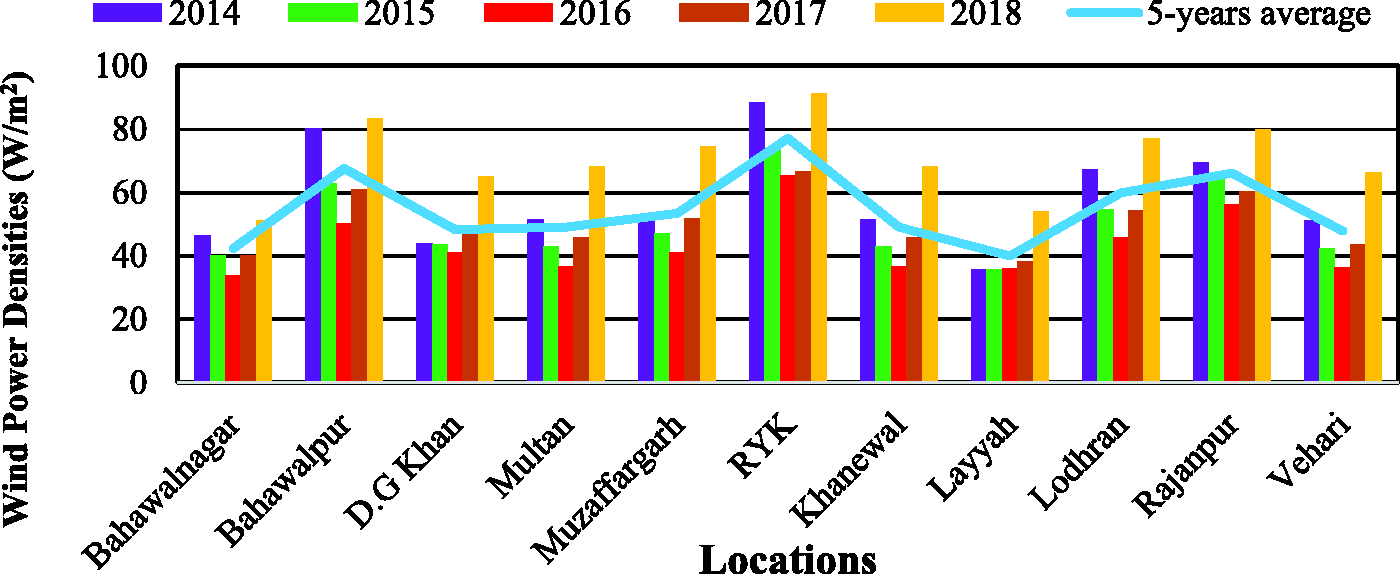
Yearly average and five-years’ average wind power densities (W/m2).
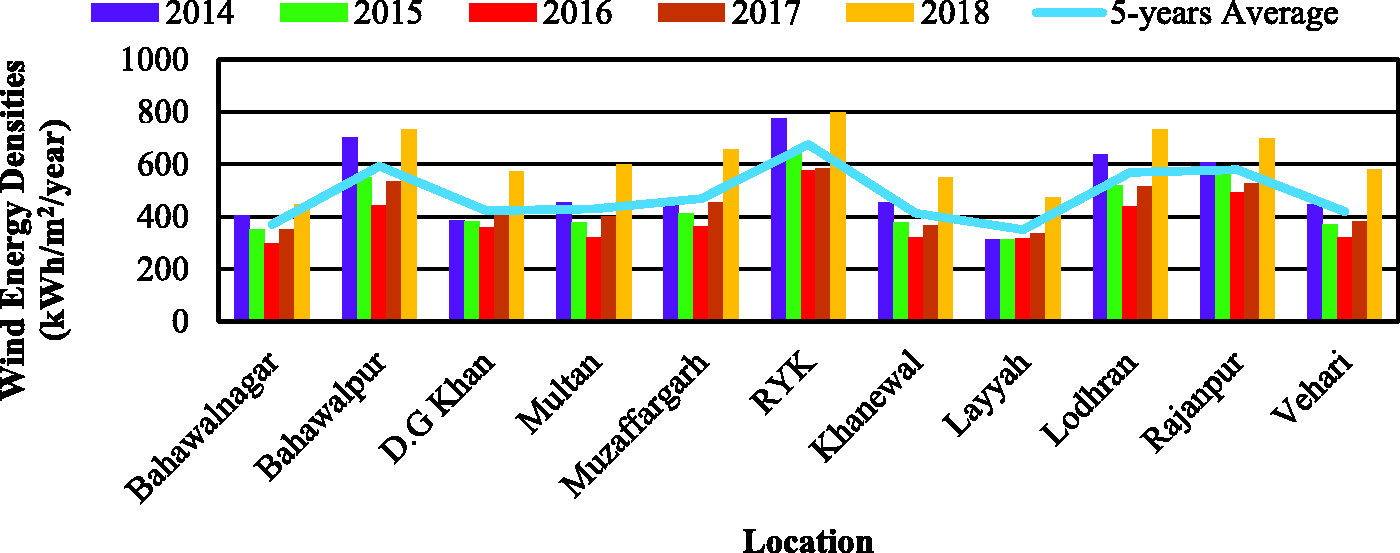
Yearly average and five-years’ average wind energy densities (kWh/m2/year).
Most probable and optimum wind speed
The analysis of Table 2 shows that RYK has the highest value of Vmp as 4.25 ms−1 and Bahawalnagar carries the lowest value as 3.44 ms−1. The highest Vopt is observed for RYK as 5.62 ms−1 and the minimum is for Layyah i.e. 4.57 ms−1 (lower than that of Bahawalnagar i.e. 4.71 ms−1). This is the reason why Layyah has the lower WPD and WED than Bahawalnagar although Bahwalnagr has lower wind speed than Layyah.
Annual average values of most probable and optimum wind speeds for South Punjab.
Weibull distribution
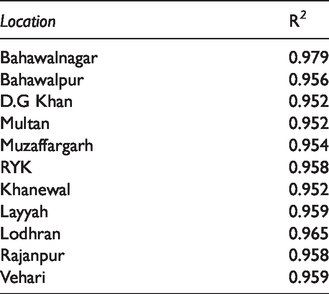
Weibull distribution estimates the actual wind data with significant accuracy. Comparison of actual and Weibull Distribution has been shown in Figure 4 and correlation coefficient calculated is enlisted in Table 3. These parameters were found to fit the actual wind frequency distributions with acceptable correlation coefficient (>95%) for all locations. The Weibull diagrams for all 11 locations have been shown in Figure 5 which is consistent with K and C parameters listed in Table 1. The highest peak shown here is for Layyah (consistent with highest value of K i.e. 3.69). Similarly, the most widely spread curve on x-axis is for RYK (consistent with the highest value of scale parameter of 4.79 ms−1). Same is the case for other locations.
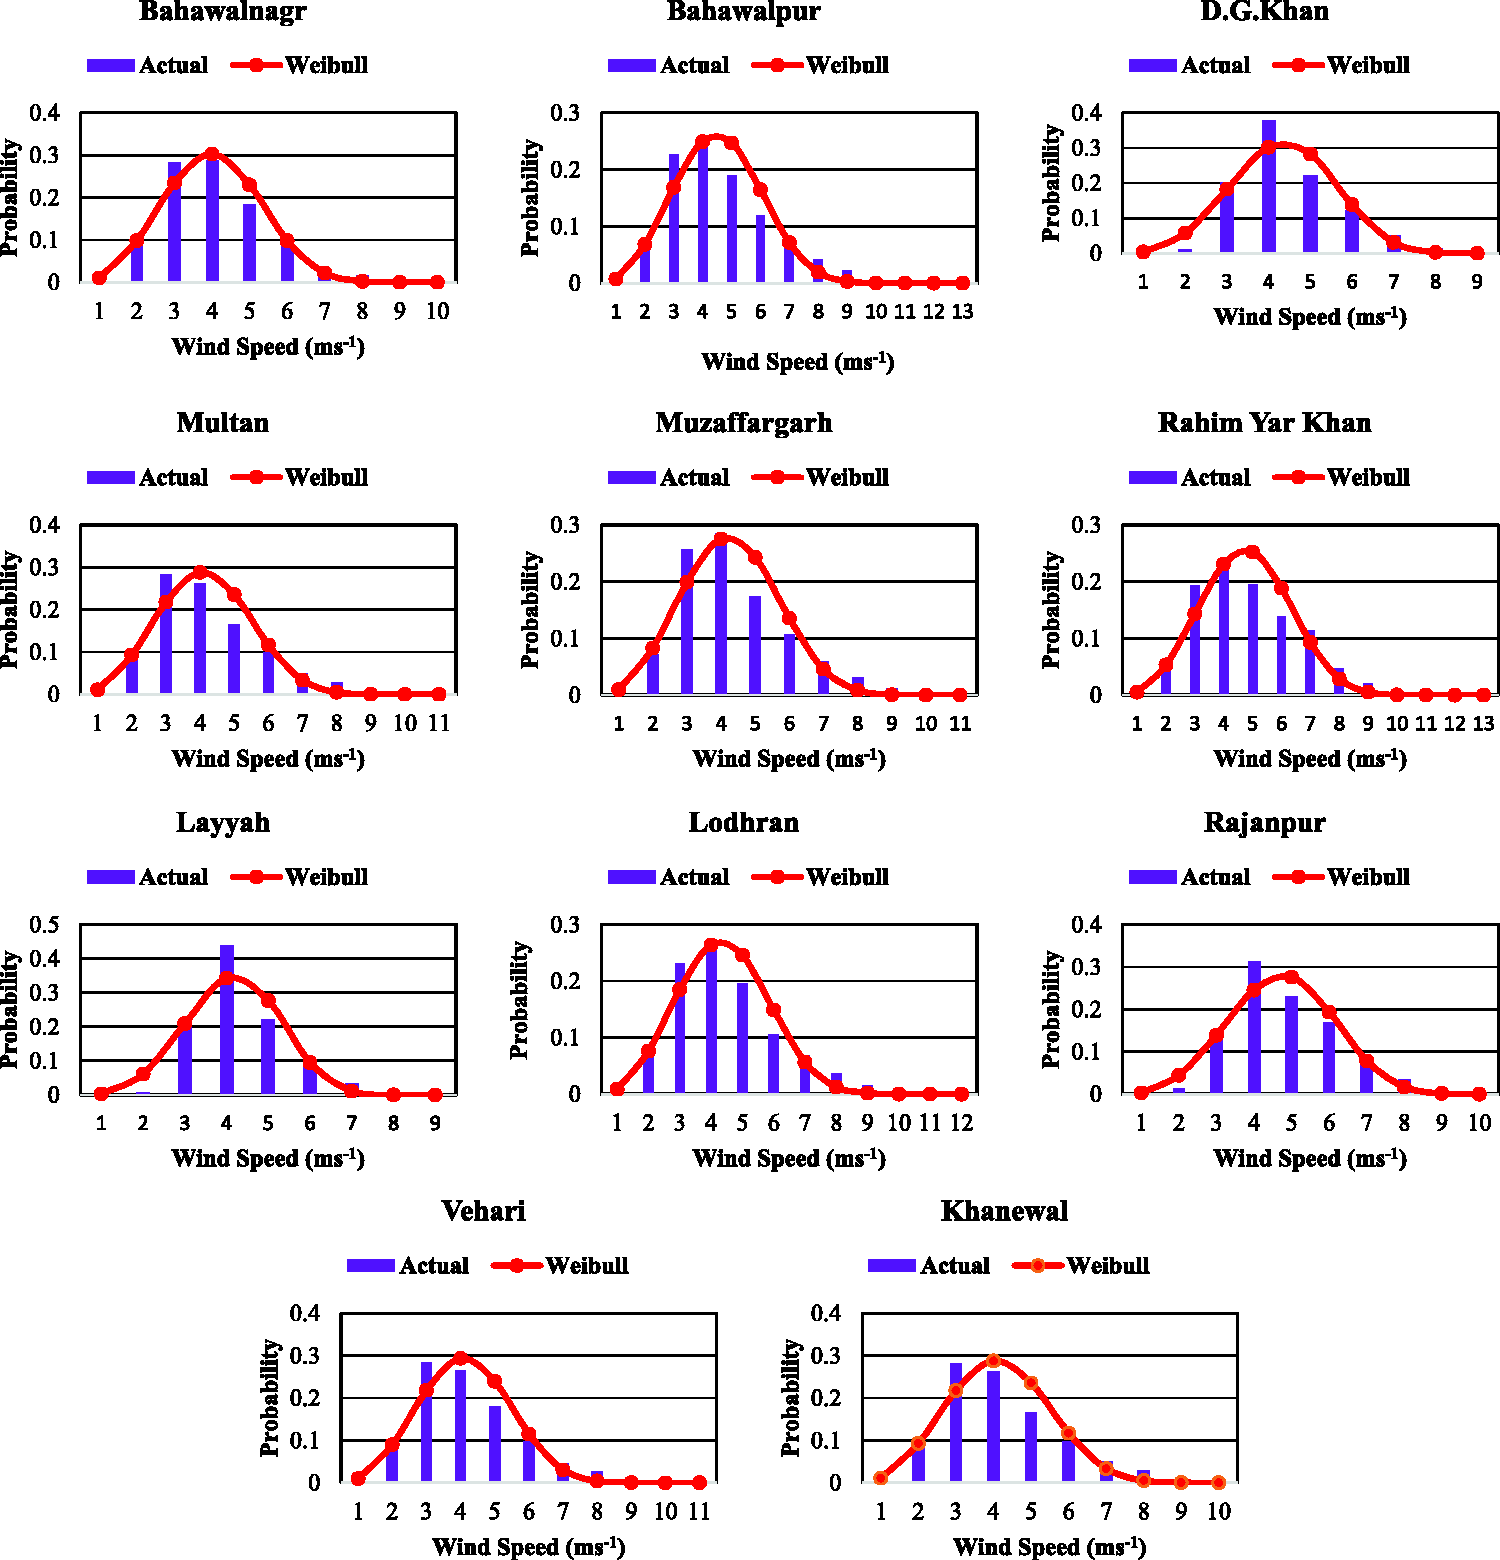
Actual and Weibull distribution for South Punjab.
Correlation coefficient between actual and Weibull distribution.
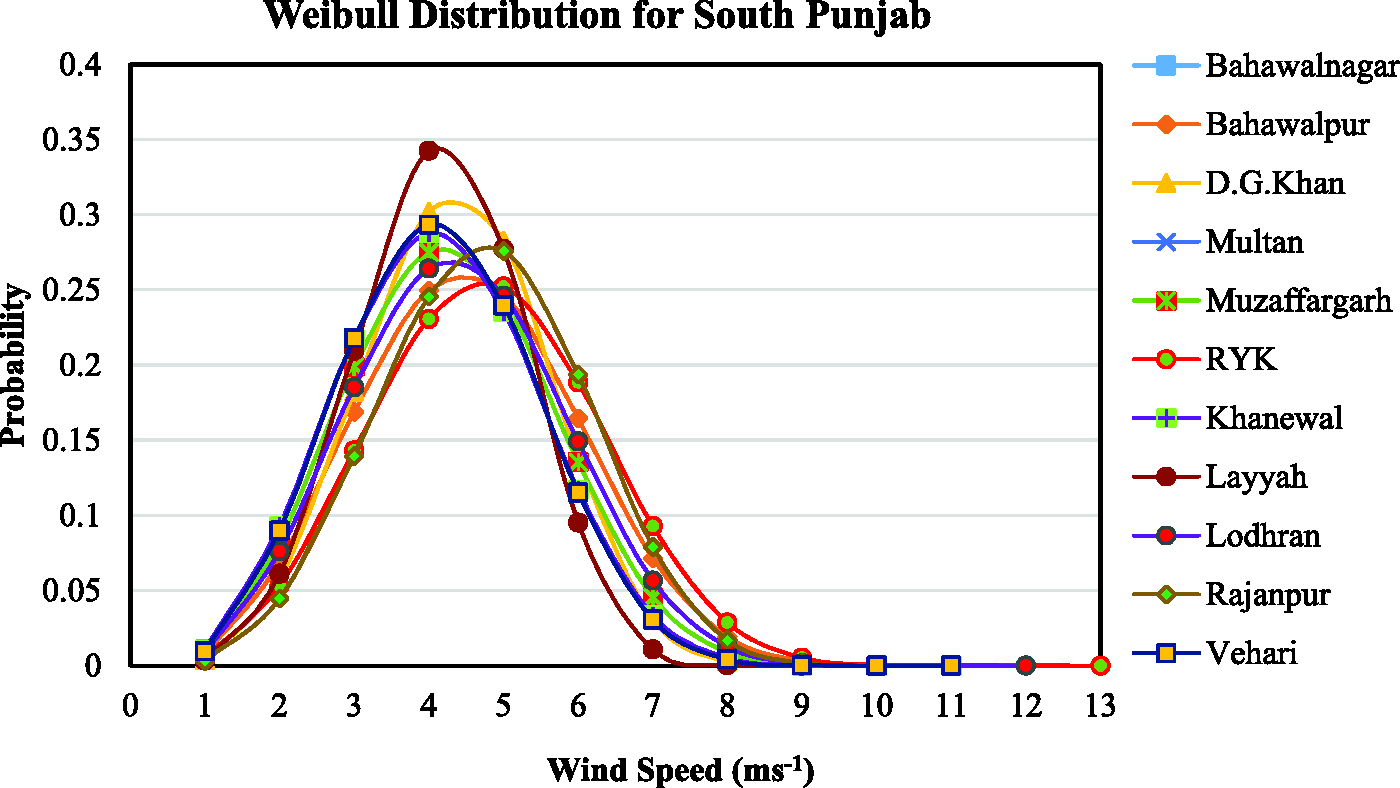
Weibull distribution for South Punjab.
Wind speed distribution
Cumulative frequency distribution has been shown in Figure 6. Analysis shows that the highest wind potential area i.e. RYK has a wind speed greater than 3 ms−1 with cumulative frequency of more than 75%, whereas for Bahawalnagar, the wind blows at a speed greater than 3 ms−1 with approximately 62% cumulative frequency value. Wind speed of greater than 3 ms−1 is important as most of the wind turbines have cut-in speed equal to 3 ms−1.
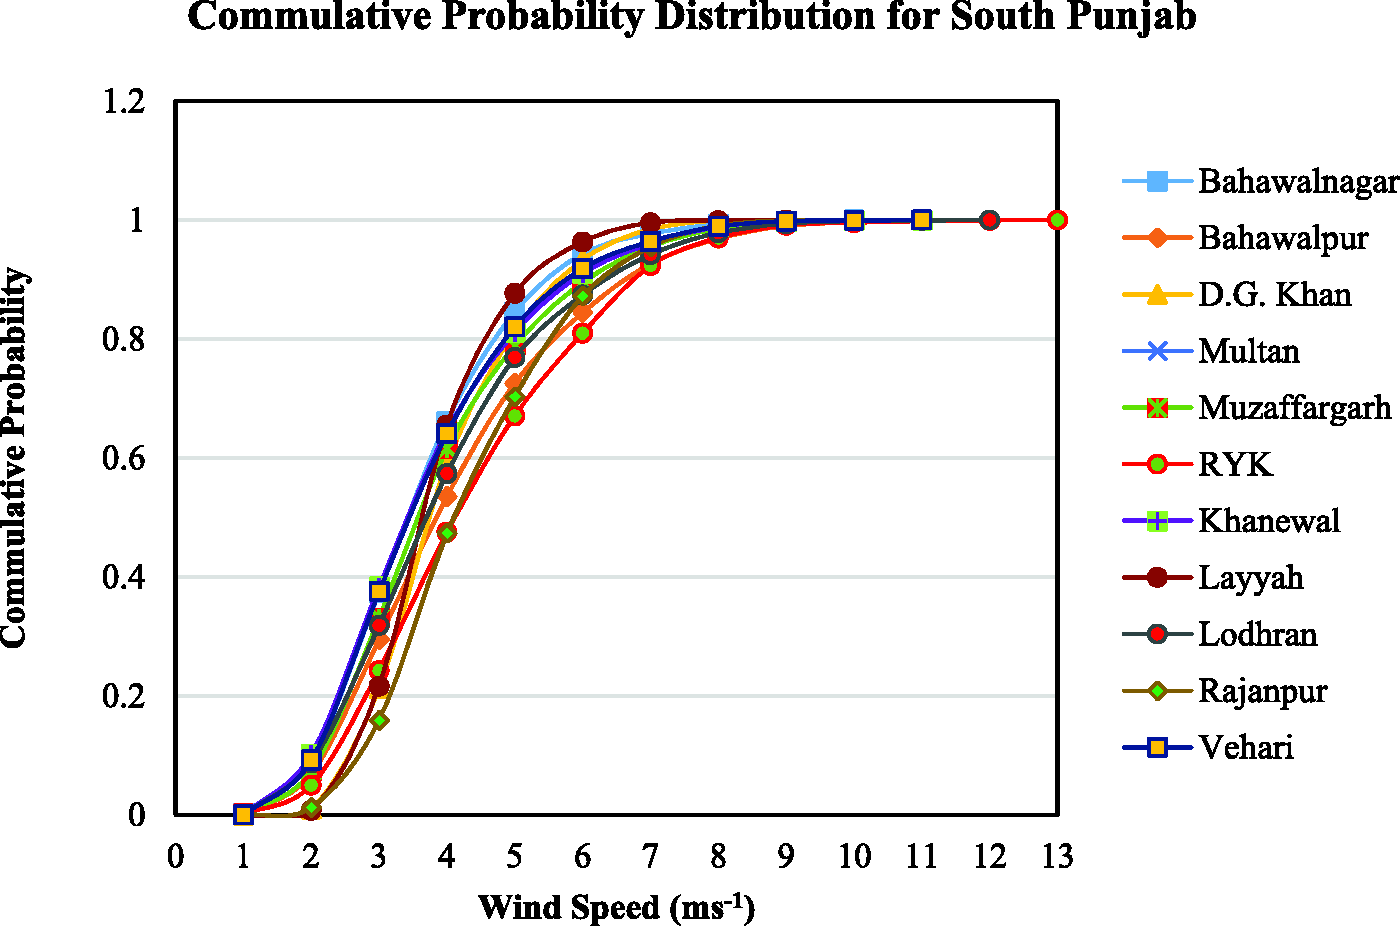
Cumulative frequency distribution for South Punjab.
Energy production from wind turbines
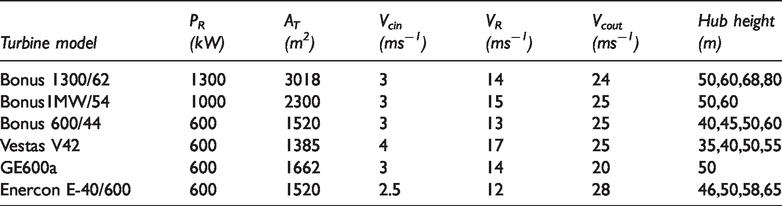
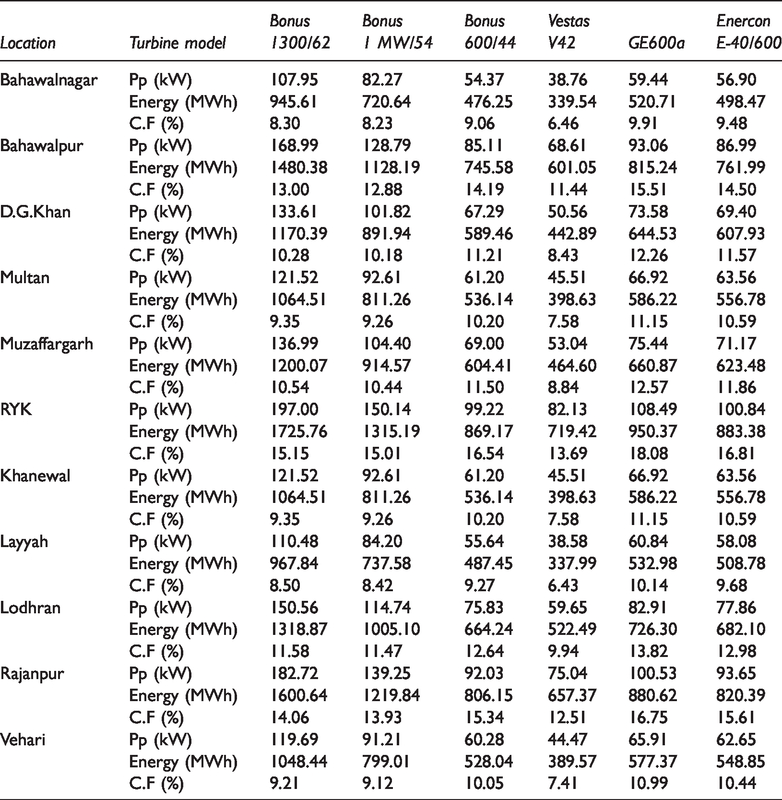
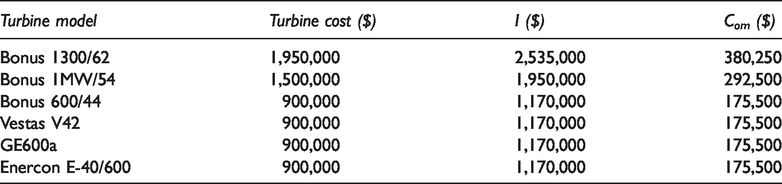
Energy production estimation from six turbine models from different manufacturers has been investigated. The objective of using different turbine models, given in Table 4, is to give wind power project investors an idea of choosing better wind turbines for certain location. These turbine models were selected as they are commercially available at same hub height (50 m) as was the hub height used in this assessment. Table 5 enlists power and annual energy production from various models and CF estimation at each of the investigated location in South Punjab, also shown in Figure 7. It has been shown that for Bahawalnagar, the highest energy output per year is 945.61 MWh by Bonus 1300/62 and minimum is 339.54 MWh by Vestas V42. Although highest CF is not for Bonus 1300/62 but for GE600a. Apparently, it seems surprising because one might expect that the turbine producing maximum energy would be the one having maximum CF but this is not true. The reason is that CF does not depend only upon the energy produced by a turbine but also on the maximum energy a turbine can produce. Same trend can be observed for other locations also. It has been observed from Table 6 that CF is not as high as might apparently be attractive for wind energy applications; however, with the development in wind turbine technology, new turbines are being designed which may be able to harvest wind energy from low- to moderate wind speeds also (Goudarzi and Zhu, 2013; Kumar and Baredar, 2012). Therefore, with the development of new turbines CF can be increased.
Various turbine models along with specifications.
Energy production and capacity factor stimation of various turbine models.
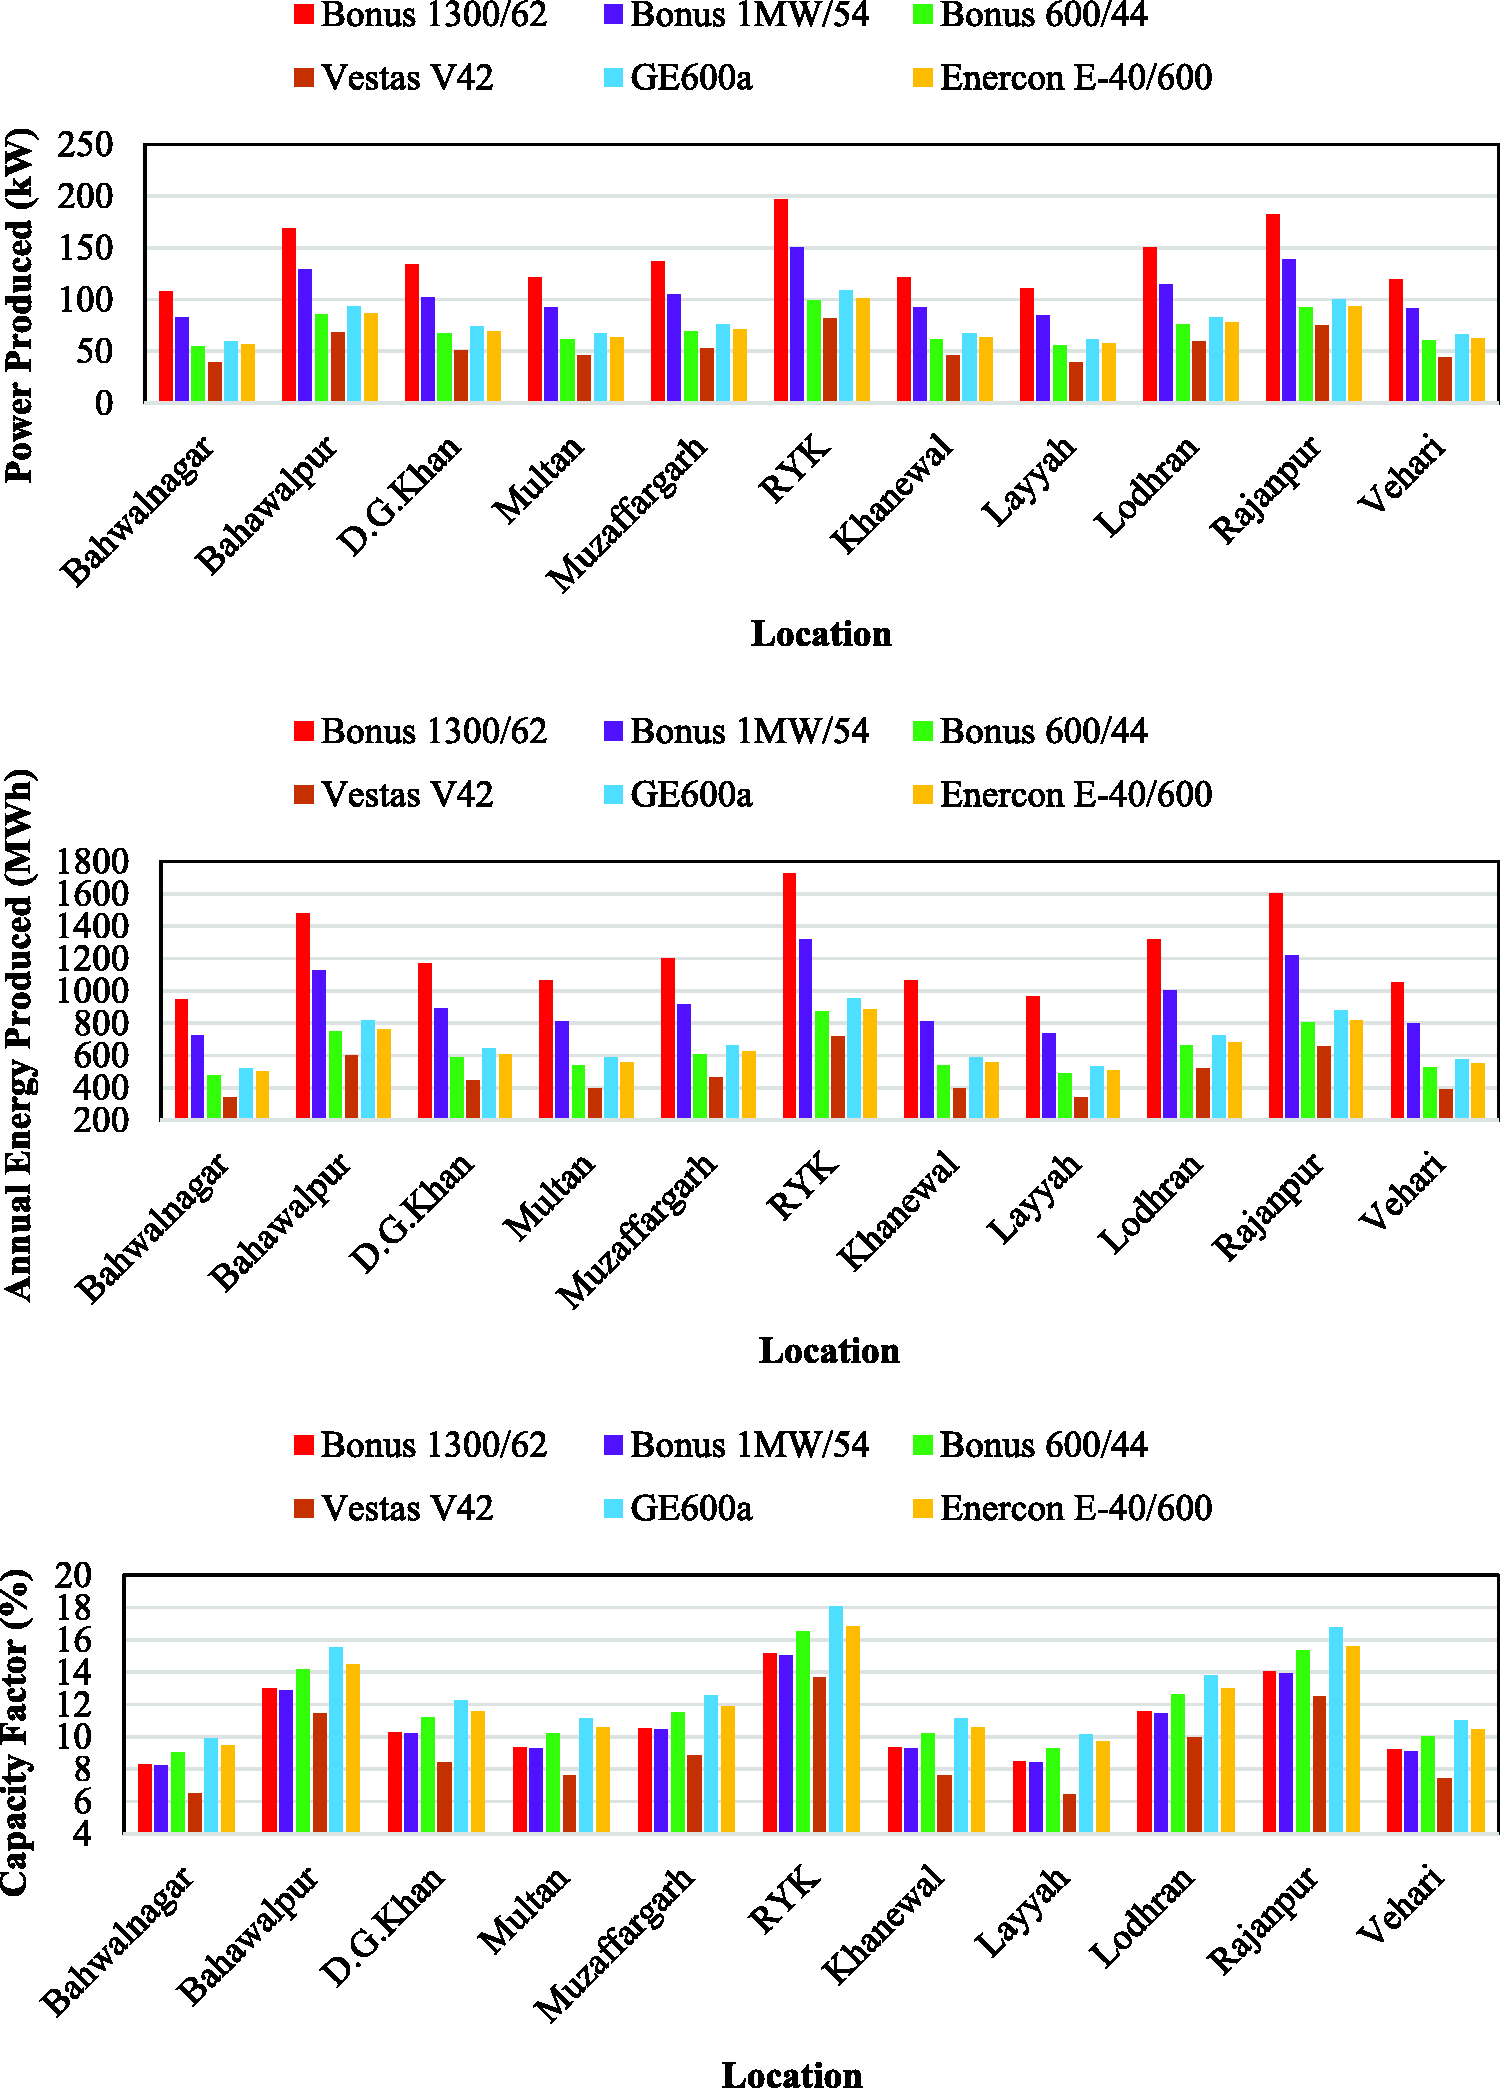
Performance of various turbine models w.r.t. Power produced (a), annual energy production (b) and capacity factor (c).
Different turbine models cost, initial investment cost (I) and operational and maintenance cost (Com).
Economic assessment
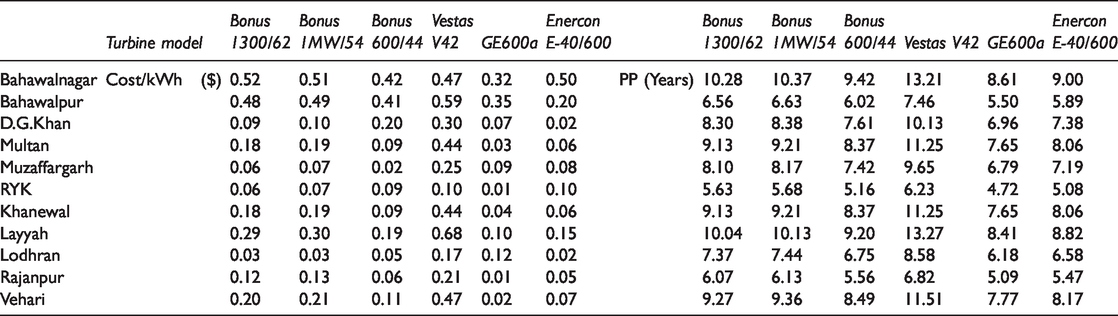
Economic analysis of energy production using six different turbine models has been carried out. Costs of turbines along with total initial investment cost (I) and operation and maintenance (Com) have been listed in Table 6. Based on the energy production listed in Table 5 and costs listed in Table 6, cost per unit of electrical energy (C), and PP for all turbines at all locations have been calculated and listed in Table 7. It has been shown that GE600a turbine gives the lowest cost at RYK and Bonus 1300/62 has the highest cost at Bahawalnagar. This should be so as RYK has the highest wind speed and Bahawalnagar has the lowest. Similarly, PP for GE600a is lowest i.e. 4.72 years at RYK and is highest for Bonus 1300/62 i.e. 10.28 years at Bahawalnagar.
Cost/KWh and payback period (PP) of various turbine models at all selected locations.
Polar diagrams
Polar diagrams are very important to show the optimum direction in which the wind blows at a certain location. The determination of this direction is important as the amount of energy extraction surely relies on the direction in which the turbine is installed. In Figure 8, the polar diagrams have been shown for all 11 locations and results show that in South Punjab, the optimum direction for almost all locations is Southwest (SW).
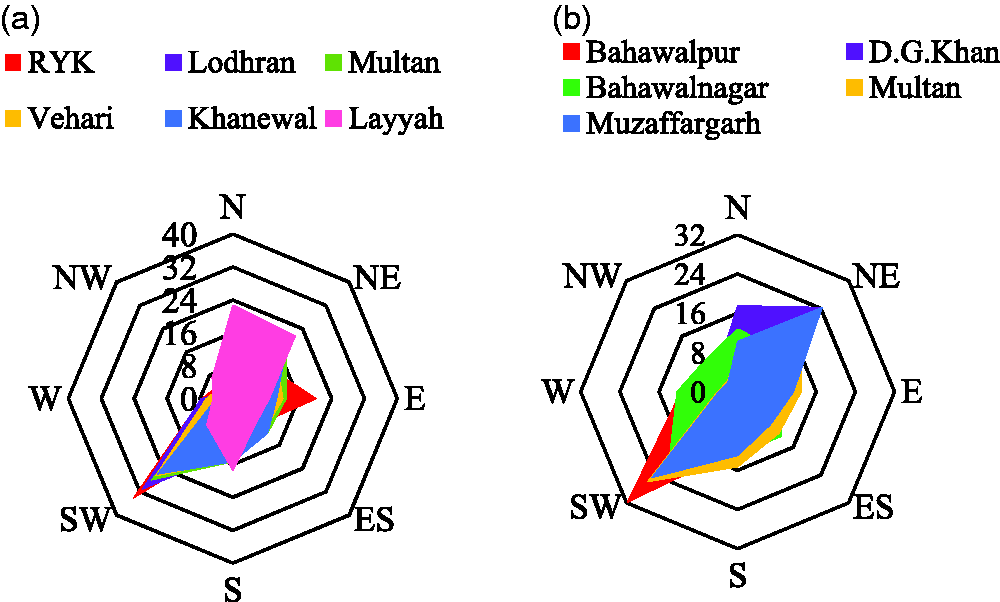
Polar diagrams for South Punjab (a) and (b).
Validation of results
Historical data validation method has been used to compare the outcomes of this work. The validity of this particular model is determined with respect to method used and scope of research. This study uses two-parameter Weibull distribution model to estimate wind potential at multiple locations and this model has been found to be valid when compared with previous historical data (Bilir et al., 2015a; Carta et al., 2009; Chang, 2011; Chaurasiya et al., 2017; Indhumathy et al., 2014; Khahro et al., 2014b; Khan and Tariq, 2018; Mirhosseini et al., 2011; Rehman et al., 2012, 2020; Safari and Gasore, 2010).
Conclusion
A region in south Punjab consisting of 11 districts has been investigated and analyzed for wind potential assessment. Two-parameter Weibull distribution with five years daily average wind data have been employed to estimate the potential of wind. The following conclusions have been drawn from the analysis:
RYK is the highly windy area with maximum wind speed, WPD and WED. On the other hand, Bahawalnagar is the poorest area as far as wind speed is concerned. But the minimum WPD and WED has been observed for Layyah rather than Bahawalnagar. The difference is associated with the difference in Vopt values. According to National Renewable Energy Laboratory (NREL) standards, wind potential ranging from 0 to 200 W/m2 is considered poor. At same location, different turbine models produce different amounts of energy with different CF. Therefore, choice of turbine at particular location is also important. Economic assessment shows that the locations having low wind potential have PP which is about half of total life time of project; therefore, will generate revenue in remaining life time. So it can be concluded that wind energy harvesting in area is economically feasible.
Footnotes
Declaration of Conflicting Interests
The author(s) declared no potential conflicts of interest with respect to the research, authorship, and/or publication of this article.
Funding
The author(s) received no financial support for the research, authorship, and/or publication of this article.