
Abstract
Background:
Reliable information on both global need for prosthetic services and the current prosthetist workforce is limited. Global burden of disease estimates can provide valuable insight into amputation prevalence due to traumatic causes and global prosthetists needed to treat traumatic amputations.
Objectives:
This study was conducted to quantify and interpret patterns in global distribution and prevalence of traumatic limb amputation by cause, region, and age within the context of prosthetic rehabilitation, prosthetist need, and prosthetist education.
Study design:
A secondary database descriptive study.
Methods:
Amputation prevalence and prevalence rate per 100,000 due to trauma were estimated using the 2017 global burden of disease results. Global burden of disease estimation utilizes a Bayesian metaregression and best available data to estimate the prevalence of diseases and injuries, such as amputation.
Results:
In 2017, 57.7 million people were living with limb amputation due to traumatic causes worldwide. Leading traumatic causes of limb amputation were falls (36.2%), road injuries (15.7%), other transportation injuries (11.2%), and mechanical forces (10.4%). The highest number of prevalent traumatic amputations was in East Asia and South Asia followed by Western Europe, North Africa, and the Middle East, high-income North America and Eastern Europe. Based on these prevalence estimates, approximately 75,850 prosthetists are needed globally to treat people with traumatic amputations.
Conclusion:
Amputation prevalence estimates and patterns can inform prosthetic service provision, education and planning.
Background
Limb amputation impairs physical functioning and mobility of people around the world. Leading causes of limb amputation have been reported to vary depending on region. Peripheral vascular disease and diabetes are commonly identified as the leading causes of limb amputation in high-income countries (HICs).1–3 However, in many low- and middle-income countries (LMICs), trauma has been documented as the primary mechanism for limb amputation.4–6 Trauma, and resultant limb amputation, has also been identified as a largely neglected epidemic in LMICs, warranting increased focus on both prevention and treatment.7–9
To improve prosthetic rehabilitation for people with limb amputation, the World Health Organization (WHO) published new prosthetic and orthotic (P&O) service provision standards in 2017. 10 These guidelines highlight four essential aspects of P&O service provision in healthcare systems related to policy, products, provision and personnel. 10 Furthermore, the paucity of trained prosthetists has been identified as a key barrier to fulfil unmet prosthetic rehabilitation needs globally. 11 Regional data from the International Society for Prosthetics and Orthotics (ISPO) reported by WHO suggest that all world regions are understaffed with prosthetists/orthotists. 11 HICs collectively have just over 2 prosthetists/orthotists per 1 million population, while LMICs all have less than 1 prosthetist/orthotist per 1 million population. 11
WHO has estimated a projected need for 40,000 prosthetists/orthotists worldwide in 2010. 12 More recent estimates, based on the same general assumption that 0.5% of the global population requires P&O services, suggest a need for 47,000 to 53,000 prosthetists/orthotists worldwide. 10 This estimate, however, fails to differentiate among prosthetists, orthotists, and those who are dually trained prosthetists/orthotists, and is not based on country or regional data.
While some countries, such as England, 13 Scotland, 14 Sweden, 15 and Australia 16 have established registries of people with amputation and published epidemiologic data on limb amputation, these data are primarily available for HICs. A review of the literature on lower limb amputation highlighted the paucity of empirical evidence from LMICs. 17 In addition, while national limb amputation incidence (i.e. new cases of limb amputation in a given time period) is commonly reported, 17 prevalence data (i.e. the number of people living with limb amputation), specifically for those with traumatic amputation, are rarely found in current literature. 18 An accurate understanding of global and regional variation in traumatic limb amputation prevalence could better inform national prosthetic service planning and prosthetist need by quantifying the number of people living with amputation due to trauma who may benefit from prosthetic services.
The global burden of disease (GBD) studies are a rich resource that can provide worldwide traumatic amputation prevalence estimates. The first GBD study was commissioned by the World Bank in the early 1990s and described the burden of disease of 98 diseases, 9 injuries, and 10 health risk factors for eight world regions. 19 Since then, GBD methods have evolved to include 359 diseases and injuries, and 67 health-related risk factors, including traumatic amputation, for 195 countries and territories. 20 Recent publications resulting from the extensive GBD studies have explored disability and rehabilitation-relevant topics, such as epilepsy, intellectual disability, vision and hearing loss, 21 hand and wrist trauma and digit amputation, 22 and unintentional injuries in Mexico. 23 To date, global traumatic limb amputation prevalence data available from the GBD studies have not been reported in detail.
In this study, we quantified and interpreted patterns in global distribution and prevalence of limb amputation due to trauma by cause, region and age using GBD 2017 results within the context of prosthetic rehabilitation, prosthetist need, and prosthetist education.
Methods
This study was a secondary descriptive study of the GBD 2017 results focusing on traumatic amputation prevalence (i.e. number of people living with traumatic amputation in 2017) and prevalence rates (i.e. prevalence per 100,000 population). 20 Methods for the extensive GBD 2017 estimates used in this descriptive study have been previously described. 20 Summarized key GBD methods are provided in the Supplemental Material Section 1. A detailed summary of previously described estimation methods relevant to this study is provided below and in Figure 1.
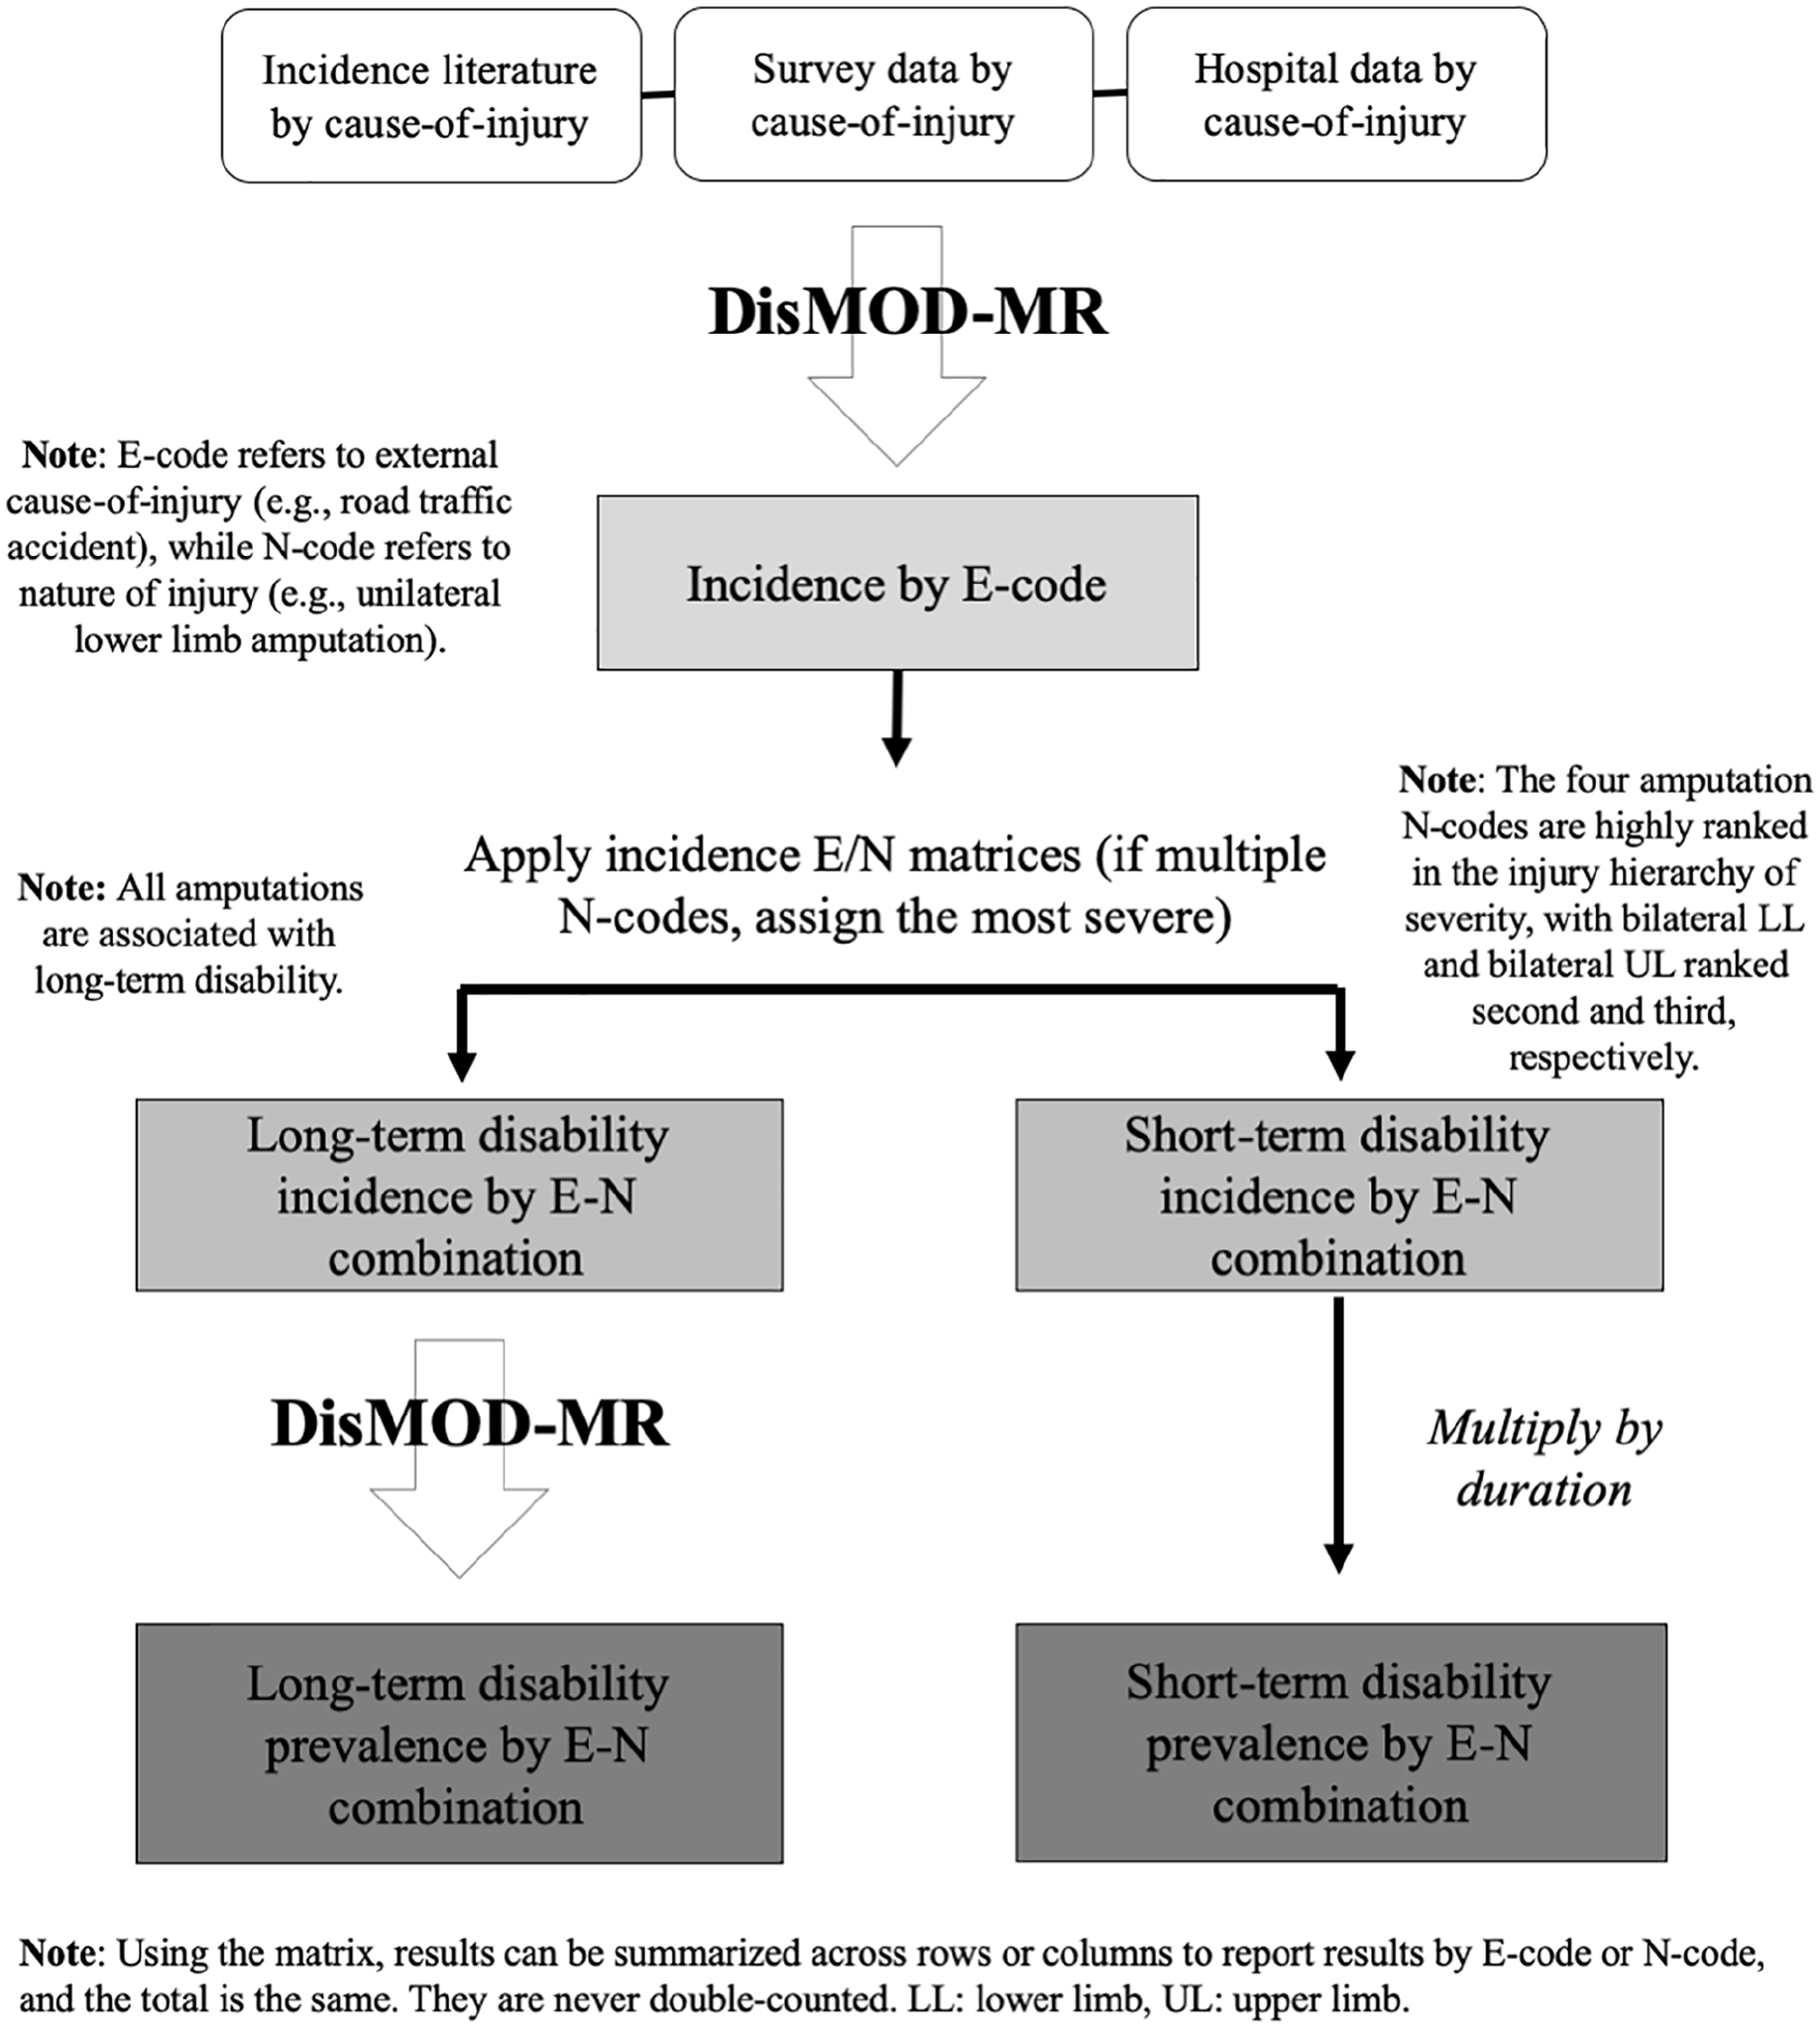
Flowchart of global burden of disease (GBD) injury prevalence estimation.
Definitions
The GBD 2017 study produced estimates of prevalence and prevalence rate of traumatic amputation using injury data reported by the WHO International Classification of Diseases (ICD) codes, revisions 9 and 10 (i.e. ICD 9 and ICD 10). ICD codes were then assigned to 30 mutually-exclusive and collectively-exhaustive external causes-of-injury (E-code), such as motor vehicle road injury or assault by a sharp object. ICD codes were also assigned to 47 mutually-exclusive and collectively-exhaustive nature-of-injury (N-code) categories, which include four categories for limb amputation: N1 = lower limb bilateral (bilateral LL), N2 = upper limb bilateral (bilateral UL), N4 = lower limb unilateral (unilateral LL) and N5 = upper limb unilateral (unilateral UL) (Table 1). 24 Amputation of fingers (N3), thumb (N6) and toes (N7) due to trauma were excluded from this study. Injury results can be reported by E-code or N-code, and the total is the same; they are never double-counted.
Nature-of-injury codes and associated ICD 9 and 10 codes.
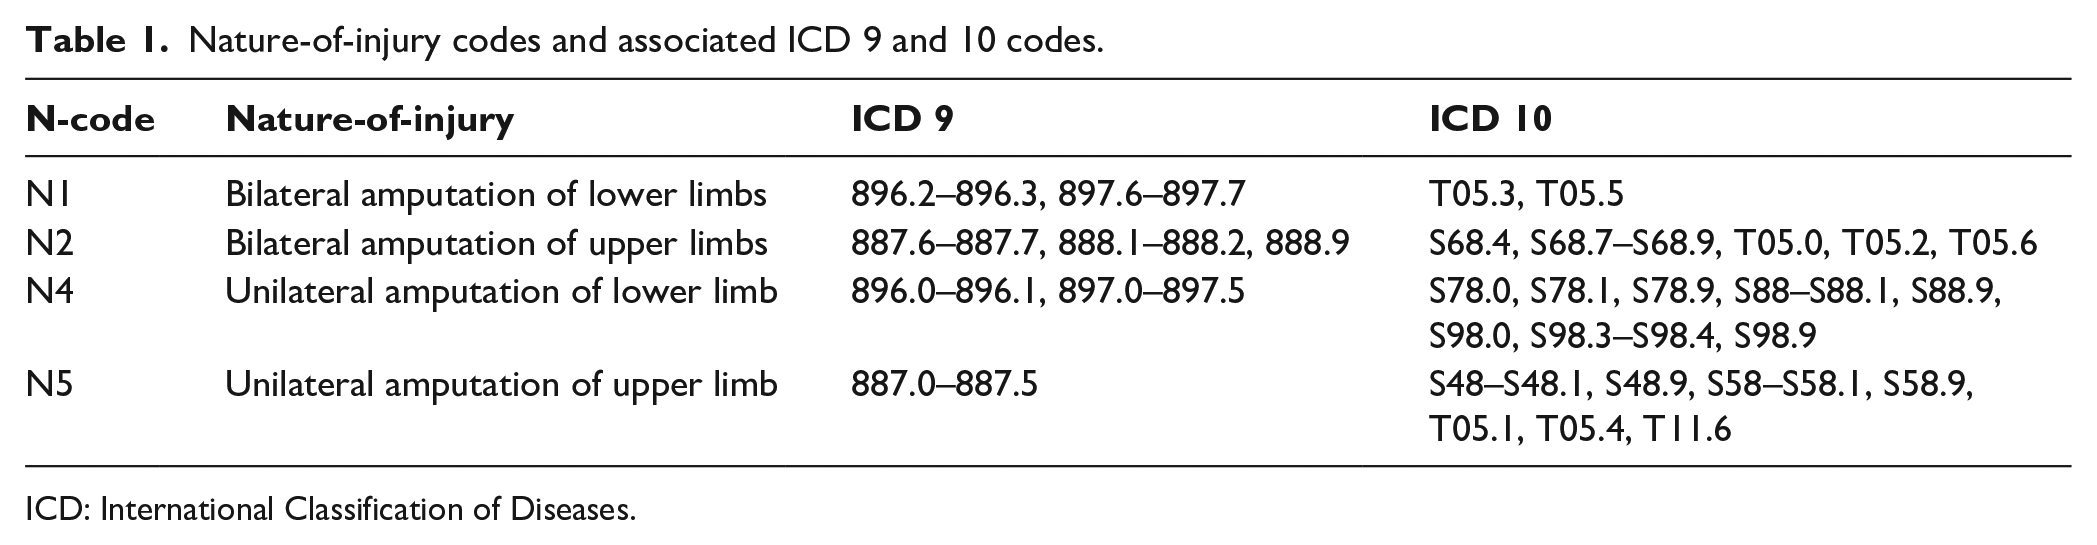
ICD: International Classification of Diseases.
Data sources
Injury data reported by E-code and N-code are both used in the analysis and serve different purposes. Data reported by E-code are used to estimate the incidence of injuries and by N-code are used to estimate their prevalence (Figure 1). Sources of incidence data are the scientific literature, survey data, surveillance data, outpatient data, inpatient data and insurance claims. Sources of prevalence data are follow-up studies that estimate the duration and level of disability. Several countries report injuries by both E- and N- codes, which allowed for the creation of a matrix to estimate global prevalence of injuries by either E- or N-code.20,24 This E-N matrix was based on dual-coded inpatient and emergency room data sets from 28 countries: Argentina, Bulgaria, China, Colombia, Cyprus, Czech Republic, Denmark, Egypt, Estonia, Hungary, Iceland, Iran, Italy, Latvia, Macedonia, Malta, Mauritius, Mexico, Mozambique, the Netherlands, Norway, Portugal, Slovenia, Spain, Sweden, Uganda, the United States, and Zambia. 20 All sources are catalogued in the Global Health Data Exchange (http://ghdx.healthdata.org).
Data estimation methods
We begin with a brief overview of the GBD methods for estimating injury prevalence and then describe our secondary analysis. First, GBD researchers estimate the incidence of injury for each cause using a Bayesian metaregression tool called DisMod-MR 2.1. DisMod-MR uses a compartmental model framework to reconcile evidence on incidence, cause-specific mortality, and remission. 20 Second, GBD researchers split the incidence for each cause into cause–nature combinations using the matrix described above. Third, the prevalence of injury is estimated by nature-of-injury and calculated for each cause–nature combination. All injuries are assumed to result in short-term disability; during the year of the incident, prevalence is the incidence multiplied by average duration of disability. A proportion of injuries results in long-term disability, and their prevalence is calculated using the ordinary differential equation solver in DisMod-MR 2.1, and results in incidence and mortality risk of the long-term disability. 24 Detailed methods for injury estimates have been described elsewhere.20,24
Note that the GBD researchers propagate uncertainty throughout the estimates to reflect the uncertainty from limitations in available data, data adjustments, and statistical models. A sample of 1000 draws is created with the sampling error of data inputs and used in every step of the GBD estimation process described above and the secondary analysis described below.
For this analysis, we began with unpublished GBD estimates of 1000 draws for injury prevalence rates for each of the four amputation N-codes by 5-year age category and by GBD region (Supplemental Material Section 2). Because the E-N matrix is based on data from relatively few countries, greater confidence can be placed in 21 regional summary estimates rather than detailed national estimates. Prevalence (i.e. the number of cases) is calculated as the product of the prevalence rate and regional population. Cases were then aggregated into five broader age categories (i.e. 0–4, 5–14, 15–49, 50–69 and >70 years) for each of the four amputation N-codes and 21 regions. Using the E-N matrix, we also calculated the cause of injury for each of the four amputation N-codes by age and region. The number of cases and prevalence rates were all reported as the mean of 1000 draws, with uncertainty intervals (UI) representing the 2.6 and 97.5 percentiles of the distribution.
Results
In 2017, we estimated that 57.7 million (UI 54.3–61.9) people worldwide were living with limb amputation due to traumatic causes (Figure 2). Of people with traumatic amputation, an estimated 31.7% had unilateral LL amputations (28.9 million, UI 26.9–32.1), 19.6% had unilateral UL amputations (11.3 million, UI 10.6–12.1), 19.1% had bilateral UL (11.0 million, UI 10.3–11.9), and 11.1% had bilateral LL (6.4 million, UI 5.9–7.0) The most common traumatic cause of amputation for all levels was falls, accounting for 52.2% of bilateral LL, 38.1% of bilateral UL, 36.9% of unilateral UL and 31.7% of unilateral LL amputations (Table 2). Additional leading causes of traumatic amputation varied by amputation level. Road injuries were the second leading cause of amputation for unilateral LL (18.6%), bilateral LL (13.9%), and unilateral UL (13.8%). The second leading cause of bilateral UL amputation was mechanical forces (15.1%) (Table 2). Also notable is the role conflict and terrorism play in unilateral LL amputation globally (Figure 3). Among children below 5 years of age (9299, UI 2203–27,440) and 5–14 years of age (83,197, UI 20,423–24,657), conflict and terrorism was the third leading cause of unilateral LL amputation. These figures are largely driven by amputations in North Africa and the Middle East and Eastern sub-Saharan Africa.
Global prevalence of amputation by traumatic cause of injury, 2017.
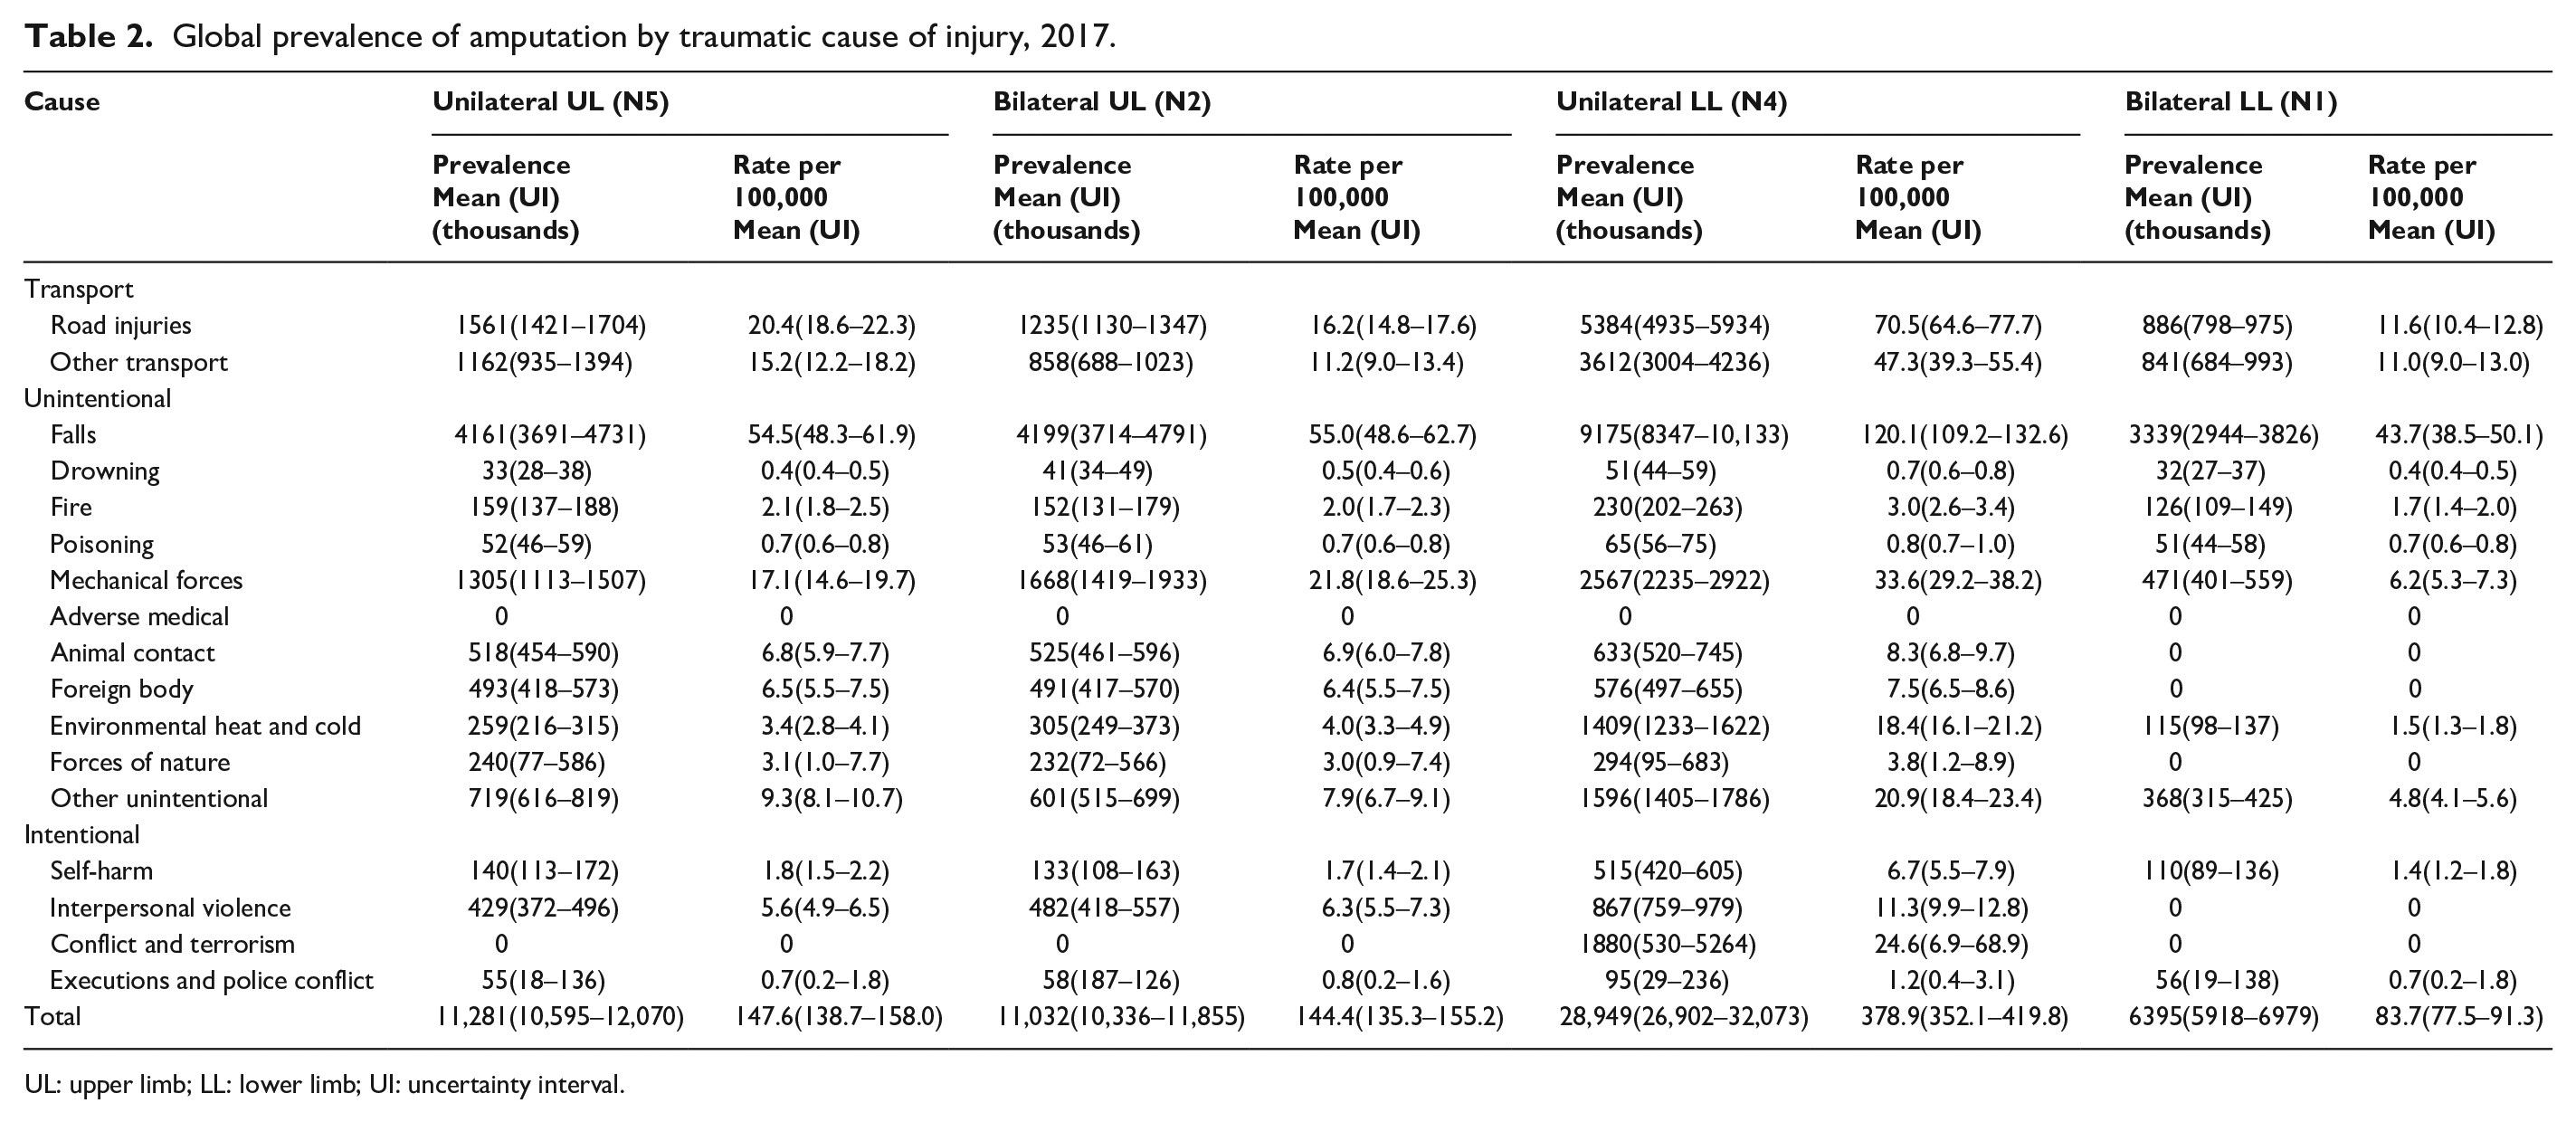
UL: upper limb; LL: lower limb; UI: uncertainty interval.
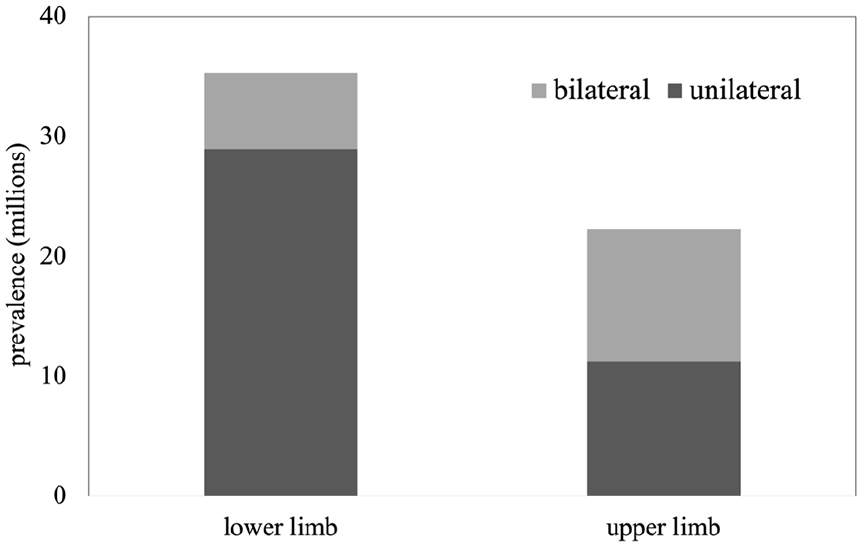
Estimated traumatic global limb amputation in 2017.
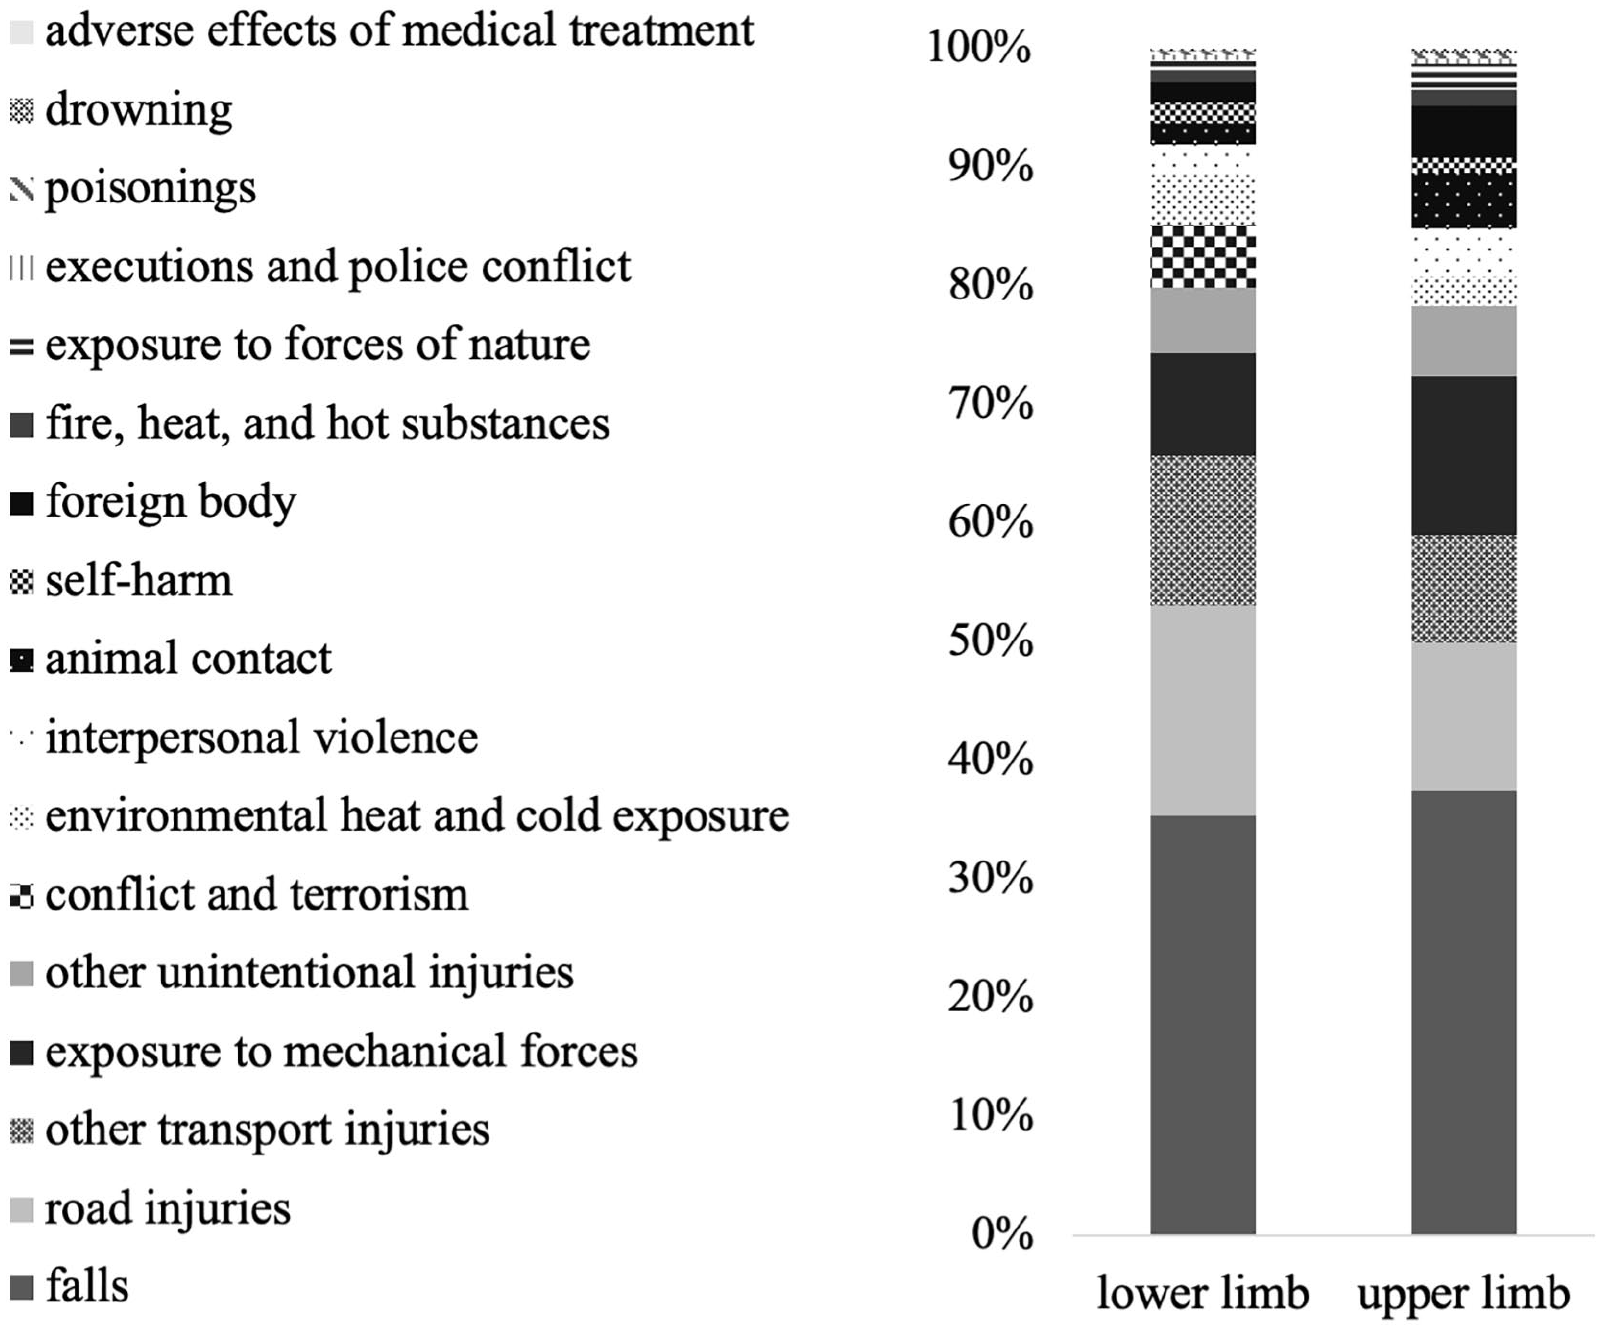
Estimated 2017 traumatic limb amputation causes by amputation level.
Regional prevalence and prevalence rates
GBD estimates provide insight into regional trends of traumatic limb amputation (Figure 4(a)). Prevalence of traumatic amputation (11.2 million, UI 10.6–12.0) was the highest in East Asia. South Asia has the second highest prevalence for traumatic amputation (9.7 million, UI 9.1–10.3). However, comparatively modest prevalence rates per 100,000 for trauma in East (757, UI 712–807) and South Asia (544, UI 512–576) suggest that the high prevalence stems from large populations rather than high rates. Regions with high prevalence rates per 100,000 for traumatic amputations include Central Europe (2478, UI 2316–2674), Australasia (2220, UI 2068–2422) and Eastern Europe (2096, UI 1973–2235). These regions, despite their high prevalence rates per 100,000, accounted for only small portions of total global traumatic amputation prevalence (5.2%, 1.2%, and 8.1%, respectively) (Figure 4(b)). Prevalence and prevalence rates by country are provided in the Supplemental Material Section 3.
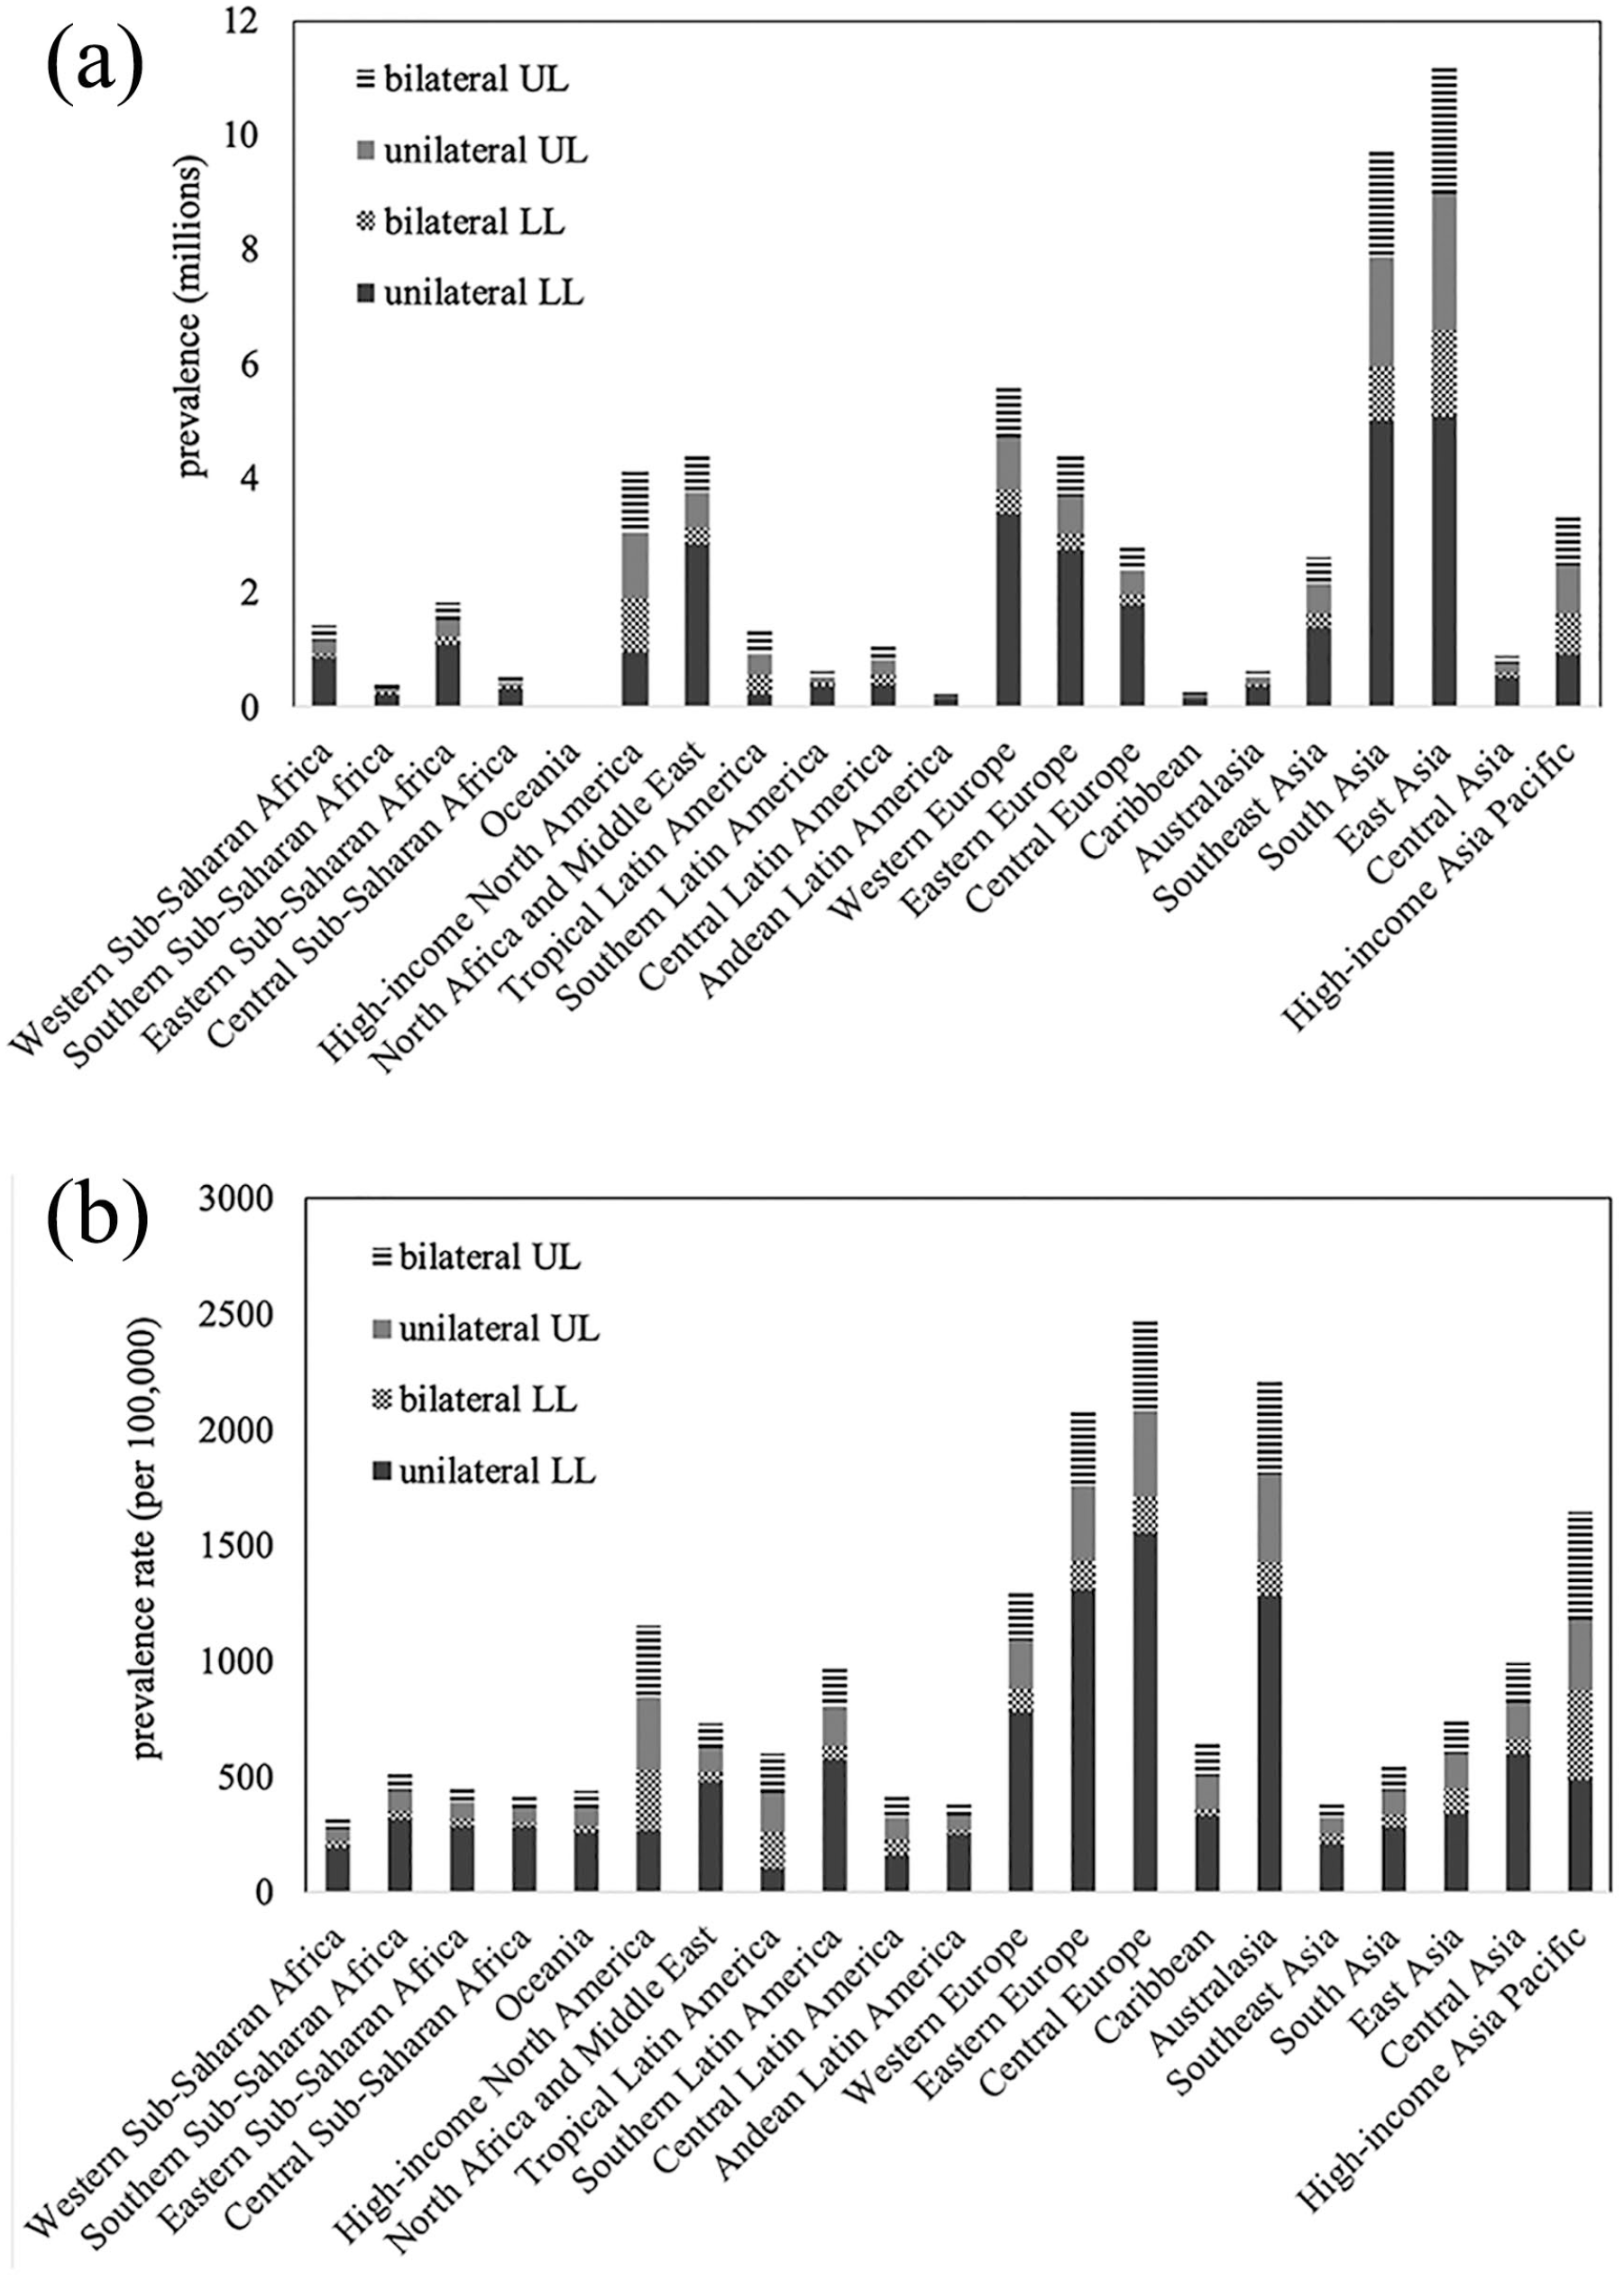
(a) Estimated prevalence of traumatic limb amputation in 2017 by level and region. (b) Estimated prevalence rate of traumatic limb amputation in 2017 by level and region.
Prevalence by region and age
In children, aged below 5 and 5–14 years, the highest prevalence of traumatic amputation was found in South Asia (60,333, UI 49,134–72,355 and 468,553, UI 409,415–537,369), North Africa and the Middle East (33,681, UI 26,114–49,145 and 243,682, UI 26,114–49,145), and East Asia (29,174, UI 24,387–35,020 and 233,098, UI 201,527–270,206). For adults, aged 15–49 years, the highest prevalence was also found in South Asia (4.9 million, UI 4.5–5.3), followed by East Asia (4.8 million, UI 4.4–5.1) and North Africa and the Middle East (2.5 million, UI 2.1–3.5). For adults aged 50–69 years, East Asia leads (4.4 million, UI 4.1–4.7), followed by South Asia (2.9 million, UI 2.8–3.1) and Western Europe (1.9 million, UI 1.8–2.1). Adults aged above 70 years have the highest prevalence in East Asia (1.8 million, UI 1.7–1.9), Western Europe (1.7 million, UI 1.6–1.8), and South Asia (1.3 million, UI 1.2–1.4) (Figure 5).
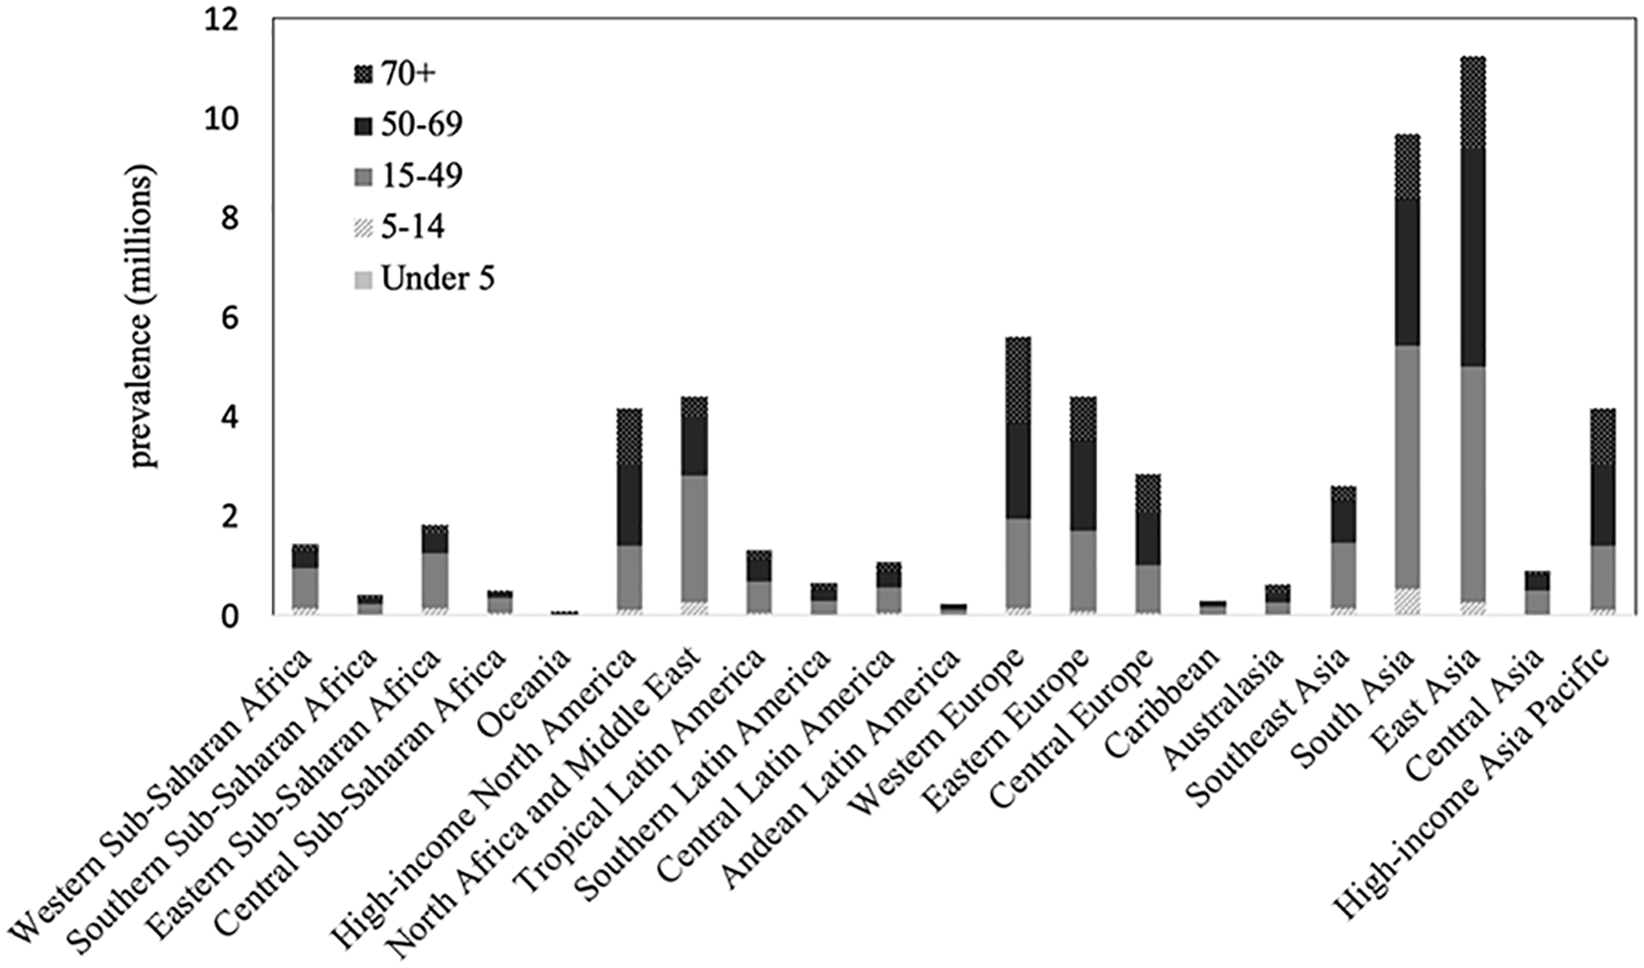
Estimated traumatic limb amputation prevalence in 2017 by age group.
Prosthetic personnel need
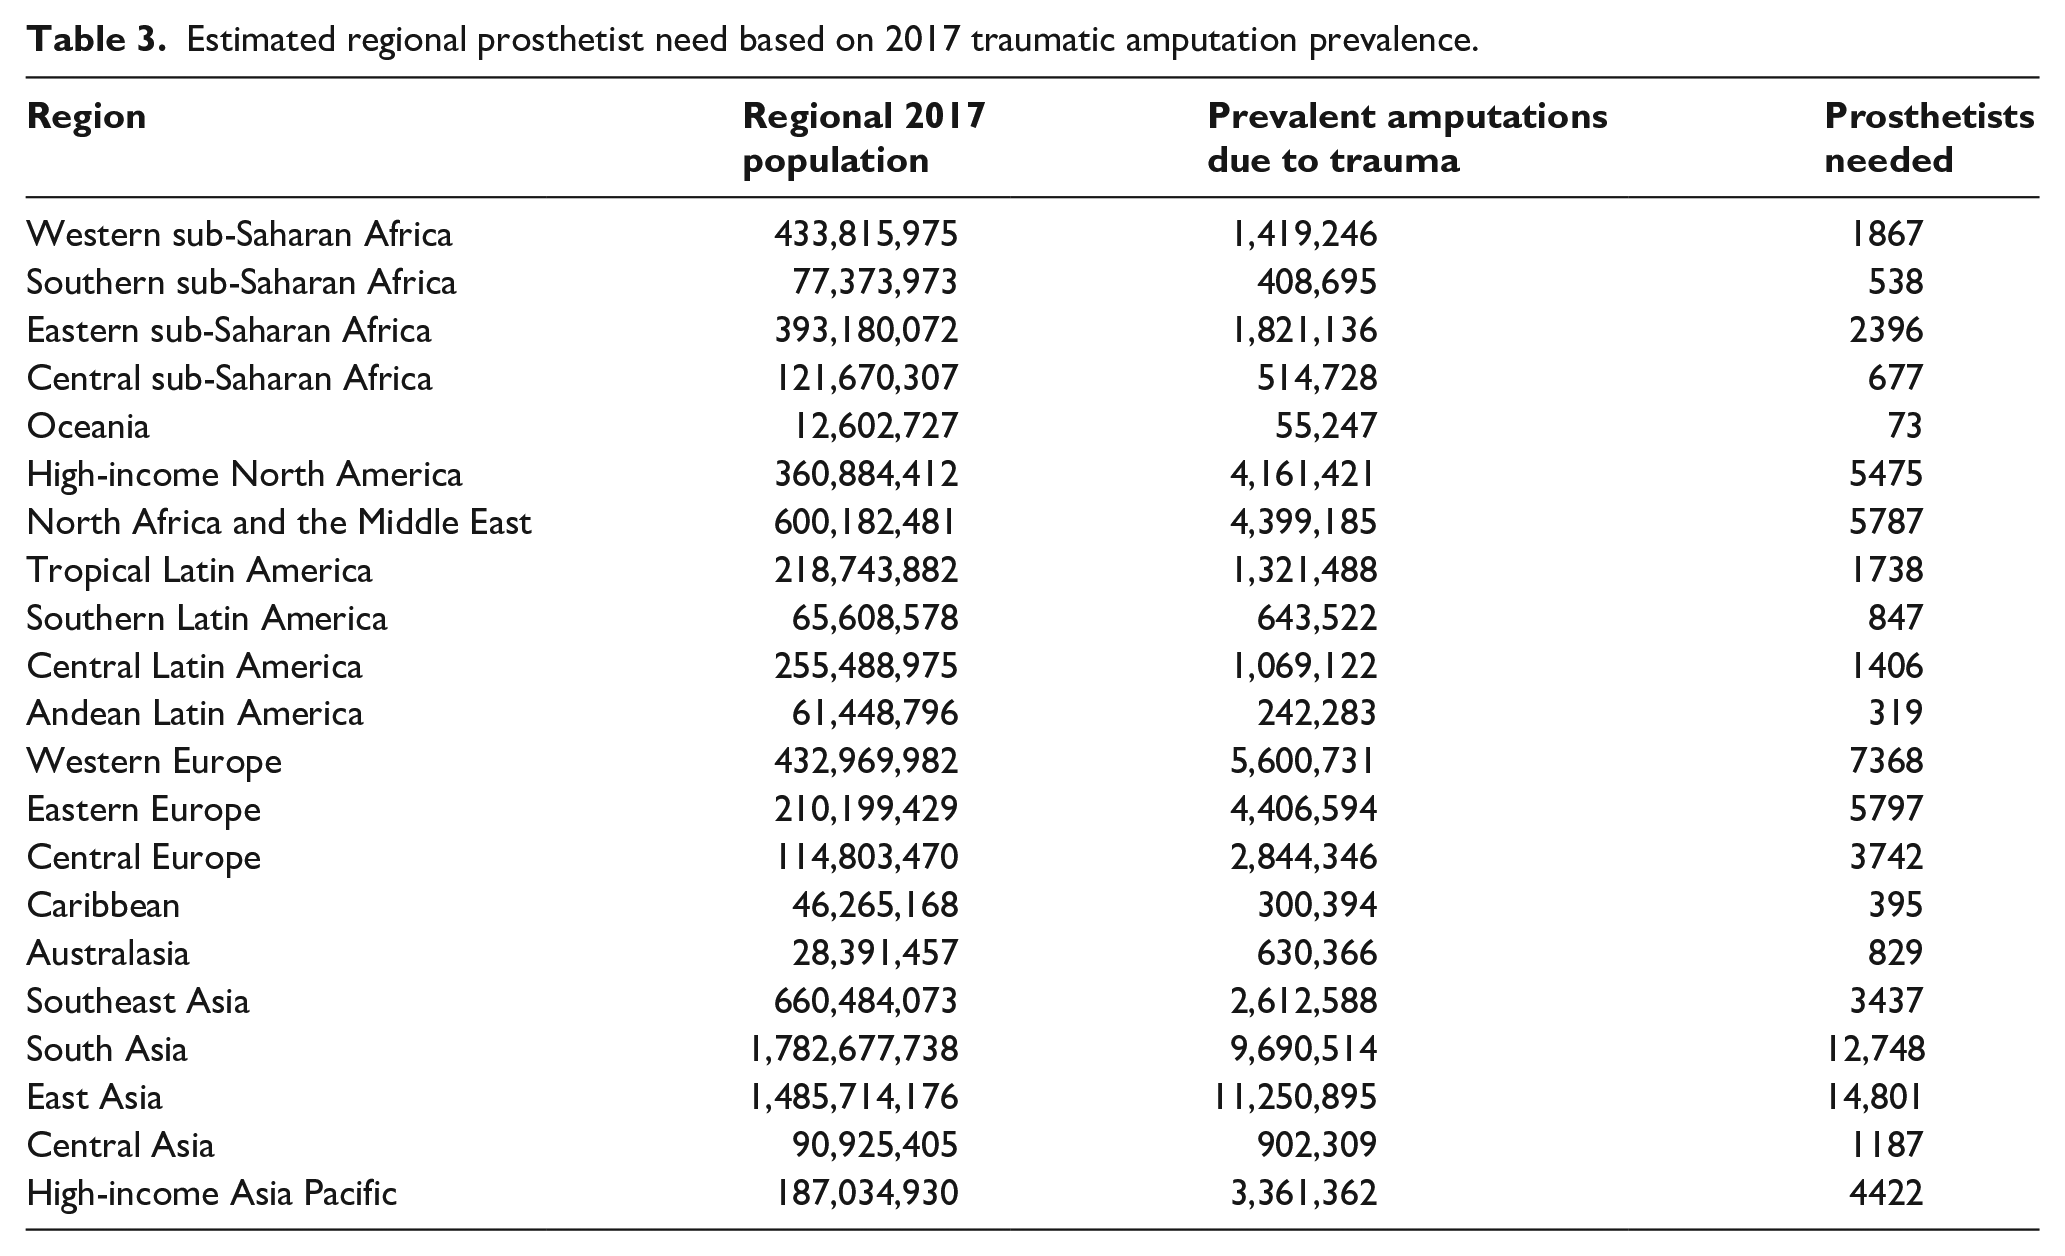
GBD 2017 traumatic amputation estimates can serve to inform regional and country-level prosthetic personnel needs to serve people living with traumatic amputations. We used the WHO guidelines: (1) a person with an amputation needs a new prosthesis every 3 years and (2) a trained prosthetist can, on average, treat 250 people a year. 12 This average of 250 people was then weighted by the location in which a clinician works, with larger (i.e. national) clinics treating more complex and time-consuming cases (district level 250 × 1.2 = 300, provincial 250 × 1.0 = 250 and national 250 × 0.5 = 125). 12 We estimated that approximately 75,850 prosthetists are needed worldwide to treat people with traumatic limb amputation. Table 3 provides regional estimates.
Estimated regional prosthetist need based on 2017 traumatic amputation prevalence.
Discussion
GBD 2017 prevalence and prevalence rate results can be leveraged to provide a global picture of traumatic amputation and explore implications for both prevention and prosthetic rehabilitation. Regional prevalence estimates provide insight into the current population of people living with traumatic amputation and allow for current and future prosthetic service provision planning for people with amputation due to trauma. In addition, prevalence rates allow comparison between regions while accounting for variability in regional population.
Unilateral LL is the most prevalent traumatic amputation level. Most traumatic unilateral LL amputations are caused by falls, road injuries, and transport injuries. South and East Asia have the most people living with amputation due to trauma. High prevalence in Asia is driven by large regional populations with only modest traumatic amputation rates. Regions with the highest prevalence rates are Central and Eastern Europe, Australasia, high-income Asia Pacific, and high-income North America.
Notably, GBD estimates indicate similar prevalence of global unilateral and bilateral UL amputations due to trauma. This finding is contradictory to clinical experience and bears investigation in future rounds of GBD. One possible explanation is that nationally representative data on upper limb amputations by cause are relatively sparse, but additional explanations may be discovered.
Prevention
Traumatic amputation is a largely preventable injury. While injuries are multifactorial, prevalence by cause provides some insight into the most common injury mechanisms that result in amputation and those that may be modifiable.
GBD 2017 estimates show falls to be the leading cause of traumatic limb amputation globally. Mechanisms of injurious falls, such as those resulting in spinal cord injury, vary between LMICs and HICs due to demographic and economic differences. 25 Countries with aging populations have increasing incidence of low-height injurious falls. 25 In LMICs, injurious falls more commonly occur among children at play 25 and young adults falling from trees or rooftops or when carrying heavy loads. 26 Primary prevention for falls includes implementation of fall prevention programmes for older adults, 27 structural safety measures for children (e.g. window guards, limited spacing between balcony railings), 28 and occupational safety practices and education for working adults. 29 Secondary prevention may focus on healthcare access and surgical techniques to treat fall-related injuries and prevent late amputation (i.e. more than 12 weeks after the initial injury) due to infection, non-union fractures, or painful deformities. 9
Road traffic and other transportation injuries are the second and third leading causes for traumatic LL amputation. Strategies to prevent injuries due to road traffic accidents are well established as awareness of such injuries has increased in LMICs. 30 A recent systematic review found that road safety legislation (e.g. prohibition of cell phone use, speeding penalties, child restraint use) with strong enforcement initiatives was the most successful intervention, followed by multifaceted campaigns to improve public awareness and speed control. 31 Despite increased awareness, success rates of traffic injury prevention strategies vary regionally and require continued implementation and monitoring. 31
Prosthetic rehabilitation
Prosthetic service provision is multifaceted and is tailored specifically to each individual with amputation. We will address two essential aspects of prosthetic service provision to provide interpretation and implications of GBD 2017 traumatic amputation prevalence estimates. These two categories are prosthetic personnel and prosthetist education.
Prosthetic personnel
Prevalence of non-fatal limb amputation due to trauma can inform prosthetic needs for people living with traumatic amputation worldwide. Using WHO guidelines for prosthetic personnel, we estimated that approximately 75,850 prosthetists are needed worldwide to treat the 57.7 million people living with traumatic limb amputation globally. 12
We must emphasize that these estimates are limited to one specific etiologic category and do not include people who live with amputation due to diabetes, cancer or congenital anomalies. Diabetes-related amputations account for a substantial proportion of new amputations annually; however, incidence has been reported to vary by region.3,4 Previously published GBD 2015 estimates for diabetes-related amputation suggest 7.3 million people globally were living with amputation due to diabetes in 2015. 32 Inclusion of this estimate of diabetes-related amputations would result in a projected prosthetist need of 85,465 globally to care for people living with amputations due to both trauma and diabetes.
Notably, using these estimates, only approximately 10% of prevalent cases of limb amputation globally are due to diabetes-related causes. This surprising number is most likely explained by the high mortality associated with amputation among people with diabetes. Mortality rates for people who experience a lower limb amputation due to diabetic or vascular etiologies have been reported to be as high as 70% within 5 years from amputation. 33 Furthermore, people most often experience diabetes-related amputations later in life, when normal life expectancy is less.
In addition, orthotic need is not included in these estimates. Despite the conservative nature of these estimates, they greatly exceed WHO estimates that 47,000–53,000 prosthetists/orthotists are needed globally to care for the 35–40 million people in need of orthotic and prosthetic services. 10
Prosthetist education
Education for prosthetists includes both foundational knowledge and skills, and specialized content related to amputation levels, etiologies, and componentry. ISPO recommends that prosthetic curriculum be ‘based on the demographics and epidemiology of the programme setting’ (p. 37). 34 In addition, clinicians in LMICs may require more training and technical skill than clinicians practicing in HICs to compensate for technology, material, and societal constraints. 35 For example, prosthetic component manufacturing is not within the scope of HIC prosthetists but has been identified as essential for sustainable prosthetic service provision in LMICs. 35 Conversely, recent technological advancements, such as direct socket manufacturing and 3D printing, may redefine the role and capacity of prosthetists globally. The influence of such advancements remains to be seen as this technology has not yet been integrated into ISPO education standards 34 or implemented in routine prosthetic clinical care. GBD 2017 estimates can inform prosthetist education to better align with the services and skills most required and utilized regionally. Three specific patient populations that vary by region and require special consideration are discussed below.
Upper limb
Our study provides clear evidence of need for UL prostheses in many regions of the world, but most specifically prevalence is high in South Asia, East Asia, high-income North America, and Western Europe. Specialized UL componentry can be expensive, 36 challenging to acquire and often must be imported to LMICs. 37 In addition, provision of functional UL prostheses requires specific clinical and technical skills. Low-tech, low-cost UL prostheses have been developed and described in published literature in an effort to improve access to functional UL prostheses in LMICs.38,39 However, evidence supporting uptake and functional outcomes of such devices is limited, and people with UL amputation still lack access to functional UL prostheses in many regions of the world. While technological developments may improve access to devices in LMICs, such developments must also be accompanied by appropriate education of prosthetists. 40
UL prosthetic curriculum should be emphasized in these four regions with higher prevalence. Due to the relatively small proportion of people with amputation who have UL amputation, many prosthetists only occasionally fabricate and fit UL prostheses. Until recently, UL prosthetic curriculum was deemed an optional component of required curriculum for Category II prosthetists (now Associate Prosthetist/Orthotist). 12 New ISPO education standards emphasize the need for curriculum to be based on the region’s population and prosthetic needs, such as those identified in this article.
Paediatric
Our study identifies three regions with the highest prevalence of paediatric traumatic amputation: South Asia, North Africa and the Middle East, and East Asia. These regions require special consideration for paediatric and lifelong prosthetic care as these children age. 41 Prosthetic care for children with amputation involves more frequent prosthetic adjustments and replacement due to high activity levels, growth, and development. 41 For example, a 10-year old with a LL amputation will likely require 25 or more prostheses over the course of his or her life. 42 Without appropriate and ongoing prosthetic care, children with amputation experience restricted mobility and function. Such disability can subsequently lead to exclusion from education and discrimination in their community. 43 Disability and lack of education are closely associated with poverty and poor health outcomes. 44
Prosthetists who care for paediatric patients require additional education in paediatric development, etiologies, complications, and specialized componentry. HIC prosthetists who treat children often specialize in paediatric prosthetics through participation in professional communities 45 and professional development courses, 46 which provide education beyond standard prosthetic curriculum. Resources such as these are rarely available in LMICs but are well suited to capacity building and knowledge transfer efforts through collaboration and digital continuing education, as deemed compulsory in the 2017 WHO standards for prosthetics and orthotics. 10 Beyond specialized education, prosthetic care of children with amputation requires specific componentry. Prosthetic components for children are distinct from adult components in size, weight, design and control mechanisms. 41 Published literature on paediatric prosthetic components in LMICs is limited47,48 but may inform local manufacturing in regions with high prevalence of paediatric amputation.
Study limitations
General limitations of the GBD methodology have been described elsewhere. 20 Limitations specific to this secondary analysis are described below. This work describes only traumatic limb amputation prevalence and thereby cannot provide a comprehensive perspective on all global limb amputation. In addition, while our prevalence estimates account for people living with traumatic amputation, they do not provide information on new traumatic amputations or change in amputation rates due to trauma over time. GBD estimates also lack amputation level specificity (e.g. transtibial, transfemoral), which prosthetists and therapists require for prosthetic rehabilitation planning.
In addition, the GBD 2017 study imposed a hierarchy to the selection of the nature-of-injury category that resulted in the largest burden when a person experienced multiple injuries. Specifically, people who experienced multiple severe injuries, including a limb amputation, such as spinal cord injuries or traumatic brain injuries, would not be accounted for in traumatic amputation estimates. This hierarchy may have resulted in an underestimation of prevalence.
Conclusion
In 2017, we estimated that 57.7 million people were living with a limb amputation due to trauma. Prevalence of amputation varied by cause, age and geographical region. Regions that had the highest prevalence were East Asia, South Asia, high-income North America, and Western Europe. Differences between age groups and regions may serve to inform prevention strategies and planning for future prosthetic and rehabilitation services as well as to guide prosthetist education.
Supplemental Material
sj-pdf-1-poi-10.1177_0309364620972258 – Supplemental material for Global prevalence of traumatic non-fatal limb amputation
Supplemental material, sj-pdf-1-poi-10.1177_0309364620972258 for Global prevalence of traumatic non-fatal limb amputation by Cody L McDonald, Sarah Westcott-McCoy, Marcia R Weaver, Juanita Haagsma and Deborah Kartin in Prosthetics and Orthotics International
Footnotes
Author contributions
The author(s) disclosed the following roles as contributors to this article: C.M. was responsible for conceptualization, data curation, formal analysis, methodology, project administration, resources, visualization, and writing - original draft. S.W.C. was responsible for supervision and writing - review & editing. M.W. was responsible for methodology, supervision, and writing - review & editing. J.H. was responsible for methodology and writing - review & editing. D.K. was responsible for supervision and writing - review & editing.
Declaration of conflicting interests
The author(s) disclosed no potential conflicts of interest with respect to the research, authorship and/or publication of this article.
Funding
The author(s) disclosed that they received no financial support for the research, authorship and/or publication of this article.
Supplemental material
Supplemental material for this article is available online.
References
Supplementary Material
Please find the following supplemental material available below.
For Open Access articles published under a Creative Commons License, all supplemental material carries the same license as the article it is associated with.
For non-Open Access articles published, all supplemental material carries a non-exclusive license, and permission requests for re-use of supplemental material or any part of supplemental material shall be sent directly to the copyright owner as specified in the copyright notice associated with the article.