
Abstract
Background:
In principle, lower limb bone-anchored prostheses could alleviate expenditure associated with typical socket manufacturing and residuum treatments due to socket-suspended prostheses.
Objective:
This study reports (a) the incremental costs and (b) heath gain as well as (c) cost-effectiveness of bone-anchored prostheses compared to socket-suspended prostheses.
Study design:
Retrospective individual case-controlled observations and systematic review.
Methods:
Actual costs were extracted from financial records and completed by typical costs when needed over 6-year time horizon for a cohort of 16 individuals. Health gains corresponding to quality-adjusted life-year were calculated using health-related quality-of-life data presented in the literature.
Results:
The provision of bone-anchored prostheses costed 21% ± 41% more but increased quality-adjusted life-years by 17% ± 5% compared to socket-suspended prostheses. The incremental cost-effectiveness ratio ranged between –$25,700 per quality-adjusted life-year and $53,500 per quality-adjusted life-year with indicative incremental cost-effectiveness ratio of approximately $17,000 per quality-adjusted life-year. Bone-anchored prosthesis was cost-saving and cost-effective for 19% and 88% of the participants, respectively.
Conclusion:
This study indicated that bone-anchored prostheses might be an acceptable alternative to socket-suspended prostheses at least from a prosthetic care perspective in Australian context. Altogether, this initial evidence-based economic evaluation provided a working approach for decision makers responsible for policies around care of individuals with lower limb amputation worldwide.
Clinical relevance
For the first time, this study provided evidence-based health economic benefits of lower limb bone-anchored prostheses compared to typical socket-suspended prostheses from a prosthetic care perspective that is essential to clinicians and decision makers responsible for policies.
Background
Some functional issues for individuals with lower limb amputation can be overcome by replacing the socket-suspended prosthesis (SSP) with a bone-anchored prosthesis (BAP) relying on osseointegrated fixation surgically implanted into the residual bone.1–6 Allegedly, BAP engenders major clinical benefits with acceptable clinical risks leading to a significant improvement in health-related quality of life.3,7–31 Furthermore, BAP could potentially reduce some prosthetic, medical and financial burden by alleviating expenditure associated with socket manufacturing and treatments of skin-socket interface problems over a user’s lifespan.26,32,33
Consequently, policy decision makers are currently under significant pressure to support provision of BAP while answering a burning question: is BAP cost-effective compared to SSP?
Untangling the financial cost of BAP is tedious given that surgical, rehabilitation, prosthetic and medical care are intertwined and, possibly, covered in part or in whole by multiple entities (e.g. public health care, private health fund, insurance, workers compensation) or the patients themselves (e.g. out-of-pocket expenses, fundraising). 34
Haggstrom et al.
32
concluded that patients with BAP
make significantly fewer visits per year to a prosthetic workshop compared with a similar group using [SSP]. Despite the differences in visits for prosthetic service between the groups the overall prosthetic costs for [BAP] were comparable with those for [SSP]. We suggest this is due to more sophisticated components that can be used with [BAP].
However, this study relied on retrospective analysis and surveys to extract costs in a non-profit prosthetic facility, publicly founded by the Swedish health care system.
Recently, Frossard et al. 35 attempted to cross-compare typical prosthetic care costs for the provision of SSP and BAP. SSP costs were established depending on prosthetic components required to match the ambulation abilities for each Medicare functional level. 36 BAP costs were simulated for low-cost, budget and high-cost options depending on the performance of advanced and more costly components (i.e. foot, knee, connector, protective device). However, this study compared costs for provision of prosthetic care that were specific to an Australian State governmental organisation.
To date, there is a consensus around the prescription to fit BAP with costly microprocessor-controlled knees to patients with osseointegrated fixation as these component’s provide stance phase stability, swing phase responsiveness, prevent falls and avoid excessive loading that are ultimately critical to protect the fixation and reduce adverse events (e.g. periprosthetic factures, breakage of fixation parts, injuries to hip joint).24,37–40
However, there have been no published evaluations of the costs and health-related quality of life impact of BAP compared with SSP.
The ultimate aim of this study was to determine BAP’s economic benefits from a publicly founded Australian State prosthetic care provider perspective. The main purpose was to produce an initial cost-effectiveness analysis of BAP as a new treatment compared to SSP as conventional intervention for individuals with transfemoral amputation. The specific objectives were to report:
Incremental costs for BAP and SSP combining actual costs extracted from financial system and typical costs based on best-known reimbursement standards for a cohort of 16 individuals over a 6-year time horizon.
Scenarios for health gain with BAP and SSP based on quality-adjusted life-year (QALY) extracted from high-quality literature comparing individual case-matched health-related quality of life data.
Cost–utility of the BAP compared to SSP in terms of cost per QALY, leading to cost-effectiveness analysis based on conservative cost-effectiveness threshold (CET).
Methods
Study design
This study was commissioned by Queensland Artificial Limb Service (QALS) which depends on the Queensland Government Minister of Health.35,41
This economic evaluation of BAP compared with SSP was initially informed by retrospective individual case-controlled of costs. Impact of BAP on utility was based on estimates from the literature (Figure 1).
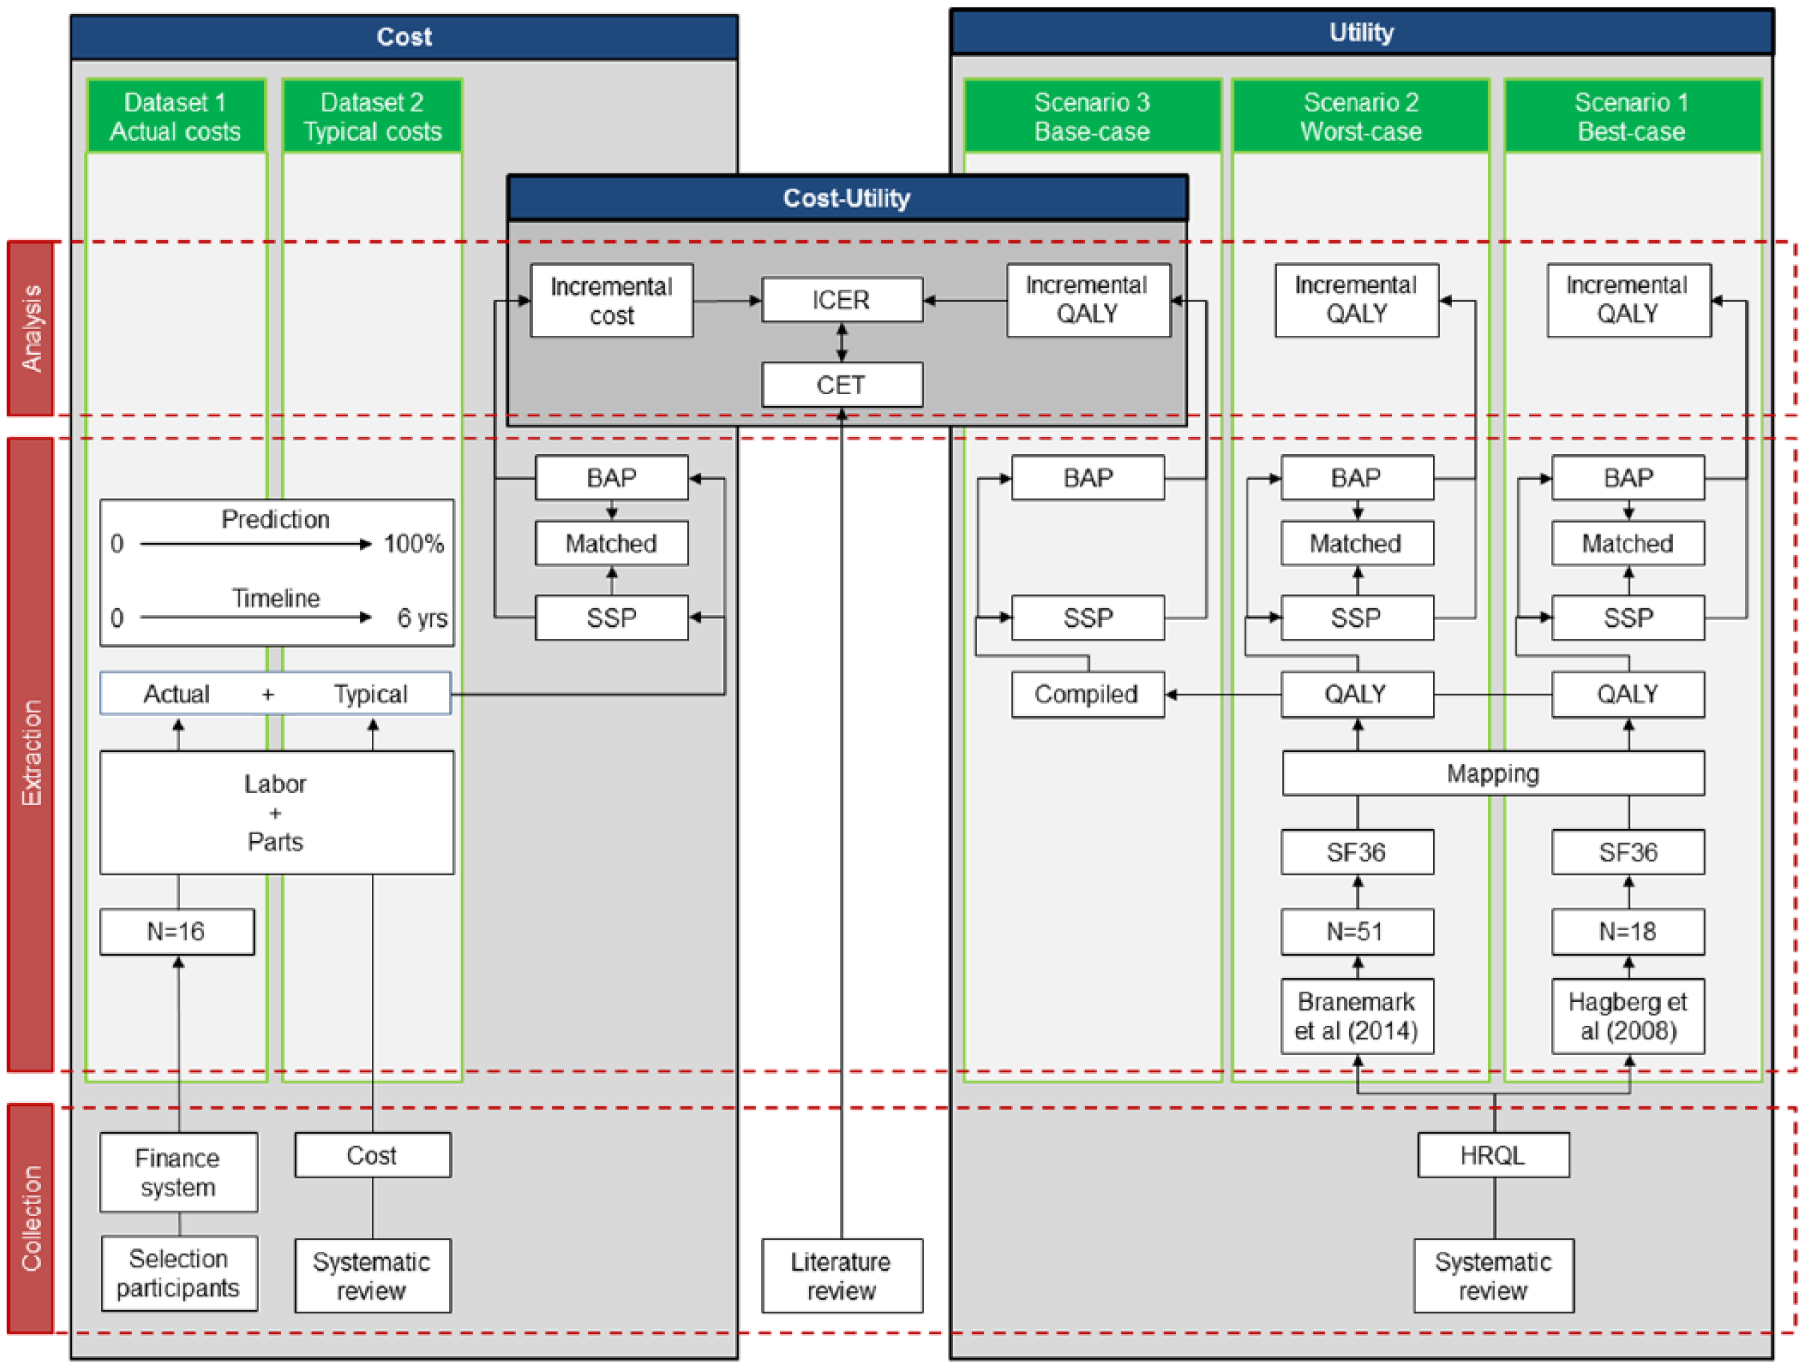
Overview of data flow for collection, extraction and analysis of cost (Datasets), utility (Scenarios) and cost–utility data from a prosthetic care perspective.
Participants
The participants were registered consumers with transfemoral amputation solely supported by QALS who underwent treatment for BAP between 2011 and 2016. 41
The study followed ethical guidelines from the Queensland Health’s Health Innovation, Investment and Research Office (HIIRO) responsible for consultation, development and review of State-wide research ethics and research governance policies.
Estimation of costs
All costs are reported in Australian dollars (1 Australian dollar ≈ 0.71 euro ≈ 0.60 British pound ≈ 0.76 US dollar) according to 2016–2017 prices. Total ongoing prosthetic care costs for SSP and BAP were estimated for the same participant for an overall duration of 12 years including a time horizon of 6 years before and after the treatment, respectively.42,43 This time frame included two consecutive 3-year funding cycles. Each cycle corresponded to manufacturer’s time of warranty or the expected lifespan for prosthetic components. 43
The first step in estimation of ongoing costs was to search retrospective electronic financial data for each participant up to 6 years prior and after surgery up, until 19 June 2019, when available (Dataset 1). Cost data were collated using QALS vouchers submitted by accredited Certified Prosthetists and Orthotists (CPO) claiming expenses for labour (e.g. fitting prosthesis) and parts (e.g. prosthetic knees and feet units). However, records covered only partially the time horizon in most cases. Information was missing when a participant became a QALS consumer less than 6 years before the surgery or the surgery occurred less than 6 years before the end of the study.
Consequently, the second step in estimation of ongoing costs was to complete the missing yearly costs with typical costs for SSP and BAP using the only costing data recently compiled by Frossard et al. 35 (Dataset 2). The costs considered in this study were extracted accordingly to individual participants’ classification (i.e. K2, K3) for SSP and budget fitting options for BAP based on the conservative assumption that participation will claim the full yearly allowance (Supplementary Table 4). No costs were conservatively discounted since the largest portion of the overall costs occurs in first and third years when knees and feet are supplied, as detailed in Supplementary Table 4. 44
Estimation of utility
In this study, the primary outcome of choice was the mid-term change in health-related quality of life assessed up to 2 years post-BAP treatment.
First, the literature comparing the health-related quality-of-life data between SSP and BAP was searched within most common databases (i.e. MEDLINE/PubMed, CINAHL, Web of Science, Google Scholar, Embase, Scopus, LILACS) using terms (i.e. MeSH, commonly used keywords) as recommended in scoping review protocol. 45 Three articles were found reporting Short Form 36 (SF36) datasets including physical and mental components summary scores as well as the eight health dimension scores (i.e. Physical Functioning, Role functioning from a Physical Perspective, Bodily Pain, General Health, Vitality, Social Functioning, Role functioning from an Emotional perspective, Mental Health).12,14,15 Hagberg et al.’s 15 study was discarded because only BAP data at follow-up was presented. Hagberg et al. 12 and Branemark et al. 14 were considered in Scenarios 1 and 2 since they both compared individual case-matched data for cohort size of 18 and 51 treated in Sweden, respectively (Figure 1). Both studies reported SF36 data collected within 6 months before (SSP) and 24 months after (BAP) treatment with 2B level of evidence according to Oxford Centre for Evidence-Based Medicine classification.
Then, each selected SF36 dataset was converted into utility values and QALY using the Ara and Brazier 46 regression model. These utility values were multiplied to estimate the difference in QALYs over the 6-year time horizon.
Cost–utility
Individual incremental cost-effectiveness ratios (ICERs) were calculated for three scenarios. The first and second scenarios considered the incremental utility calculated as the difference between QALY for SSP and BAP multiplied by 6 years of funding cycle extracted from Hagberg et al. 12 and Branemark et al. 14 , respectively. The third, so-called base-case, scenario was created by averaging differences in QALY between first and second scenarios (Scenario 3).
The oft-cited CET is $50,000 per QALY. 47 In this study, a conservative threshold of $40,000 per QALY was used as suggested by the Australian Pharmaceutical Benefits Advisory Committee. 48 We considered that BAP costing less than $20,000 per QALY, between $20,000 and $100,000 per QALY and more than $100,000 per QALY was most likely, likely and unlikely to lead to adoption, respectively. 49
Finally, the indicative ICER and CET were plotted on the cost-effectiveness plane.49,50
Uncertainty
The aggregated costs and ICER data were described using basic mean and standard deviation as well as minimum and maximum for sensibility analysis.
However, further characterisation of the costs was needed since actual costs could be the most sensible variables of the ICER because of individual data extraction. The inter-participant variability of cost was characterised using the coefficient of variation (CV). A CV inferior to 33%, between 34% and 66% and superior to 66% indicated in low, moderate and high inter-variability, respectively. Furthermore, the relationship between overall costs and potential confounders (e.g. age, height, mass, body mass index (BMI), age at amputation, age at treatment) was characterised by correlation coefficient. A variable called ‘prediction’ corresponding to relative typical cost over the total cost, expressed in percentage, was created to indicate the level of uncertainty of the cost information. The percentage of the individuals presenting a positive and negative difference of overall costs indicating more costly and cost-effectiveness of BAP was determined, respectively. The percentage of individuals in each quadrant of the cost–utility plot was also determined.49,50 The single indicative ICER retained for discussion corresponded to the average ICER determined with QALY from the base-case scenario. Finally, percentage of individuals presenting cost per QALY below the CET was extracted.
Results
Cohort
A total of 16 Queensland-based consumers with transfemoral amputation were fitted with BAP during the eligible study period (Table 1). The cohort included 14 (88%) males and 2 (12%) females who, all combined, had an average age of 55 ± 10 years, height of 1.76 ± 0.1 m, mass of 85 ± 15 kg and BMI of 27 ± 4 kg/m2. A total of 9 (56%), 3 (19%), 1 (6%) and 3 (19%) participants were amputated due to trauma, tumour, congenital or disease. Six (38%) and 10 (63%) participants were classified as K2 and K3 functional level, respectively. Participants were 26 ± 18 years old and 53 ± 10 years old at age of amputation and treatment, respectively.
Individual demographic, amputation and timeline.
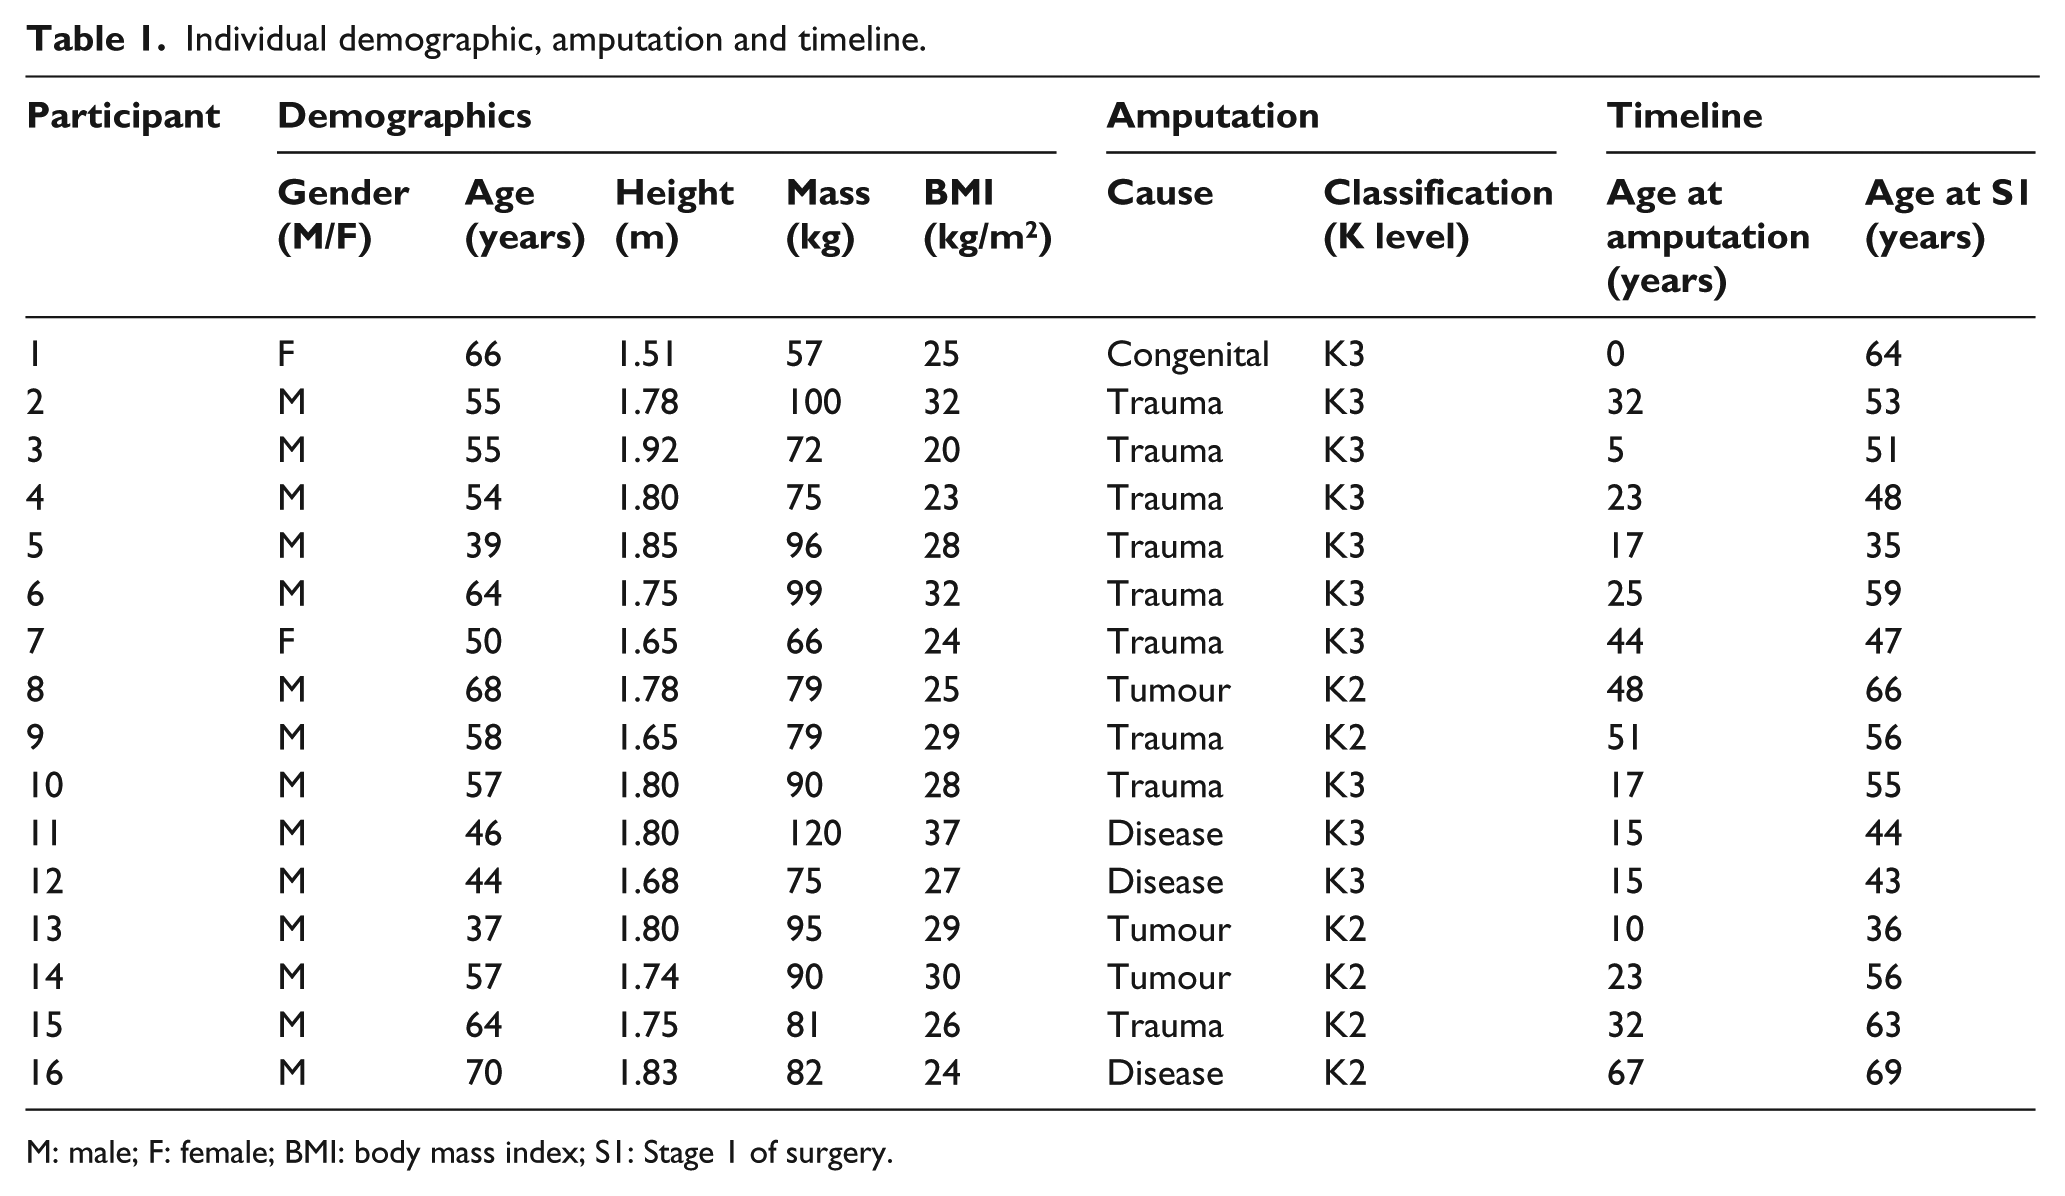
M: male; F: female; BMI: body mass index; S1: Stage 1 of surgery.
Incremental costs
The actual costs were extracted from a total of 880 claims corresponding to a single item of expense including 569 for SSP and 311 for BAP, respectively. These costs are aggregated in Table 2.
Individual number of claims and costs used to determine incremental costs for provision of socket-suspended prosthesis (SSP) and bone-anchored prosthesis (BAP).
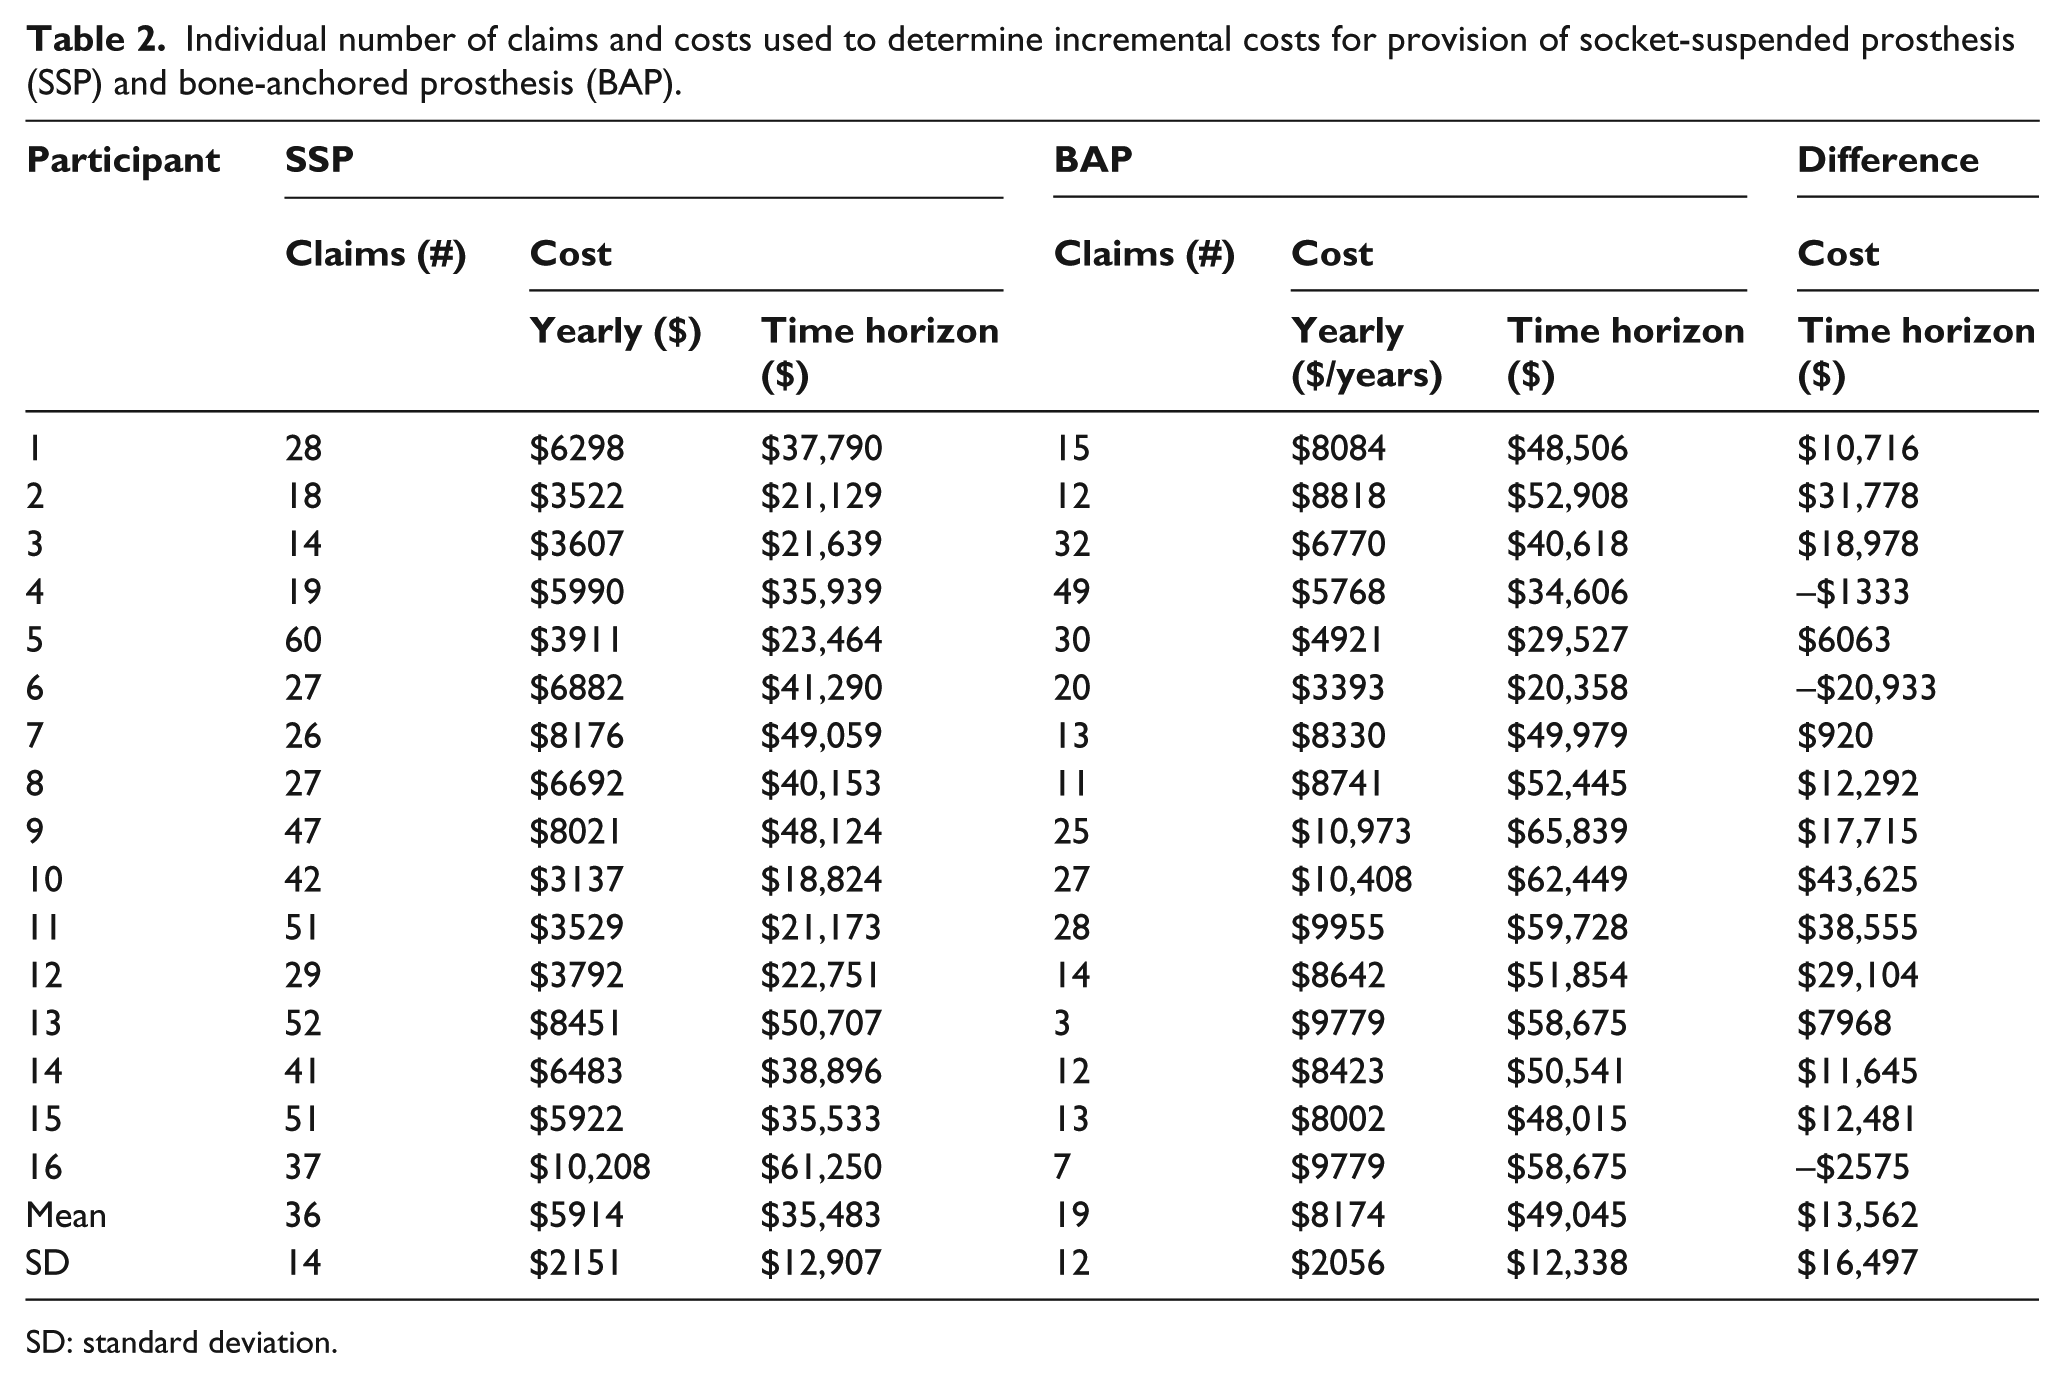
SD: standard deviation.
The individual yearly and overall costs for provision of SSP ranged from $3137 to $10,208 and $18,824 to $61,250 with an overall cost for cohort of $567,723 and CV of 36%, respectively. The individual yearly and overall costs for provision of BAP ranged from $3393 to $10,973 and $20,358 to $65,839 with an overall cost for cohort of $784,722 and CV of 25%, respectively.
Among all confounders, the age of amputation presented the highest correlation coefficient of 0.613 for SSP and 0.278 for BAP.
As detailed in Figure 2, the prediction for provision of SSP ranged from none to 84%, with 100% corresponding to an overall cost of $43,144 for K2 and $51,400 for K3. The prediction for provision of BAP ranged from 13% to 100%, with 100% corresponding to an overall cost of $53,275 for budget option.
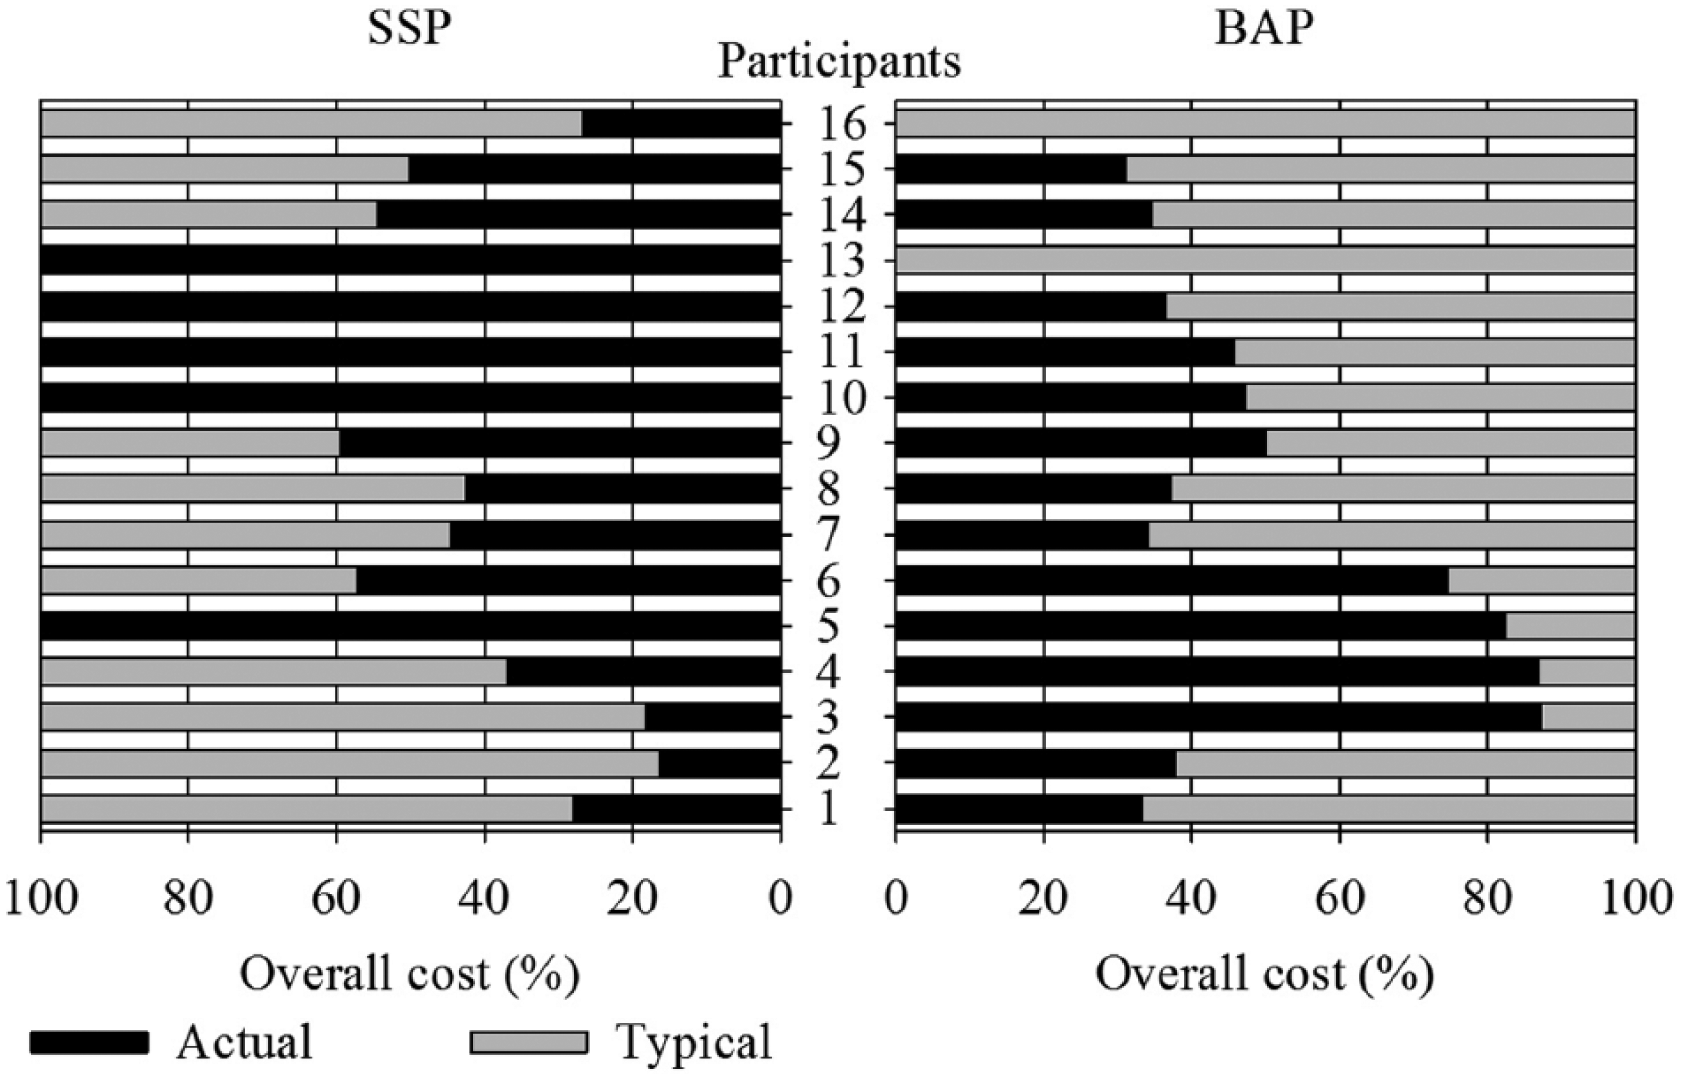
Individual percentage of prediction in total cost involving actual and typical costs when a participant became a QALS consumer less than 6 years before the surgery for provision of socket-suspended prosthesis (SSP) or the surgery occurred less than 6 years before the end of the study for the provision of bone-anchored prosthesis (BAP).
The individual differences of overall costs between SSP and BAP ranged between –$20,933 and $43,625. This difference between full predicted costs was $10,131 for K2 and $1875 for K3. The individual difference of overall cost was more costly for 13 (81%) of the participants with an average of $18,604 ± $13,165 [$920, $43,625] and an average prediction of 47% ± 19% [9%, 73%]. The individual difference of overall cost was cost-effective for three (19%) of the participants with an average of –$10,154 ± $13,459 [–$25,671, –$1635] and an average prediction of 53% ± 29% [34%, 87%].
Incremental utility
The raw SF36 scores and QALY for time horizon extracted from Scenarios 1 and 2 are provided in Table 3. Scenario 1 from Hagberg et al. 12 that reported the lowest and highest QALY for SSP and BAP with positive difference of 0.987 QALY was associated with the ‘best-case’ scenario, respectively. Scenario 2 from Branemark et al. 14 that reported the highest and lowest QALY for SSP and BAP with positive difference of 0.644 QALY was associated with the ‘worst-case’ scenario, respectively. An average 0.815 QALY between both Scenarios 1 and 2 was retained for Scenario 3 corresponding to base-case.
Quality-of-life data (SF36 score) extracted from literature and QALY for time horizon for Scenarios 1 and 2.
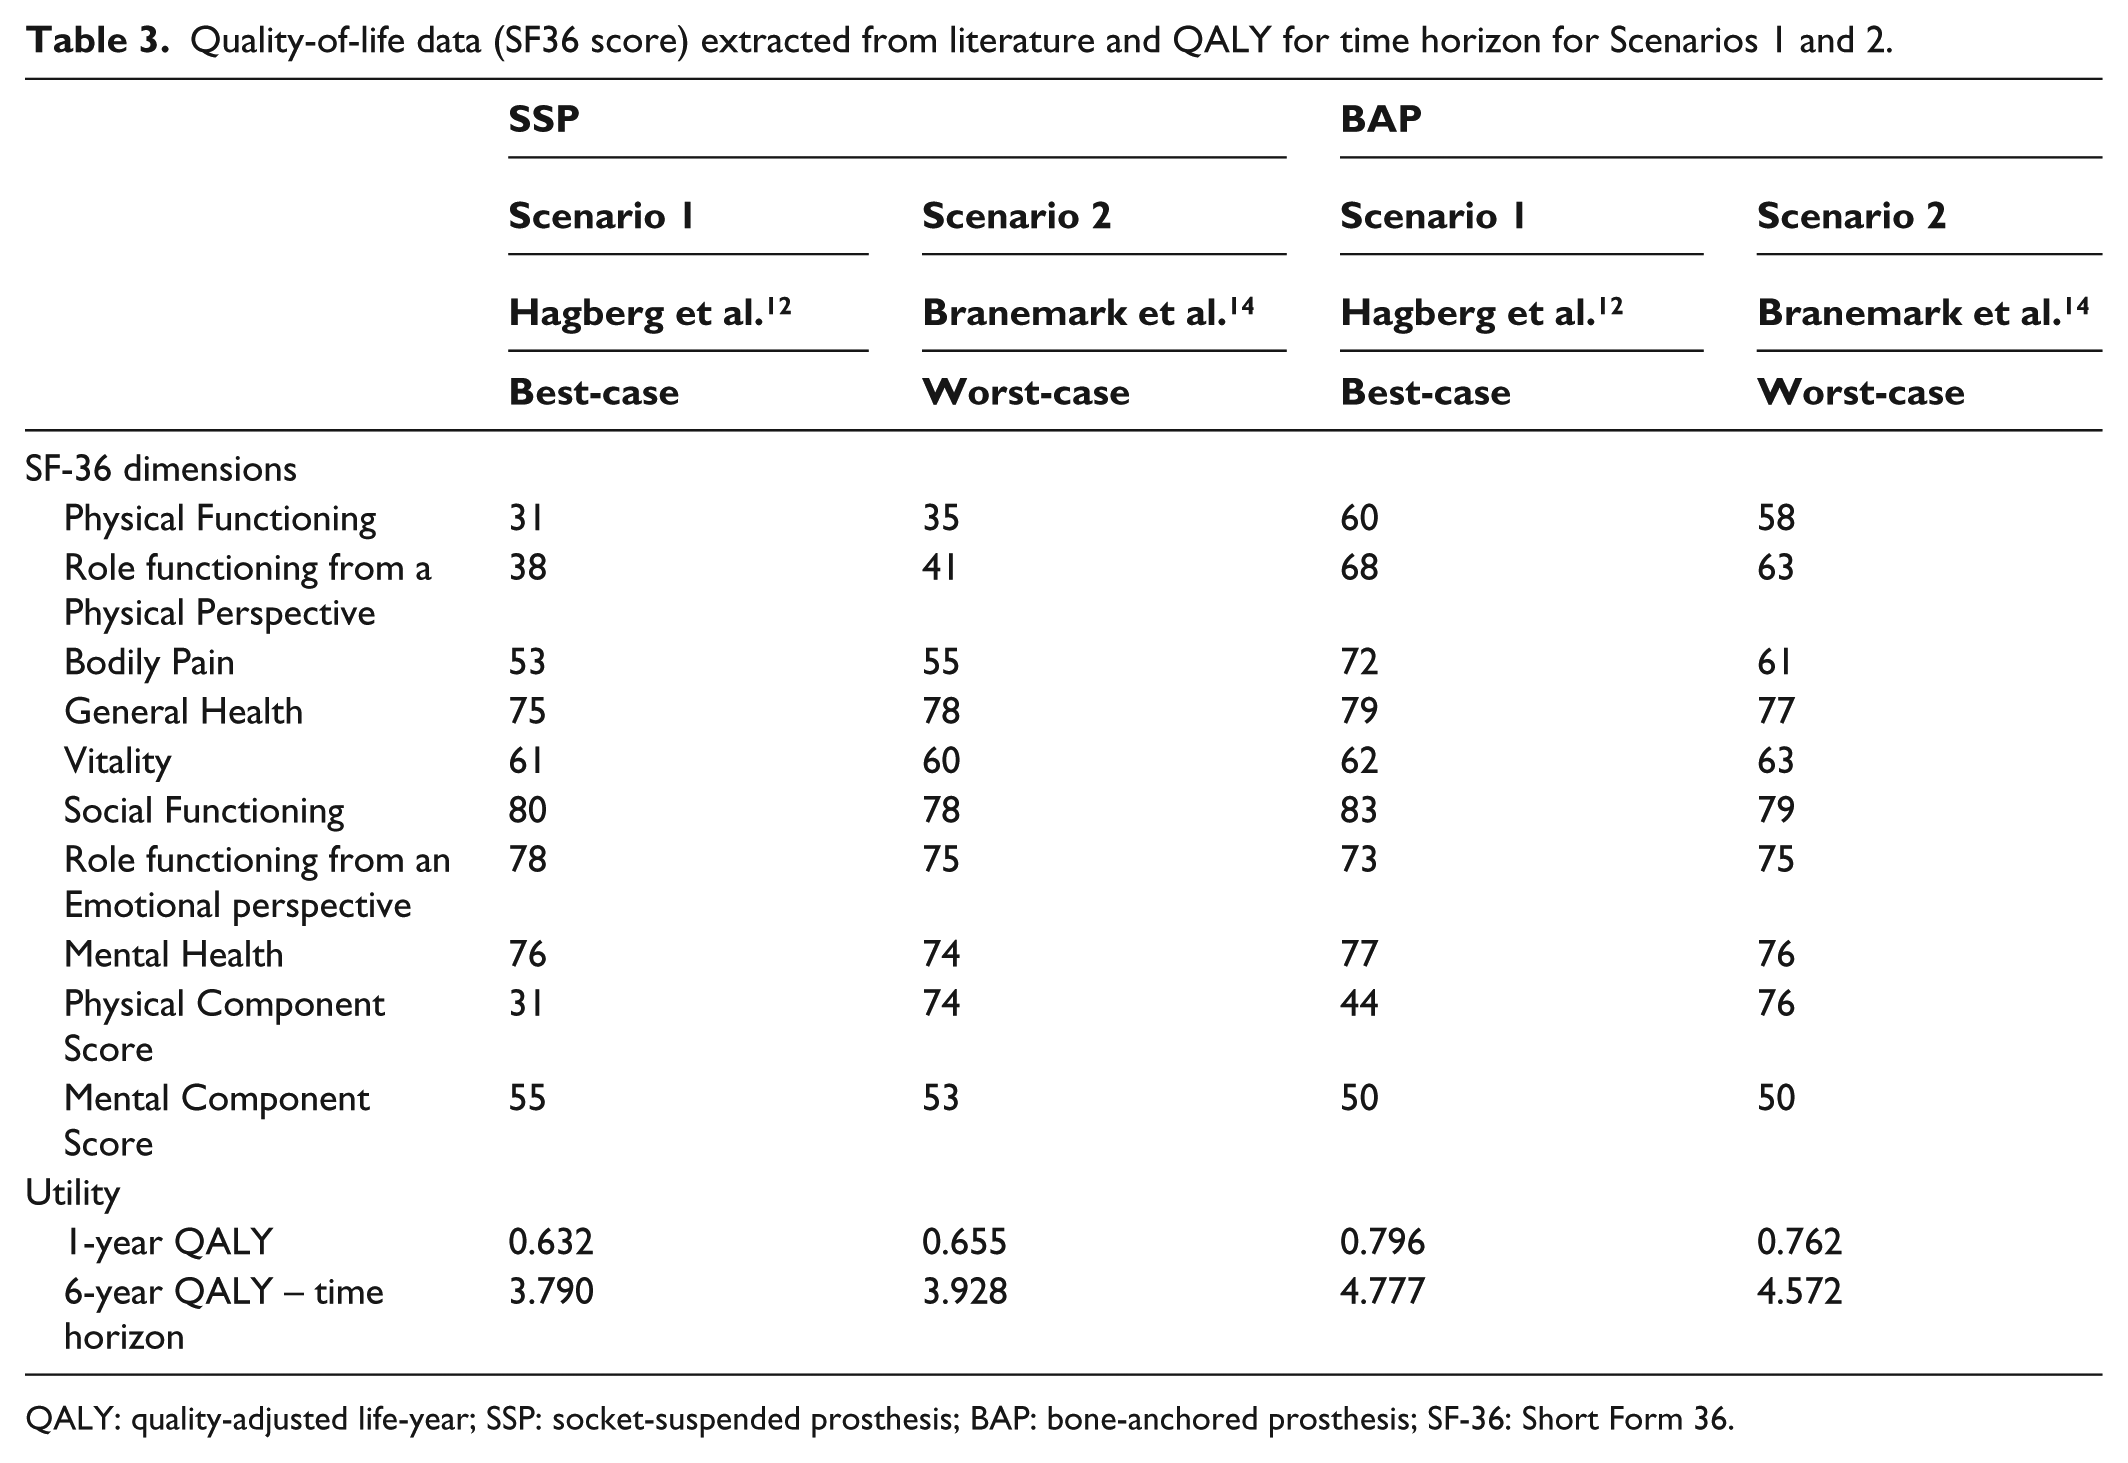
QALY: quality-adjusted life-year; SSP: socket-suspended prosthesis; BAP: bone-anchored prosthesis; SF-36: Short Form 36.
Cost–utility
All cost–utility information is plotted in Figure 3. The mean ICER in the best-case scenario was $13,740 ± $16,714 [–$21,207, $44,197] per QALY. The mean ICER in the worst-case scenario was $21,066 ± $25,625 [–$32,514, $67,762] per QALY. The mean ICER calculated with base-case scenario QALY, retained as indicative ICER was $16,632 ± $20,231 [–$25,671, $53,499] per QALY. The ICERs based on fully predicted costs were $22,313 per QALY for K2 and $12,424 per QALY for K3.
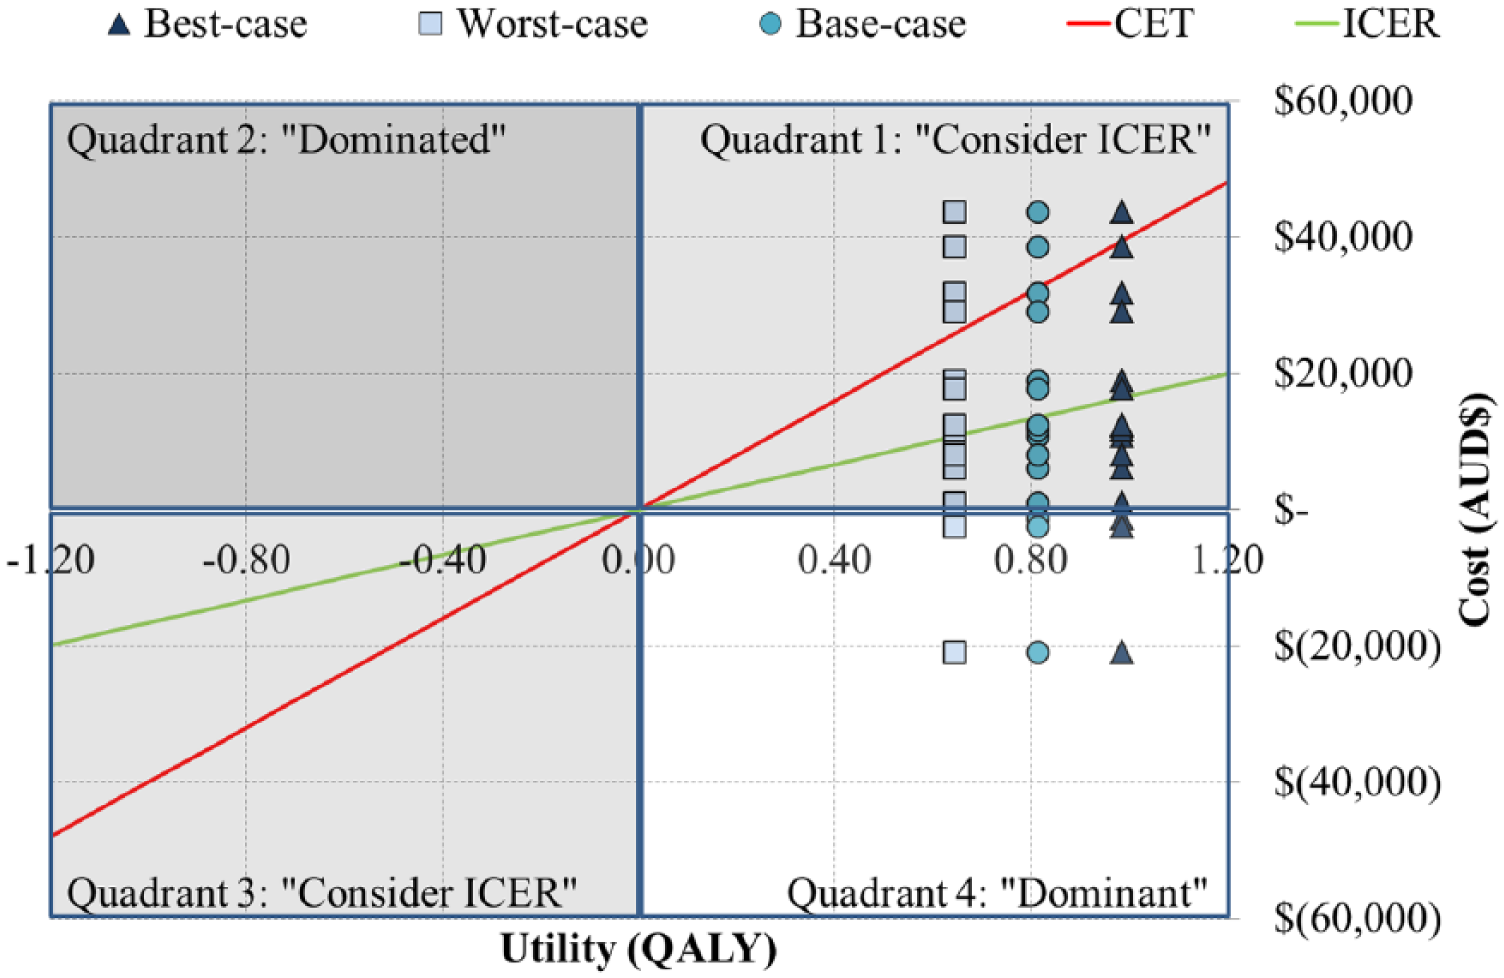
Overview of cost–utility analysis using indicative ICER of $16,632 per QALY and CET of $40,000 per QALY with quadrant for BAP more costly and more effective (1), more costly and less effective (2), less costly and less effective (3), and less costly and more effective (4) than SSP.
The 13 (81%) and 3 (19%) participants presenting a more costly and cost-saving difference generated an average ICER of $22,814 ± $16,145 [$1128, $53,499] per QALY as well as –$10,154 ± $13,459 [–$25,671, –$1635] per QALY, respectively.
The provision of BAP was lower than the CET and considered cost-effective for 14 (88%) participants with an ICER of $11,810 ± $16,445 [–$25,671, $38,971] per QALY.
Discussion
Key results
This study showed that
The total cost for provision of BAP was on average 21% ± 41% more than SSP.
Half of the costs considered were actual costs.
The total costs had overall weak linear relationship with possible confounders.
The QALY increased by 17% ± 5% after fitting with BAP compared to SSP.
An indicative ICER was approximately $17,000 per QALY.
ICER based on full typical costs was between $12,400 and $22,300 per QALY.
ICER calculated ranged between –$25,700 and $53,500 per QALY.
BAP was cost-saving for 19% of the participants.
BAP was cost-effective for 88% of the participants.
Limitations
Some limitations of this study derived from usual intrinsic shortcomings of a long-term cost–utility analysis aggregating multiple international data sources. As detailed in Table 5 in Supplementary material, the main limitations and barriers to generalisation related to small convenient sample size, narrow case-mix, consideration of single reimbursement standards (i.e. QALS), the dual source of funding (i.e. actual and typical costs), extraction of QALY data, inconsistency in time horizon (i.e. 6 years for cost, 2 years for QALY), differences in fixation type (i.e. costs for press-fit fixation, QALY for screw-type implant), discrepancy between perspectives, lack of discount and a series of unfavourably biased (i.e. full yearly allowance of typical costs, CET and no discount).
Interpretations
BAP was more costly and more effective (Quadrant 1) for the vast majority (81%) of the cohort while the remaining portion (3%) was less costly and more effective. However, the disparity in results could only be partially attributed to inter-participant variability in overall cost with a CV that was low and less dispersed for BAP (25%) compared to moderate for SSP (36%). Also, this disparity only poorly linked with cofounders other than potentially the age of amputation. Altogether, appreciating if the dominant dataset is sufficiently strong to represent an actual trend or simply regrouping three outliers is challenging giving the overall cohort size.
Interestingly, the indicative ICER of $16,632 per QALY obtained with base-case scenario was superior to ICER based on full predicted costs by $4208 (25%) per QALY and $14,333 per QALY (86%) for K2 and K3, respectively.
These results compared favourably with international health economic evaluations (e.g. costs, basic and stratified cost–utility analyses) for the provision of microprocessor-controlled knee components to individuals with SSP from other health care perspectives detailed in Table 6 in Supplementary material.
In all cases, BAP can be considered cost-effective for the vast majority (88%) of the cohort for the given CET. BAP appears to be a preferable fitting option at least from a prosthetic care perspective as it increases quality of life of individuals with transfemoral amputation without inducing unbearable additional consumption of resources.
Generalisation
Altogether, the generalisation of the study outcomes must be considered carefully giving the limitation and barriers presented in Table 5 in Supplementary material. The potential for scalability of this cost–utility analysis remains to be confirmed, more particularly its capacity to integrate more complex case mixes (e.g. multi-level limb amputations), the increasing number of treatment options, the disparity on criteria for provision of BAP between jurisdictions as BAP becomes more routinely prescribed.51,52
Future studies
Clearly, there will be a need to further extend this study to accommodate future developments in BAP including, but not limited to, growing number of consumers, broadening of case mix, changes to surgical procedures and constant developments of prosthetic components.51,53,54 Effects of these changes in the economic evaluation of BAP over aids for non-prosthetic user (e.g. crutches, wheelchair) and other fitting options for prosthetic users (e.g. mechanical knee, basic and advanced microprocessor-controlled knees) could be achieved through a range of subsequent studies.
Additional health care system perspective studies could focus on larger cohorts over an extended period of time relying on systematic extraction of all individual costs for intervention (e.g. surgery, rehabilitation), health (e.g. General Practitioners, paramedical staff, specialist consultation, hospital re-admission) and prosthetics (e.g. fixed, on-going) care as well as assessment of utility (e.g. ED-5Q, SF-6D). Such studies should also feature stratified analyses according to functional levels, variations in case-mix, reimbursement standard depending on health care systems as well as stronger sensibility analysis.51,55–57
More comprehensive societal perspective studies could focus not only on intervention, health and prosthetic care costs but also on personal and family cost (e.g. housekeeping assistance, transportation, house adaption) as well as productivity (e.g. return to work, reduction of sick leave). 58
Often neglected but equally valuable, specific patient perspective studies could look at all out-of-pocket costs associated with BAP (e.g. travelling cost overseas, prosthetic components, medication) particularly for those opting for private care who allegedly pay over $100,000 for the treatment.
Conclusion
This first economic evaluation seems to indicate that this new attachment relying on osseointegrated fixation is cost-effective and more likely to lead to adoption as acceptable alternative to conventional intervention at least from a prosthetic care perspective.
This work was an initial effort towards design of evidence-based governmental financial assistance programmes for an equitable provision of BAP. Altogether, the experience reported here is a stepping-stone providing a working approach for development of economic evaluations to stakeholders responsible for policies around care of individuals fitted with BAP worldwide.
Footnotes
Author contribution
All authors contributed equally in the preparation of this manuscript.
Declaration of conflicting interests
The author(s) declared no potential conflicts of interest with respect to the research, authorship and/or publication of this article.
Funding
The author(s) received no financial support for the research, authorship and/or publication of this article.
References
Supplementary Material
Please find the following supplemental material available below.
For Open Access articles published under a Creative Commons License, all supplemental material carries the same license as the article it is associated with.
For non-Open Access articles published, all supplemental material carries a non-exclusive license, and permission requests for re-use of supplemental material or any part of supplemental material shall be sent directly to the copyright owner as specified in the copyright notice associated with the article.