
Abstract
Background:
While Amputee Mobility Predictor scores differ between Medicare Functional Classification Levels (K-level), this does not demonstrate that the Amputee Mobility Predictor can accurately predict K-level.
Objectives:
To determine how accurately K-level could be predicted using the Amputee Mobility Predictor in combination with patient characteristics for persons with transtibial and transfemoral amputation.
Study design:
Prediction.
Method:
A cumulative odds ordinal logistic regression was built to determine the effect that the Amputee Mobility Predictor, in combination with patient characteristics, had on the odds of being assigned to a particular K-level in 198 people with transtibial or transfemoral amputation.
Results:
For people assigned to the K2 or K3 level by their clinician, the Amputee Mobility Predictor predicted the clinician-assigned K-level more than 80% of the time. For people assigned to the K1 or K4 level by their clinician, the prediction of clinician-assigned K-level was less accurate. The odds of being in a higher K-level improved with younger age and transfemoral amputation.
Conclusion:
Ordinal logistic regression can be used to predict the odds of being assigned to a particular K-level using the Amputee Mobility Predictor and patient characteristics. This pilot study highlighted critical method design issues, such as potential predictor variables and sample size requirements for future prospective research.
Clinical relevance
This pilot study demonstrated that the odds of being assigned a particular K-level could be predicted using the Amputee Mobility Predictor score and patient characteristics. While the model seemed sufficiently accurate to predict clinician assignment to the K2 or K3 level, further work is needed in larger and more representative samples, particularly for people with low (K1) and high (K4) levels of mobility, to be confident in the model’s predictive value prior to use in clinical practice.
Background
The Medicare Functional Classification Level (MFCL) was adopted in 1995 by the US Centers for Medicare and Medicaid Services for classifying functional mobility and rehabilitation potential of individuals with lower limb loss.1,2 The MFCL consists of five ordered categories or ‘K-levels’ that define increasing functional mobility and aid selection of prosthetic component types for third-party reimbursement based on medical necessity (Appendix 1). Consequently, within the US system, the type of prosthesis a patient receives largely depends on the K-level assigned.3,4
Strictly speaking, K-levels are assigned based on descriptions that characterize the ability to transfer, ambulate on level surfaces or with variable cadence and traverse low-level environmental barriers, as well as therapeutic, vocational or recreational demands. However, the supporting Local Coverage Determination: Lower Limb Prostheses (L33787) policy 5 states that prosthetists and physicians should also consider factors such as motivation to ambulate, past history (including prior prosthesis use), comorbidities and residual limb status. Additional objective factors may also influence the assigned K-level such as age, cause and level of amputation.1,4
Given the subjectivity of categorizing functional mobility into a discrete K-level, the Amputee Mobility Predictor (AMP) was developed to assist in assigning a K-level for prosthetic prescription of Medicare-eligible patients. 1 Given this purpose, the authors’ assume that the AMP can discriminate between K-levels. 1
Using Known Groups Analysis, significant differences in mean AMP scores were observed between K-levels leading the authors to imply that the AMP is valid to discriminate between K-levels. 1 However, this analysis does not demonstrate that the AMP can accurately predict K-level, nor does it produce discrete cut-scores that distinguish between K-levels.6,7 Given the variability of AMP scores across K-levels, 1 an individual’s AMP score would allow for categorization into more than one K-level. As such, we hypothesize that the AMP is unlikely to accurately categorize people into mutually exclusive K-levels.
Given this concern, and how influential the AMP has become in categorizing mobility and informing prosthetic prescription and funding, there is a need to demonstrate how accurately the AMP can predict K-level using more appropriate inferential analysis techniques. Given that K-level is measured on an ordinal scale, the predictive value of the AMP should be assessed using ordinal logistic regression. 8
A prudent approach would be to conduct a pilot study to demonstrate feasibility of ordinal logistic regression, test independent variables to determine their usefulness as predictors, highlight important method design issues (e.g. which independent variables are the best predictors) and sample size requirements to inform a definitive study. Accordingly, we conducted a pilot study which sought to determine how accurately the clinician-assigned K-level could be predicted using the AMP score in people with unilateral transtibial amputation (TTA) and transfemoral amputation (TFA). Focusing the study on the most common amputation levels seen in clinical practice was necessary, given the small number of people with other levels of amputations and the high number of cases needed to do this type of regression modelling for any level of amputation. Given our hypothesis that the AMP would be a poor predictor of K-level, we also sought to determine whether the accuracy of the prediction would be improved by inclusion of commonly recorded objective patient characteristics that may influence mobility 9 (i.e. age, body mass index (BMI), level and cause of amputation).
Methods
Ethical approval was granted by the Northwestern University Institutional Review Board (STU-00201420).
Data source
Data were obtained from a private prosthetics and orthotics company that included 10 outpatient clinics covering four different US states (Ability Prosthetics and Orthotics, Inc.). These clinics service a racially and socioeconomically diverse population with varied insurance coverage and were staffed by 16 American Board for Certification (ABC) credentialed prosthetists with between 1 and 12 years of experience.
Outcomes included in this investigation were measured by the treating prosthetists as a routine part of their practice and recorded in an Electronic Medical Record (OPIE Software, Gainesville, Florida) for each patient. The Amputee Mobility Predictor (AMPPRO or AMPnoPRO) was administered by the treating prosthetist in accordance with the instrument’s instructions. 1 The K-level was also assigned by the treating prosthetist based on clinical assessment and patient self-report against the published guidelines. 5
All prosthetists were trained to use the outcome measures reported in this investigation as part of their employment including small group and one-on-one training, reading of peer-reviewed journal articles and taking an online continuing education course. 10 Routine reviews of the outcomes data recorded in the Electronic Medical Record were periodically undertaken to evaluate compliance and data quality at the clinics.
Convenience sampling was used whereby all Electronic Medical Records were queried at the end of July 2015 to identify all people with lower limb loss who were treated since the 1 March 2013. The start date reflected when the clinics started implementing outcome measures and documenting information in a way that would allow retrospective interrogation. Data were exported to Excel (Microsoft, Redmond, Washington) including patient identification number, date of assessment, K-level, AMPPRO or AMPnoPRO score, level and cause of amputation, age, stature and body mass.
Individual cases were subsequently excluded if the requisite data were incomplete, people had bilateral amputation (given that the AMP, in the form used, was not recommended for people with bilateral limb loss) or amputation other than TTA or TFA.
Data reduction
Data were screened prior to analysis to eliminate multiple patient entries using the most recent record and to reconcile errors (e.g. AMP scores outside the scale of the instrument) and inconsistencies (e.g. records variously included acronyms for TTA and below-knee amputation).
Following data screening, the AMPPRO and AMPnoPRO scores were merged given that both measure the same construct and share the same psychometric properties. 1 To ensure the efficacy of this approach, separate ordinal logistic regression models were built to determine whether the AMPPRO and AMPnoPRO explained similar proportions of the variance in K-level, the data shared the same distribution, and the 95% confidence interval (CI) of the regression coefficients overlapped (AMPPRO: β = 0.34, 95% CI = 0.25–0.43; AMPnoPRO: β = 0.301, 95% CI = 0.18–0.43). Covariance of the parameter estimates shows similar thresholds for the K-level logit by AMPPRO (K1 = 0.043, K2 = 0.078, K3 = 0.091) and AMPnoPRO (K1 = 0.045, K2 = 0.106, K3 = 0.138).
Cause of amputation was dichotomized as either dysvascular (i.e. diabetes, peripheral vascular disease) or non-dysvascular (i.e. trauma, tumour, congenital limb deficiency) given that cause of amputation was not recorded in a standardized way (e.g. trauma or motor vehicle accident) and the small number of cases where amputation was due to conditions other than diabetes or peripheral vascular disease.
Inferential analysis
A cumulative odds ordinal logistic regression model with proportional odds was built to determine the effect that the AMP, and the AMP in combination with other independent variables (i.e. age, BMI, level and cause of amputation), had on the odds of being assigned a particular K-level. The AMP was entered into the model as a continuous variable given the simplicity of interpreting the odds ratio (OR). While we acknowledge that the AMP is measured on an ordinal scale, the presentation of OR for each AMP score relative to a reference category would be difficult to interpret. We argue that the AMP may be treated as a continuous variable given the large number of ordered categories and the linear nature of the AMP scores. 11 Preliminary analyses were conducted to establish validity of the model 12 (Appendix 2). To assess how well the model fit the observed data, the goodness-of-fit test was evaluated using the Hosmer–Lemeshow test and the likelihood-ratio test. The OR and 95% CI were reported alongside the Wald Chi-square statistic. A classification table was used to report the clinician-assigned and predicted K-level. The inferential analysis was undertaken with SPSS software (v22, IBM Corporation, Armonk, New York). Data analysis was conducted in accordance with the techniques described by Lund and Lund, 12 with the exception of goodness-of-fit which were conducted using the Hosmer–Lemeshow test. 13
Results
Of the 239 unique records, 198 were suitable for inclusion. Characteristics of the sample have been stratified by K-level and indicate that higher K-levels included a larger proportion of younger people with TFA due to non-dysvascular causes (Table 1).
Subject characteristics by clinician-assigned K-level.
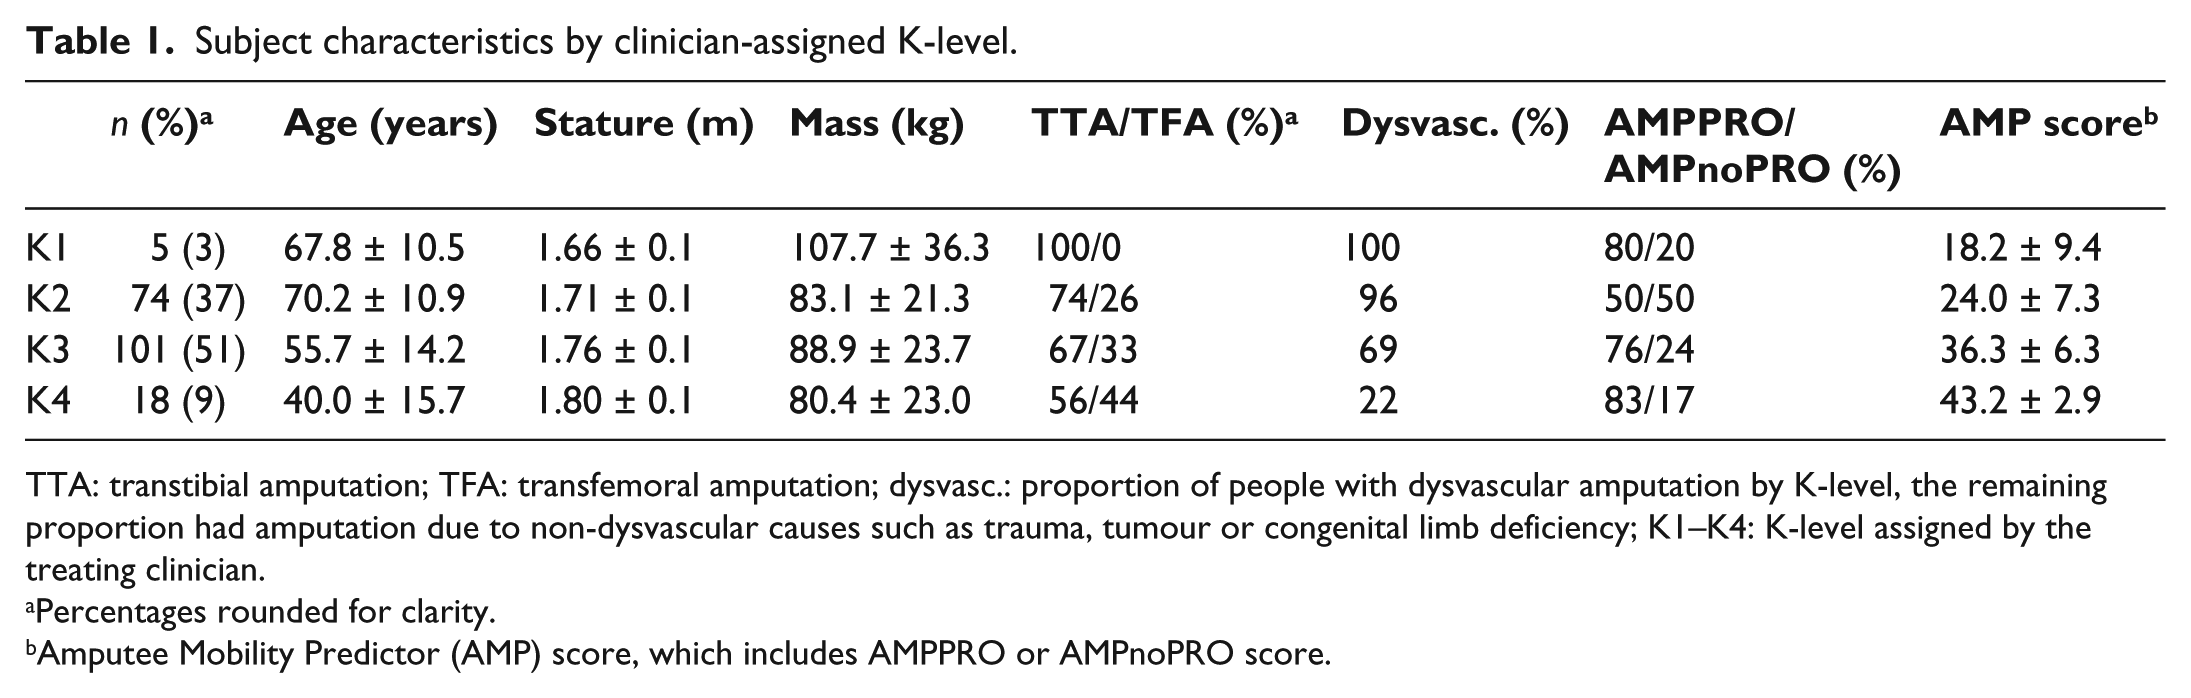
TTA: transtibial amputation; TFA: transfemoral amputation; dysvasc.: proportion of people with dysvascular amputation by K-level, the remaining proportion had amputation due to non-dysvascular causes such as trauma, tumour or congenital limb deficiency; K1–K4: K-level assigned by the treating clinician.
Percentages rounded for clarity.
Amputee Mobility Predictor (AMP) score, which includes AMPPRO or AMPnoPRO score.
As a first step, the AMP score was the only independent variable included in the model. This model significantly predicted K-level over and above the intercept-only model, χ2(1) = 148.698, p < 0.001. The AMP had a statistically significant influence on K-level, Wald χ2(1) = 78.658, p < 0.001; each one point increase in the AMP was associated with an increase in the odds of being in a higher K-level (OR = 1.296; 95% CI = 1.224–1.373).
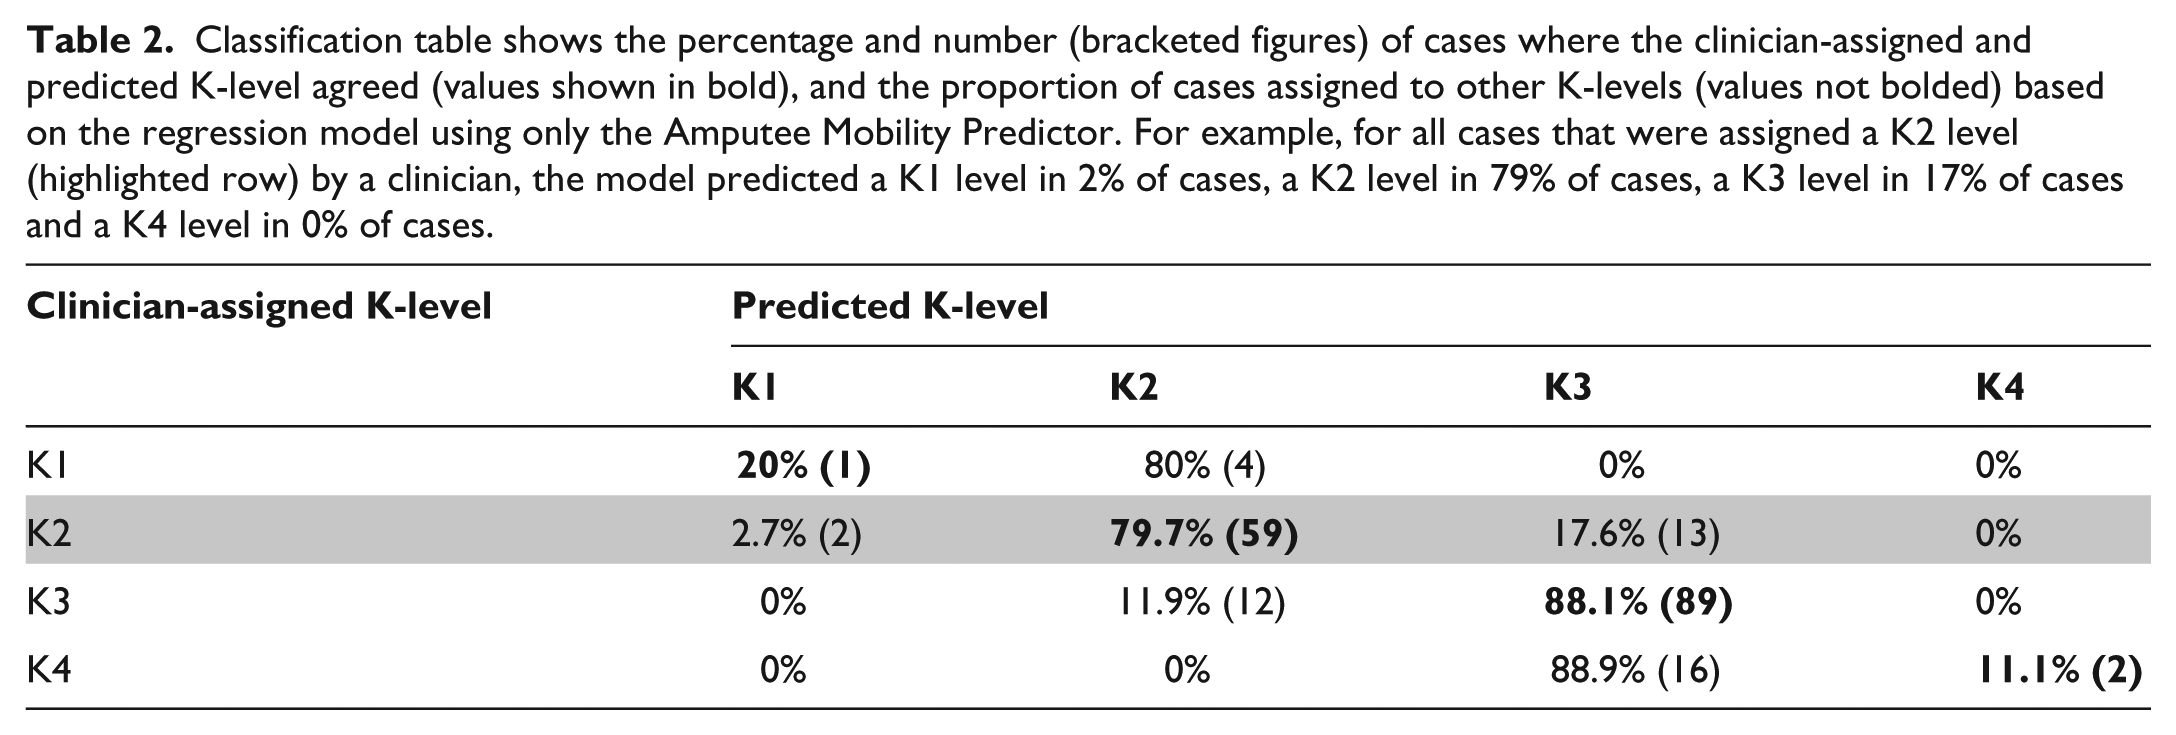
In a large proportion of cases, the predicted and clinician-assigned K-levels agreed (Table 2). By way of example, consider subjects assigned to the K2 level by their clinician (highlighted row, Table 2). In 79.7% of cases, the predicted and clinician-assigned K-level agreed (Table 2). In 17.6% of cases, the regression model predicted a higher K-level than that assigned by the clinician, and in a small proportion of cases (2.7%), a lower K-level was predicted (Table 2). For subjects assigned to K1 or K4 by their clinician, the predicted K-levels agreed less than 20% of the time (Table 2).
Classification table shows the percentage and number (bracketed figures) of cases where the clinician-assigned and predicted K-level agreed (values shown in bold), and the proportion of cases assigned to other K-levels (values not bolded) based on the regression model using only the Amputee Mobility Predictor. For example, for all cases that were assigned a K2 level (highlighted row) by a clinician, the model predicted a K1 level in 2% of cases, a K2 level in 79% of cases, a K3 level in 17% of cases and a K4 level in 0% of cases.
As a second step, the other independent variables were included in the model along with AMP score. This model significantly predicted K-level over and above the intercept-only model, χ2(5) = 180.903, p < 0.001. Higher K-levels were associated with increased AMP scores, younger age and TFA (Table 3). Cause of amputation and BMI did not have a significant influence on K-level (Table 3).
Parameter estimates for cumulative ordinal logistic regression to predict K-level.
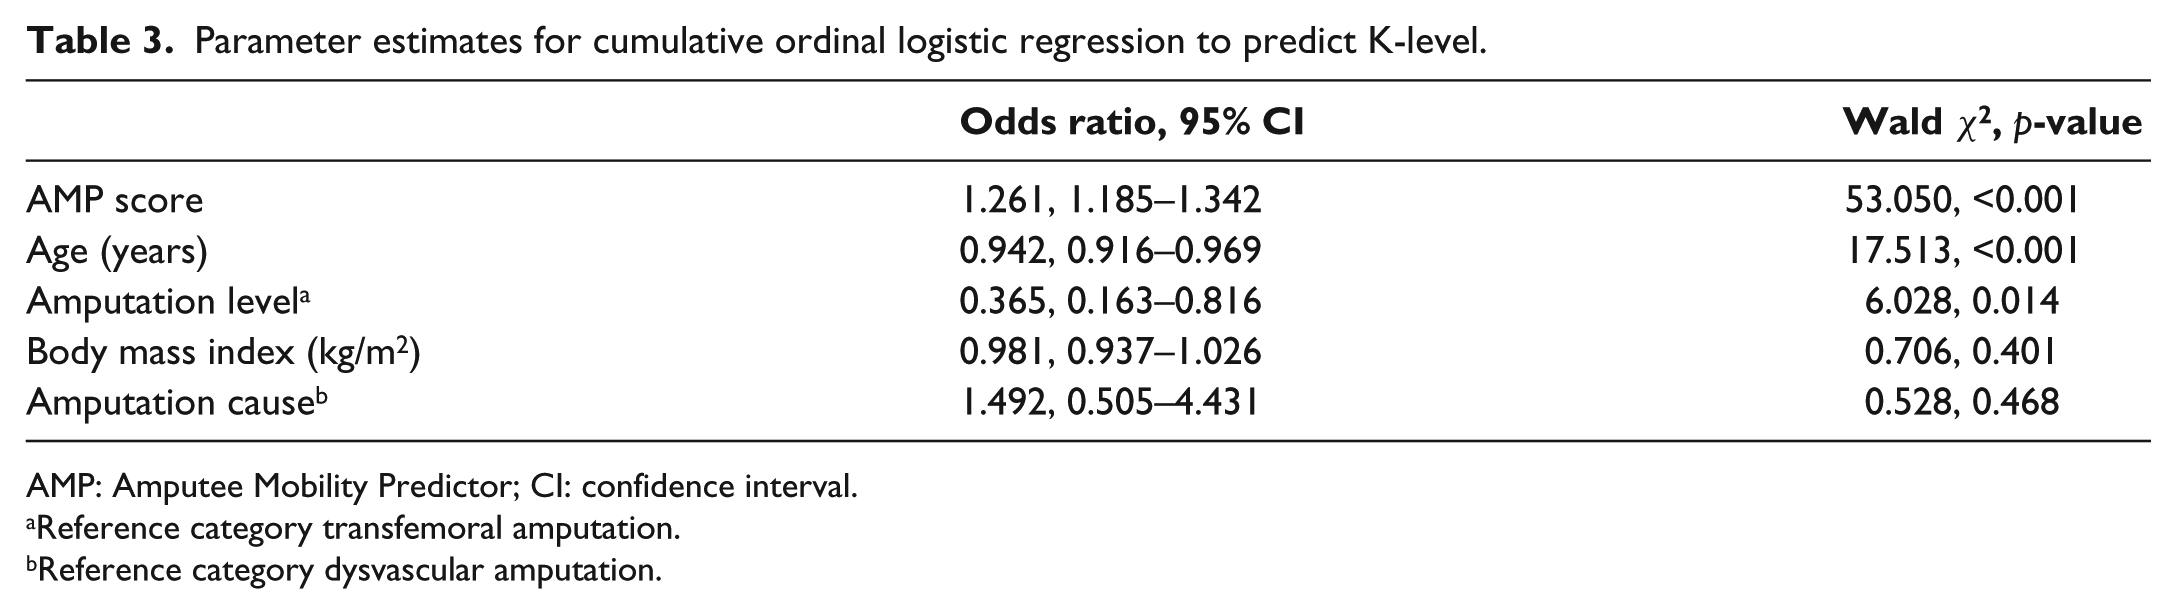
AMP: Amputee Mobility Predictor; CI: confidence interval.
Reference category transfemoral amputation.
Reference category dysvascular amputation.
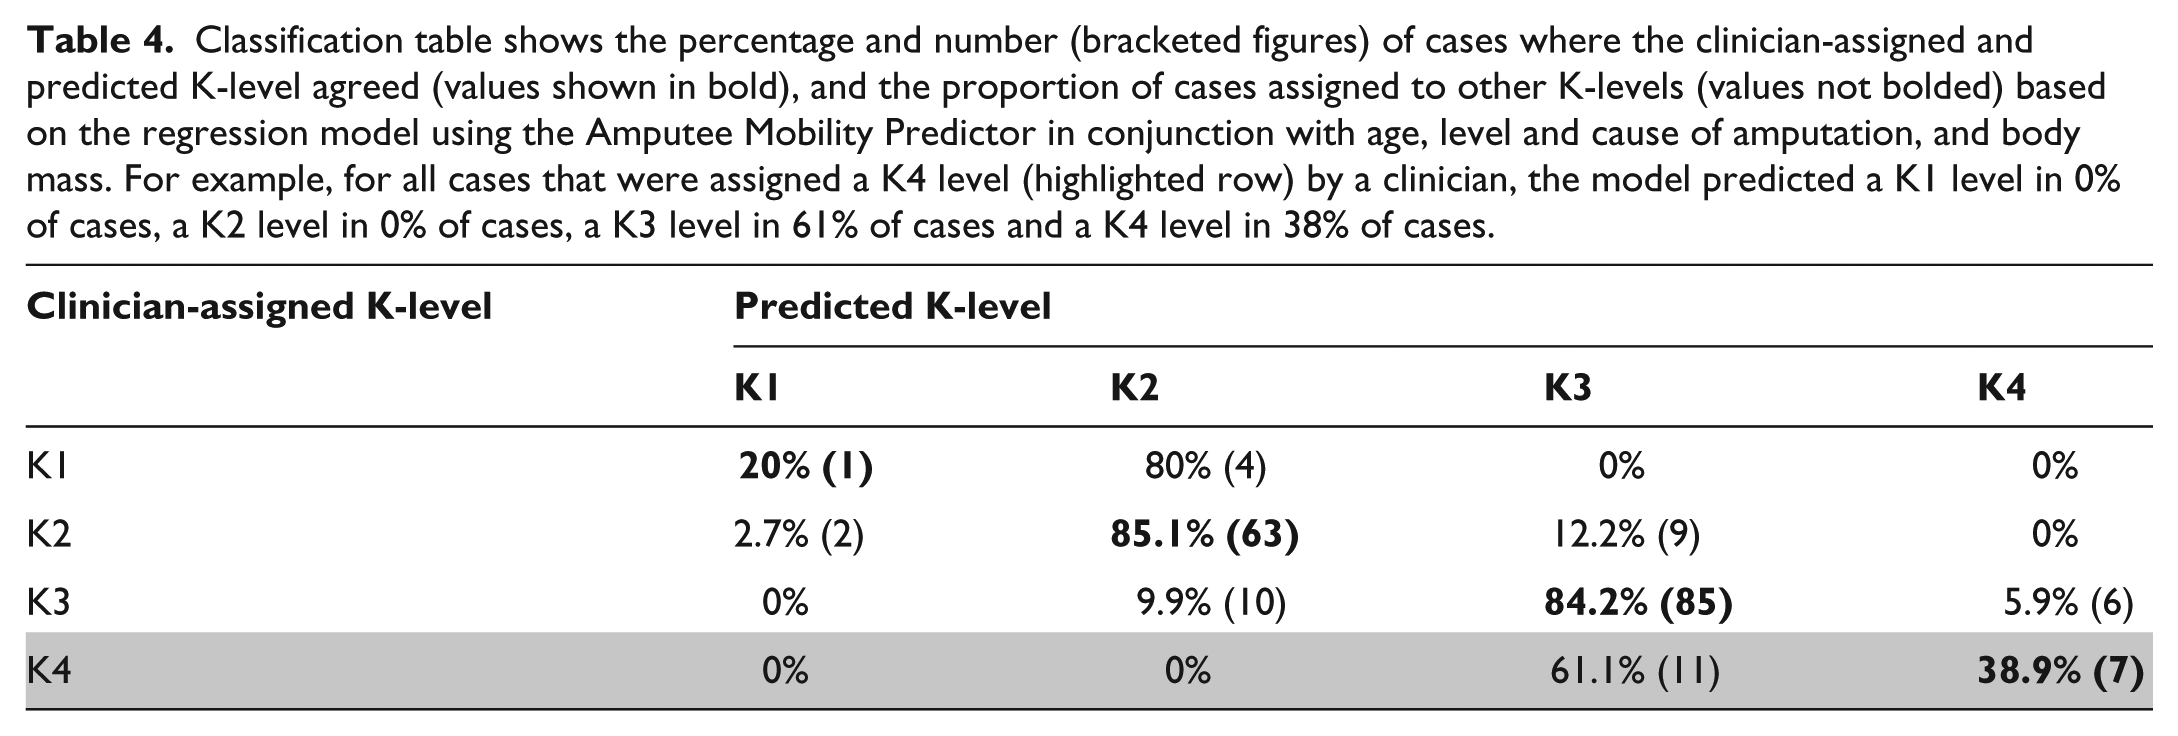
Inclusion of the additional independent variables into the regression model did not alter the proportion of cases where the predicted and clinician-assigned K-levels agreed, except for people assigned to the K4 level by their clinician (highlighted row, Table 4). For these people, the additional independent variables improved the proportion of cases where the predicted and clinician-assigned K-level agreed (39%) compared to using the AMP alone (11%).
Classification table shows the percentage and number (bracketed figures) of cases where the clinician-assigned and predicted K-level agreed (values shown in bold), and the proportion of cases assigned to other K-levels (values not bolded) based on the regression model using the Amputee Mobility Predictor in conjunction with age, level and cause of amputation, and body mass. For example, for all cases that were assigned a K4 level (highlighted row) by a clinician, the model predicted a K1 level in 0% of cases, a K2 level in 0% of cases, a K3 level in 61% of cases and a K4 level in 38% of cases.
Discussion
The aim of this pilot study was to determine how accurately the AMP could predict clinician-assigned K-level and whether including patient demographics improved the accuracy of the prediction.
What does the model explain about the AMP’s predictive value?
The AMP was able to predict the clinician-assigned K-level a large proportion of the time for those at the K2 or K3 level, but less so for people at other K-levels. For people at the K1 and K4 levels, it is difficult to vest confidence in these results given that the sample included few people and lacked representativeness that enables generalizability (e.g. no people with TFA at the K1 level).
Did including other independent variables into the model improve accuracy of the prediction?
The additional independent variables used in combination with the AMP improved agreement between the predicted and clinician-assigned K-level for those assigned to the K4 level by their clinician, suggesting that factors such as age and amputation level may influence the clinician-assigned K-level for this subset of the population. 4
While the influence of age and AMP score was as expected (i.e. larger AMP scores and younger age were associated with a significant increase in the odds of being assigned a higher K-level), this was not true for level and cause of amputation. The effect of amputation level may have been biased given that as K-level increased, so too did the proportion of people with TFA; the proportion of people with TFA assigned to the K4 level by their clinician was disproportionately large compared to the entire sample, and there were no people with TFA at the K1 level. An alternative interpretation is that those people with TFA who are successful prosthesis users have better mobility as reflected by the distribution by K-level. While the OR indicated that people with non-dysvascular amputation were 49% more likely to be in a higher K-level than those with dysvascular amputation, the effect was highly variable and therefore, not significant.
Are there other factors that might influence accuracy of the prediction?
Other factors could improve the accuracy of the prediction if they explained part of the variance in K-level not already captured by the AMP score. For example, the accuracy of the prediction may be enhanced for people at the K4 level by quantifying their ability to participate in activities associated with high impact (e.g. T-test or Illinois Agility Test), 14 given this is a key distinction between the K3 and K4 levels and not well measured using the AMP. Previous literature 1 suggests use of alternative predictors such as time since amputation, 6-minute walk test or Amputee Activity Scale; however, correlation approaches do not control for the shared variance between these measures and the AMP and as such, their utility may be overestimated.
How could such a regression model be used in clinical practice to objectively determine K-level?
Using the dataset and model described in this article, we illustrate how the model could be used to predict the chance an individual patient has of being assigned to each K-level. In this illustration, the following patient data would be entered into the regression model: 52-year-old man with a dysvascular TFA, BMI of 31.6 kg/m2 and an AMPPRO score of 38 points. Based on these input data, the regression model would estimate the following chance of being assigned to each K-level as K1 (0%), K2 (2%), K3 (86%) or K4 (11%). While we could be confident in the K3 assignment in this case, we may be less certain in other cases where the chance of being assigned to each K-level is less clear cut.
This example highlights that all predictions come with a degree of uncertainty. Given the ordinal scale of the K-level, the uncertainty is expressed as the percentage chance of being assigned to different K-levels. Unfortunately, discrete cut-scores and estimated K-levels have become synonymous with the way the AMP is interpreted in clinical practice and used to assign K-level,6,7,15 but are inappropriate to inform K-level assignment. To our knowledge, these cut-scores and estimated K-levels have no evidentiary basis, are inconsistent with the ordinal scale of the K-level, and mask the true uncertainty that comes with K-level prediction.
As used in this investigation, ordinal regression models are an appropriate means to predict K-level and, notwithstanding the limitation of this study, illustrate how a model could be used to objectively assign K-level. Given that the predicted and clinician-assigned K-level agreed a high proportion of the time for people assigned as K2 or K3 level, the need for such a model may seem unnecessary. However, given that decisions on prosthesis component type hinge on K-level assignment, the objectivity should be important to both clinicians and third-party payors. A more refined model may be of value to third-party payors or clinicians seeking to evidence their K-level assignment, for example, when the clinician-assigned K-level does not match the prediction, or there is a high level of uncertainty with the prediction, additional means of assessing and documenting mobility potential could be used to support the clinician-assigned K-level.
Limitations and further research
The determination of K-level is inherently subjective and an artefact of the classification system. While there is no gold standard upon which to base the prediction, research involving sufficiently large and representative samples should engender confidence in our ability to predict the clinician-assigned K-level using objective and reliable input measures such as the AMP score, age, sex and cause of amputation. In this way, consistency and equity may be brought to bear on K-level assignment.
Future research could build separate models to determine whether the AMPPRO or AMPnoPRO provide similarly accurate predictions of K-level and thereby extend this work. Using this approach, much larger samples would be required to meet the minimum cell counts required for ordinal logistic regression. We also included two cases where participants were between 15 and 18 years, given that there was no reason to believe their mobility would be markedly different from the young adults included in the sample.
While the dataset may be typical of one large, multi-site practice, the sample may be atypical of other facilities and settings, particularly outside the United States. Care should be taken generalizing these results, given there are few participants at the K1 and K4 levels, as well as a disproportionate number with TFA at the K4 level and none at the K1 level. Future investigators will need to recruit sufficiently large and representative samples for each K-level, perhaps using stratified random sampling.
Using data from this study, we estimated that a sample size of 300 would be needed to achieve 80% power. The Monte Carlo approach was used to generate separate power curves based on the significant and non-significant predictors of our pilot study. The estimated sample size was considered a compromise between both curves, acknowledging that independent variables that have a demonstrable effect on mobility (i.e. AMP score, age and level of amputation) should be included but not factors that clearly have no effect (e.g. BMI).
In this retrospective dataset, the same clinician assigned both the K-level and AMP score. While this may reflect typical clinical practice, it may increase the association between the dependent and independent variables. In a prospective study, the K-level should be assigned by a different clinician to the one that administers the AMP or the K-level assigned prior to scoring the AMP.
While use of a retrospective dataset made the project feasible, there were limitations associated with the way data were recorded. Causes of amputation were recorded imprecisely using varied terminologies, which limited our ability to determine how peripheral vascular disease, as separate from diabetes, influenced the K-level prediction. It is likely that measures of body mass varied depending on whether this was recorded with or without the prosthesis. Additionally, a number of cases with incomplete data were excluded and this may have biased the sample given that incomplete data may be more common for patients with poor mobility. Unfortunately, our ability to make this determination was limited given that basic demographic data were also often not reported for the cases that were excluded.
Conclusion
This pilot study assessed how accurately the AMP could predict K-level. For people with unilateral TTA and TFA at the K2 or K3 level, results suggest that the AMP predicted the clinician-assigned K-level in more than 80% of cases. We cannot be certain about the predictive value of the AMP for people considered to be K1 or K4, given concerns with the representativeness of these subgroups. For people assigned to the K4 level, the accuracy of the prediction may be improved when the AMP is used with other variables, such as age and amputation level, or other outcome measures that capture the ability to participate in high-impact activities. Further research using larger samples that better represent subsets of the amputee population (i.e. K1 and K4) is needed to be confident that the clinician-assigned K-level can be accurately predicted using the AMP and other demographic data, as well as understand the true effect of amputation level and cause. This pilot study provides data that can inform the design and sample size requirements of prospective research.
Footnotes
Author contribution
All authors contributed equally in the preparation of this manuscript.
Declaration of conflicting interests
The author(s) declared no potential conflicts of interest with respect to the research, authorship and/or publication of this article.
Funding
The author(s) received no financial support for the research, authorship and/or publication of this article.
References
Supplementary Material
Please find the following supplemental material available below.
For Open Access articles published under a Creative Commons License, all supplemental material carries the same license as the article it is associated with.
For non-Open Access articles published, all supplemental material carries a non-exclusive license, and permission requests for re-use of supplemental material or any part of supplemental material shall be sent directly to the copyright owner as specified in the copyright notice associated with the article.