
Abstract
Background:
Although anthropometric factors could influence sprint performance in able-bodied sprinters, little is known about the relationships between these anthropometric factors and sprint performance in amputee sprinters.
Objectives:
To investigate the relationships between body height and spatiotemporal parameters of 100-m sprints in unilateral transtibial amputee and able-bodied sprinters.
Study design:
This is a cross-sectional study.
Methods:
We analyzed elite-level 100-m races of 14 male unilateral transtibial amputee sprinters and 22 male able-bodied sprinters from publicly available Internet broadcasts. For each sprinter’s run, the mean step length and frequency were determined using the number of steps in conjunction with the official race time. Furthermore, body height data for sprinters in both groups were obtained from publicly available resources.
Results:
Linear relationships were found between body height and mean step length and frequency in able-bodied sprinters, respectively. However, there were no significant relationships between body height and spatiotemporal parameters in transtibial amputee sprinters.
Conclusion:
The results of this study suggest that the relationship between body height and spatiotemporal parameters during a 100-m sprint is not the same between unilateral transtibial amputees and able-bodied sprinters.
Clinical relevance
Understanding of the relationship between body height and spatiotemporal parameters during a 100-m sprint would provide important information that could be utilized for evaluating prosthetic sprint performance and coaching.
Background
Technical developments in carbon-fiber, running-specific prostheses (RSPs) have allowed amputee sprinters to compete at levels never achieved before.1,2 Theoretically, average forward velocity in a 100-m sprint is the product of mean step frequency (Fstep) and mean step length (Lstep). Accordingly, an increase in one factor will result in an improvement in sprint velocity, as long as the other factor does not undergo a proportionately similar or larger decrease.
Spatiotemporal parameters are influenced by anthropometric factors in able-bodied sprinters (ABSs).3–6 For example, O’Connor et al. 3 suggested that shorter legs would increase Fstep because shorter legs will generally have a lower moment of inertia and hence require less energy to accelerate. 4 However, the taller the athletes, the longer the Lstep.5,6 Furthermore, several studies suggested that there is no single optimal height for sprinters, but instead, there is an optimal range that differs for males and females.7,8 Although these studies are useful to further understand factors affecting sprint performance in ABSs, the same mechanisms might not be true for transtibial amputees (TTAs). Understanding of the relationship between body height and spatiotemporal parameters during a 100-m sprint would provide important information that could be utilized for evaluating prosthetic sprint performance and creating coaching models.
Past findings indicate that TTAs using RSPs have different spatiotemporal parameters compared with ABSs in 100-m sprint.9–11 Furthermore, contrary to bilateral TTAs, there is no systematic regulation for unilateral TTAs about maximal allowable standing height (International Paralympic Committee Athletics Rules and Regulations 2014–2015). 12 Furthermore, it has been shown that RSPs were characterized as having lower mass and smaller moments of inertia than intact human shank–foot segments.13,14 In addition, RSPs are generally prescribed to be 2–5 cm taller than the contralateral limb. Indeed, Grabowski et al. 15 measured the affected leg lengths from six TTAs and found that their affected leg lengths were 2–8 cm longer than their unaffected leg lengths (Table 1 in their study). Therefore, the aim of this study was to test the hypothesis that the relationship between body height and spatiotemporal parameters during a 100-m sprint is not the same between TTAs and ABSs.
Summary of the competitions analyzed.
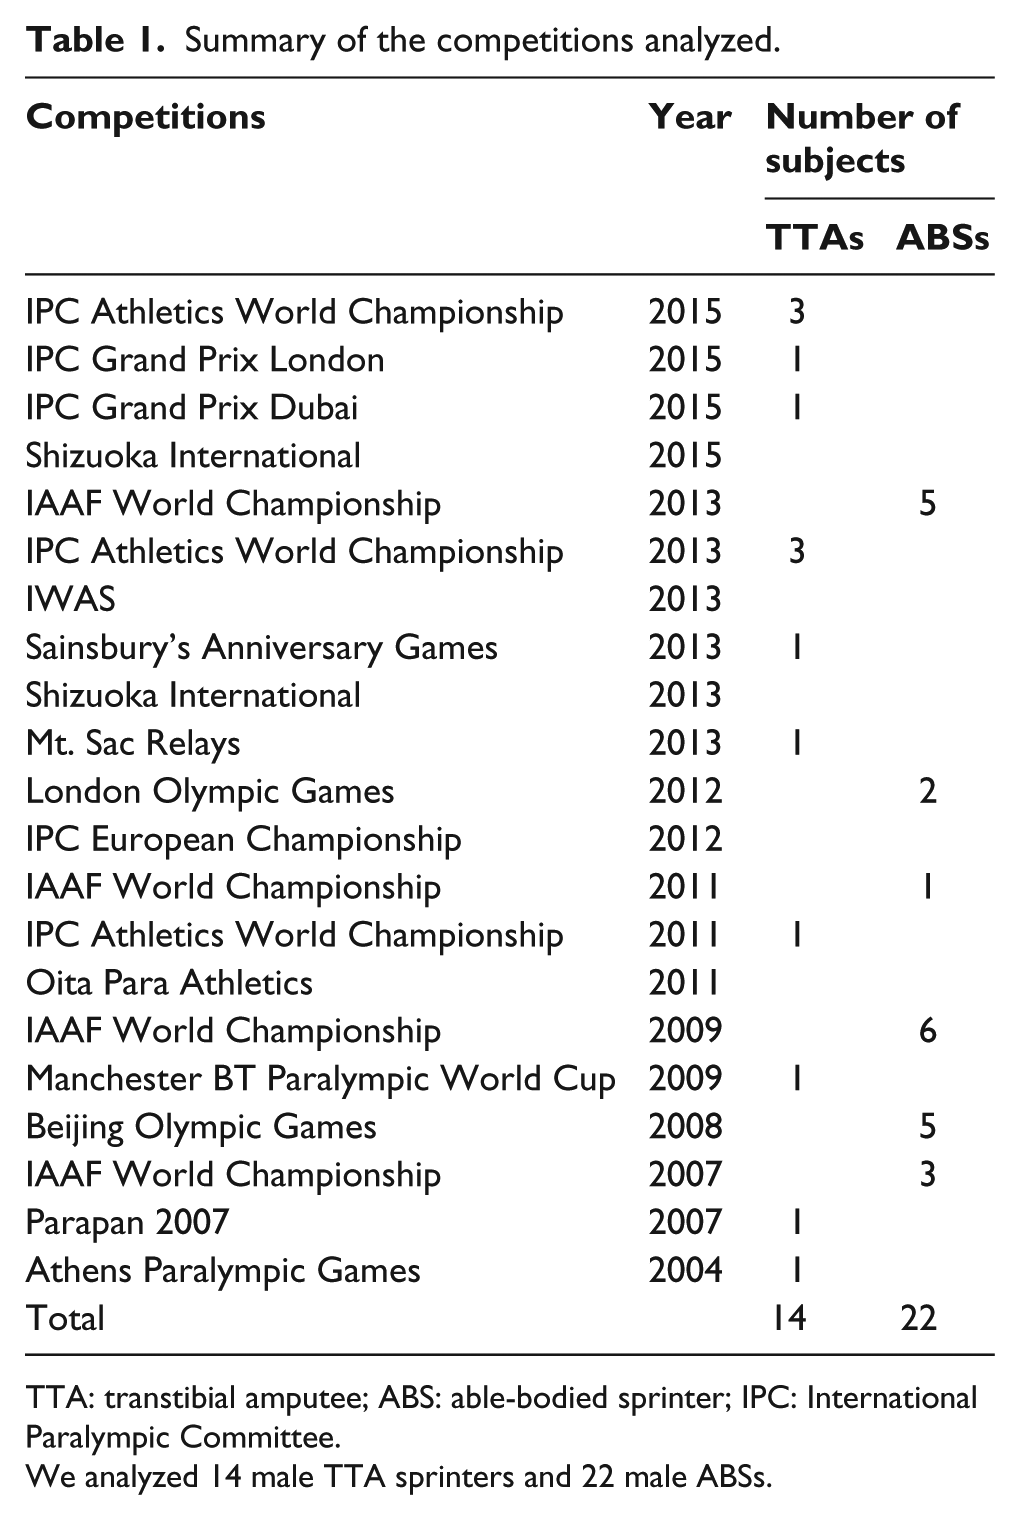
TTA: transtibial amputee; ABS: able-bodied sprinter; IPC: International Paralympic Committee.
We analyzed 14 male TTA sprinters and 22 male ABSs.
Methods
Data collection
We analyzed elite-level 14 male TTA sprinters and 22 male ABSs from publicly available Internet broadcasts. In our dataset, RSPs used by the analyzed athletes were eight Cheetah Xtreme, five Cheetah, and one 1E90 Sprinter. These races included several Olympics, Paralympics, International Paralympic Committee Athletics World Championships, IAAF World Championships, and other national-level competitions (Table 1). In this study, individual races were excluded from the analysis if the athlete did not complete the race or if the athlete’s body was not visible throughout the entire race. Furthermore, amputee sprinters who did not use RSPs were also excluded from the analysis. We only included (1) the fastest time for each individual into the dataset of each respective group and (2) sprinters who satisfied the A-qualification standards of each class (11.75 s in TTAs and 10.16 s in ABSs). Body height data for TTAs and ABSs were obtained from publicly available resources such as the official website of the International Paralympic Committee (http://www.paralympic.org/athletes/biographies), Team USA (http://www.teamusa.org/), International Association of Athletics Federations (http://www.iaaf.org/athletes), and Sports-Reference (http://www.sports-reference.com/olympics/), respectively. A similar approach to analyze publicly available data from sports competitions for research purposes was previously taken in several studies.9–11,16,17 Prior to the initiation of this study, institutional review board approval was obtained (Environment and Safety Headquarters, Safety Management Division, Advanced Industrial Science and Technology (AIST)).
Data analyses
According to the previous studies,9–11 we calculated the average step frequency (Fstep) as
where Nstep was the number of steps, which was manually counted by the authors. Trace was the official race time obtained from each competition’s official website. Furthermore, we calculated the mean Lstep by dividing race distance (100 m) with Nstep; thus
The last step before the finish line was considered to be the last step. If an athlete’s foot was located on the finish line, we considered it as a step.
Statistics
To compare body height, Fstep, Lstep, and Trace between TTAs and ABSs, an independent t-test was performed. Before the results were interpreted, Levene’s test was performed to ensure that the assumptions of normality and homogeneity of variance were met. If the assumptions were violated, Mann–Whitney U test would be used. We also calculated effect size (ES) for independent t-test using Cohen’s d 18 and for Mann–Whitney U test using correlational ES indicators (r). From this ES calculation, the results were interpreted as negligible, small, medium, or large for ES lower than 0.2, between 0.2 and 0.5, between 0.5 and 0.8, or higher than 0.8, respectively. Furthermore, we used Pearson correlation coefficients to examine the relationship between body height and Fstep, Lstep, and Trace. Statistical significance was set at p < 0.05. All statistical analyses were performed using SPSS version 19 (IBM Corp., Armonk, NY).
Results
As shown in Table 2, there was no significant difference in body height between TTAs and ABSs (t = 0.30, df = 34, p = 0.76, d = 0.14). We found that Lstep in TTAs was significantly shorter than in ABSs (Table 2; t = −6.73, df = 34, p < 0.01, d = 2.44). Table 2 also showed that there was no significant differences in Fstep between two groups (t = −1.10, df = 34, p = 0.28, d = 0.39). Furthermore, statistical analyses revealed that Trace in TTAs was significantly longer than that for ABSs (Table 2; z = −4.99, r = −0.56, p < 0.01).
Comparison of body height and spatiotemporal variables between TTAs and ABSs.
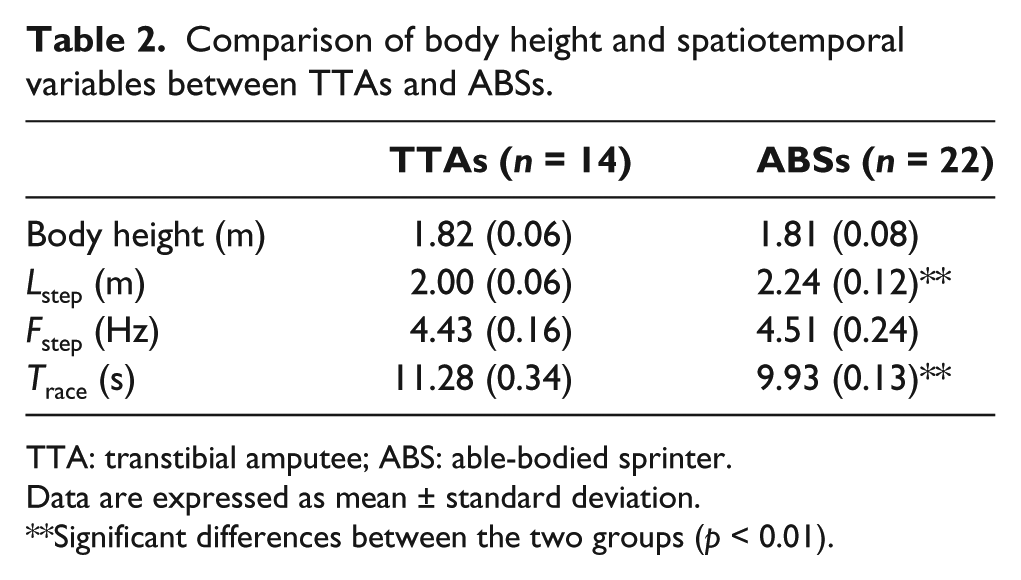
TTA: transtibial amputee; ABS: able-bodied sprinter.
Data are expressed as mean ± standard deviation.
Significant differences between the two groups (p < 0.01).
Figure 1(a)–(c) shows the relationships between body height and Fstep, Lstep, and Trace, respectively. A significant positive linear relationship was observed between body height and Lstep in ABSs (r = 0.79, p < 0.01) but not in TTAs (r = 0.01, p = 0.96). There was no significant relationship between body height and Fstep in TTAs (r = 0.09, p = 0.75), while a significant negative linear relationship between the two was observed in ABSs (r = −0.69, p < 0.01). Statistical analyses also revealed that there were no significant linear relationships between body height and Trace in TTAs (r = −0.12, p = 0.68) and ABSs (r = −0.41, p = 0.06).
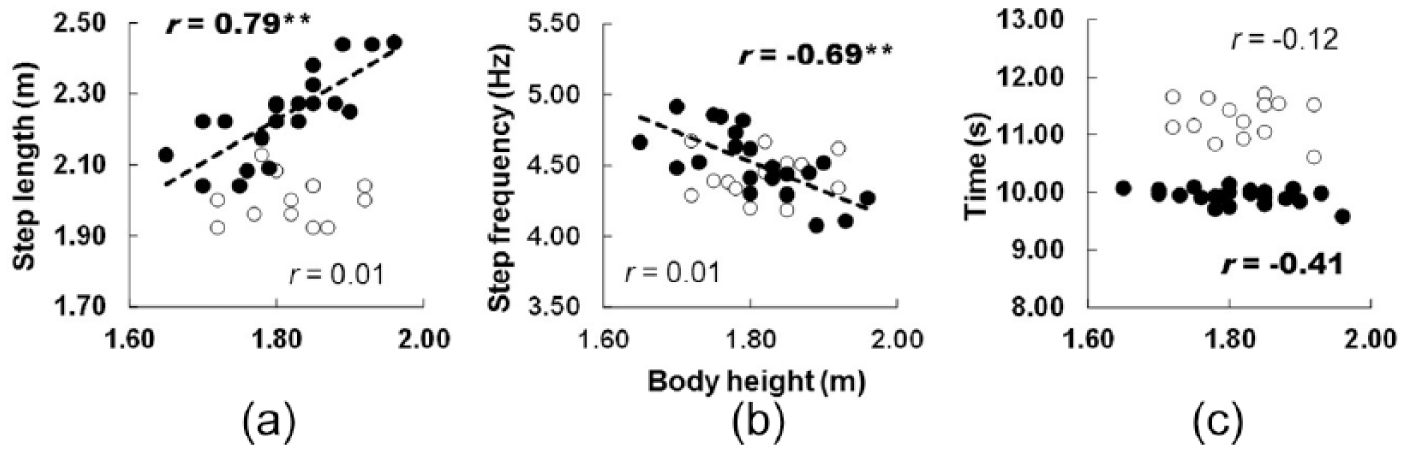
Relationship between body height and (a) mean step length, (b) mean step frequency, and (c) race time in TTAs and ABSs. Unfilled and filled circles indicate individual data for TTAs and ABSs, respectively.Thick dotted regression lines represent best fit lines for significant relationships in the ABS sample.
As shown in Table 3, there was no significant relationship between Lstep and Trace in the TTAs (r = −0.35, p = 0.23) and ABSs (r = −0.23, p = 0.29). Although Fstep was significantly correlated with Trace in the TTAs (r = −0.57, p < 0.05), it was not in the ABSs (r = −0.03, p = 0.91). Furthermore, we found a negative linear relationship between Lstep and Fstep in both groups (TTAs: r = −0.57, p < 0.05; ABSs: r = −0.96, p < 0.01).
Correlation coefficients of official race time (Trace), step length (Lstep), and step frequency (Fstep) for the two groups.
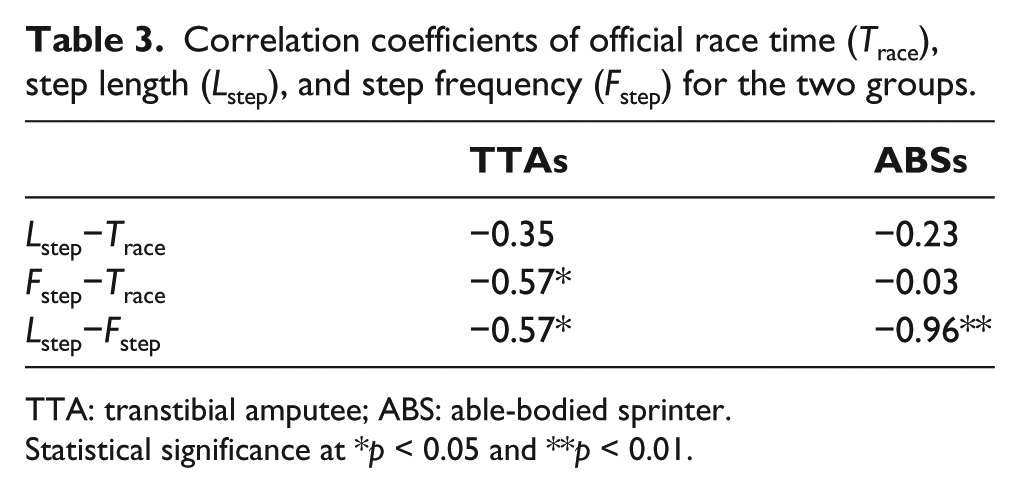
TTA: transtibial amputee; ABS: able-bodied sprinter.
Statistical significance at *p < 0.05 and **p < 0.01.
Discussion
It was found that Lstep in TTAs was significantly shorter than that in ABSs (Table 2). However, there were no significant differences in Fstep between TTAs and ABSs (Table 2). These results agree with previous studies which demonstrated that the differences in sprint performance between amputee sprinters and ABSs were mainly due to a shorter Lstep rather than a lower Fstep.8–10 According to the previous studies, the Lstep during sprinting partly depends on the vertical and horizontal ground reaction forces and impulses.14,15 Several studies also demonstrated that ground reaction forces in bilateral or unilateral amputee sprinters wearing RSPs were lower than those of ABSs during running.19,20 Therefore, it seems likely that a shorter Lstep in amputee sprinters, as compared to ABSs, would be mainly due to lower force exerted by their prosthetic leg.
In this study, a positive linear relationship was found between body height and Lstep in ABSs (Figure 1(a)). These results correspond with previous findings that the taller the athletes, the longer the Lstep.4,5 Our data demonstrated that ABSs also had a negative linear relationship between body height and Fstep (Figure 1(b)). Although we did not have body mass data for the individuals analyzed in our study, taller sprinters tend to have greater body mass. 7 According to the previous studies,21,22 larger animals (e.g. horses, waterbucks, and wildebeests) are faster and use lower stride frequencies than do smaller animals. This may be due to the fact that the resonant period of vertical vibration of the spring–mass system in the ground contact phase is longer in larger animals. 23
As shown in Figure 1(a)–(c), there were no significant relationships between body height and any spatiotemporal parameters in TTAs. These results support our initial hypothesis, which stated that the relationships between body height and spatiotemporal parameters during a 100-m sprint are not the same for TTAs and ABSs. Furthermore, current data also indicate that contrary to ABSs, spatiotemporal parameters in TTAs using RSPs are independent of subject’s body height. A possible explanation for this nonsignificant relationship between body height and spatiotemporal parameters in TTAs may be the inertial properties of RSPs. Actually, within the unilateral amputees, a higher body height would imply longer legs and also longer (and potentially heavier) prostheses. However, according to literature, 24 segment weight of leg and foot is 0.061% of whole body weight. However, it has been shown that RSPs were characterized as having lower mass (0.3–0.7 kg) and smaller moments of inertia than intact human shank–foot segments.13,14 The differences in inertia properties would lead to insensitive relationship between body height and spatiotemporal parameters in unilateral TTAs. Indeed, prosthetic foot inertial properties can significantly impact swing time and step frequency in running. For example, Weyand and Bundle 25 reported that a double-TTA sprinter showed a 21% shorter swing time and a 15.8% higher stride frequency (the inverse of the total stride time; 1/total stride time) compared to ABSs during maximal sprint running. As a result, regardless of their body height, TTAs may be able to maintain similar Fstep in their affected leg across different body heights.
As shown in Table 3, Fstep was significantly correlated with Trace in the TTAs. The results of this study agree with a previous finding which demonstrated that averaged step frequency was significantly correlated with average speed of 100-m sprint for the T44 class sprinters. 9 Therefore, this study and a past finding suggest that step frequency rather than step length could be the major determinant of sprint performance for the sprinters with unilateral transtibial amputation. We also found that Fstep and Lstep of each individual in all groups were inversely related (Table 3). These results are consistent with a previous result that demonstrated a strong negative correlation between Fstep and Lstep in TTAs and ABSs.9,26 Hence, our results suggest that sprinters who have a high Fstep tend to have a shorter Lstep and vice versa.
Average speed during a 100-m sprint is the product of the average step frequency and average step length. Although both parameters are inversely correlated, an increase in one factor will result in an improvement in sprint velocity, as long as the other factor does not undergo a proportionately similar or larger decrease. Because spatiotemporal parameters are modifiable by sprint training sessions, 27 identifying factors affecting these parameters of 100-m sprints in TTAs will provide coaches and practitioners with a basis for better evaluation of sprint performance for amputee sprinters. For example, coaches and practitioners should carefully consider non-modifiable predisposing factors such as age, time since amputation, amputation levels, 10 and ethnicity. 28 However, they may be able to develop more effective training methods for sprinters with unilateral transtibial amputation using RSPs disregarding body height.
Limitations
There are some limitations in this study. First, body height data for TTAs and ABSs were obtained from publicly available resources such as the official website of the International Paralympic Committee (http://www.paralympic.org/athletes/biographies), Team USA (http://www.teamusa.org/), International Association of Athletics Federations (http://www.iaaf.org/athletes), and Sports-Reference (http://www.sports-reference.com/olympics/), respectively. However, we did not measure their body heights directly; thus, the data may be related to standing height in their unaffected leg. RSPs are generally prescribed to be 2–5 cm taller than the contralateral limb. Indeed, Grabowski et al. 15 measured the affected leg lengths from six TTAs and found that their affected leg lengths were 2–8 cm longer than their unaffected leg lengths (Table 1 in their study). Therefore, further research is needed to clarify the relationship between body height and spatiotemporal parameters during a 100-m sprint in both TTAs and ABSs. Second, we calculated the average step length using the number of steps taken and the time of the whole race as data. However, as demonstrated by a previous study, 29 not all the steps during a 100-m sprint have the same length and frequency. For example, step frequency and step length have been documented to change as a sprint progresses from the start in ABSs, 28 indicating that these average values may not necessarily be representative of any particular part of the sprint. Furthermore, a number of steps taken by the affected and unaffected legs of amputees throughout the 100-m race were not the same among each individual. Furthermore, although we did not determine bilateral asymmetry of spatiotemporal parameters in this study, a previous study 16 demonstrated that there was limb-to-limb imbalance of spatiotemporal parameters in amputee sprinters using a video-based analysis. In addition, Salo et al. 17 subtracted a distance of 0.55 m and a time of 0.52 s from the calculations of averaged step length and step frequency based on their pilot test. This is because the first step out from the starting blocks does not cover as much ground as all subsequent steps, and it clearly takes the longest time. Thus, the current data should be recognized as an “average” step rate and step length during 100-m sprint.
Conclusion
In this study, we investigated the relationships between body height and spatiotemporal parameters during a 100-m sprint in both TTAs and ABSs. Although among ABSs, taller sprinters tended to have longer Lstep and lower Fstep than smaller sprinters, this relationship was not observed in TTAs. Hence, the results of this study suggest that the relationship between body height and spatiotemporal parameters during a 100-m sprint is not the same between unilateral TTAs and ABSs.
Footnotes
Author contribution
H.H., S.H., and W.P. managed the study, analyzed and interpreted the data, and drafted this manuscript. R.M., Y.K., T.A.H., and M.M. were involved in the study conception and managing the research expenses and interpreting the data. All authors contributed equally in the preparation of this manuscript. All authors read and approved the final manuscript.
Declaration of conflicting interests
The author(s) declared no potential conflicts of interest with respect to the research, authorship, and/or publication of this article.
Funding
The author(s) disclosed receipt of the following financial support for the research, authorship, and/or publication of this article: This work was supported by JSPS KAKENHI grant number 26702027.