
Abstract
Background:
The subtalar joint position during static stance is a crucial determinant of the peak plantar pressures and forms ideal reference point for any intervention in foot-related problems for leprosy-affected patients.
Objectives:
The study pursued the hypothesis through a three-dimensional model that stress will be minimal in the distal joints of the foot when the subtalar joint is in neutral static stance position.
Study design:
Finite element model.
Methods:
The computed tomography images of the feet for five patients suffering from Hansen’s disease having no muscle weakness and joint restriction were acquired. The gray intensities corresponding to the bones of the foot from the computed tomography images were three-dimensionally reconstructed. The three-dimensional model of the human foot, incorporating the realistic geometry, and the material properties of the hard tissues were then analyzed using a finite element solver for the stress distribution on bones of the foot.
Results:
The results demonstrate that the position of the calcaneum in the static stance position does contribute to the varying stress in the foot.
Conclusion:
The stresses in the bones of the foot are minimal while the subtalar is in neutral position; this position will be suitable for foot orthotic fabrication.
Clinical relevance
The clinicians, therapists, and podiatrists having less engineering skills can quickly assess the patient and get optimal results on the stress associated with the joints of the foot.
Keywords
Background
The early prediction and management of plantar ulceration in patients with anesthetic foot such as in leprosy and diabetes have been major challenges in the field of health care all over the world. Sensory loss along with the underlying pathomechanics is one of the main causes for plantar ulcers in these patients.1,2 With increasing number of foot problems both in leprosy and diabetes, the problem requires more surgical interventions. In the normal stance phase of the gait, the subtalar joint (STJ) position varies from being pronated at heel strike to a neutral position at midstance before going again into a supinated position at heel lift. These changes in the subtalar positions during the stance phase of gait will help the foot to be a mobile adaptor at heel strike and a rigid lever at the toe off. 2 The STJ positions of the foot during static stance help in the prediction of the peak plantar pressures at the foot and in the fabrication of foot orthotics. 3 Movements in the joints distal to the foot are determined by the range of motion that is possible in the STJ. 4 Studies have demonstrated the importance for customized orthoses being fabricated for the lower limb deformities to improve the gait pattern and thereby preventing the foot deformities.5–8 Various plantar pressure mapping systems have helped the clinicians and therapists in assessing the patient’s foot and in fabricating a suitable orthosis, for the healing of plantar ulcers. Although the plantar pressure mapping systems provide valuable information about the plantar pressure variations in the anesthetic foot, it does not provide much needed information on the tissue stresses caused during the different positions of the STJ. Direct measurement of the stress distribution in the human foot is not possible in vivo during the stance and the swing phases of gait. A model that helps in investigating the tissue stresses in the various STJ positions is the need of the hour.
The three-dimensional (3D) modeling of the foot, by reconstructing the computed tomography (CT) images, has to a larger extent helped in the identification of the high tissue stress and in determining the peak plantar pressure of the foot. Patil and colleagues9,10 in their two-dimensional (2D) model of the foot demonstrated that the shape of the foot and the muscle paralysis contribute to the stress changes in the different regions of the foot. It has also been found that the non-uniform variations in the soft tissue thickness of the sole lead to ulcers in the diabetic patients. 11 A novel 3D numerical model of the foot was developed incorporating all the geometrical and material properties of both skeletal and soft tissue components of the foot to find out the various stresses during different stance phases of gait. 12 This 3D model developed was used to help the surgeons and the therapists in their decision-making skills by virtual removal of some bony and soft tissue elements until an optimal structure is obtained to enhance structural foot corrections in patients.
Many patients affected by Hansen’s disease belong to the low socioeconomic group 13 and are either not able to afford the cost associated with these assessment methods or these facilities are not able to reach them. In this study, the authors intend to create a simplified 3D model of the foot that will identify the stress caused by bone on the soft tissues of the foot leading to ulcers and high-pressure areas in the anesthetic feet. In static stance position, when the STJ is in neutral position (neither pronated nor supinated), the foot is in the optimal position of measurement for orthotic fabrication. Based on this principle of the foot mechanics documented by Root, 1 the authors sought to investigate the association between the subtalar neutral position in static stance and the stress on the soft tissues by the bones of the foot. The authors formulated and pursued the hypothesis “When Subtalar Joint is in the neutral at the static stance position, the magnitude of the stress caused by the bones will be minimal in the midtarsal joint and the forefoot.”
Methods
3D modeling methodology
The 3D modeling of the foot will be beneficial for the patients if the complex mechanical behavior of the human foot can be validated with values achieved with the experimental 3D material constitutive model of the foot and accurate results can be obtained. Before the CT imaging, five Hansen’s disease-affected patients’ feet were assessed to identify for the presence of any muscle paralysis using the Medical Research Council (MRC) grading system. The muscle assessment was done to ascertain whether there were any deformities due to muscle imbalance. The joints of the foot were also assessed for the range of motion and its alignment.
The CT scan of the foot of these patients was taken. The images generated in the CT scan were then processed through the Materialise Interactive Medical Imaging Control System (MIMICS) software and the 3D models were acquired using density segmentation techniques. The acquired 3D models were then exported to the finite element modeling (FEM) package (ANSYS 14.0 version). The model was then prepared for linear analysis by defining loads, boundary conditions, material properties, and meshing.
Image generation
The CT scan was done on five patients affected by Hansen’s disease. Table 1 shows the assessment details of the patients before the CT images were taken. The CT images were obtained from the entire subjects keeping their foot in subtalar neutral position, the ankle at 90°, and in non-weight bearing position. Images with resolution of 24 line pairs/cm were acquired from each patient using a 16-slice CT machine with 8.0 Mega Heat Unit (MHU) MRC X-ray tube; the slice thickness was of 0.5 mm. While acquiring the CT images, the feet were maintained in STJ neutral calcaneal stance position (NCSP) irrespective of whether the subjects’ STJs were pronated or supinated in the relaxed calcaneal stance position (RCSP). The acquired images from individual patients were then analyzed parametrically. Figure 1(a) and (b) shows the sagittal and coronal view of CT scan images of a patient’s foot while in the STJ neutral position.
Details of patients’ assessment before the CT scan.
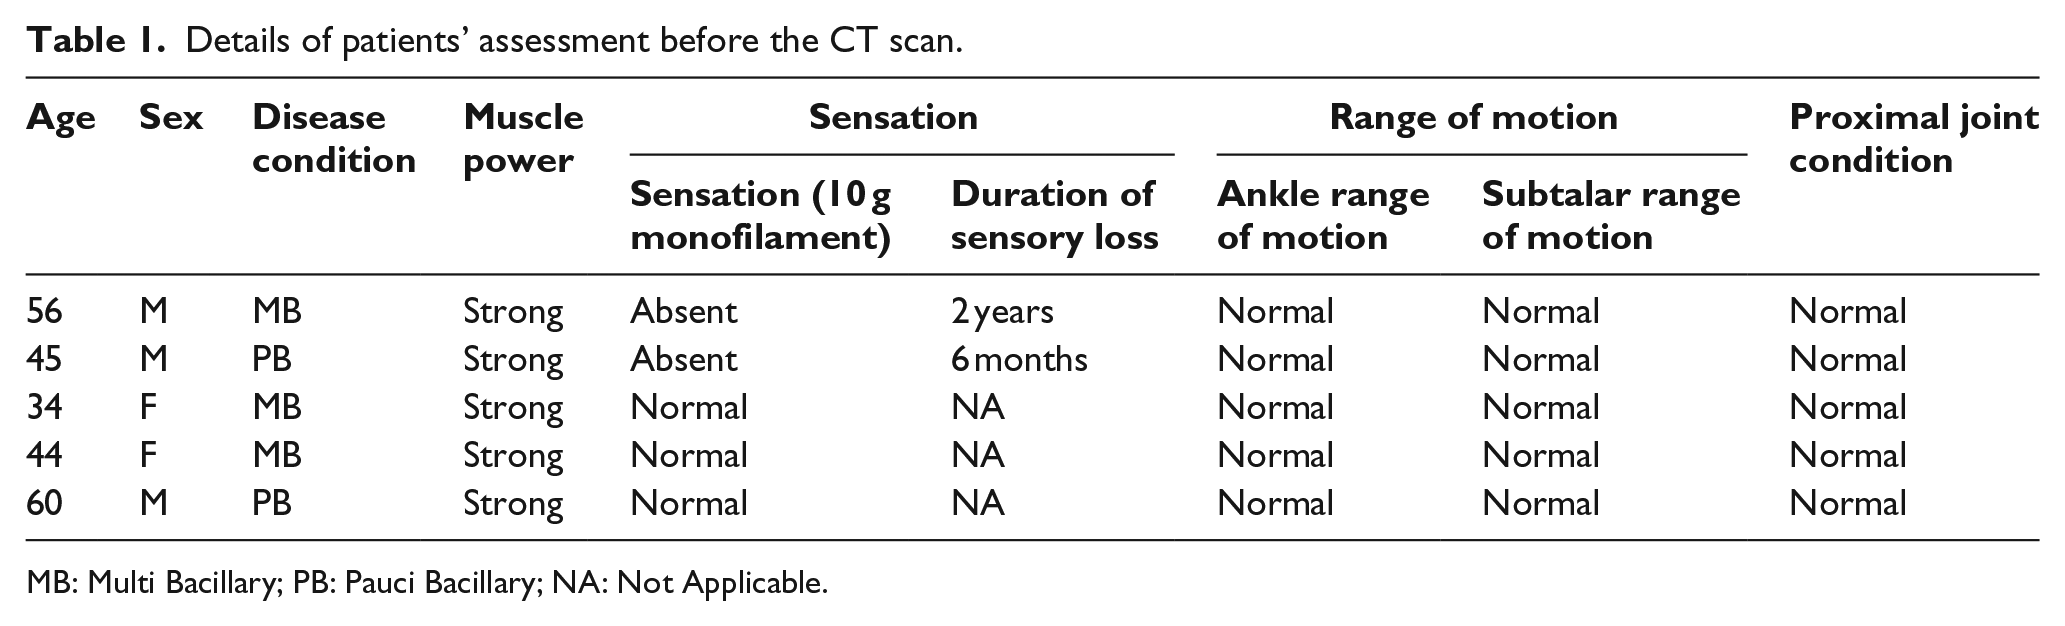
MB: Multi Bacillary; PB: Pauci Bacillary; NA: Not Applicable.
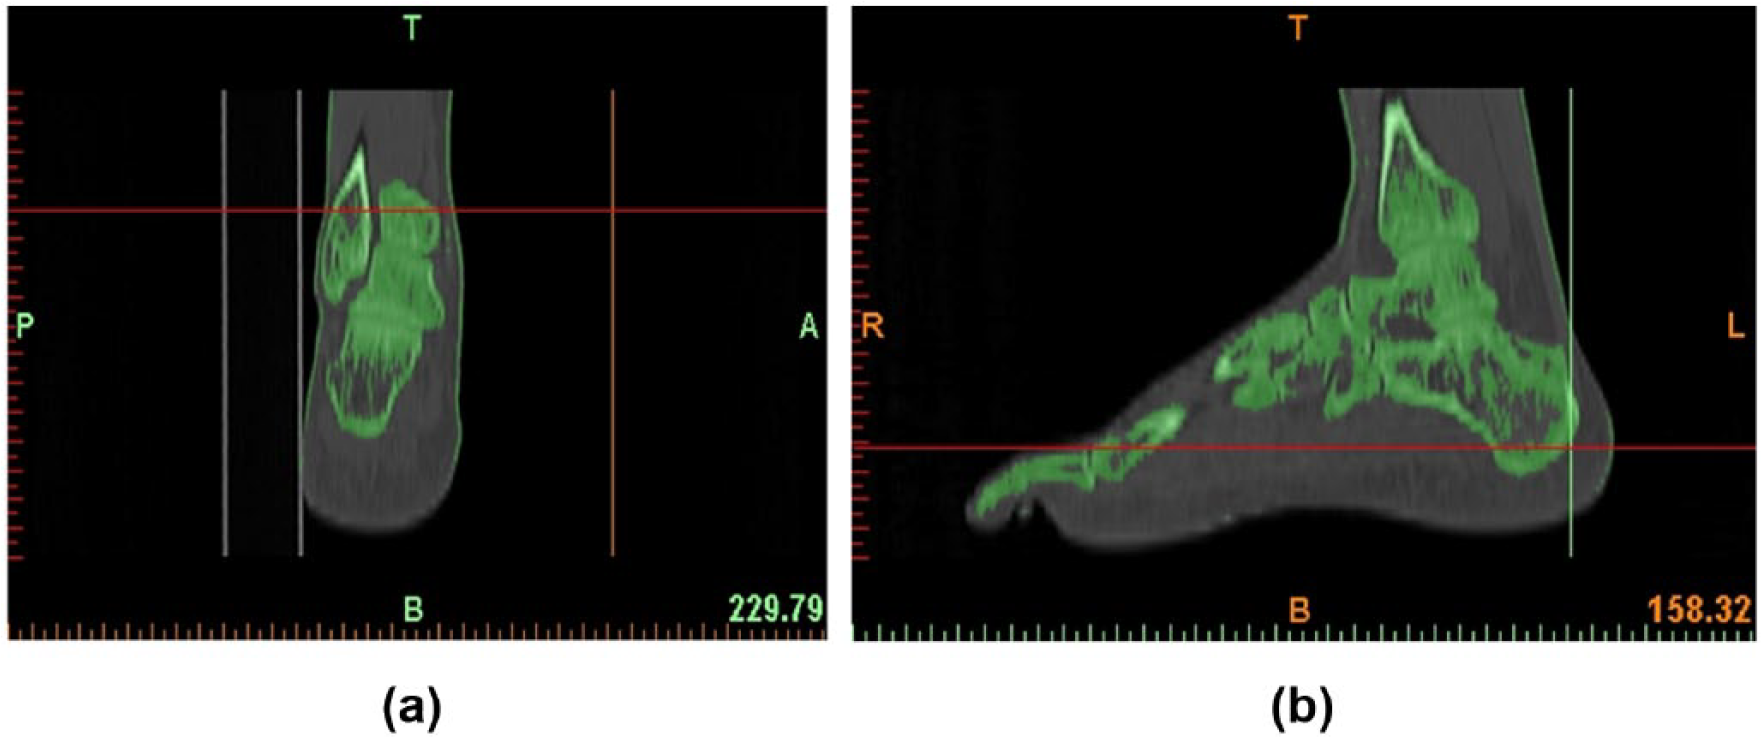
Image of a patient’s foot analyzed: (a) sagittal view and (b) coronal view.
3D reconstruction
The CT images acquired in the Digital Imaging and Communications in Medicine (DICOM) format for the 3D reconstruction are constituted by pixels with different gray intensities. The gray intensities corresponding to the bones of the foot were taken for the 3D reconstruction. Only the bones were modeled and other tissues such as the muscle, ligaments, and cartilages were not taken in this study. The different phases of the 3D reconstruction using the MIMICS software are given below.
Importing the DICOM images
Using the MIMICS software, all the slices of the CT scan were imported. For more reproducibility of the CT data, the images were acquired with a slice distance of 1 mm.
Thresholding
The thresholding based on the Hounsfield units was used to separate a bone from other soft tissues such as the muscles and the ligaments of the foot. In order to include both the cortical and the trabecular bones of the foot and exclude the cartilages, the lower and the upper limits of the Hounsfield units were kept as 200–2000 HU.
Segmentation
The segmentation operation was done on the multiple layer 3D slices. In this study, geometrical separation of individual bone was not carried out in the foot and the segmentation process was made easier and can possibly be done by any clinician or therapist. Cavity fill operations were done to remove voids in the model; polylines were also generated for this operation. Figure 2(a) and (b) shows the isometric view of the foot after 3D modeling.
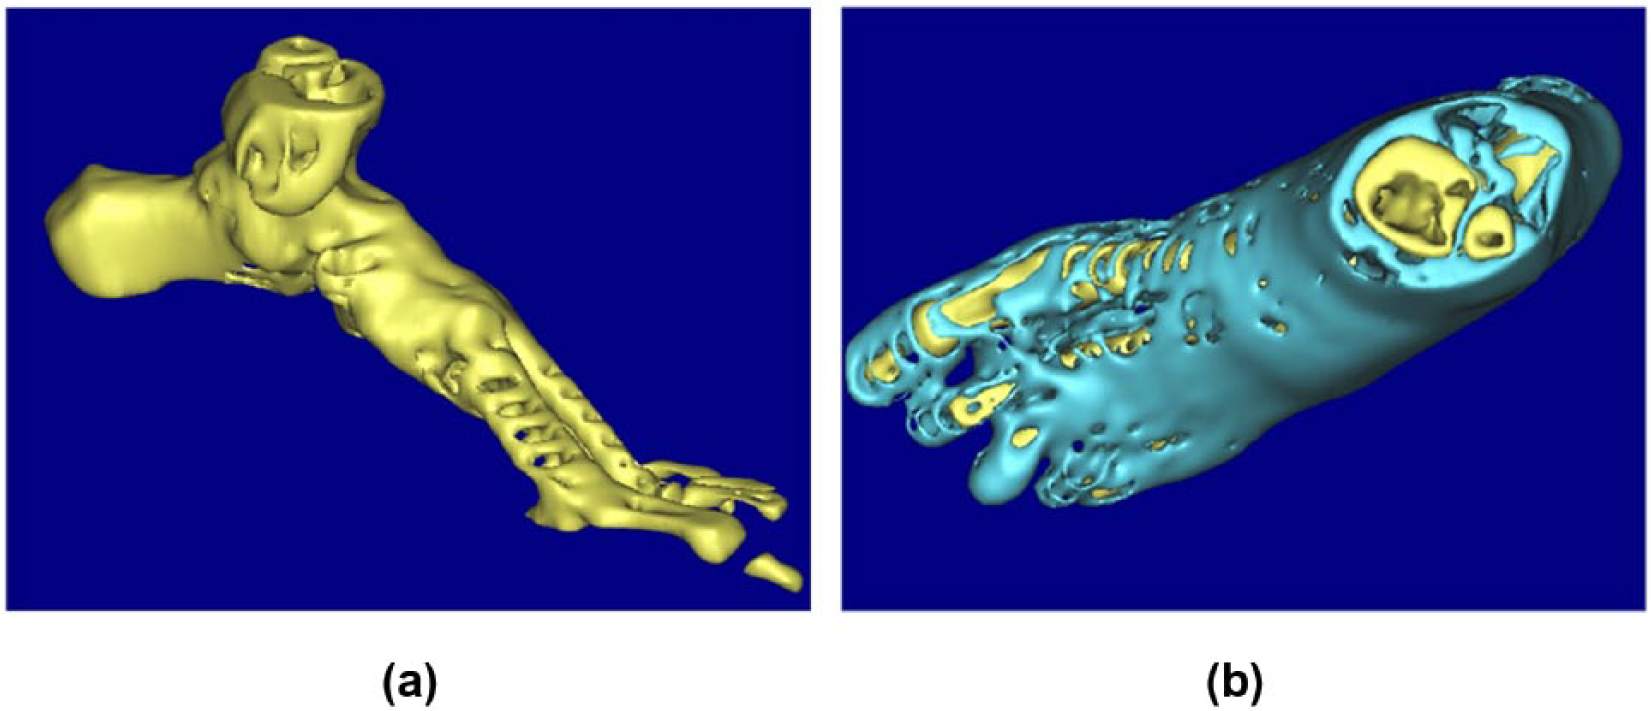
Isometric views of the three-dimensional model of foot: (a) skeletal model of the foot and (b) skeletal model with the muscles.
3D reconstruction
The generated density masks were used to model the bone. The 3D reconstruction was based on the 3D interpolation technique that was used to reconstruct the 2D images into a 3D model. The shell and triangle reduction was done to reduce the number of mesh elements before exportation for finite element analysis (FEA).
Linear FEA model reconstruction
Geometrical definition
The finite element method was selected for the analysis of the foot model as it is capable of analyzing the model that has complex shape and can give different loading for the structures at the desired areas. In this study, the 3D model of foot was transferred to the ANSYS 14.0 version for doing a linear analysis. The software is capable of generating the nodes and elements automatically which will help to describe the irregular geometries of the hard and other soft tissues. In this study, eight-noded HYPER58 element structure was used for showing the deflections and the strains occurring in the model. Each node has 3 degrees of freedom which can translate in x-, y-, and z-directions (Figure 3). This model consist of all the 29 bones that includes all the distal, middle, and proximal phalanges, three cuneiforms, talus, cuboid, calcaneum, navicular, tibia, and the fibula bones. As this model was simplified, the bone and the cartilages were fused together and taken for the analysis. Iterative solver was used in the analysis of the model. The final finite element foot model consisted of 38,471 nodes and 42,308 elements
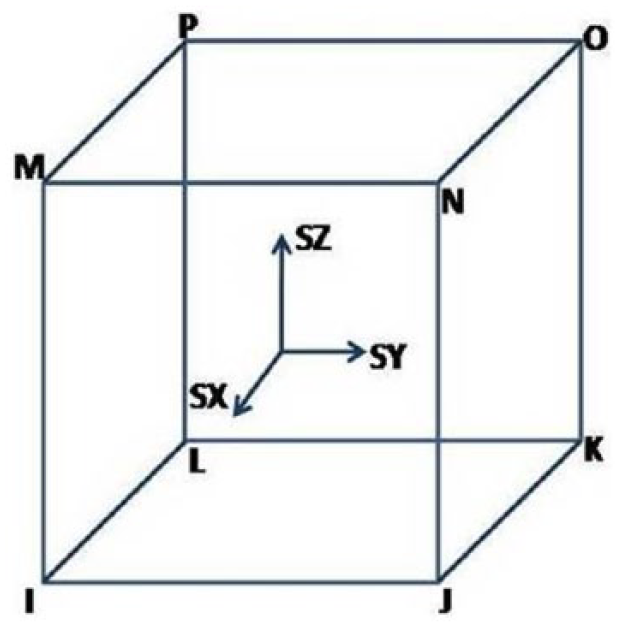
Stress output through a HYPER58 hyper elastic solid element.
Loads and boundary conditions
The bone has the primary responsibility of supporting the abnormal and the pathological foot. According to Root, 1 rarely do the muscles and the ligaments contribute more to the supporting function of the normal foot, than the bone does in the stance position to maintain equilibrium. It is the osseous restraining mechanism of the joints and the opposing force of the body weight with the force exerted on the calcaneum, which gives stability to the foot in the static stance while the STJ is in neutral position. So the muscle forces were not included for this 3D model which was analyzed.
Material properties
All the materials in this study were considered isotropic and linear-elastic. The bone material behavior was linear with Young’s modulus and the Poisson’s ratio, defined as 7300 N/mm2 and 0.3, respectively. The values according to Nakamura 14 were taken for the cortical and trabecular bone elasticity.
As per the study of Simkin, 15 a vertical force corresponding to half of the body weight is applied to each foot during the balanced standing and an upward force of two-thirds of the body weight was applied for the Achilles tendon on the calcaneus. In this study, forces according to each individual patient’s body weight were calculated and applied to the developed FEA foot models through the tibia and fibula irrespective of whether the patient had STJ in pronation or supination. The contact areas of the foot with the ground during the static stance are the calcaneum and the head of the metatarsals; similarly, in this study these areas were constrained and all the degrees of freedom were restricted in these joints.
Results
The stress distribution was examined in the ulcer prone areas such as the base of first metatarsal head (1MTH), fifth metatarsal head (5MTH), calcaneum, and in the areas where the bones come in contact with other bones and form a joint. The ankle joint load and the Achilles tendon load maintain equilibrium and keep the center of mass within the foot structure. Figure 4(a) to (c) shows the meshing of the 3D foot model, the constraints, and loads which were applied on the foot and the Von Mises stress distribution that was identified. The maximum stresses are found to be in the dorsum, plantar, and the anterior surfaces of the talus. Figure 5 shows that the stress is minimal in the plantar surface of calcaneum, the base of the fifth, and the 1MTH. Table 2 also shows the decrease in stress values at the talus with the increasing patient’s weight.
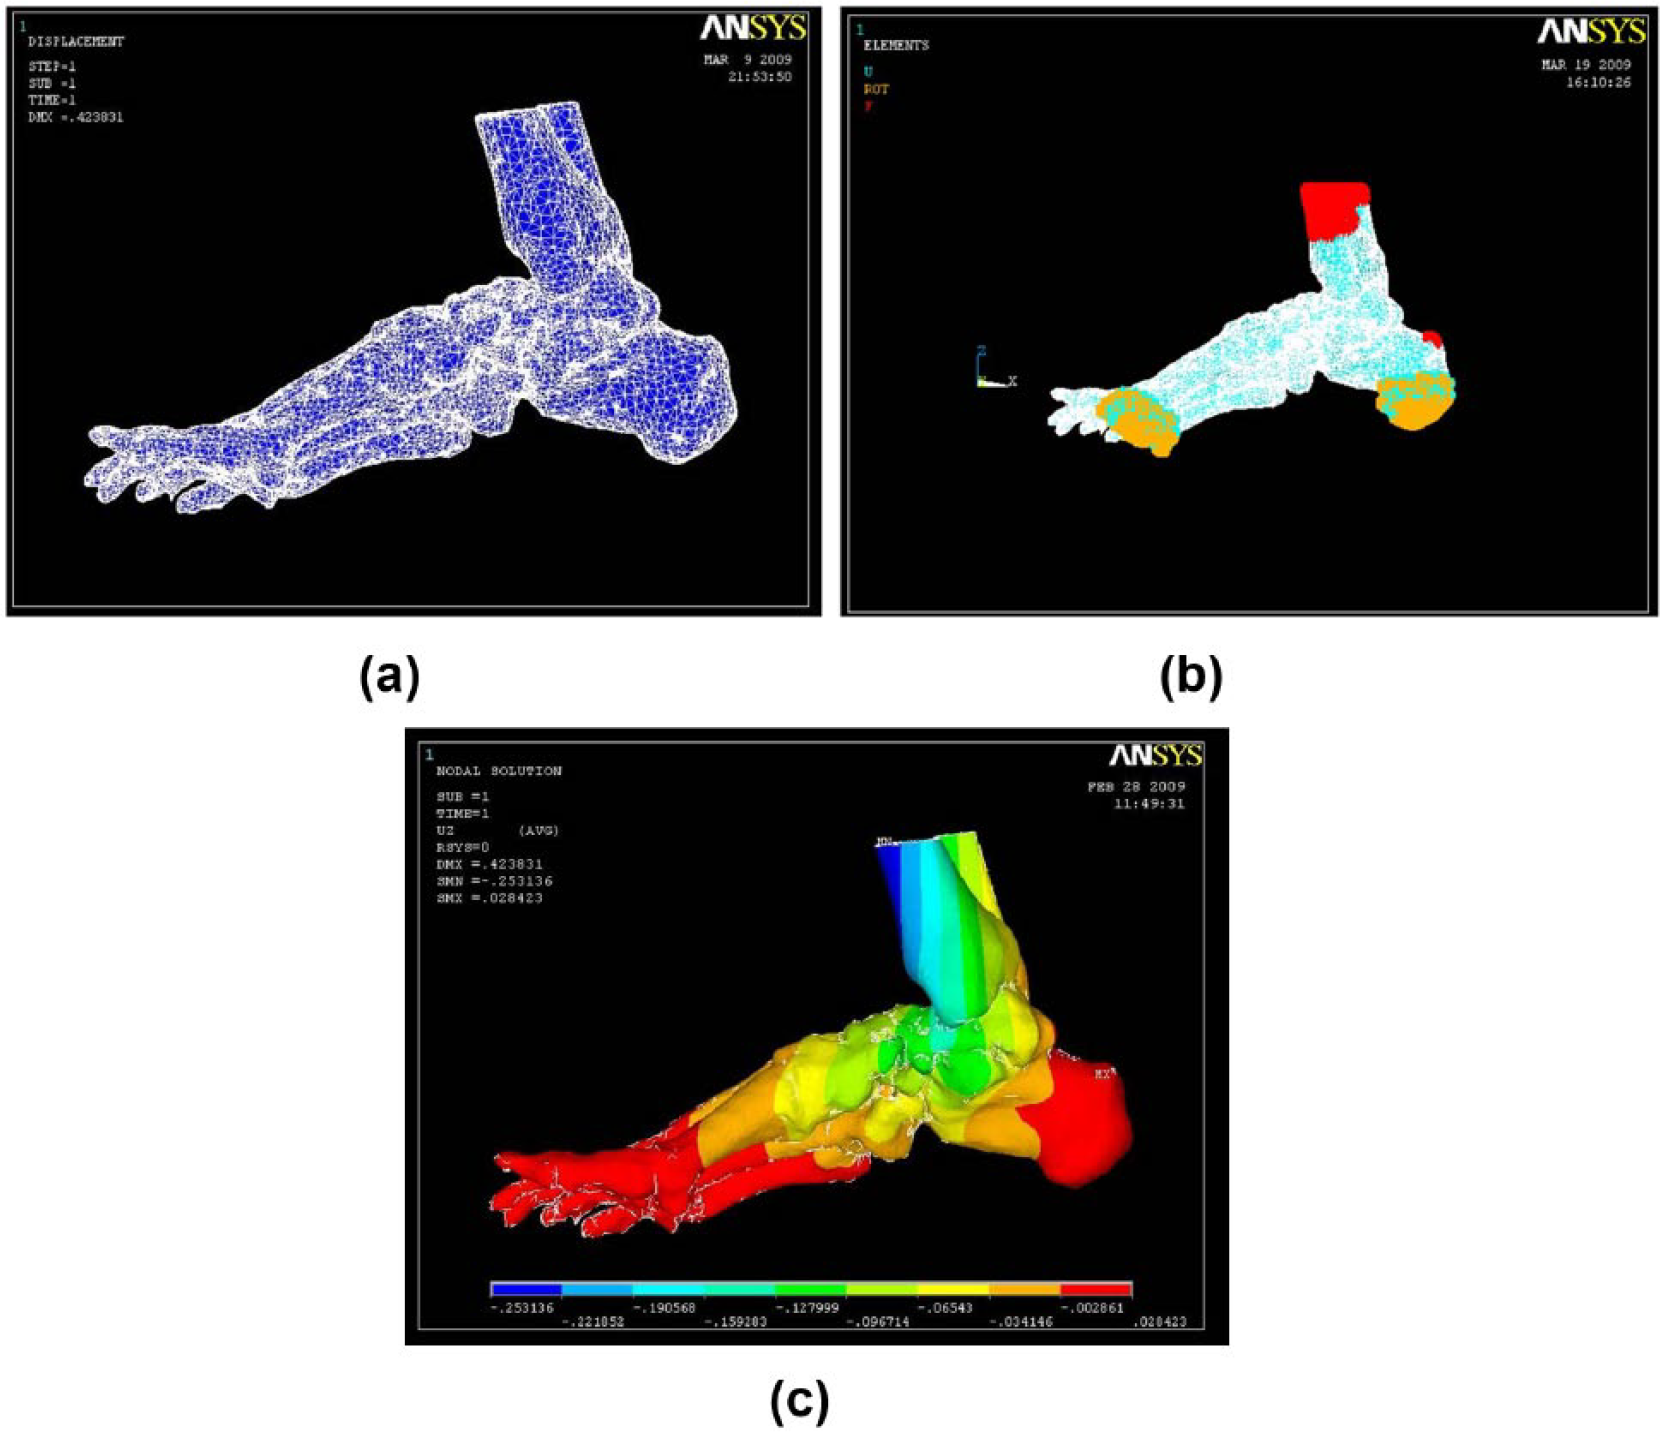
(a) Meshing of the three-dimensional foot model, (b) meshed three-dimensional model given constraints and loads, and (c) Von Mises stress distribution of the foot model.
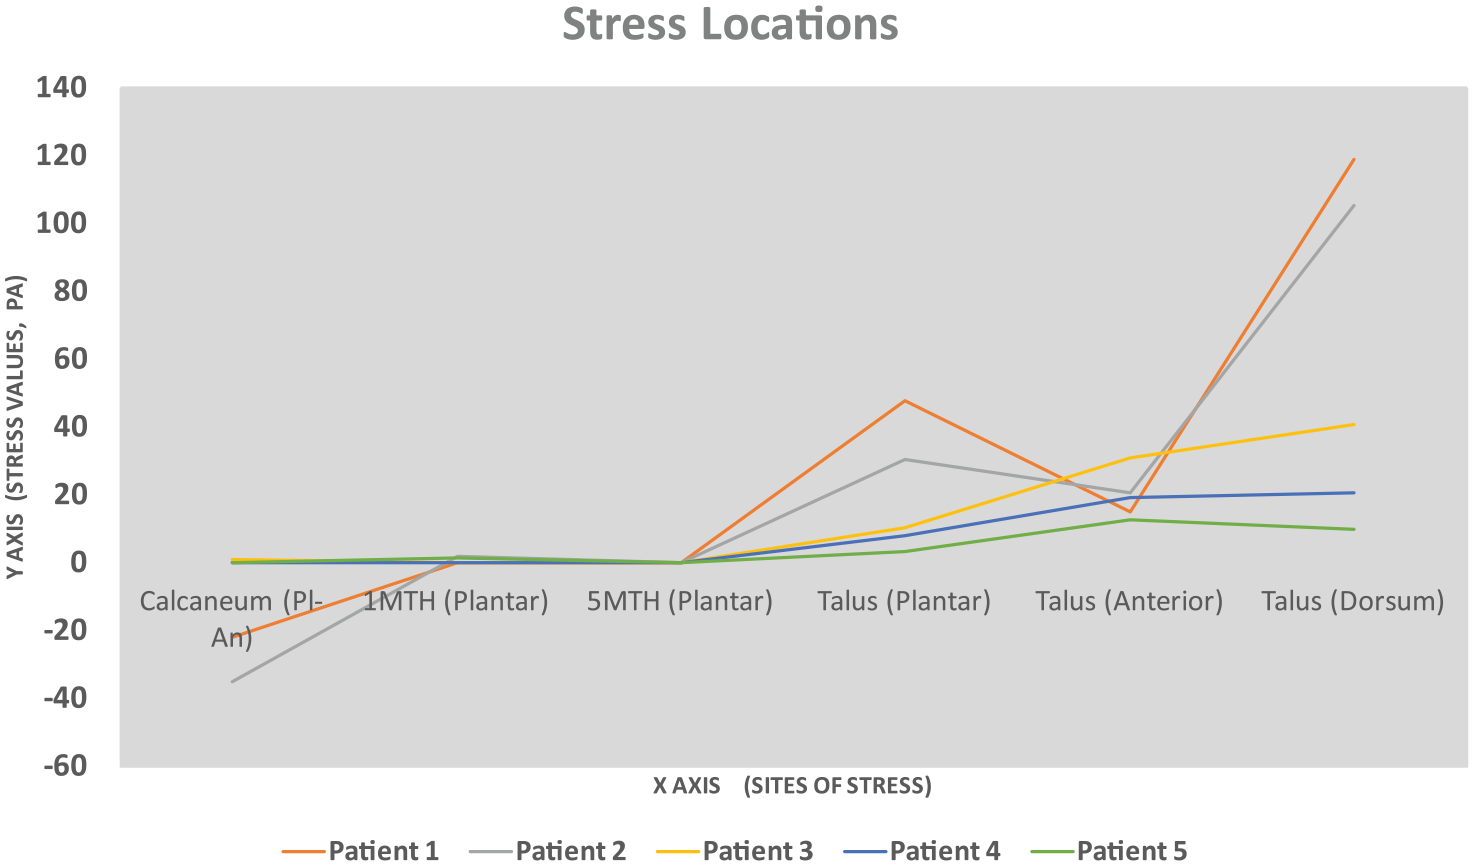
Von Mises stress identified on the foot of the patients.
Effect of patients’ weight on Von Mises stress during static stance phase.
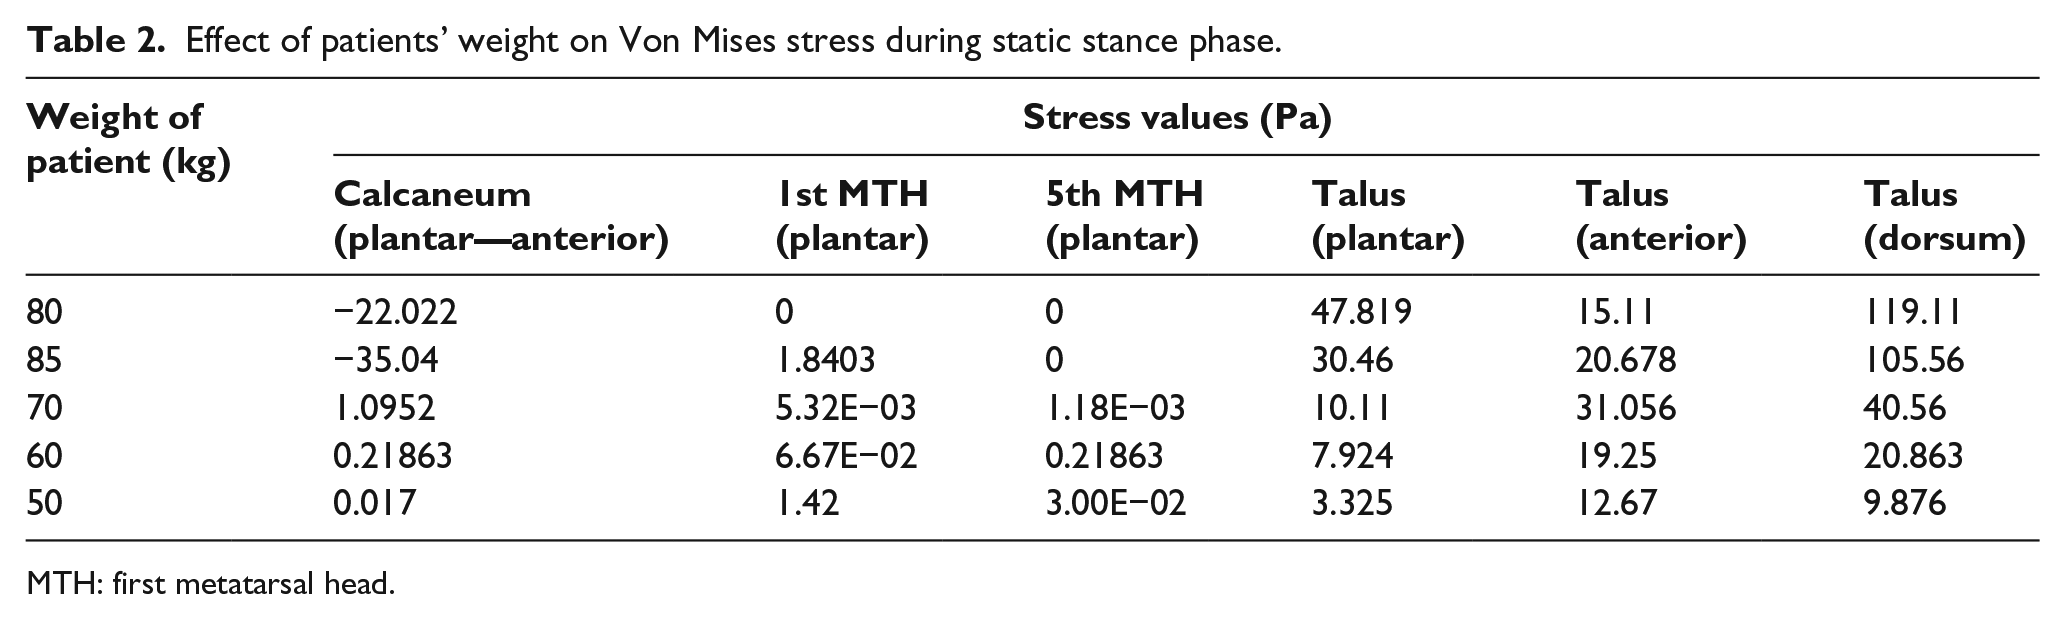
MTH: first metatarsal head.
Discussion
The hypothesis set by the authors was pursued through this study. Central to the hypothesis was that the STJ function is a crucial determinant of the tissue stress in the foot during gait. The ideal position of the foot where the tissue stress will be less in the distal joints of the foot will be when the STJ is in neutral position at the static stance position. In this 3D model, the analysis was made simple by doing a stress analysis on the hard tissues by giving it a linear material property. The clinicians, therapists, and podiatrists having less engineering skills can assess the patient and get optimal results of the stress associated with the joints of the foot when in subtalar neutral and can fabricate accommodative and functional orthoses for patients with peak plantar pressures and plantar ulcers. This 3D foot model predicted that the maximum stress was at the tibio-talar joints for the patients and the minimum stress at the distal joints and the metatarsal heads. The results show that the Von Mises stress is less when the STJ is positioned in neutral position even for patients with pronated and supinated STJs when in the static stance positions.
This study shows that increased stress values at the STJ are similar to the results of the model of Gefen et al. 12 model of analyzing the mechanical behavior in the midstance phase during gait. This study also shows increased stress in the talo-tibial joint. This study has some discrepancies with Patil and colleagues’ model9,10 which can be due to the type of the foot which was modeled. The foot which was modeled in their study had muscle paralysis and tarsal disintegration. The weakness in the muscles of the foot and the reduced mechanical strength of the bone due to osteoporosis could have led to the increased stress in certain regions of the foot. The method of assessing the tissue stress by this method will help in solving some of the challenges raised by Cross and colleagues2,16 in assessing the impact of STJ and midtarsal joint in the prediction of pressure distribution in the foot. Assessing foot stresses through this method would help in providing appropriate interventions for foot-related problems in the tertiary health center at an affordable cost.
The stress identified in the bony structures would further alter the underlying soft tissues leading to further ulcers, cracks, and blisters. In this study, the absence of any sole muscle atrophy on patients will prevent the joint stress variations alone from causing impairments. However, further study on large sample size following similar techniques needs to be carried out on analyzing the impact of the altered joint stress on leprosy-affected patients with soft tissue paralysis.
This method of assessment needs to be further carried out on a larger sample size to have significant results. In this study, the 3D modeling and the stress analysis were done on subjects with no muscle paralysis and their joint range of motion for all joints of foot being normal. The results of this study can be further compared with three-dimensionally modeled feet with the cartilages and soft tissue pad added to it. The stress analysis when carried out on the feet being modeled with the STJs either pronated or supinated on the above-mentioned conditions will probably lead to the early prediction of plantar ulcers in patients having anesthetic feet. The fabrication of customized orthoses using the same 3D foot model has helped reduce the tissue stress caused by either STJ supination or pronation. 17
Conclusion
The simplified 3D foot model can be used to predict the impact of joint stress on the underlying soft tissues. This study also suggests that the foot when maintained in subtalar neutral position at static stance can be considered for any interventions on patients with high-pressure areas and ulcers on the plantar surface of the foot. The FEA results acquired from this simplified 3D model will be validated with a 3D model in which the individual bones will be modeled and assembled with the soft tissues. The data from the same subjects will be used for modeling. The stress values will be acquired from the same anatomical regions with the subtalar in neutral, pronated, and supinated positions.
Thus, by adopting this method, we can assess the patients’ stress patterns in their limbs and assess injury-prone areas prior to the onset of sores. By doing so, we can develop custom-fit foot orthosis, which will revolutionize the foot care given in leprosy patients.
Footnotes
Ethical clearance
Ethical clearance and approval was acquired from Hospital Ethics Committee (HEC) of Vellore Institute of Technology (VIT) & Schieffelin Leprosy Research & Training Center (SLR&TC).
Author contribution
SKP: prepared the article; RV: administrative author, included as agreed in the MoU between the author and student co-supervisor; LM: conceptualized the research; SS: revised the article and IP owner on this research.
Declaration of conflicting interests
The author(s) declared no potential conflicts of interest with respect to the research, authorship, and/or publication of this article.
Funding
The author(s) received no financial support for the research, authorship, and/or publication of this article.