
Abstract
Background:
Relatively little is known about spine during gait compared to movement analysis of the lower extremities. The trunk is often regarded and analysed as a single rigid segment and there is a paucity of information on inter-segmental movement within the spine and its relationship to pelvis and lower limbs.
Objectives:
To develop and validate a new multi-segment kinematic model to assess regional three-dimensional movement of the lumbar, lower thoracic and upper thoracic spine during gait.
Study design:
Observational study.
Methods:
The study was conducted in two parts: (1) to provide validation measures on the kinematic model built in commercially available software and (2) to apply the marker configuration to the spine at T3, T8 and L3 during gait analysis on 10 healthy male volunteers.
Results:
Proposed model revealed excellent concurrent validation measures between an applied input angle to the recorded output angle from the kinematic model. A high reliability was observed during gait analysis, both during a single session and between sessions for all participants.
Conclusion:
The thoracic region of the spine should not be modelled as a single rigid segment and the proposed three-dimensional cluster is reliable and repeatable to assess the inter-segmental movement of the spine.
Clinical relevance
Reliable kinematic data can be collected using the three-dimensional cluster technique, thus, allowing researchers to accurately distinguish between movement patterns of healthy individuals to those with a clinical condition, and provide confidence in data acquisition during the monitoring process of an implemented rehabilitation intervention programme.
Background
Clinical conditions such as leg length discrepancy (LLD) can adversely affect movement of the spine and the coupling between the spine and pelvis during gait. 1 These changes in the coordination pattern between the pelvis and spine have been implicated as a biomechanical factor associated with the development of low back pain (LBP).2,3 Thus, an understanding of spinal motion while walking in coordination with the lower limbs4,5 will assist in the assessment and clinical management of individuals with spinal pathologies. Such knowledge could also be used to monitor an interventional strategy following the prescription of an ambulatory aid for the purpose of restoring normal gait patterns.
Marker-based motion capture systems are widely used in gait analysis laboratories, providing accurate kinematic measurements and a quantitative means of assessing gait impairment. Various kinematic models designed to assess pelvis and lower limb movement have been validated and are regularly implemented in external gait laboratories.6,7 However, the examination of spine motion during gait has received little attention compared to movement analysis of the lower extremities.8–10
Kinematic modelling of the thorax and analysing movement of this segment relative to the pelvis normally consider the trunk as a rigid segment. While considered to be a suitable approach for clinical gait analysis, 11 a defined thorax segment has yet to be agreed upon in the scientific literature.11–14 Furthermore, conventional gait models disregard movement in the lumbar region and are unable to provide information on the coordinated interaction between multiple segments of the spine. Recently, Leardini et al. 11 proposed a five-segment trunk model for gait analysis which included a segmental analysis of the lumbar spine. However, the inability to place markers on accessible anatomical landmarks limited the analysis of the lumbar segments to the sagittal and frontal plane.
Crosbie et al. 15 clearly demonstrated differences in ranges and patterns of motion for the lumbar, lower and upper thoracic spine during gait. Supportive evidence demonstrating inter-segmental movement of the spine is available in the literature.5,16 Crosbie et al. 15 was also able to define the transverse plane in a coordinate system by placing additional markers on the surface of the back laterally to those attached to the spinous processes of the spine. Nevertheless, the independent movement between the markers placed on the skin, the back shape of an individual, and the influence of supporting musculature may subsequently contribute to segment angle calculations.
The attachment of a three-dimensional (3D) marker cluster onto the surface of the back and spine offers the advantage of allowing a cluster of markers to move relative to each other and allows for the tracking of movement in 3D. The coordinate system for the 3D cluster is based on the arrangement of the markers attached to the structure. Since these markers are also involved in tracking movement, it is only possible to analyse movement around the region of the spine where the 3D cluster is attached.
While it would seem that the 3D cluster technique is well documented in the literature, there are no standardised guidelines for the development, construction and application for the 3D cluster technique. Furthermore, the lack of detail in published studies on the materials and construction of the 3D cluster restricts the opportunity to investigate the external validity of this approach. Also, investigations often cite previously developed techniques but fail to provide a schematic of the replica 3D cluster to allow a comparison to the original. 17 To counteract the potential limitations of relatively larger structures, 18 Konz et al. 5 proposed the use of smaller 3D clusters that can be attached over the spinous processes using only double sided adhesive tape. However, reliability analysis and movement pattern waveforms of the new proposed kinematic model were not documented. Consistent range of motion (ROM) values can be gained from utilising a 3D cluster when applied within the same gait laboratory.19–22 However, there is limited evidence of time-series kinematic waveform analysis and an understanding of functional movement using the 3D cluster technique.
Therefore, the overall aim of this study is to develop a structured approach to assess the 3D kinematics of the lumbar spine. This approach will not only provide further clinically relevant inter-segmental movement of the thoracic region using 3D cluster which has not been reported but also highlight the importance of reporting global movement pattern data to explain relative movement.
Methods
3D marker clusters adapted and based upon the design of previous investigations5,23,24 were placed over the spinous processes of T3, T8 and L3 and were used to track movement in the upper thoracic (UT), lower thoracic (LT) and lumbar (L) region of the spine, respectively (Figure 1(a)). Each 3D cluster consisted of a silicone base plate and three non-collinear reflective markers attached to plastic tubing, fixed to the skin using double sided adhesive tape (Figure 1(b)). For reproducibility, the 3D clusters were constructed from components found in laboratories that use a optoelectronic motion capture system. 25
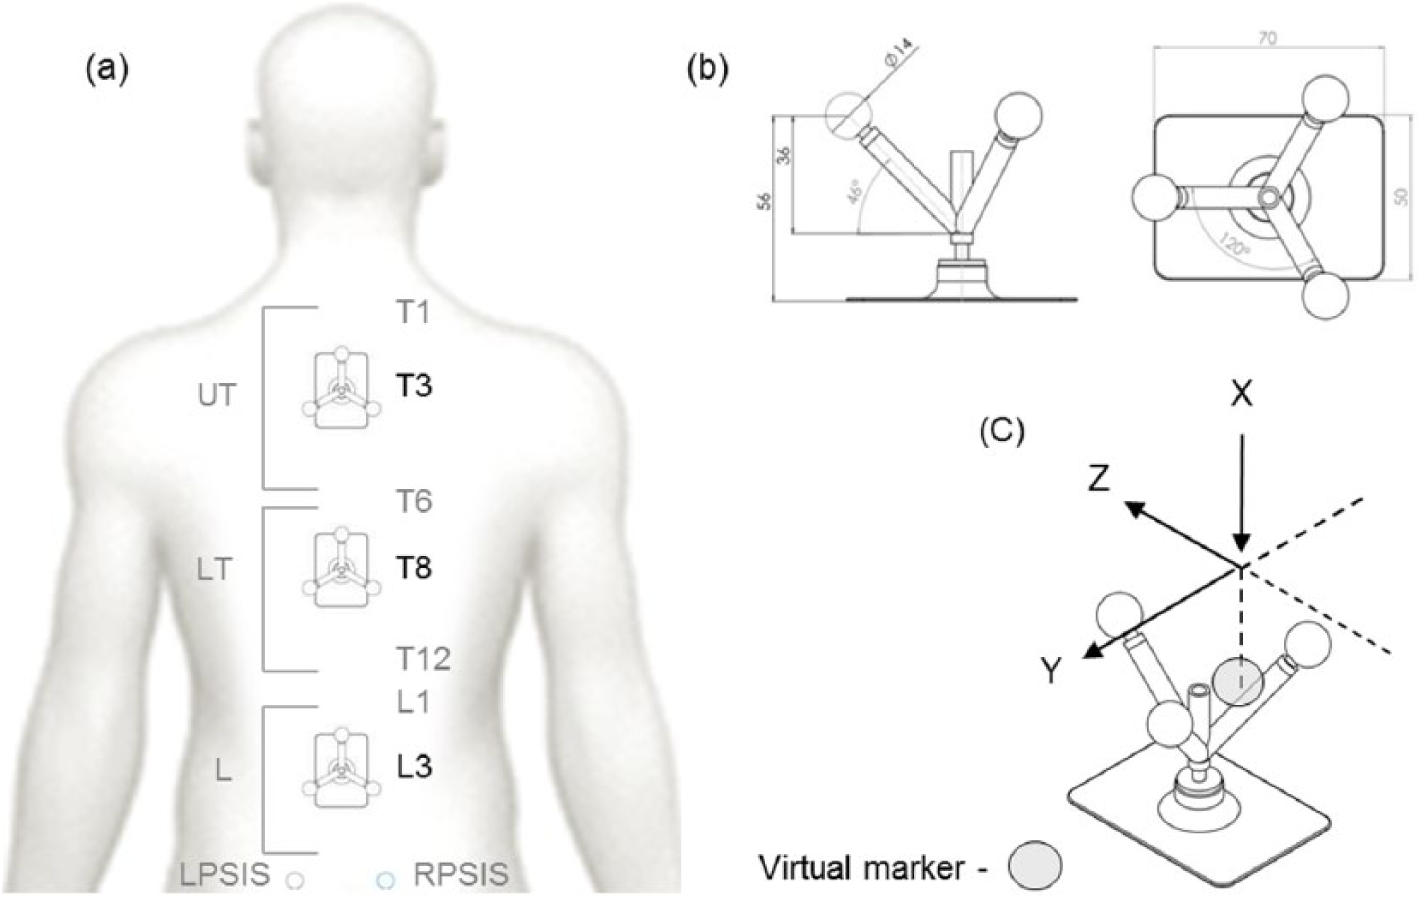
(a) Marker set configuration, (b) cluster rig dimensions (useless stated all measurements are in millimetres) and (c) 3D Cluster coordinate system.
Coordinate systems
The global coordinate system (GCS) was defined with the X-axis corresponding to the anterior–posterior direction (positive X-direction indicated forward progression). The Y-axis was defined as medio-lateral perpendicular to the X-axis parallel to the ground (positive Y-direction pointing to the left). The Z-axis corresponded to the vertical direction (positive Z-direction pointing upwards).
The origin of the pelvis segment local coordinate system (LCS) was the mid-point between the two anterior–superior–iliac spine markers that defined the Y-axis. The X-axis was directed in an anterior direction perpendicular to the Y-axis from the mid-point of the anterior–superior–iliac spine and mid-point between the posterior–superior–iliac spine markers. The Z-axis was formed by the cross product of the X- and Y-axis.
The L, LT and UT LCS were defined using the three markers attached to each 3D cluster. The Y-axis was defined as a line passing through the two markers mounted on the lateral ends of the 3D cluster (positive direction to the left). The Z-axis was defined from the mid-point between the lateral markers on the 3D cluster to the vertical marker (positive direction upwards). The X-axis was the cross product of the Y- and Z-axis (positive direction forwards (Figure 1(c))).
Joint parameters
3D angles were calculated with respect to the normal standing position of the participant. Rotations about the GCS and LCS were based on the right-hand rule convention. Angular kinematic data were computed by measuring the relative movements between the 3D clusters and pelvis: UT relative to LT, LT relative to L and L relative to the pelvis. In addition to the pelvis, movement data from the 3D clusters was also reported relative to the GCS. Cardan angles were calculated using the YXZ (anterior–posterior tilt/flexion–extension, obliquity/lateral flexion and axial rotation). 26
Instrumentation and software
An eight camera motion capture system (OMG / Vicon, Oxford, UK) was used to record 3D coordinate data at 100 frames/s. The capture volume was defined with dimensions of 2.5 × 2 × 6 m. The kinematic spine model was developed in Visual3D (C-Motion, Inc., Germantown, MD, USA) and the marker coordinate data were processed using a low-pass Butterworth filter with a cut-off frequency of 6 Hz. 27
Experimental procedures – kinematic model accuracy and precision
To validate the proposed kinematic spine model created in Visual3D, the marker configuration was applied to a mechanical frame that represented a replica of a human spine, which had the capability of moving in all three planes of motion (Figure 2(a)). To test the accuracy and precision of the generated output from Visual3D software, angle data were compared against 10 known static reference positions (0°, 2°, 4°, 6°, 8°, 10°, 12°, 15°, 30° and 45°). Predetermined reference positions were also chosen to test angle estimation from dynamic trials (tracking movement from 0° to 30°).
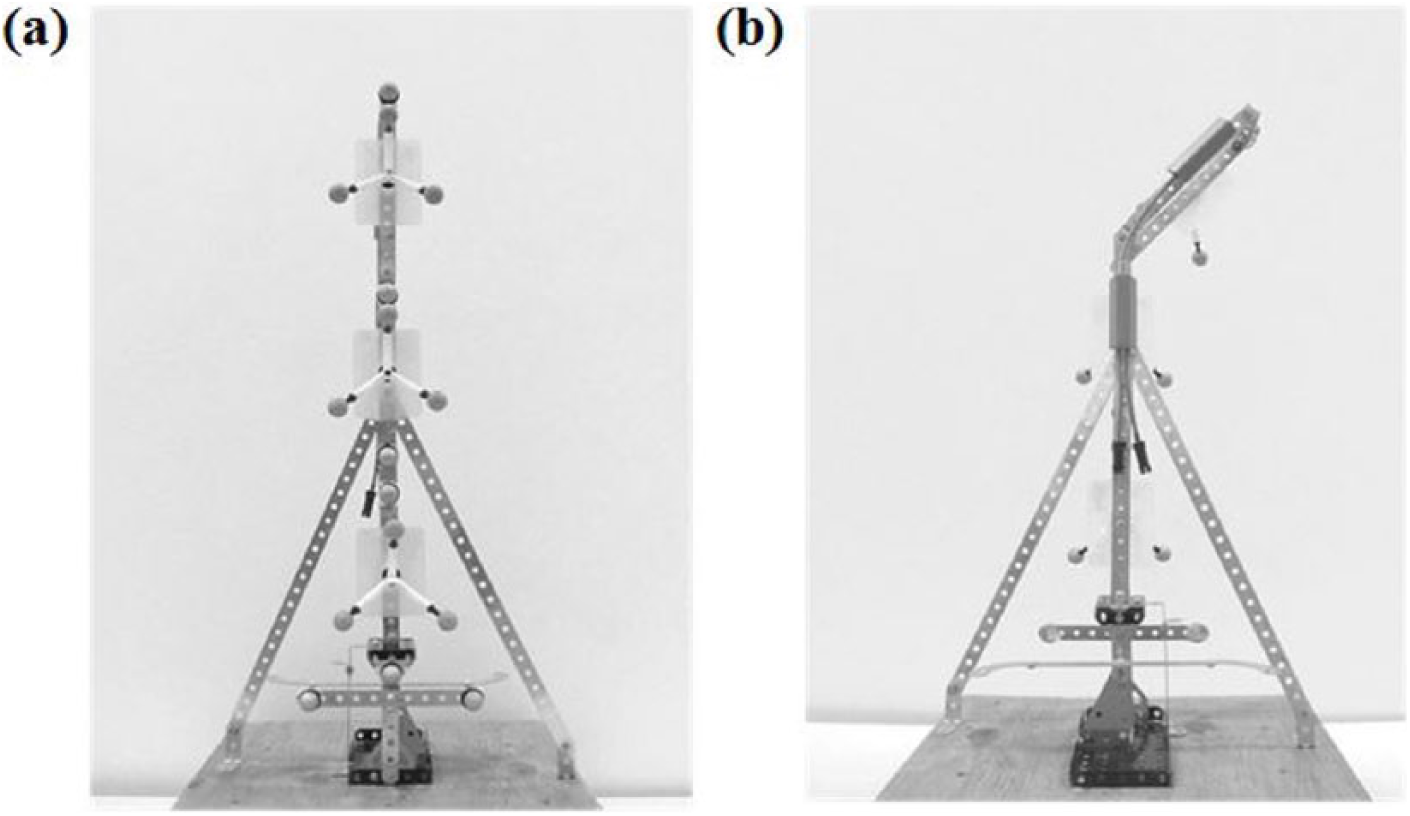
(a) Posterior view of the marker set configuration attached to the mechanical frame and (b) anterior view of the flexible electro-goniometer (FEG) attached to the mechanical frame.
A flexible electro-goniometer (FEG) and a torsio-meter (TM) (model SG150b and Q150, respectively; Biometrics Ltd, Gwent, UK) were attached to the mechanical frame on separate occasions (Figure 2(b)). The FEG and TM were the chosen criterion reference from which static and dynamic reference positions were determined. The validation of the FEG has been reported elsewhere. 28 The FEG and TM both consist of two lightweight plastic end-blocks at either end of a spring containing a strain gauge mechanism. The end-blocks of the FEG and TM were attached at proximal and distal locations to the joint centre on the mechanical frame. The LCS for each 3D cluster was constructed in the same way within Visual3D; therefore, only the UT 3D cluster was chosen during the kinematic model validation procedures. Relevant hardware (Biometrics Data-link) and associated software was synchronised with the motion capture system and recorded five 5 s trials for flexion and extension (FEG), left and right lateral flexion (FEG) and axial rotation (TM) movements. Angle outputs were recorded to two decimal places.
3D cluster – application during gait
A total of 10 healthy males, with a mean age of 22.4 (±2.46) years, height of 180.3 (±7.18) cm and mass of 74.97 (±11.02) kg, with no history of musculoskeletal impairments participated in the study. Ethical approval was sought and received from the University Committee and all participants provided an informed consent.
Procedure for data collection
Participants were required to walk barefoot at a preferred walking speed (PWS). Wireless timing gates (Brower Timing Systems, Draper, UT, USA) were used during data collection to ensure PWS was achieved. A motion capture system was used to record kinematic data over five trials along with two AMTI-OR6 force platforms (Advanced Mechanical Technology, Inc. (AMTI), Watertown, MA, USA) to assist in the identification of gait events (initial contact and toe off). This procedure was repeated 1 week later to examine test–retest reliability; walking speed was matched to session 1.
Results
Kinematic model accuracy and precision
Linear regression analysis was used to produce the best-fit line through the data relating the applied input angle (TM/FEG) to the output angle from Visual3D software (kinematic model) (Figure 3). Standard error of the measurement (SEM) (range: 0.17°–0.35°), 95% confidence limits (range: 0.11°–0.72°) and coefficient of determination (R2) (0.99) values revealed excellent within and between session validity measures for the static reference trials (Figure 3). Coefficient of multiple correlation analysis for the dynamic trials revealed excellent inter-validity measures (0.91–0.95) for left and right axial rotation.
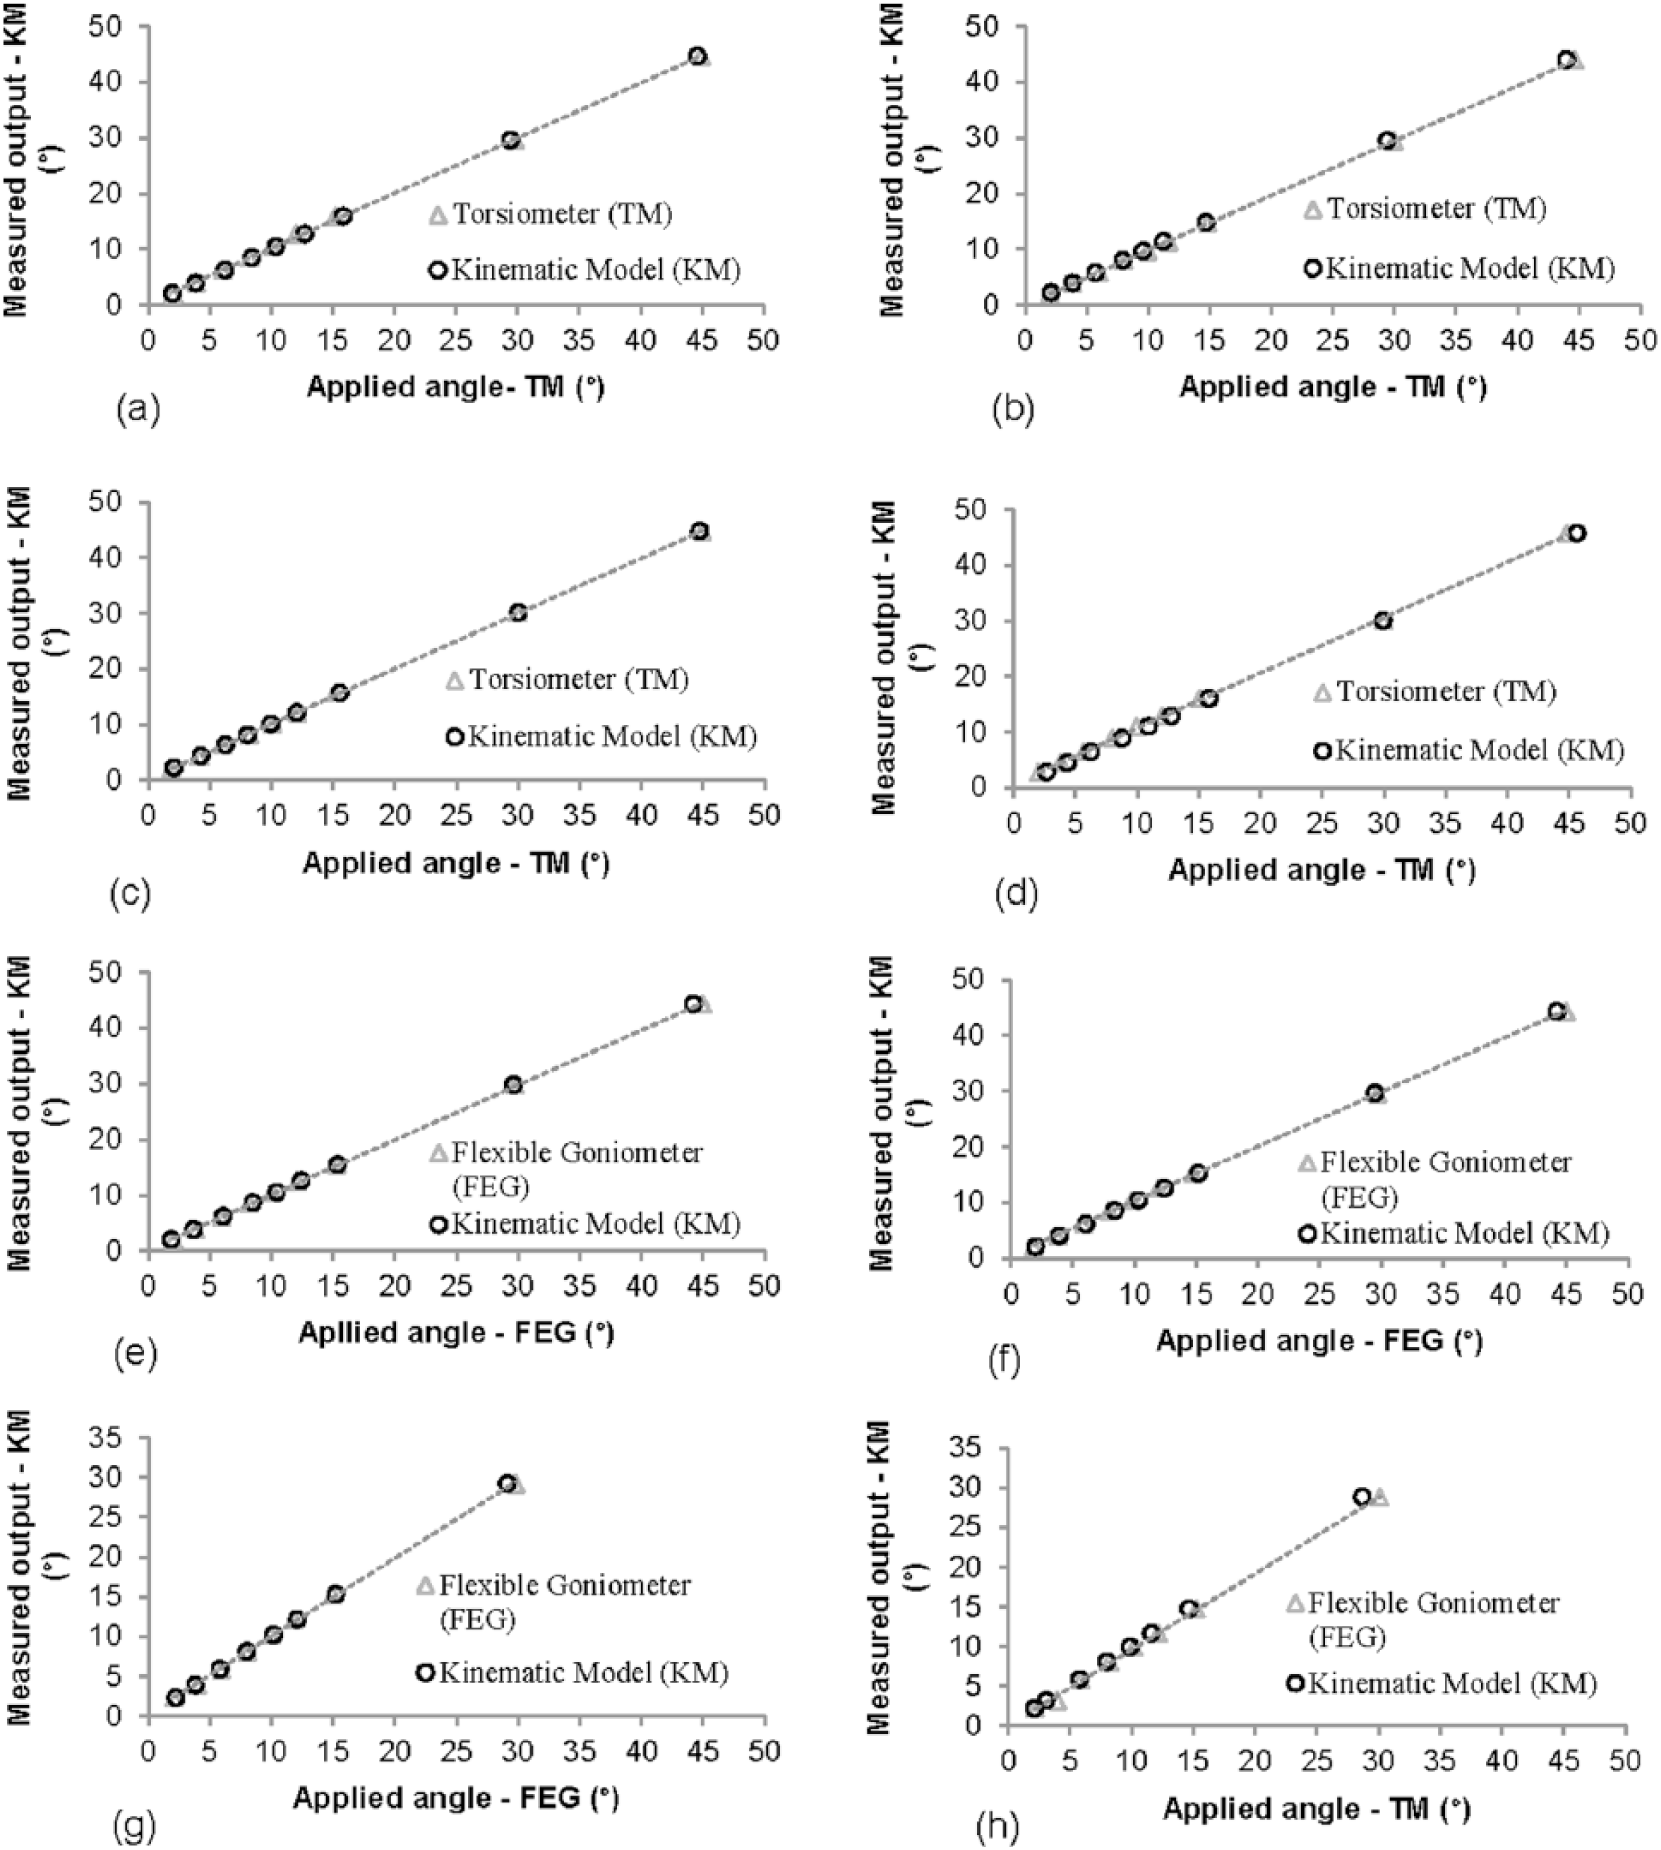
Relationship between the applied angle (TM/FEG) and the measured output (KM) for axial rotation (session 1 – (a) right and (b) left; session 2 – (c) right and (d) left), lateral flexion (session 1 – (e) right and (f) left) and flexion–extension (session 1 – (g) right and (h) left).
3D cluster – application during gait
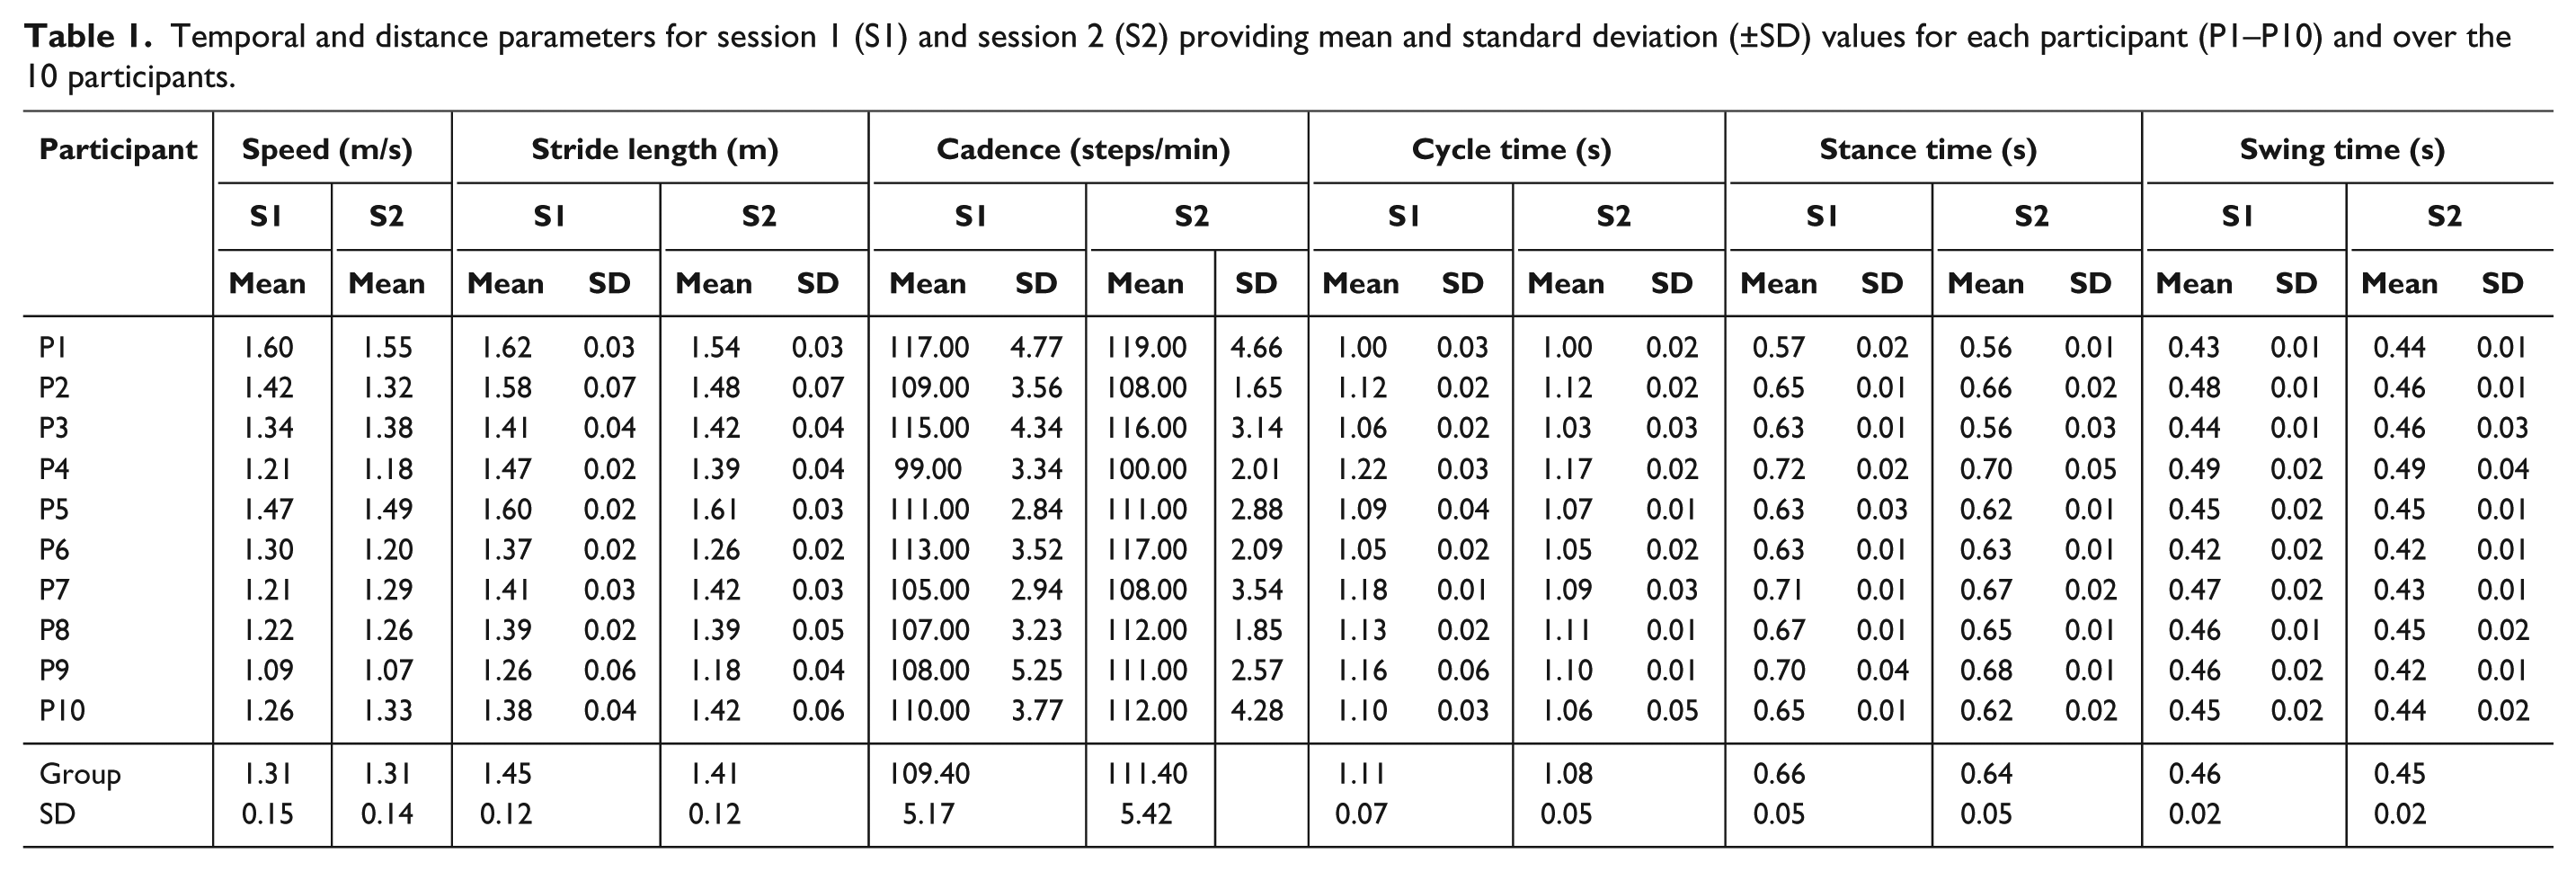
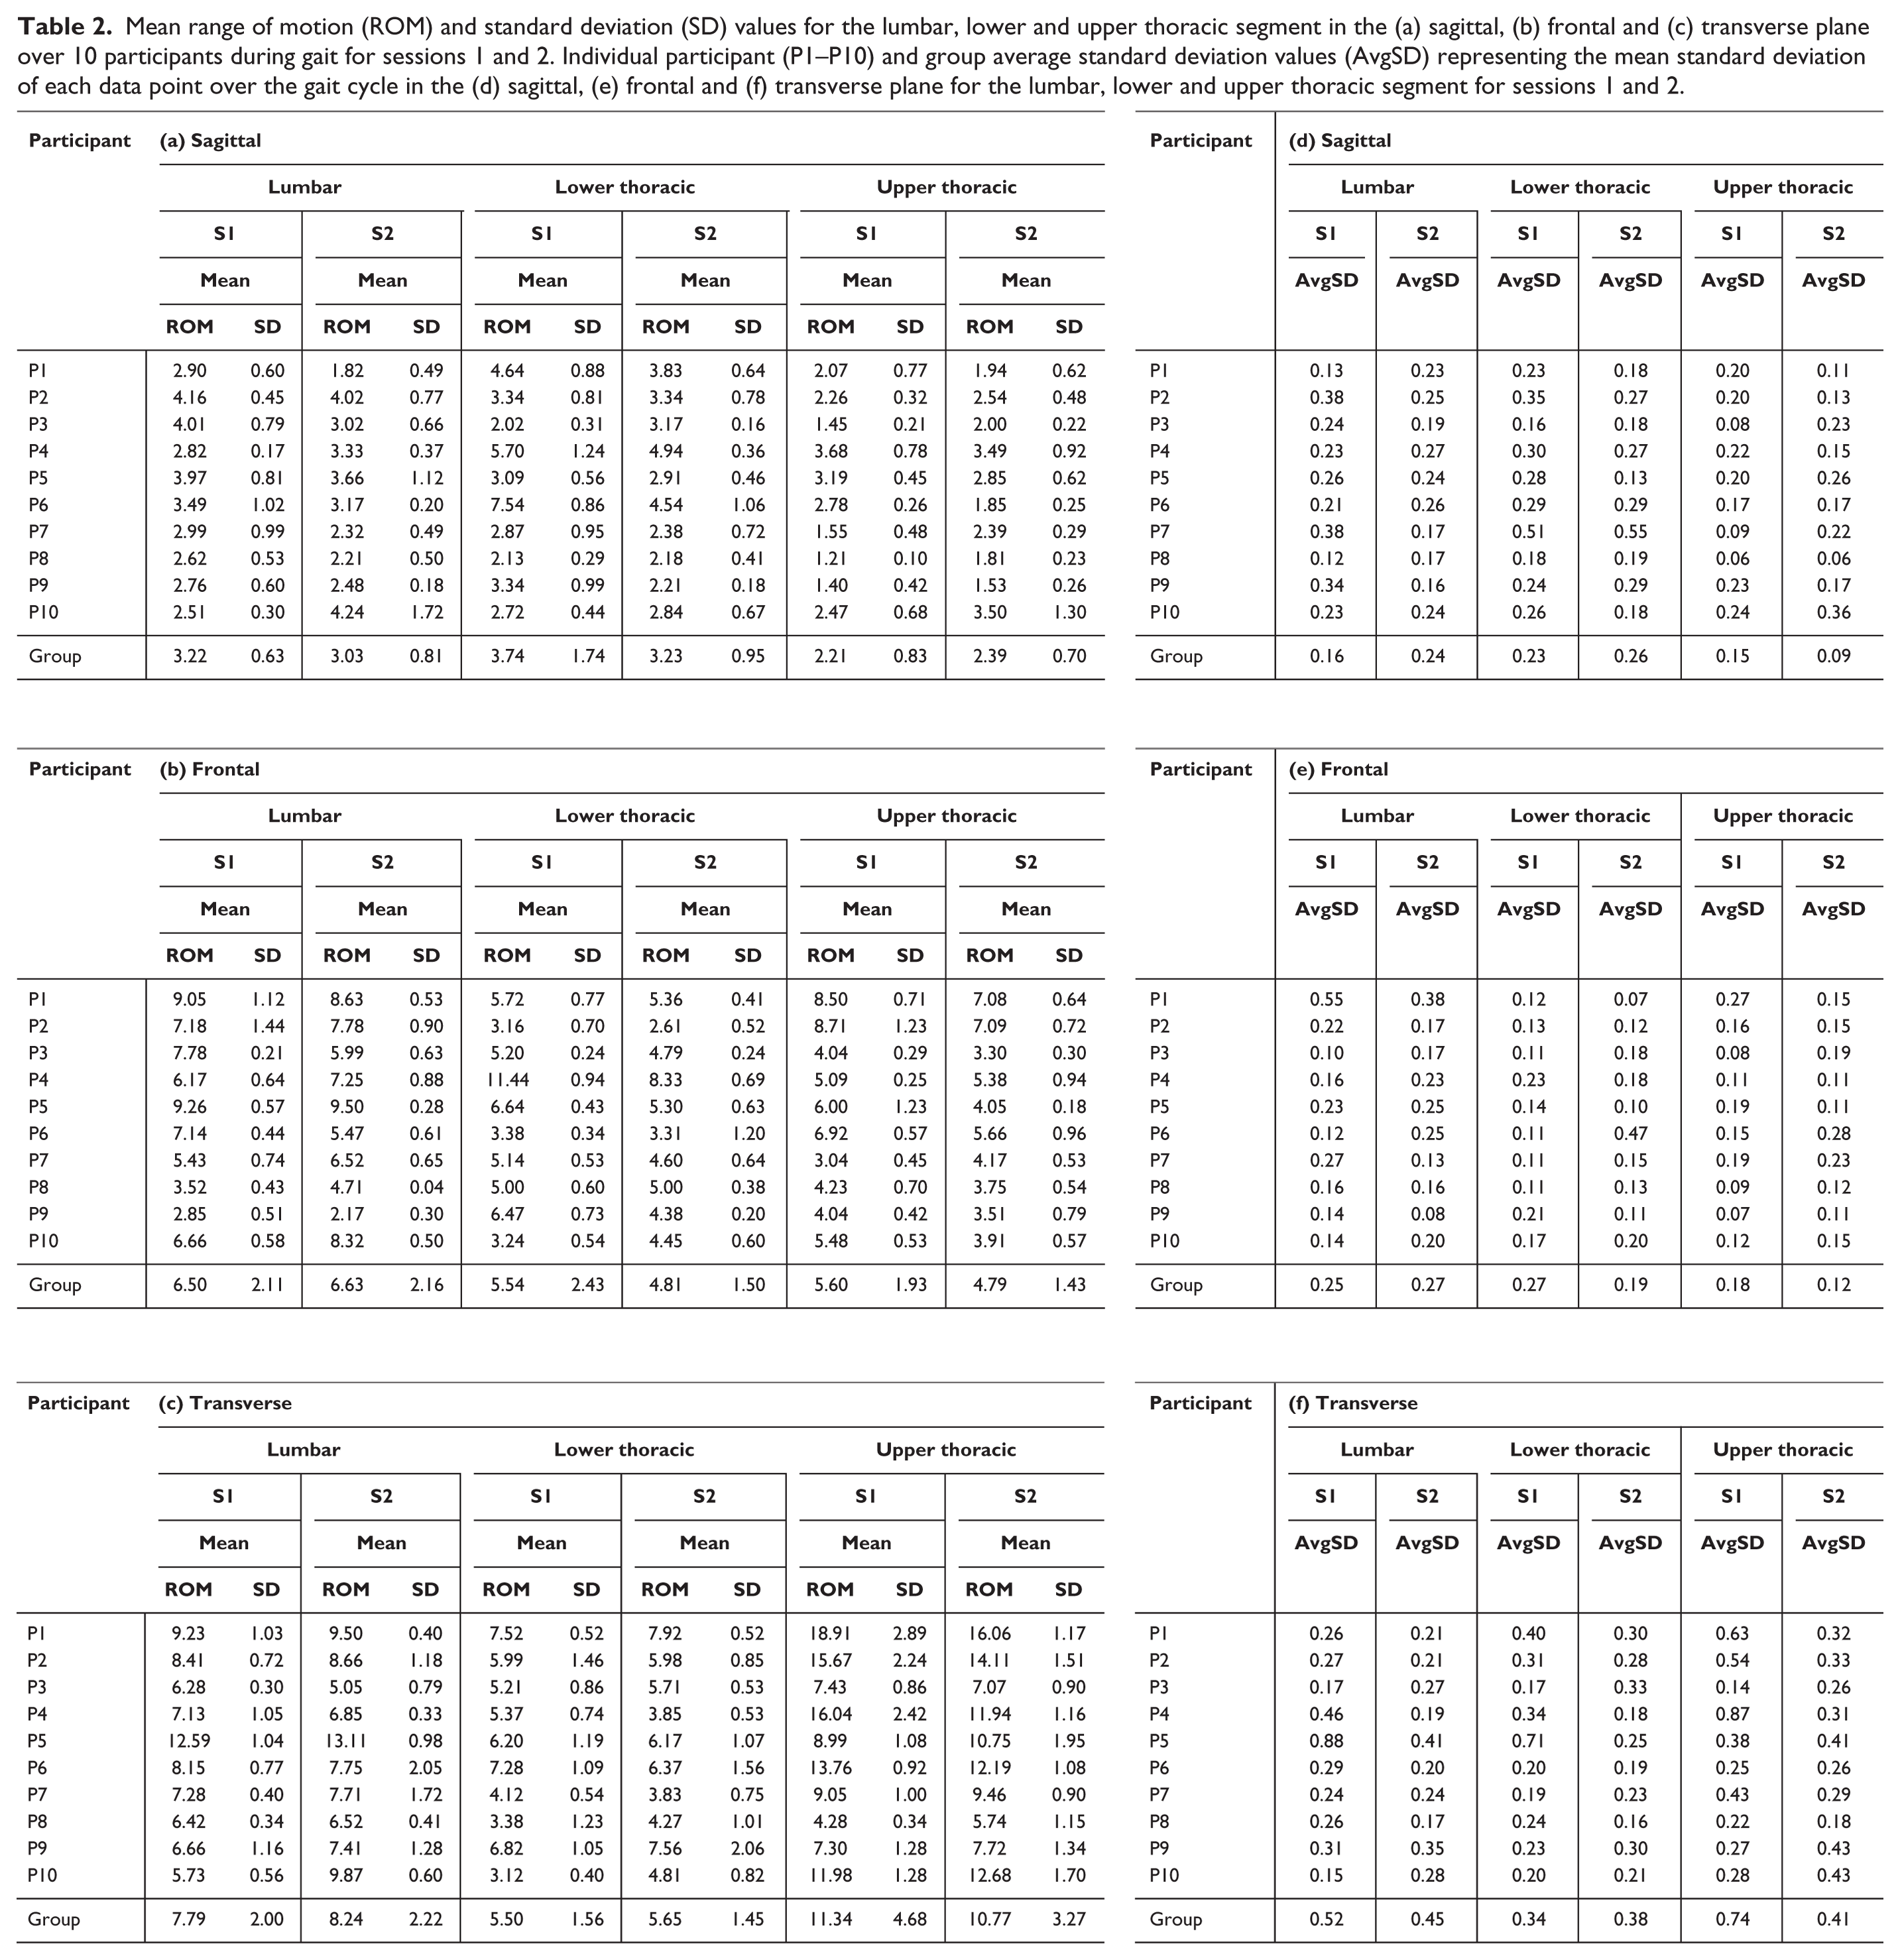
The data was normalised and time scaled to 100% of the gait cycle, from right initial contact to right initial contact. To assist in the interpretation of kinematic waveforms, the phases of gait as defined by Perry and Burnfield 29 were included (IC: initial contact; LR: loading response; MS: mid-stance; PS: pre-swing; swing phase). Table 1 summarises temporal and distance parameters from sessions 1 and 2. Figure 4 provides time-series kinematic waveforms along with the mean difference between sessions 1 and 2 at each point of the gait cycle. Table 2(a to c) represents mean ROM and standard deviation values for the group and individual participants, respectively, for L, LT and UT region during gait. Table 2(d to f) also provides intra-/inter-participant repeatability measures, assessed by the average standard deviation (AvgSD), representative of each standard deviation value for each data point over the gait cycle. 11
Temporal and distance parameters for session 1 (S1) and session 2 (S2) providing mean and standard deviation (±SD) values for each participant (P1–P10) and over the 10 participants.
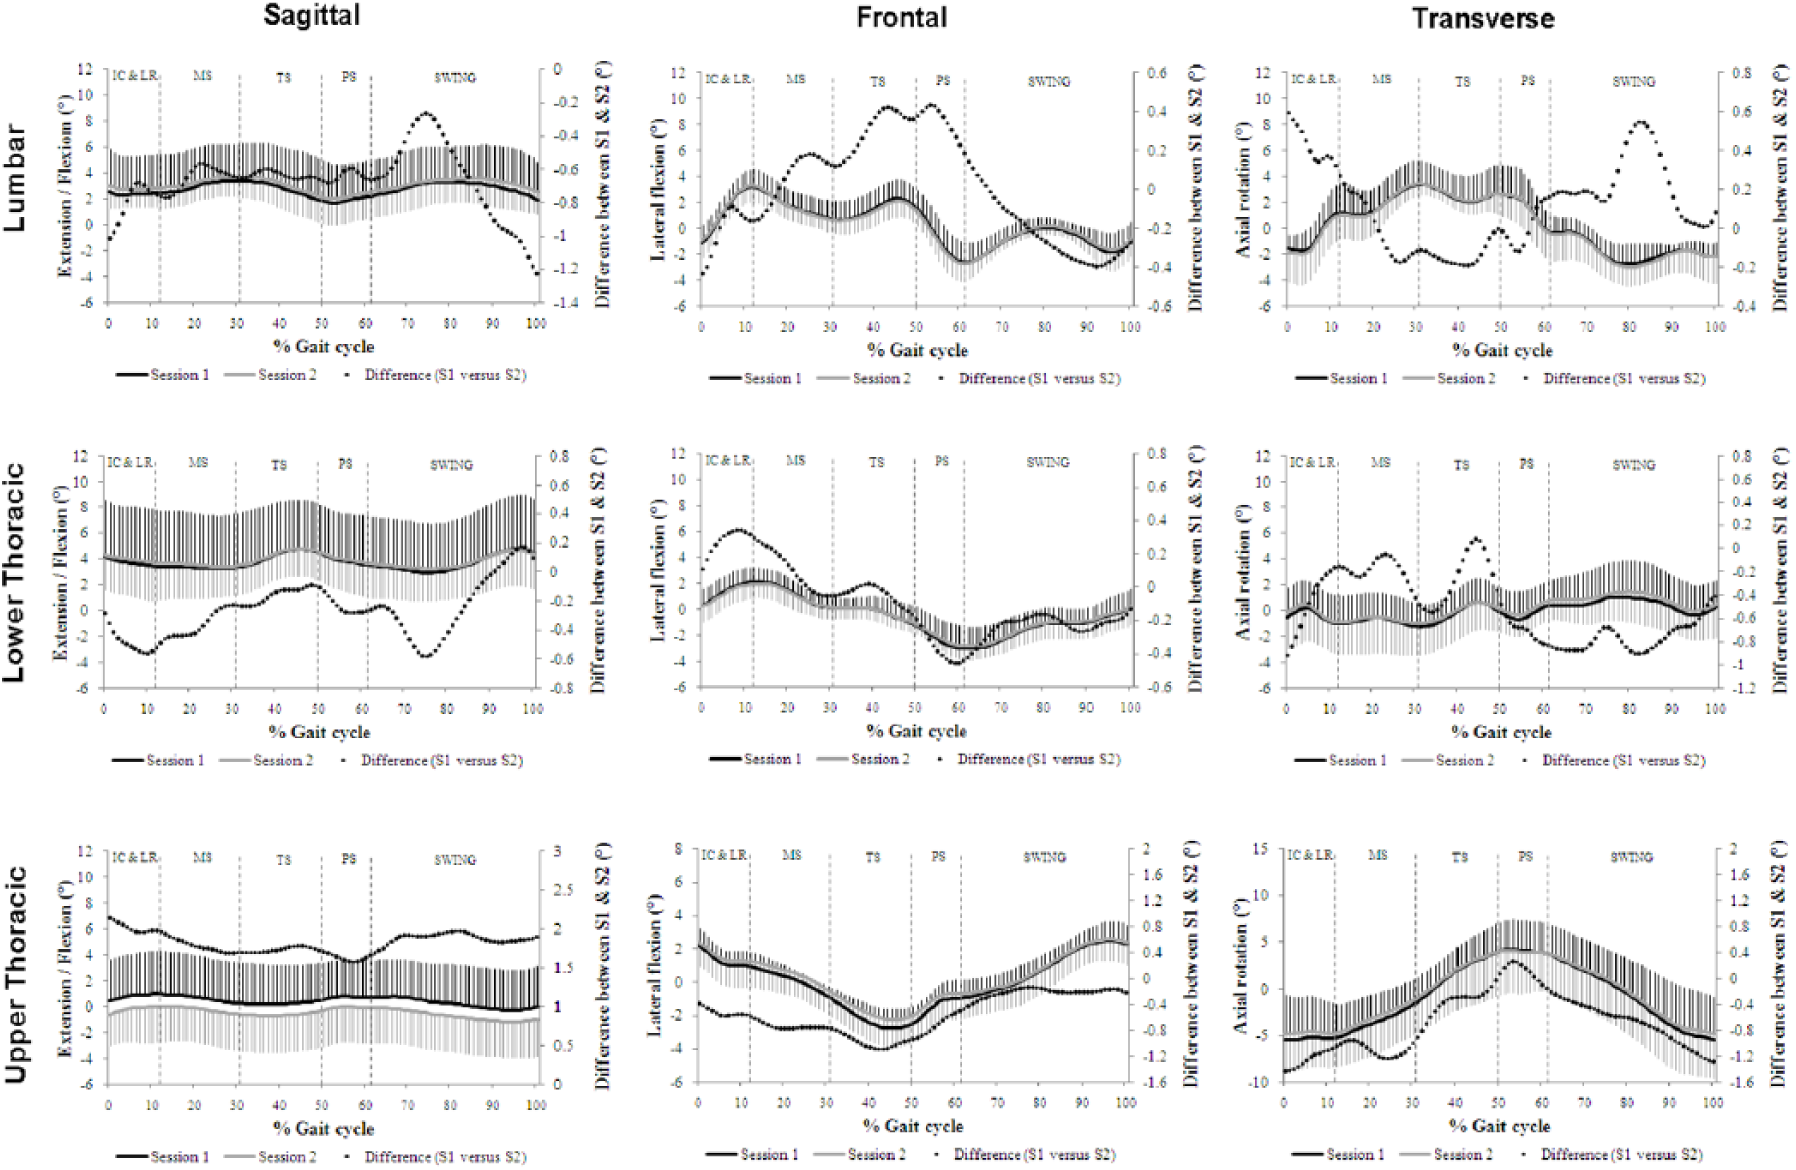
Time-series kinematic waveform data (reference to right vertical axis) for the lumbar segment, lower thoracic segment and upper thoracic segment in the sagittal, frontal and transverse plane represented over 10 participants for session 1 (black solid line) and session 2 (grey solid line).
Mean range of motion (ROM) and standard deviation (SD) values for the lumbar, lower and upper thoracic segment in the (a) sagittal, (b) frontal and (c) transverse plane over 10 participants during gait for sessions 1 and 2. Individual participant (P1–P10) and group average standard deviation values (AvgSD) representing the mean standard deviation of each data point over the gait cycle in the (d) sagittal, (e) frontal and (f) transverse plane for the lumbar, lower and upper thoracic segment for sessions 1 and 2.
Discussion
Kinematic model accuracy and precision
Adopting a similar approach to a previous study 30 for the purpose of validating a kinematic model, Konz et al. 5 built a mechanical frame that replicated the spine and using a manual goniometer, regions of the mechanical spine were positioned at 30° increments to compare an applied angle to an angle output generated from a kinematic model. The authors reported a measurement error of 2°–5° between predetermined angles and angles generated by the kinematic model; therefore, the accuracy and precision of this technique is questionable. Also, investigating increments of 30° is not validating the angles that are experienced during gait. Nevertheless, thoracic and lumbar segment ROM values during gait cited by Konz et al. 5 were found to be consistent with the current literature. The TM and FEG employed in this study offer an alternative approach, allowing data to be analysed to less than a degree, which can be comparable to the angle output from the kinematic model constructed in Visual3D software (values reported to two decimal places). In addition, the TM and FEG not only permit investigation of static trials but also allow for the assessment of dynamic movement. With a reported accuracy of ±1°, 28 the results of this study show the TM and FEG to be an appropriate measure for concurrent validity. The results from part 1 (Figure 3) highlight the accuracy and reliability limits of the proposed kinematic model of this study and are in agreement with previous investigations.20,31
3D cluster – application during gait
With the objective to contribute further knowledge and understanding to the practicality and reliability of using a 3D cluster configuration, this study proposed a new kinematic model to measure 3D movement during gait in the region of T3, T8 and L3. The new multi-segment kinematic spine model presented in this study demonstrated high intra-subject repeatability (Table 2), and although there is noticeable variability in ROM values between participants, it is apparent that participant-specific movements can be tracked reliably between testing session. 11 Differences in temporal and distance parameters (Table 1) between participants combined with a small sample size could attribute to the high inter-participant standard deviation values for several ROM values (Table 2). Moreover, two outliers are revealed in the analysis of the UT segment in the transverse plane (Figure 5(a)): a large ROM exhibited by one participant (black line) and an inappropriate placement of the rig on another participant (black dashed line). Nevertheless, consistent kinematic waveforms presenting mean data from 10 participants and small mean difference values (Figure 4) along with comparable ROM values for each participant (Table 2) further demonstrated high reliability between sessions 1 and 2.
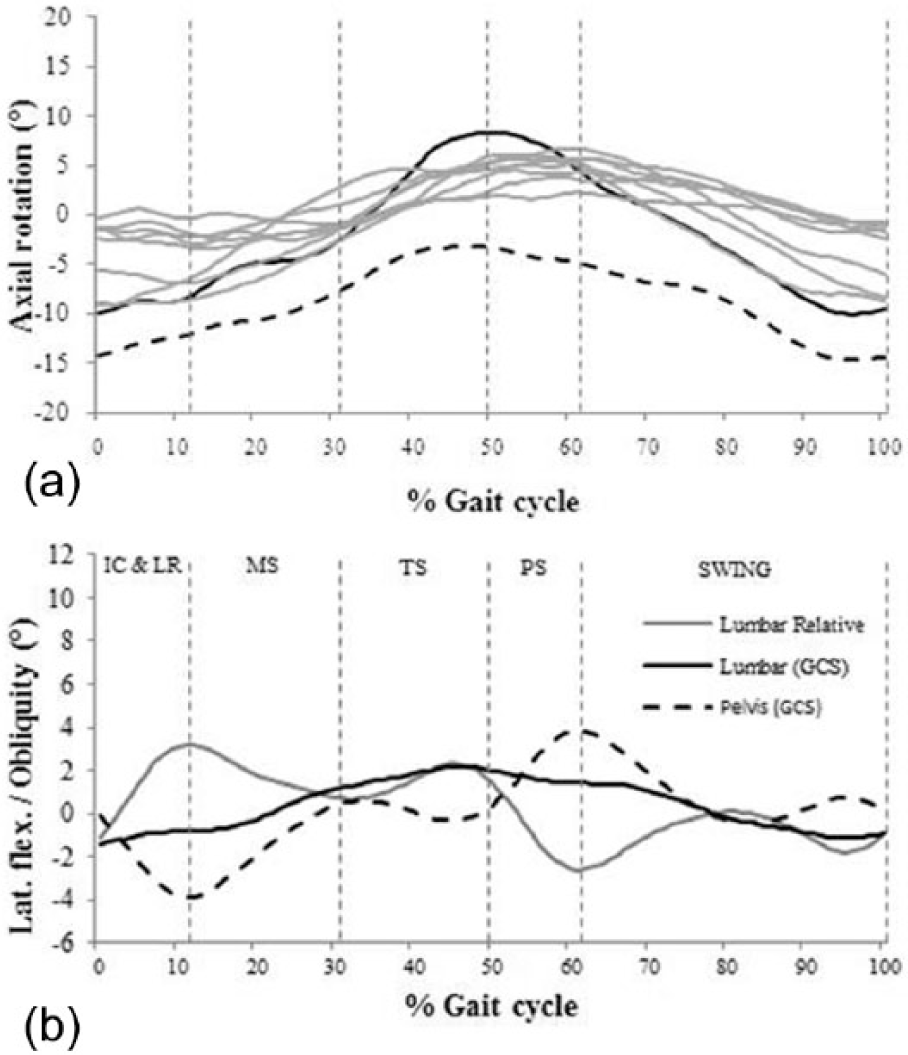
(a) Mean relative UT kinematic waveforms from 10 participants during gait and (b) pelvis and lumbar motion (relative and global) during gait in the frontal plane.
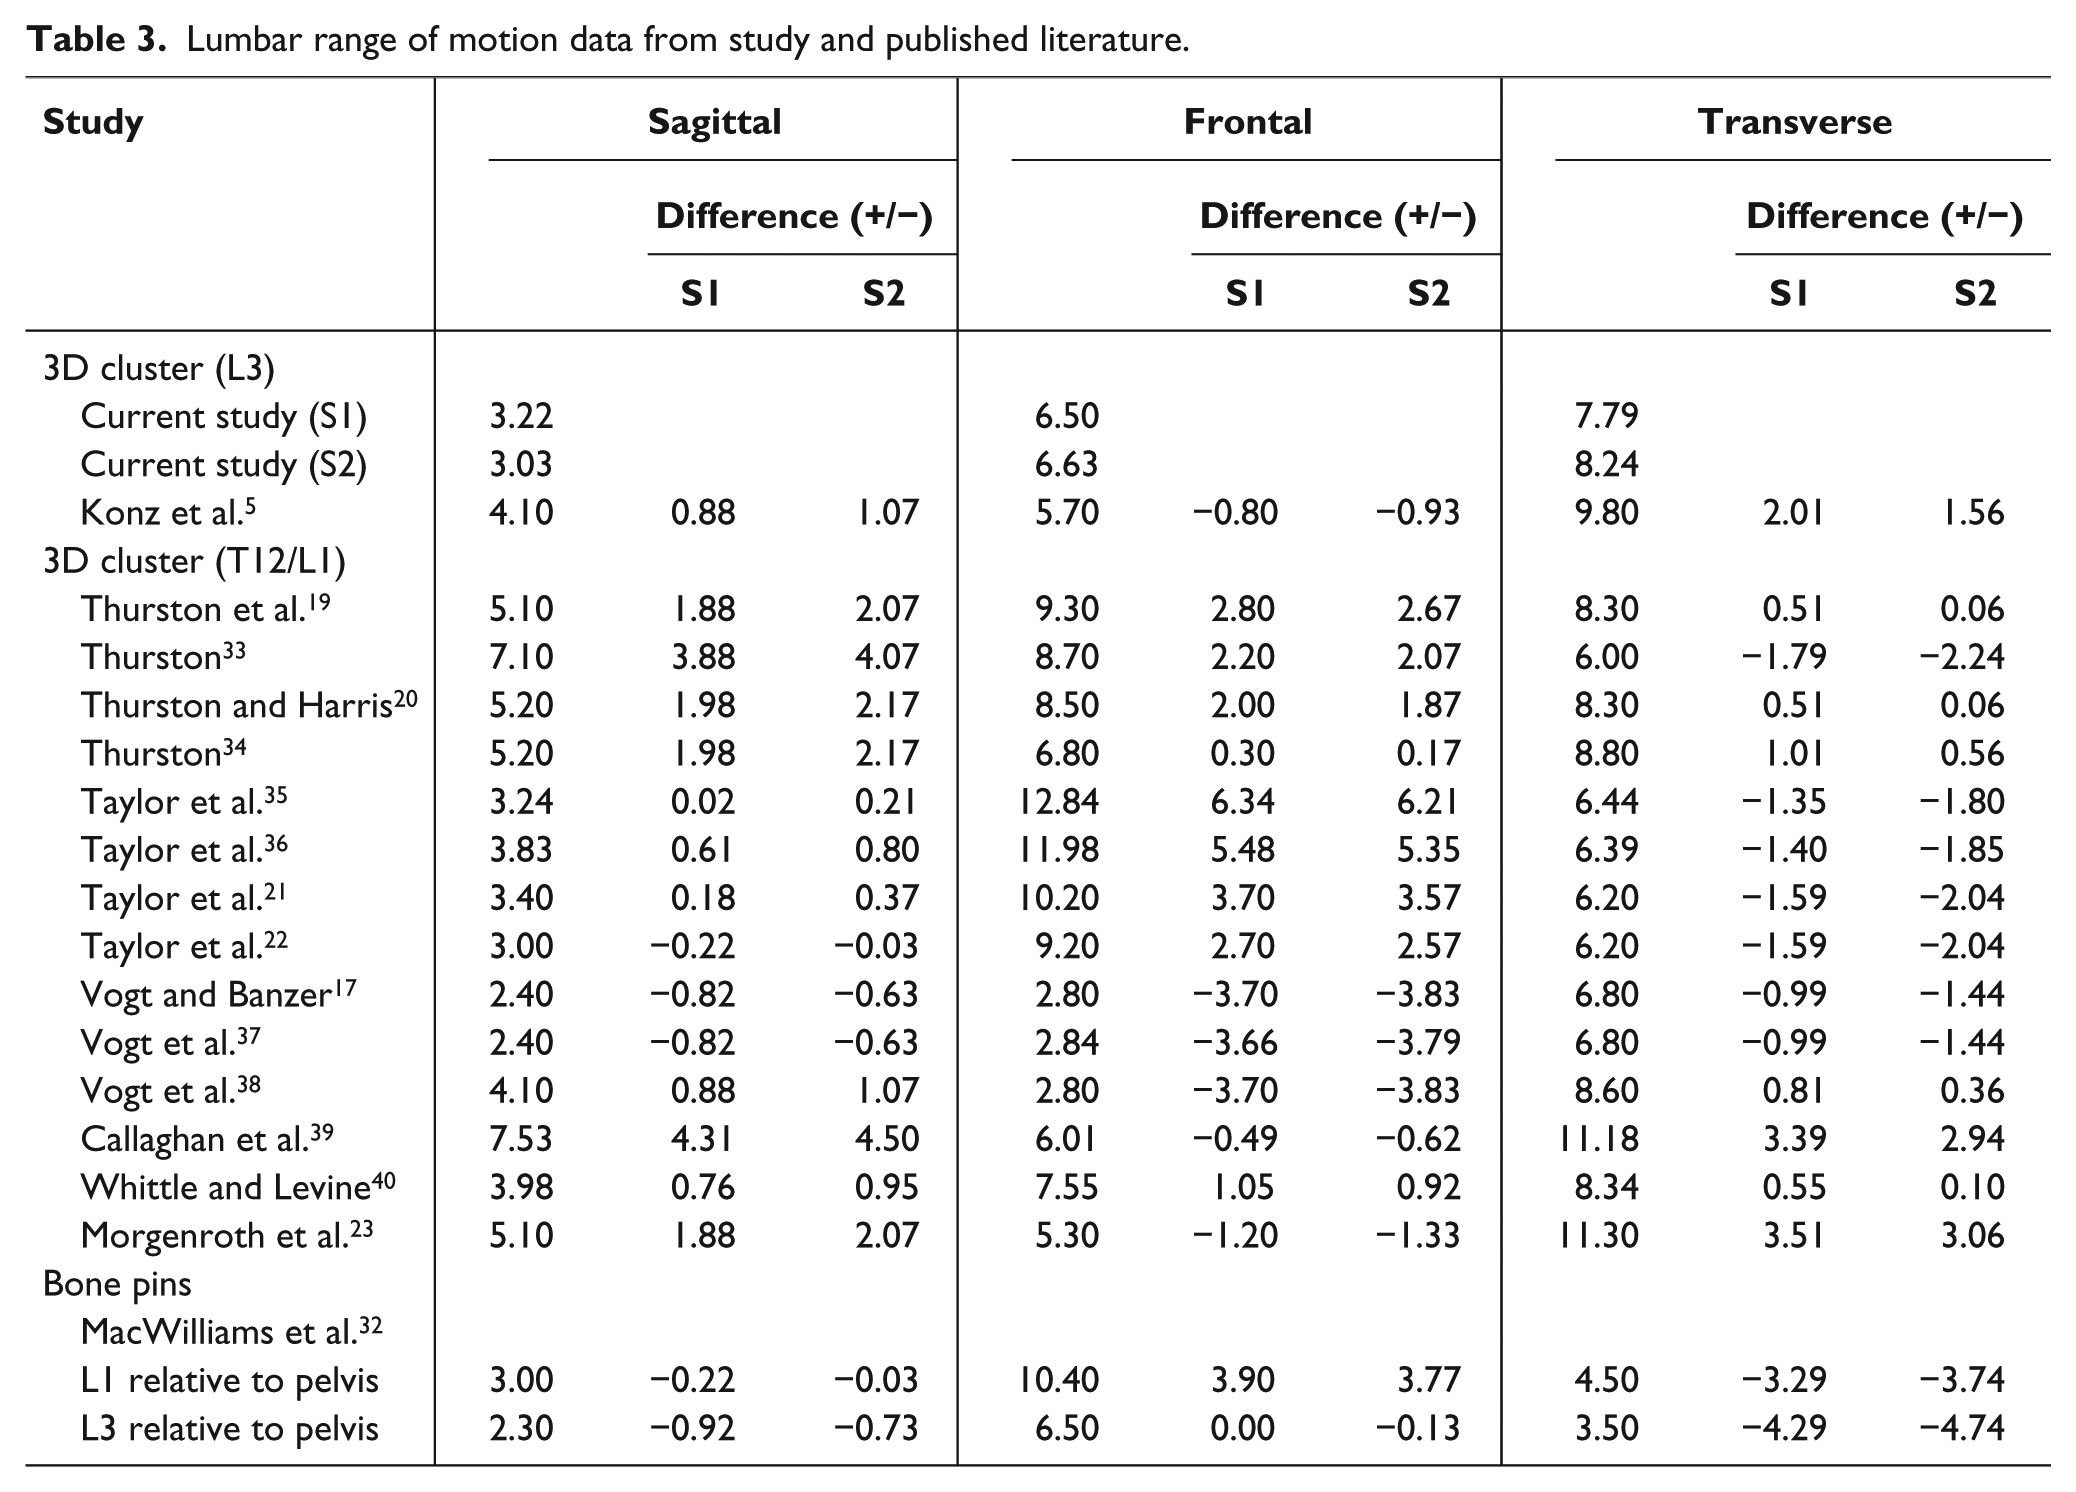
Since this is the first study to report inter-segmental relative rotations of the thoracic spine using a 3D cluster technique, comparisons to previous published literature are not possible. The application of the 3D cluster to understand 3D lumbar motion on the other hand has received considerable attention. Table 3 allows for a comparison of ROM between values available in the published literature to those presented in this study. However, caution is warranted when comparing angle data due to the differences between studies in regard to the construction and application of the 3D cluster. The attachment of the 3D cluster over L3 was an approach taken by this study and that of Konz et al. 5 While contrasting ROM values for the lumbar region exist; Konz et al. 5 did not report relative or global kinematic time-series information. Furthermore, comparative ROM values between this study and those from a study that used bone pins are noted in the sagittal and frontal plane. 32 In this study, similar ROM values were obtained between sessions 1 and 2. These findings support earlier work19–22 by demonstrating the capability of the 3D cluster to gather reliable kinematic data when applied in the same laboratory. However, external research is required to support the application of the 3D cluster technique in clinical practice.
Lumbar range of motion data from study and published literature.
While knowledge of relative movement between segments is important, understanding global kinematic waveforms assists in the explanation of relative data, provides valuable information about segmental dominancy, can assess reproducibility of methodological procedures and allows for a detailed comparison between investigational findings. For instance, in the frontal plane (Figure 5(b)), peak pelvis downward obliquity coincided with peak relative lumbar lateral flexion to the right at approximately 12% of the gait cycle following toe off on the contra-lateral leg, a finding that is in agreement with previous investigations.15,20,40 Subsequently, the pelvis dropped down on the contra-lateral side, while relative motion of the lumbar segment exhibited a lateral flexion towards the weight bearing limb. However, it is evident in this study that the lumbar segment was laterally flexed towards the left in reference to the GCS, which further reveals the dominancy and contribution of the pelvis to relative motion. In contrast, Crosbie et al. 15 found the lumbar segment to be the main determinant of relative motion in comparison to the pelvis, and despite the fact that authors provided relative motion and a ROM value, global frontal plane movement for the lumbar segment was not considered so further interpretation was not possible. In this study, lateral flexion towards the weight bearing limb did not take place until approximately half way through MS. Relative lumbar segment movement underwent a lateral flexion to the right during TS. While this finding is in agreement with Whittle and Levine, 40 the authors provided no reason for the additional relative lateral flexion towards the weight bearing limb at this stage of the gait cycle. In the current study, lumbar movement in reference to the GCS continued to flex laterally to the right at the start of TS, with peak relative lumbar movement corresponding to peak movement in reference to the GCS, and the reason for the second peak in right lateral lumbar flexion.
The results of this study were based on the application of 3D clusters by one examiner; therefore, a future investigation involving multiple examiners is needed to further examine the reliability of the proposed marker configuration. In addition to this, the effect of the plate and its relationship to the back could be investigated. However, while it is accepted that pelvis and lumbar global angular data could have been influenced by soft tissue artefact, ROM values presented in Table 2 are consistent with those previously reported. 5 Finally, the angular kinematic data in this study was collected from a small sample size, so additional participants are required to confirm the findings of this study along with the analysis of female and clinical populations.
Conclusion
This study proposed validity and reliability measures of a new kinematic model developed to assess regional movement of the spine using a 3D cluster technique. The applied marker configuration demonstrated inter-segmental movement of the thoracic spine, suggesting that this region of the spine should not be modelled as a single rigid segment. 3D movement analysis of the lumbar movement compared well to previously published data; however, supportive evidence is lacking as previous investigations provide only ROM values or relative kinematic waveforms and ROM. Conversely, as shown in the findings of this study, global movements provide valuable information on the interpretation of relative angle data.
Footnotes
Author contribution
All the authors contributed equally in the preparation of this manuscript.
Declaration of conflicting interests
The authors report no conflict of interest.
Funding
This research received no specific grant from any funding agency in the public, commercial or not-for-profit sectors.