
Abstract
Background:
T44 sprinting with an amputation is still in a state of relative infancy. Future scope for athletic training and prosthetic limb development may be assisted with a better understanding of information derived from T44 athletes when under race-based conditions.
Objectives:
To investigate the behaviour of step count and step frequency when under competitive conditions.
Study design:
The study comprises two elements: (1) a video-based analysis of race-based limb-to-limb symmetry and (2) a video-based analysis of race-based step count.
Methods:
Video analysis of several major events from 1996–2012 are assessed for step count and step limb-to-limb symmetry characteristics.
Results:
The video analysis highlights limb-to-limb imbalances greater than those indicated in the previous literature. A low step count is determined to be desirable for success in the 100-m event.
Conclusion:
Future analysis of athletes with a lower-limb amputation would be worthwhile when placed under race-based conditions as the limb-to-limb behaviour is more exaggerated than those seen in typical studies held within a laboratory setting. The within-event behaviour of step counts requires further investigation to establish where these take place or whether it is a cumulative step length issue.
Clinical relevance
This article increases the understanding of the race-based behaviour of amputee athletes and provides more information to contribute to any discussions on the performance of lower-limb prostheses.
Background
The purpose of lower-limb prostheses is to help a user maintain a full and active lifestyle. 1 This assistive technology is also used under extreme loads and conditions in elite sports competition. 2 It has been suggested that to break any plateaus in sporting performance, greater improvements in the future will be driven by revolutions in sports technology rather than athletic performance. 3 As a result, a greater understanding of such technology is worthwhile so as to improve its design and function.
Competitive amputee sprinting is still in a state of relative infancy and has been previously evaluated.4–6 This has more recently been driven by controversy surrounding the prosthetic limbs functional contribution.7,8 However, the limitation of these studies is that it is not known how athletes with an amputation behave under actual competitive conditions. Such environments may alter an athlete’s behaviour due to the level of emotional stress or the inability to cope. 9 It has been suggested that it is beneficial to ascertain if conditions simulated in the laboratory actually reflect those in real life, 10 and this is of concern in sport with a disability. 11 This is known as the pursuit of ecological validity. 10
The pursuit leading to ecological validity is the need for context- or event-specific data. 11 In track athletics, this can be achieved through the analysis of race-based footage of athletes. 12 The limitations of using race footage to form conclusions are its limited availability or subsequent quality. Even then, only an athlete’s stride count and characteristics can be evaluated rather than the primary key performance indicators of sprinting such as ground reaction force. 13 This aside, lower-limb symmetry has been remarked as desirable in running gait 4 although this has been assumed in the previous literature. 14 Biomechanical asymmetry has been shown to exist in amputee running5,6 and has been indicated to be affected by the level of disability and the prosthesis employed. 15 In trans-tibial amputee sprinting, there have been observations that typical asymmetry exists in stance or swing-phase ratios and for step lengths. 16 It would be beneficial to provide further evidence of limb-to-limb behaviour observed from race-based conditions to see whether such imbalances are noticeably distinctive to those reported in laboratory-based studies.
Methods
To assess running with a lower-limb amputation under race-based conditions, race-based HDTV (high-definition television) footage is used. Athletes’ step count and step limb-to-limb symmetry are evaluated.
Television-based footage utilises the best field of vision and recall of an event that would be more difficult to undertake as an observer. The footage used for this study was derived from public domain sources including Paralympics TV (http://www.paralympic.org/Videos) via Youtube (www.youtube.com).
There are three competitive running distances that occur in the current Paralympic Games format. These events are the 100, 200 and 400 m running distances. However, the issue with such events (and its subsequent footage) is that due to the switch between and panning of multiple video cameras, the same athletes do not always remain in shot or in clear view. This makes any assessment of their stride characteristics problematic. The only event which minimises such issues is the 100-m sprint event. As a result, the male T44/43 100-m event was investigated in this study.
The selected video footage was checked to ensure that its televised recording speed was the same as the actual events’ results. It was also evaluated for its visual quality to allow clarity of an athlete’s ground impact. The footage was then imported into the Quintic Biomechanics 9.0 software (Quintic Consultancy Ltd, Coventry, United Kingdom) which allowed frame-by-frame evaluation at the footage’s maximum specification of 0.04-s increments (25 frames/s).
The analysis in this study is split into two investigations. The first investigates step count and the second step symmetry. All athletes’ names and performances are a matter of public record.
Step count
When reviewing the footage to assess step count, the numbers of steps taken in the footage (by as many athletes who remain in the shot for its duration) are recorded to achieve the 100-m race distance. As the step count to achieve the 100 m is never exact, the number of steps judged closest to the actual finish line is taken as the measured value.
The four events and its source evaluated for step count were the following:
1996 Paralympic Games T44/T43 100 m Final (http://www.youtube.com/watch?v=WYxBWIY8iYc);
2008 Paralympic Games T44/43 100 m Final (http://www.youtube.com/watch?v=UDDhZx54Jy4);
2011 IPC World Athletics Championships T44/43 100 m Final (http://www.youtube.com/watch?v=LTxypZ71-30);
2012 Paralympic Games T44/43 100 m Final (http://www.youtube.com/watch?v=mcdUsMULNzo).
Step timing symmetry
While several videos were found to be available, only seven pieces of race-based video footage had the visual resolution it was felt to be examined in close enough detail to evaluate the footfall behaviour. Of these, four pieces of footage were of qualification heats of both the 2008 and 2012 Paralympic Games. In these, it was seen that several athletes intentionally slowed down before the finish line. This meant their stride would sometimes be seen to visibly slow down or shorten in stride length towards the end of an event. This made such data not representative of the event’s maximal effort and was therefore rejected from this study. In addition, the athlete’s reaction time to the starting pistol could not be confidently evaluated as this exact moment was not within the unit of measurement of the analysis software or the video footage.
The three suitable races evaluated for step frequency and symmetry were the following:
2008 Paralympic Games T44/43 100 m Final (http://www.youtube.com/watch?v=UDDhZx54Jy4);
2011 IPC World Athletics Championships T44/43 100 m Final (http://www.youtube.com/watch?v=LTxypZ71-30);
2012 Paralympic Games T44/43 100 m Final (http://www.youtube.com/watch?v=mcdUsMULNzo).
When reviewing the footage, a definition of ground impact was required to define when a ground step–based impact had taken place. A ground impact was determined whereby the foot is seen to contact the ground just prior to the lower-limb beginning to bend at the knee and the prosthesis is seen beginning to compress.
The greatest possible error of the video footage evaluation is defined as half of the measurement unit. Therefore, potential errors in the step symmetry data are 0.02 s. The tolerance interval (or margin of error) is defined as ±0.02 over the established measurements. However, due to the conceded large imprecision of the video analysis process, the largest error possible is defined here as one measurement increment of ±0.04. Therefore, only a large and distinct change of greater than ±0.04 from the previous data point is proposed to be significant in this study to then be defined as lower-limb asymmetry. It is conceded that such a large tolerance interval could be criticised since the method lacks the precision and accuracy seen in traditional laboratory-based studies. However, the value of this study is to investigate the step-to-step behaviour in a race-based environment and therefore contributes to the ecological validity. To date, this has not been evaluated in this area.
The athletes were classified as having three types of lower-limb behaviour. These are designated as lower-limb-to-limb symmetry (LS), lower-limb-to-limb asymmetry (LA) and random-event asymmetry (RA). LS is defined as a limb-to-limb timing within the measurement precision. LA is defined as a consistent limb-to-limb timing imbalance of greater than 0.04 s. RA is considered a single event limb-to-limb timing imbalance of larger than 0.04 s.
Results
Step count
The recorded step count data are shown in Figure 1.
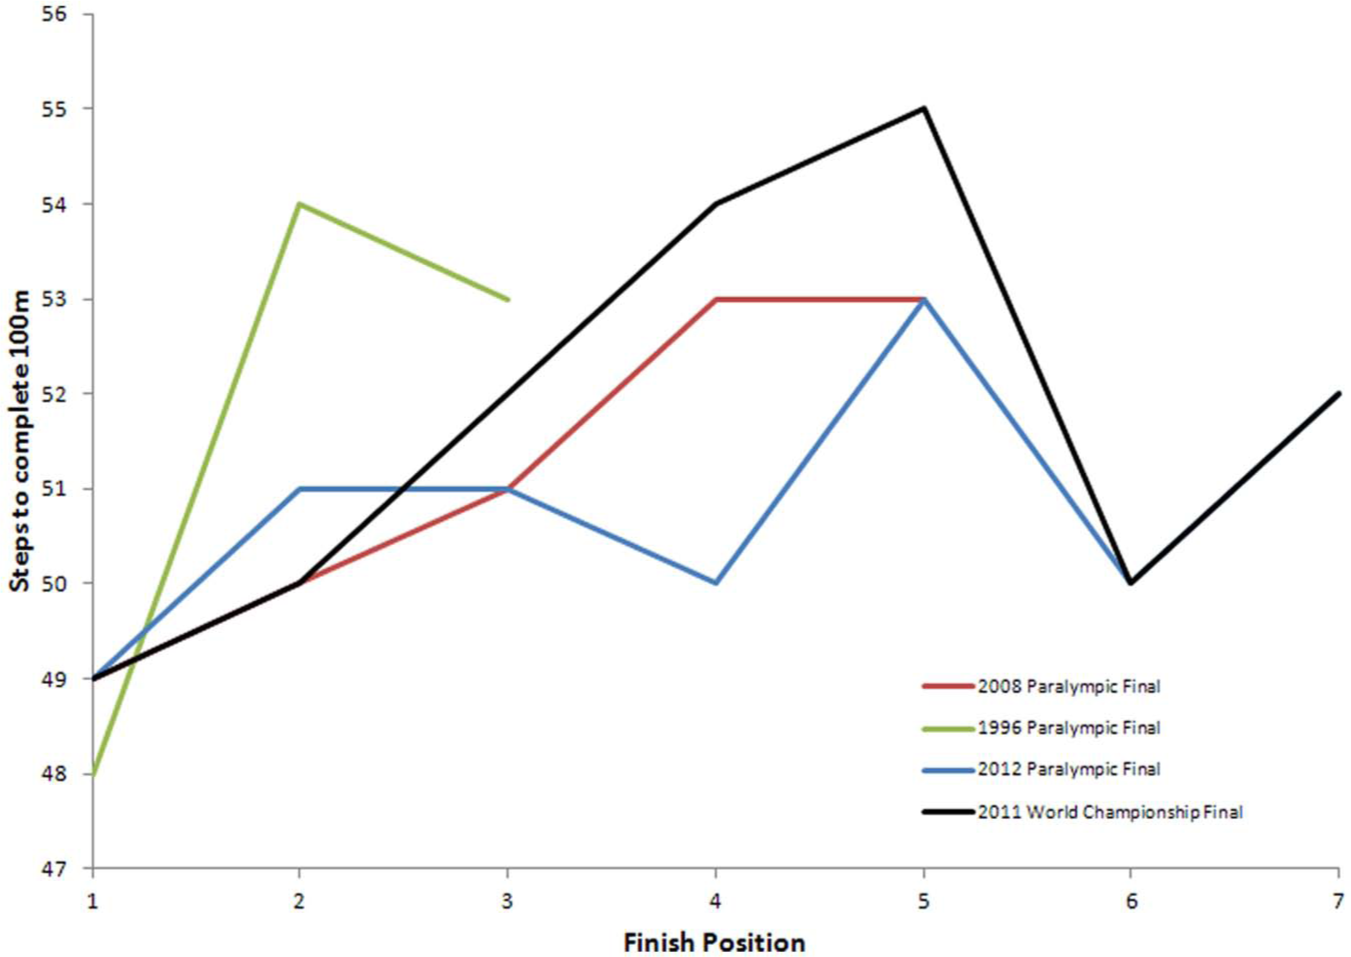
The 100-m T44/43 step count data.
It can be seen that in the race footage samples, typically the lowest step count is desirable to achieve the best possible finishing position. An event based winner typically takes no more than 49 steps. The 2nd and 3rd place medal winners in this race typically produced one step less than its winner. Interestingly, some slower runners in both 2011 and 2012 also exhibited a low step count yet performed poorly.
Step symmetry
When reviewing the footage, three athletes in the 2008 event, six from 2011 and four from 2012 gave an appropriate level of visibility for their races and were therefore included in the results.
The three athletes’ lower-limb-to-limb timing footfalls in 2008 are shown in Figure 2.
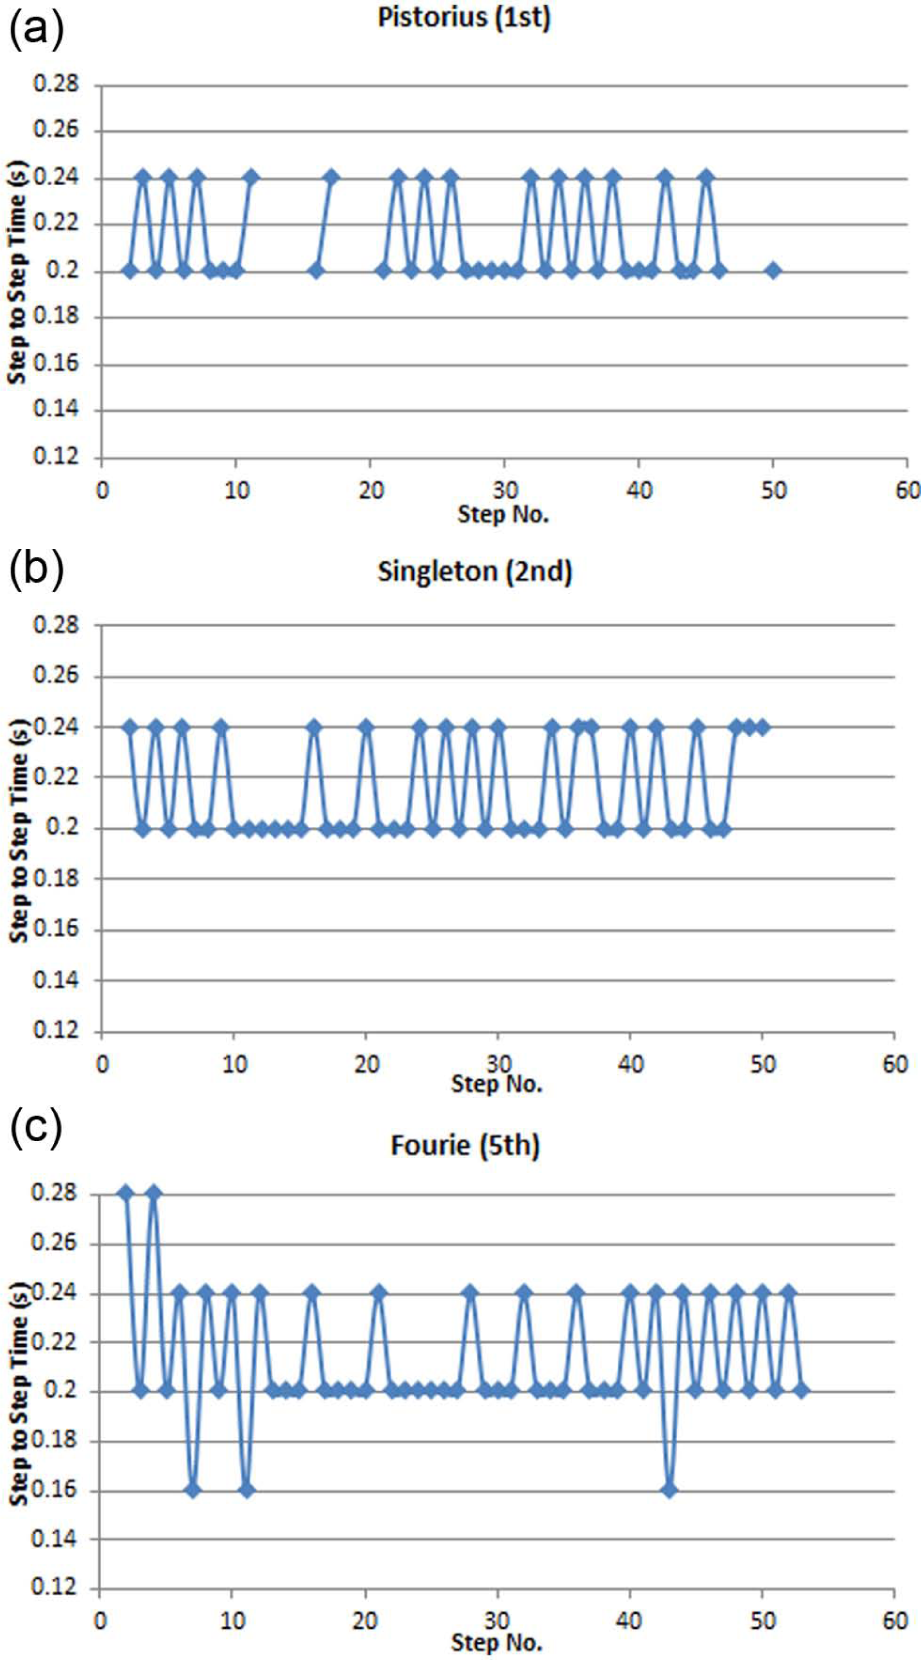
The 2008 World Championships athlete gait symmetry summaries for athletes: (a) Pistorius, (b) Singleton and (c) Fourie.
Figure 2 illustrates the time taken from the foot’s ground impact to the alternate foot’s impact upon the track. Both Pistorius and Singleton exhibited a lower-limb symmetry within the acceptable tolerance range of the study. However, Fourie demonstrated significant step-to-step RA in the first few strides of his race. It took him four steps to reduce to a more typical level of LS seen with the other athletes. Fourie’s mid-section of his race shows an extremely symmetrical period of limb-to-limb timing. Singleton demonstrated relatively consistent LS during his event. However, the last three steps of his event were slightly slower in duration.
The six runners from the 2011 World Championships are shown in Figure 3.
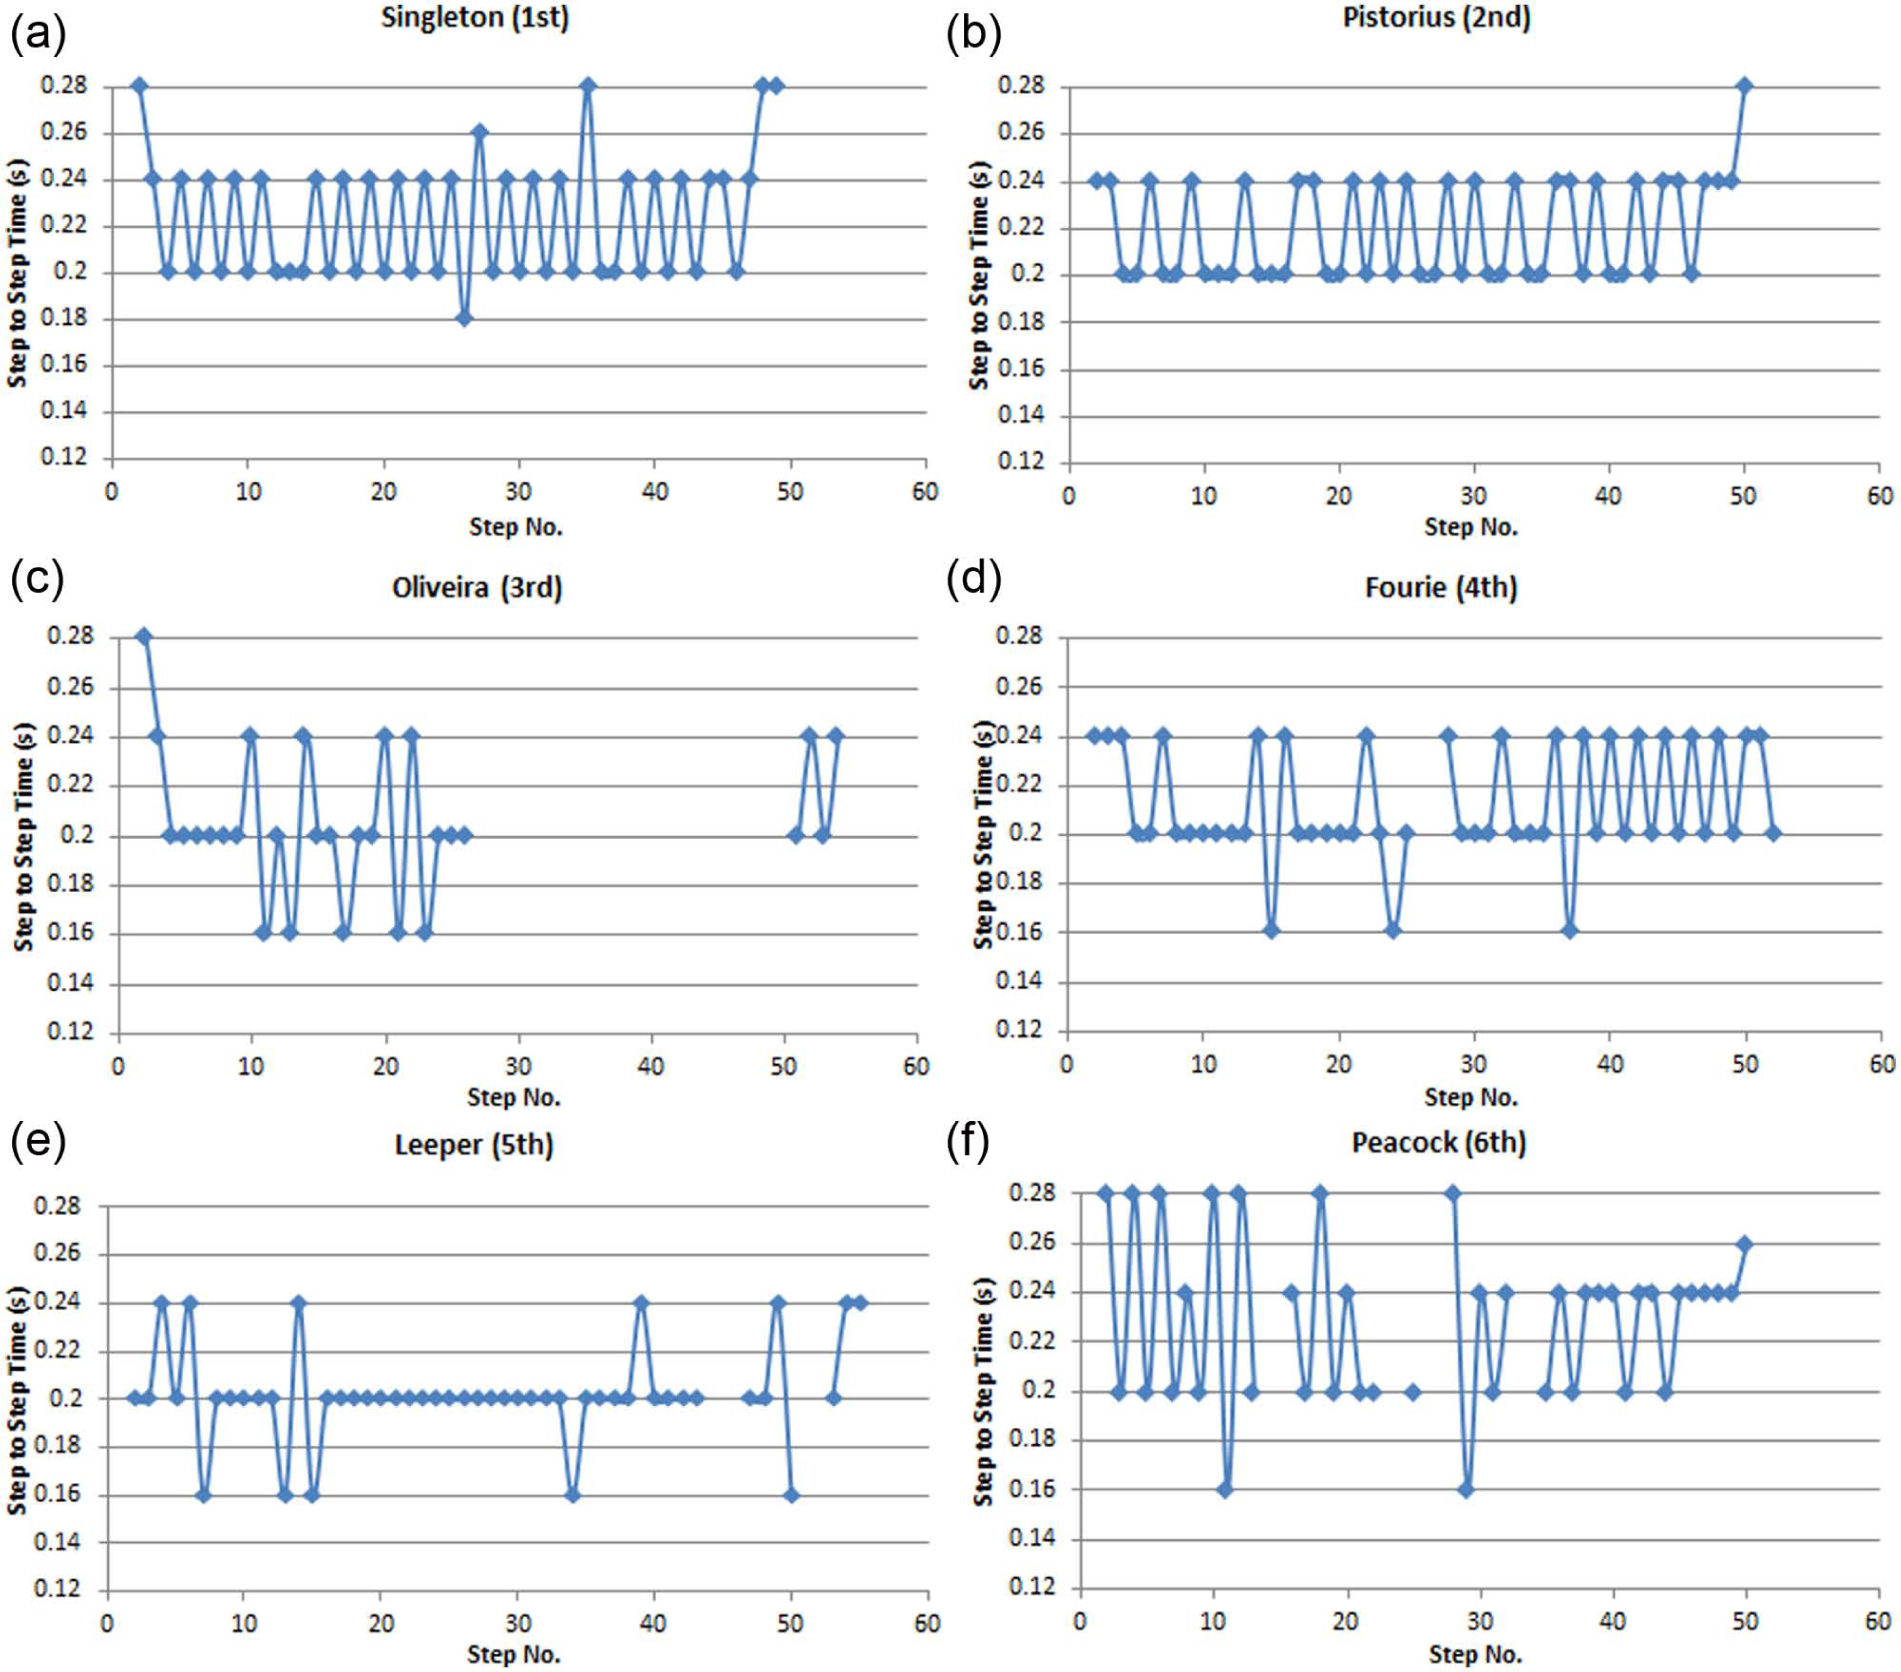
The 2011 World Championships athlete gait cycle symmetry summaries for athletes: (a) Singleton, (b) Pistorius, (c) Oliveira, (d) Fourie, (e) Leeper and (f) Peacock.
In this event, it can be seen that bi-lateral amputees Pistorius (second) and Leeper (fifth) exhibit very high levels of lower-limb symmetry. Singleton has brief RA at the start and again with his finish. Oliveira’s run was only visible for the first-half of the event. This aside, he exhibited RA at his start and sporadically throughout the first-half of the event. Pistorius had relative LS, but his last stride saw a one-off RA. Peacock had extremely consistent initial LA until the latter part of the race, whereby his gait reflected LS.
At the 2012 Paralympic Games, four athletes produced clear line of sight for evaluation. These are summarised in Figure 4.
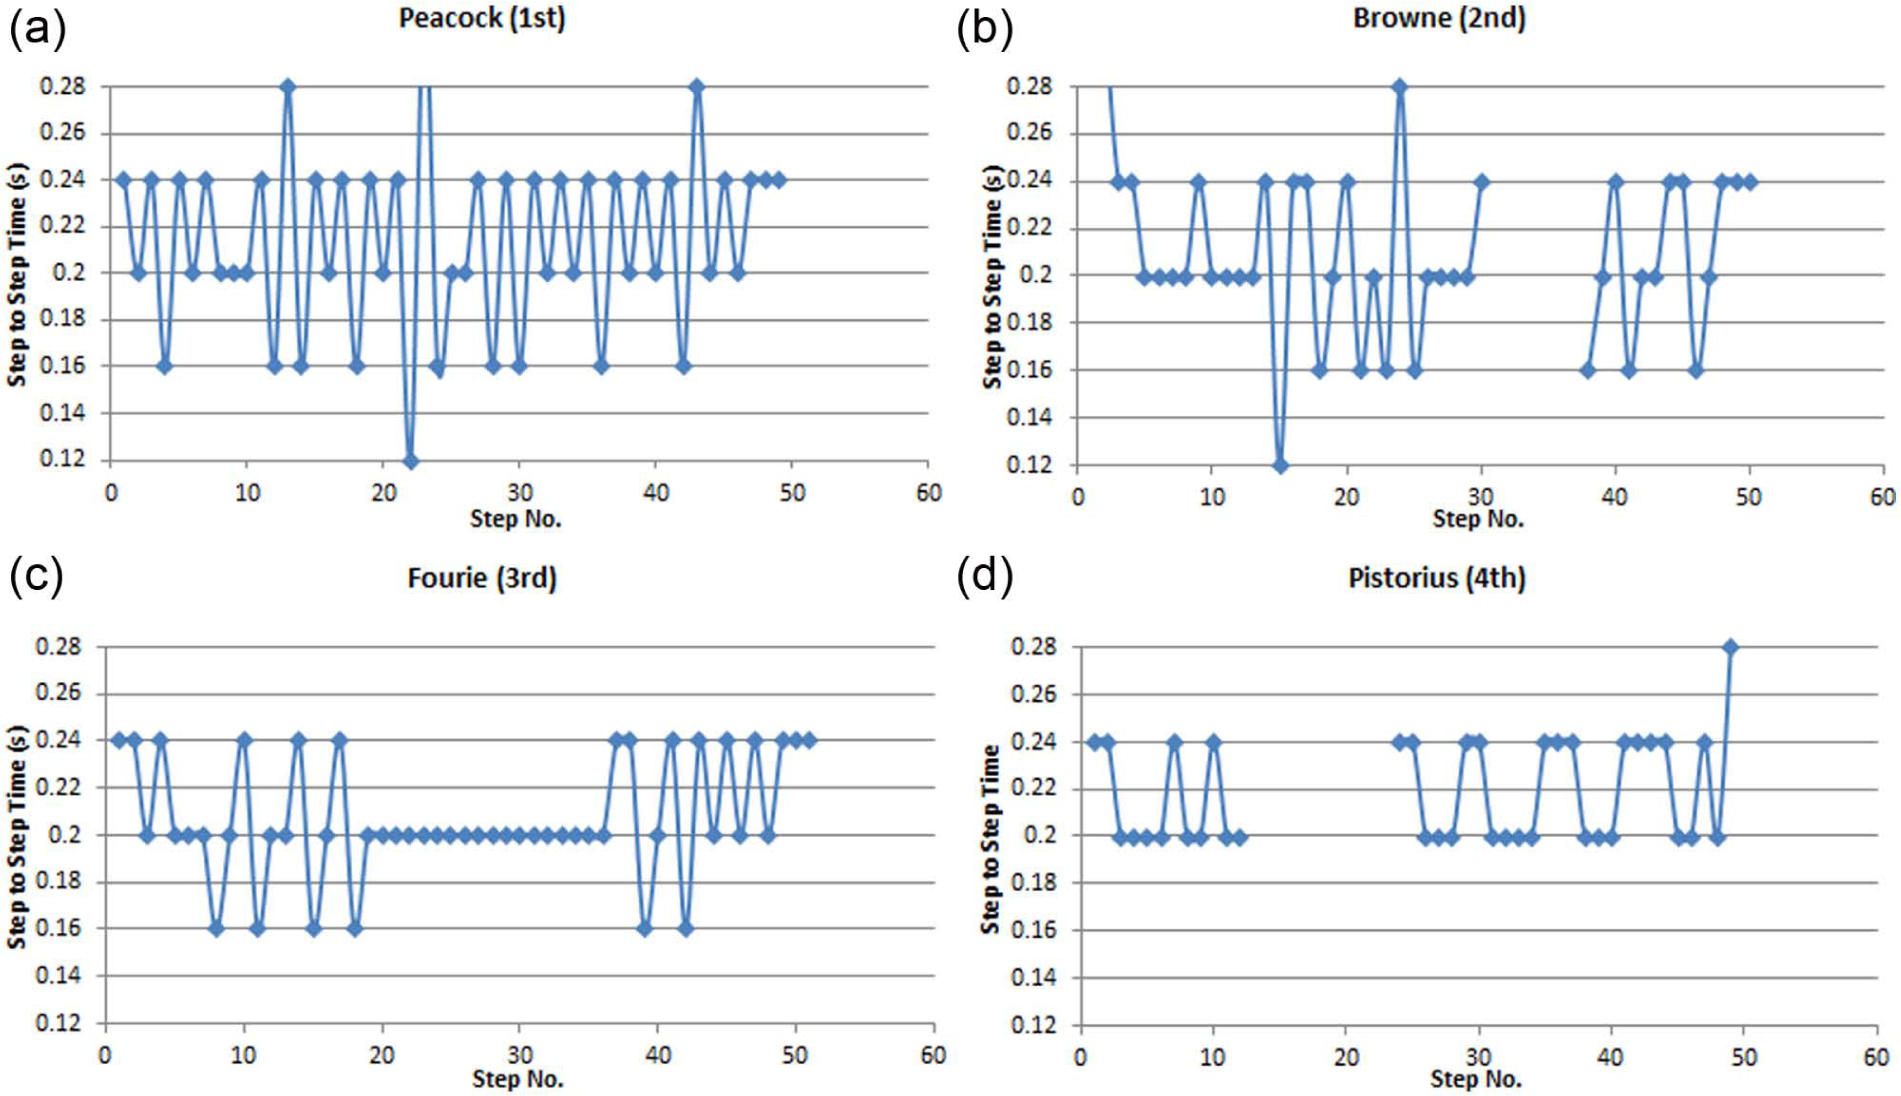
The 2012 Paralympic Games athlete gait symmetry summaries for athletes: (a) Peacock, (b) Browne, (c) Fourie and (d) Pistorius
Peacock showed great improvement from the 2011 event to then later in 2012. However, his run still demonstrated significant RA. Unlike 2011, this took place towards the middle rather than the start of his race. Browne’s run is perpetuated by RA throughout his event. Fourie exhibits RA after his start and towards the final stages of his run. Pistorius exhibits LS, which is typical of both his 2008 and 2011 events.
The number of RAs of athletes from the 2008, 2011 and 2012 events are summarised in Table 1.
2011 World Championship performance.
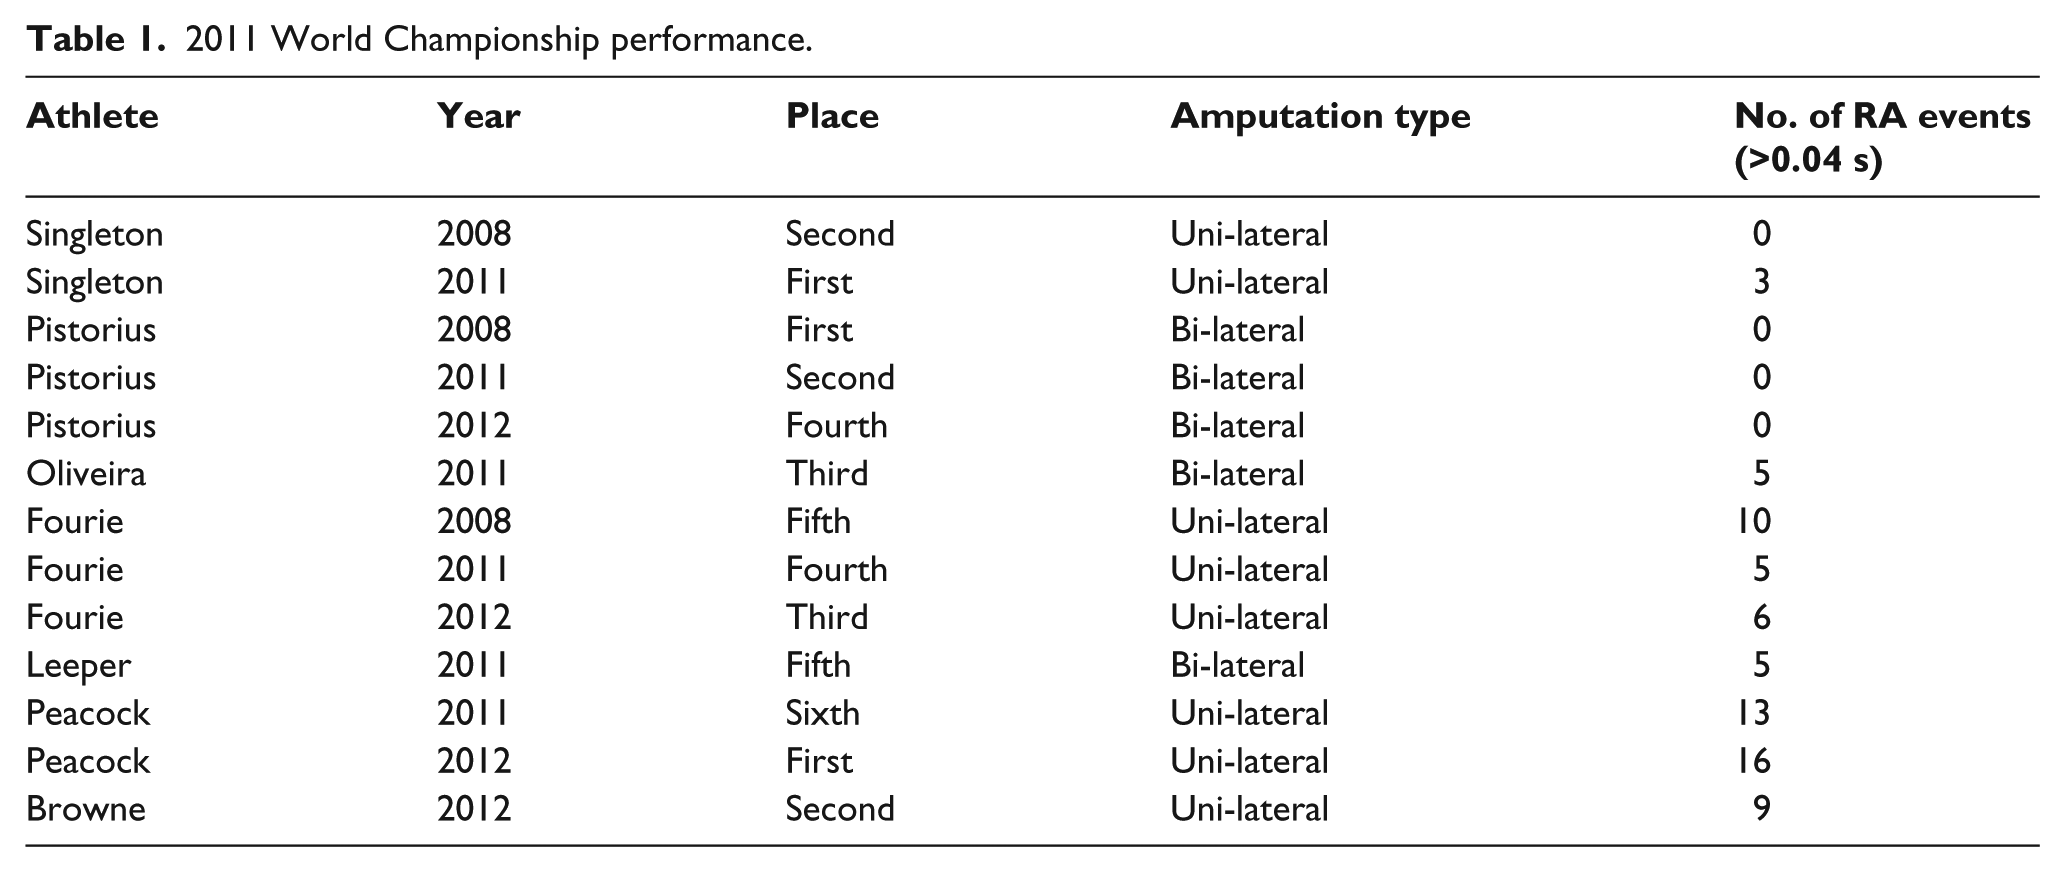
The finishing position does not correlate to the number of RA events. Peacock has improved his finishing position performance in the 100 m between 2011 and 2012 yet still displays a large level of random RA between his two lower-limbs.
Discussion
Step count
The step count data suggested that at elite level, a low step count of no more than 49 steps is desirable to perform well in the event. An assumption can be made that the step-to-step distance will vary throughout the event due to the rate of acceleration or speed at any given stage. However, the low step counts exhibited here suggest that step-to-step flight time is important. It is not clear in this study regarding the impact of the start technique and reaction time. It is conceded that this may affect the net step count if the first step out of the start blocks is performed poorly or is shorter in length than expected. The start will require further evaluation at a level beyond the resolution of the recorded TV footage. However, based upon the data in this study, it is proposed that stakeholders such as coaches could assess an athlete’s step count to initially investigate the potential competitiveness of an athlete. A high step count could indicate an undesirable physical ability or that their prosthetics technology requires further adjustment.
Step timing symmetry
This study shows that in the limited number of case studies available, randomised asymmetry behaviour does take place in elite 100-m competition.
It is conceded, knowing the limitations of the high-definition (HD) footage, that the 25 frames/s is not a high-enough resolution to detect the precise level of ground step-to-step asymmetry. However, the degree of consistent LA witnessed in this data is not dissimilar to those reported in the published literature. This has seen lower-limb step timing asymmetry of 0.02 s at 3.5 m/s and 0.03 at 2.7 m/s. 17 Despite the limitations of this method, the data have seen random asymmetry events of levels larger than those reported in this literature. This study reported some as great as 0.08 s. From this, it could be concluded that athletes under race conditions can create occasional asymmetry that may not be reflected when running at slower speeds, at a steady state or in non-competitive environments. Differences in an athlete’s prosthesis length are unlikely to be the root cause as previously proposed 18 when the asymmetrical step timing events are so randomised.
Limb-to-limb step timing asymmetry may not be a barrier to success in itself. Peacock went from finishing sixth to first from 2011 to 2012 yet still exhibited a similar level of RA in his races. However, what might be more important is where he exhibited the RA. In 2011, it was at the start while he was trying to accelerate. Yet in 2012, it took place when he was already closer to a steady-state speed. It is proposed that the net loss in speed would be lower if the RA takes place later in the event. The impact of randomised step-to-step timing asymmetry within the 100-m event (and its impact on running speed) is suggested for closer study in the future.
The actual cause of RAs is unknown. However, in some cases, a root cause can be identified by qualitatively assessing the race footage. For example, Singleton in 2008 and both Singleton and Pistorius in 2011 demonstrated RA in the last few steps of their events. The reason for this could be assumed to be physiological fatigue yet when looking at the video, both athletes were involved with a lunge for the line. However, when reviewing other athletes’ mid-race step-to-step asymmetry, the root causes could not be clearly identified. It is proposed that the cases of RA need to be evaluated qualitatively alongside the quantitative data. Any RAs could be attributed to a poor start, a slow start, fatigue, falls or torso lunging. It could also be speculated that mid-race RAs may not be the direct fault of the athlete themselves but as a result of their prostheses technology. These events are recommended for further study in the future.
Consistent asymmetry in this study was not clearly obvious due to the previously conceded limitations of the measurement resolution. This is not to say it does not exist but that it is not evident within the margin of error. However, large-scale, randomised asymmetry was still seen to occur in several cases. The cause of this could not easily be explained, and the root causes require further investigation.
Conclusion
It was seen that within race-based video footage of athletes competing in the T44/43 100-m event, a low step count of less than 50 steps may help athletes achieve better results. This will provide coaches with some insight regarding an athlete’s potential for success in this event in the future.
The video evaluation methods were limited by the constraints of HDTV footage and did not provide suitable precision of ground step-to-step asymmetry of less than 0.04 s. However, some athletes’ demonstrated large-scale, randomised, step-to-step timing asymmetry that was greater than 0.04 s. The reasons for these events could not be explained and are worthy of further study.
Footnotes
Author contribution
All authors contributed equally in the preparation of this manuscript.
Conflict of interest
None declared.
Funding
This research received no specific grant from any funding agency in the public, commercial or not-for-profit sectors.