
Abstract
Background:
Studies of the maximal oxygen uptake (VO2max) of transfemoral amputees have mostly used protocols that activate a relatively small muscle mass. Consequently, transfemoral amputee VO2max may be systematically underestimated, and the validity of these test protocols is questionable.
Objectives:
(1) Investigate validity and reliability of a VO2max walking protocol and (2) compare the VO2max of a transfemoral amputee group with a group of matching controls.
Study design:
(1) Randomized crossover study: walking versus running VO2max for the control group and (2) case-control study: transfemoral amputees versus control group VO2max.
Methods:
Twelve transfemoral amputees and control participants performed a walking VO2max test with increasing treadmill inclinations to voluntary exhaustion. The control group also completed a running (“gold-standard”) VO2max test.
Results:
Mean (standard deviation) control group VO2max following walking and running was similar, that is, 2.99 (0.6) L min−1 and 3.09 (0.7) L min−1, respectively. Mean (standard deviation) transfemoral amputee walking VO2max was 2.14 (0.8) L min−1 (compared to CON; p < 0.01). Mean intraclass correlation coefficient of repeated VO2 measurements was 0.97, and within-subjects standard deviation was 60 mL min−1.
Conclusions:
The walk protocol is valid. Walking VO2max of transfemoral amputees was 40% lower compared to control group. Reliability of the walking protocol is comparable to other walking protocols.
Clinical relevance
The design, alignment, and materials of prostheses are important for effective ambulation. Cardio-respiratory fitness is, however, also important in this regard, and a low fitness may compromise health and independent living. Hence, transfemoral amputees with low physical fitness should engage in regular physical activity to improve health, gait capacity, and independency.
Background
In clinical situations, an incremental exercise test of the maximal oxygen uptake (VO2max) can be instrumental in identifying specific limiting physiological factors and in assessing the progress of exercise rehabilitation programs. Considering the increasing rate of lower limb amputations, 1 there are surprisingly few studies that have actually reported the VO2max values of lower limb amputees, for example, Chin et al.2 –4 and Vestering et al. 5 Using mainly test protocols based on one-leg cycle ergometry or upper-body ergometry, these studies collectively report very low VO2max values compared to predicted values for healthy individuals of the same age and sex. 6 A low level of VO2max for transfemoral amputees (TFAs) may be caused by several factors: The VO2max may be systematically underestimated due to the choice of test protocol, that is, the protocol is not valid. Alternatively, these individuals are physically deconditioned, and the measured VO2max thus represents their “true” VO2max. Relating to the validity of VO2max protocols, upper-body ergometry and one-leg cycle ergometry activate much muscle mass than whole body exercise, and using these test modes, healthy individuals generally achieve only 70%–80% of whole body VO2max. 7 Consequently, upper-body/one-leg cycling protocols are not ideal if measurements of whole body aerobic capacity are of interest. This emphasizes the need for a VO2max protocol that activates a larger amount of muscle mass than protocols previously used by TFAs, and in this regard, two-leg cycle ergometry may be an alternative. In a pilot study conducted in our laboratory, the VO2max of TFAs following two-leg ergometer cycling was nonetheless 7% lower compared to treadmill walking VO2max (p < 0.05). Thus, treadmill walking may be an attractive alternative for VO2max testing of TFAs. To be confident that a VO2max test of TFAs actually is maximal, and that the results are valid, one should ideally perform a running VO2max test and compare running VO2max results to the walking protocol. Since most TFAs are unable to perform a running test, this is, however, not an option.
Hence, the validity of a new VO2max walk protocol was investigated by a group of able-bodied healthy adults (CON) that was tested with a treadmill walking protocol to voluntary exhaustion and with a treadmill running protocol (i.e. a “gold-standard” VO2max test). If the walking protocol and the running protocol result in similar VO2max values in able-bodied subjects, and objective criteria for achieving VO2max are satisfied, 8 one may assume that the incremental walking test is a valid test protocol for measuring VO2max. Given this, the walking protocol will unquestionably generate sufficient physiological stress to generate VO2max in TFAs. Hence, the measured VO2max following the present treadmill walk protocol will likely represent the “true” VO2max of the TFAs. Since the validity of an exercise test is also dependent on its reliability, the reliability of the treadmill walk protocol was examined by repeating the walk protocol three times and comparing VO2 responses at the different treadmill inclinations of the protocol. Accordingly, the main hypotheses of this were the following:
There is no difference in the mean VO2max of able-bodied subjects (CON) following an incremental walking protocol compared to mean VO2max values following a “gold-standard” running protocol.
Walking protocol mean VO2max of TFAs is lower compared to VO2max of able-bodied subjects (CON) with matching age, height, weight, sex, and self-reported physical fitness (SPF).
The intraclass correlation coefficient (ICC) of repeated walk protocol VO2 measurements is better than 0.90.
Methods
Participants
Three groups of participants were recruited to participate in this study. Groups TFA and CON participated in a test to investigate the validity of a treadmill walking protocol for measuring the VO2max of TFAs, while the third group (reliability group (REL)) participated in a test to examine the reliability of the treadmill walk protocol. Participants of the TFA group were nonsmoking adults (6 females and 6 males) with unilateral transfemoral amputation for at least 2 years for reasons other than vascular diseases, and in general good health. All participants in this group used their prosthesis on a daily basis and were able to walk continuously for at least 500 m with no or only moderate support from a cane or an elbow crutch. Eight of the TFAs used a microprocessor-controlled knee joint, while four subjects used other advanced mechanical knee joints. The participants in the control (CON) group were matched for weight, height, age, sex, and SPF. The CON subjects were healthy, nonsmoking adults (six females and six males) with no orthopedic problems. The participants in the reliability (REL) group were healthy, nonsmoking adults (5 females and 5 males). SPF of all participants was evaluated by a 5-point Likert scale (1 = very good, 3 = average, 5 = very poor). Details of the physical characteristics of the TFA, CON, and REL group are shown in Table 1. All participants were instructed to avoid large meals and coffee for a minimum of 3 h before testing and to avoid exercise and alcohol 24 h before testing. Written informed consent was obtained from all subjects. This study was approved by the Regional Committee for Medical Research Ethics in Norway.
Physical characteristics of the participants.
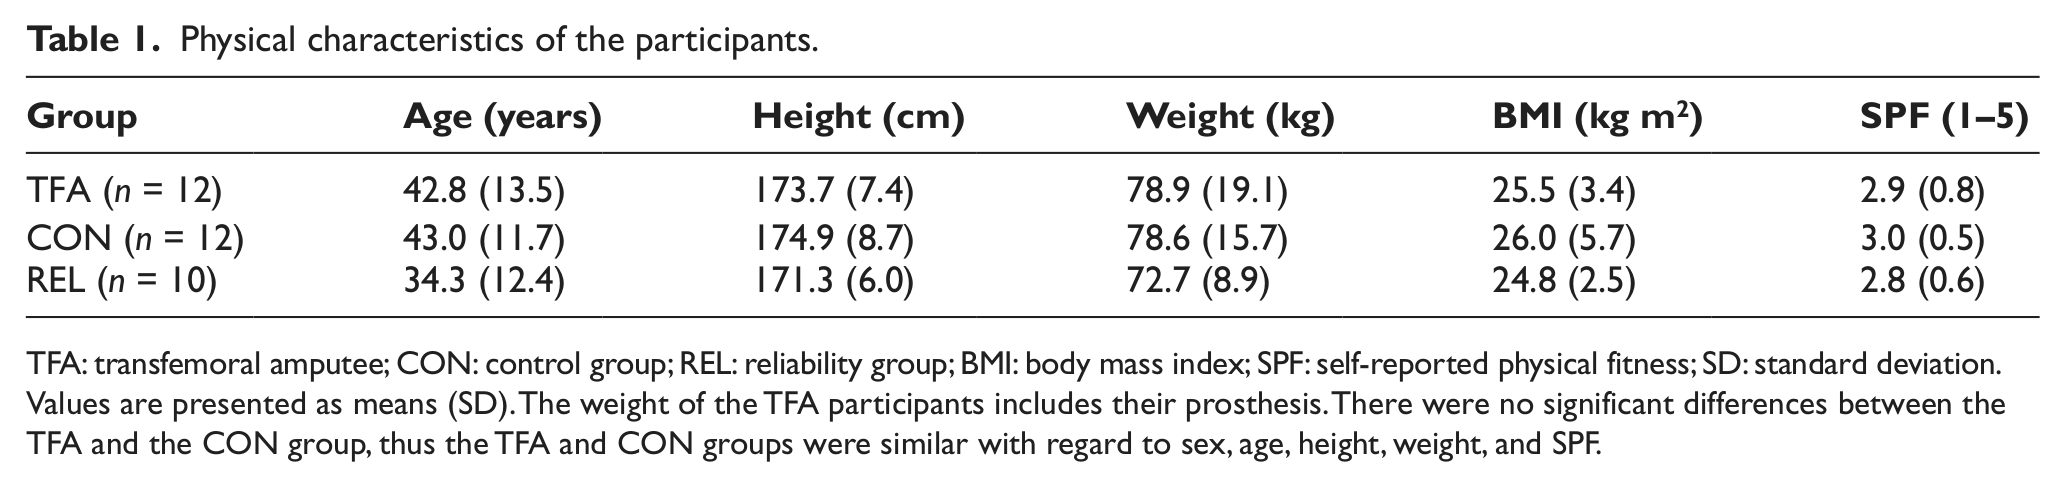
TFA: transfemoral amputee; CON: control group; REL: reliability group; BMI: body mass index; SPF: self-reported physical fitness; SD: standard deviation.
Values are presented as means (SD). The weight of the TFA participants includes their prosthesis. There were no significant differences between the TFA and the CON group, thus the TFA and CON groups were similar with regard to sex, age, height, weight, and SPF.
Measurements
Oxygen uptake (VO2), lung ventilation (VE), and respiratory exchange ratio (RER) were measured by a stationary ergo spirometer (Sensor Medics Vmax229, Yorba Linda, CA, USA). Heart rate (HR) was monitored by a Polar heart rate monitor (Polar Electro, Kempele, Finland). For all test protocols, a calibrated Woodway ELG70 motorized treadmill (Woodway, Weil am Rhein, Germany) was used. Walking economy (Cw; mL kg−1 m−1) during steady-state conditions was calculated during flat treadmill walking by dividing the participants VO2 values by their respective preferred walking speed (PWS).
Criteria for VO2max
The VO2 measurements were considered maximal when the oxygen uptake did not increase >2 mL kg−1 min−1 (plateau in VO2) in combination with RER values >1.05, despite increased workload. 8
VO2max walking protocol (TFA and CON groups)
It is improbable to achieve VO2max during ordinary walking on a flat treadmill. Thus, in order to induce sufficient physical stress to attain the participants’ maximal aerobic capacity, we used a modified treadmill walking test 9 with progressively increasing inclinations. The walking protocol consisted of three sequences: Sequence 1 started with the determination of the participants’ PWS on a flat treadmill. 10 When the PWS was decided, the participants continued directly to sequence 2, which was continuous walking at the PWS for a total of 10 min (warmup). Following warmup, the participants proceeded directly to the VO2max test (sequence 3). During sequence 3, the walking speed was kept constant at the participants respective PWS, while the inclination on the treadmill was increased by 3.5% in the third minute until voluntary exhaustion. For every inclination, physiological measurements (VO2, VE, and HR) were averaged over the last 30 s of each 3-min stage. If the participants were unable to complete 3 min of walking during their final stage, values were averaged over the last 30 s preceding exhaustion. Rating of perceived exertion (RPE; 0–10) was recorded at rest and immediately following termination of testing. The participants were allowed to have one hand resting lightly on the treadmill handrail to assist in keeping balance.
VO2max running protocol (CON group)
The sequence of testing started with slow jogging (7–8 km h−1) on a treadmill with zero inclination for 10 min. Following this warmup sequence, the inclination of the treadmill was increased by 1.0% every 60 s until the inclination was 5.2% (same running speed as during warmup). The inclination was then kept constant at 5.2%, but the speed of the treadmill was increased with 1.0 km h−1 every 60 s until voluntary exhaustion. Physiological measurements (VO2, VE, and HR) were averaged over the last 30 s of each 60-s interval.
Reliability of repeated walk tests (REL group)
To investigate the reliability of the treadmill protocol used by the TFA and CON groups, the participants in the REL group performed the walking protocol a total of three times with a recovery period of 3–7 days between each test. The participants’ PWS was determined during test 1 as previously described and used throughout the study. The test procedure was similar to VO2max walk protocol used by the TFA and CON groups with the exception that sequence 3 was terminated when the REL subjects had completed 3 min of walking at 21.0% inclination. Thus, the VO2 values at this inclination do not necessarily represent the VO2max of these subjects. For every inclination, physiological measurements (VO2, VE, and HR) were averaged over the last 30 s of each 3-min period.
Step frequency and step length
PWS step frequencies during treadmill walking (zero inclination) was measured by manually counting the number of steps for two periods of 30 s each, and then taking the average of the two periods. The step length was calculated by dividing the walking distance by the step frequency.
Statistics
An equal variance (equivalence) test was performed to test for similarity of the running and walking VO2max means of the CON group. Comparisons between the CON and TFA groups were done by independent samples t-test, and within-group comparisons with paired t-tests. Means of three repeated walk tests of the REL group was initially analyzed with one-way repeated measures analysis of variance (ANOVA) and the Sidak post hoc test when appropriate. The relationship between PWS and VO2max values was analyzed with Pearson’s product moment correlation and outliers treated according to the study by Chatterjee and Hadi, 11 while the relationship between subjective ratings of fitness and PWS was analyzed with Spearman’s rank correlation. In addition, ICC (1, k) was analyzed according to the study by Shrout and Fleiss, 12 while within-subjects standard deviation (Sw) was calculated according to the study by Bland and Altman. 13 Agreement between VO2max values obtained from the walking and the running protocol for the CON group was assessed according to the study by Bland and Altman. 14 The significance level was set at p < 0.05. The data were analyzed by the SPSS version 18.0. Results are presented as means and standard deviations (SDs).
Results
Physical characteristics of the participants
For the participants of the TFA group, there was an inverse relationship (r = −0.75, p < 0.001) between their self-reported fitness and their PWS (m min−1), meaning that the slower PWSs were associated with the poorer subjective ratings of fitness (Table 1). Consistent with this, there was a positive relationship (r = 0.85, p < 0.002) between the TFAs’ PWS (m min−1) and their VO2max, L min−1 (Figure 1). In contrast, there were no relationships for the CON group regarding their VO2max, PWS, or self-reported fitness.
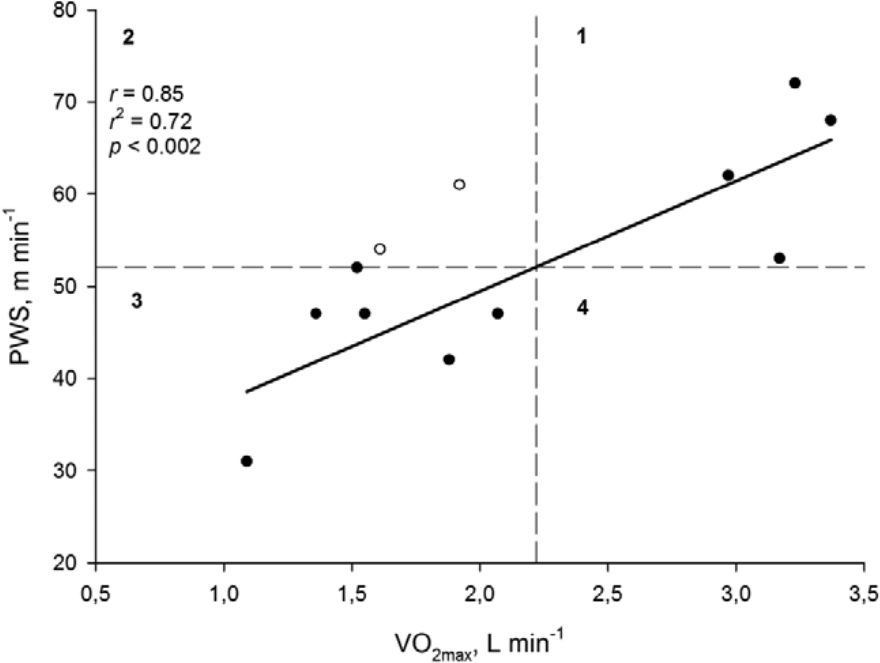
Relationship between the PWS and the VO2max of the TFA group. The included participants average VO2max () and PWS (PWSaverage) are marked as dashed lines that divide the graph into four quadrants (1, 2, 3, and 4). For each point i in the graph, the following quantities were calculated: PWS i − PWSaverage, − , and the product of these two quantities. 11 Thus, from Figure 1, it is clear that PWS i − PWSaverage are positive for every point in quadrants one and three and negative in quadrants 2 and 4. If the linear relationship between PWS and VO2max is positive (increase of PWS as VO2max increases), the data in quadrants 2 and 4 are considered as outliers (open circles), and consequently, these data points are removed from the calculation of the linear regression. If the outliers are included in the analysis, however, the regression coefficient is 0.77 (r2 = 0.60, p < 0.01).
Time–distance parameters, oxygen uptake and walking economy during treadmill walking at the subjects’ PWS
There were significant differences in PWS, step frequency, and step length of the TFA group compared to the CON group (all comparisons, p < 0.001) (Table 2). The relative oxygen uptake for the TFA and the CON groups was similar, but the TFA group used a much larger mean (SD) percentage of their VO2max during PWS walking compared to the CON group (i.e. 47% (9%) and 35% (3%) of VO2max, respectively (p < 0.001)). Walking economy (Cw) for the TFA group was significantly higher than for the CON group (p < 0.001), but this is mainly the result of the slower PWS of the TFA group.
Time–distance parameters, oxygen uptake (VO2) and walking economy (Cw) at the subjects’ PWS.
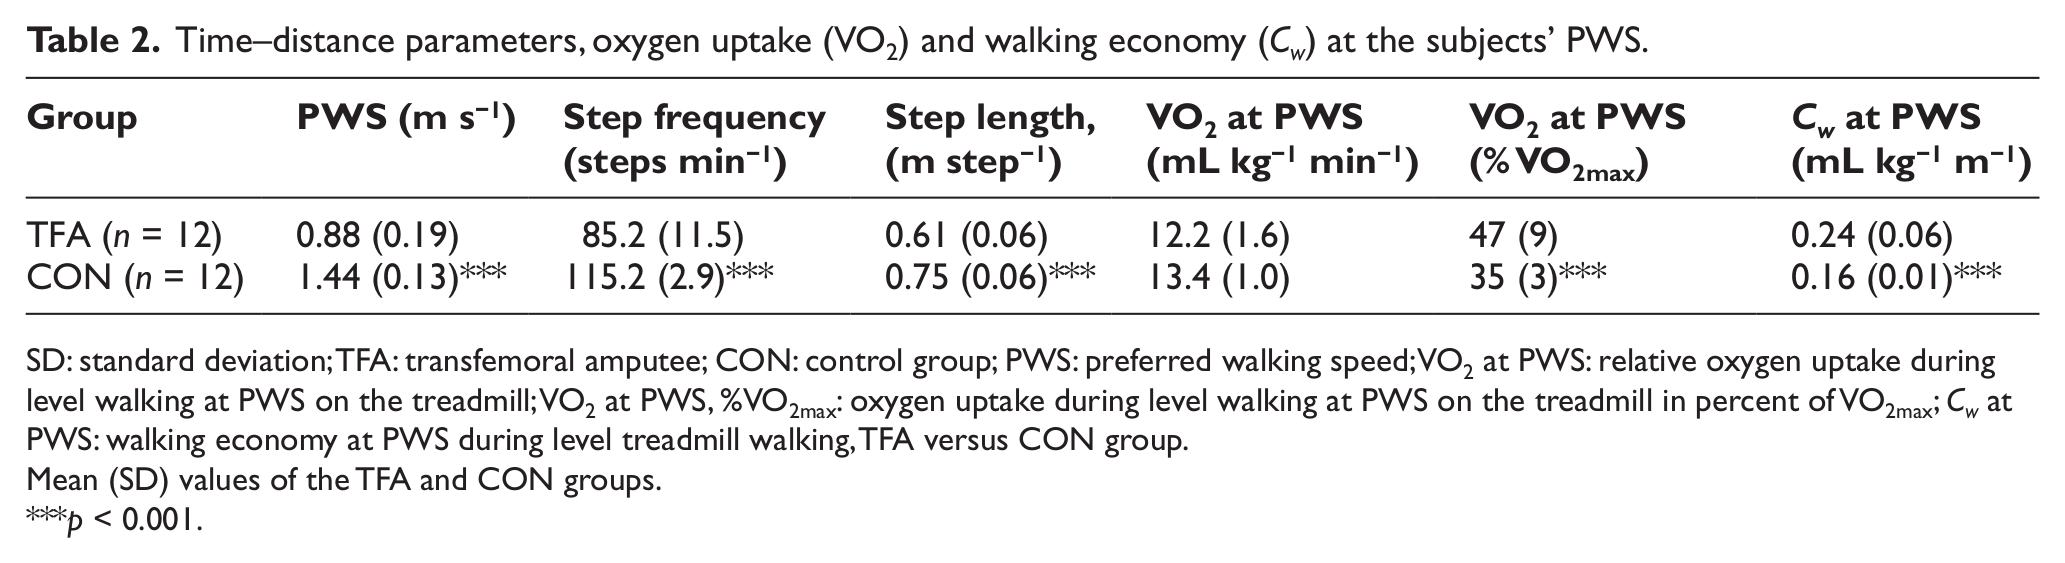
SD: standard deviation; TFA: transfemoral amputee; CON: control group; PWS: preferred walking speed; VO2 at PWS: relative oxygen uptake during level walking at PWS on the treadmill; VO2 at PWS, %VO2max: oxygen uptake during level walking at PWS on the treadmill in percent of VO2max; Cw at PWS: walking economy at PWS during level treadmill walking, TFA versus CON group.
Mean (SD) values of the TFA and CON groups.
p < 0.001.
VO2max following the running and walking tests
Following the treadmill walking protocol, the VO2max of the TFA group was about 30% lower compared to the healthy controls (i.e. 27.1 vs 38.7 mL kg−1 min−1), p < 0.01 (Table 3). For the CON group, there were no significant differences in VO2max, VEmax, HRmax, RERmax, or RPEmax values when comparing the running and walking tests.
The maximal physiological responses to treadmill walking and running.
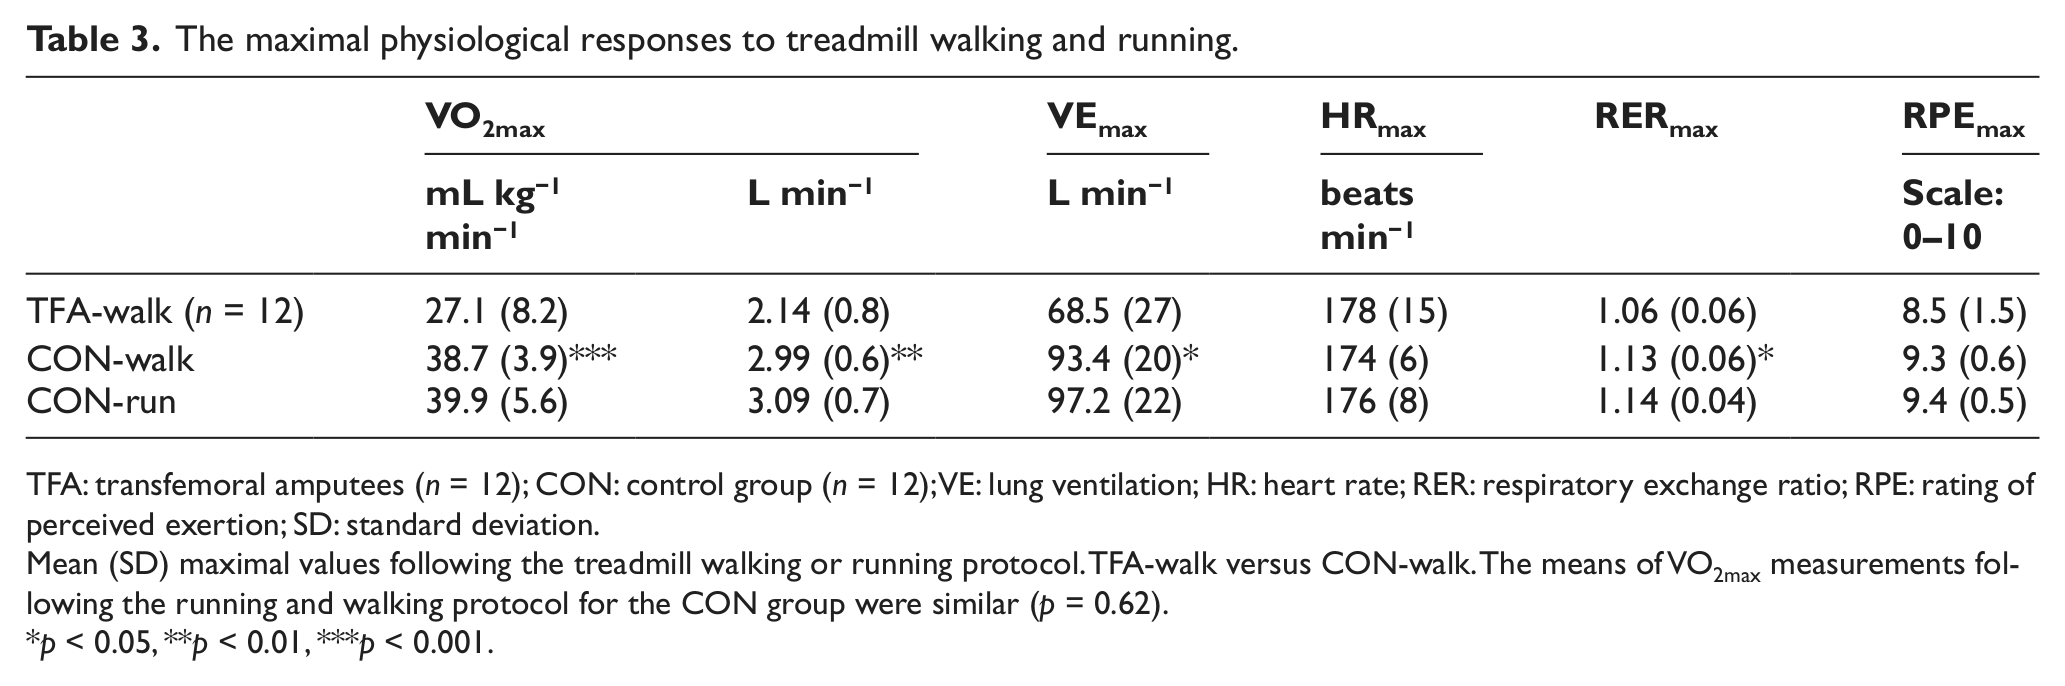
TFA: transfemoral amputees (n = 12); CON: control group (n = 12); VE: lung ventilation; HR: heart rate; RER: respiratory exchange ratio; RPE: rating of perceived exertion; SD: standard deviation.
Mean (SD) maximal values following the treadmill walking or running protocol. TFA-walk versus CON-walk. The means of VO2max measurements following the running and walking protocol for the CON group were similar (p = 0.62).
p < 0.05, **p < 0.01, ***p < 0.001.
To assess the relation between the VO2max values obtained by the running and walking protocol for the CON group, a Bland–Altman plot was constructed (Figure 2). The mean difference between walking and running VO2max was −1.18 mL kg−1 min−1, with upper and lower limits of agreements of 3.6 and −5.9 mL kg−1 min−1.
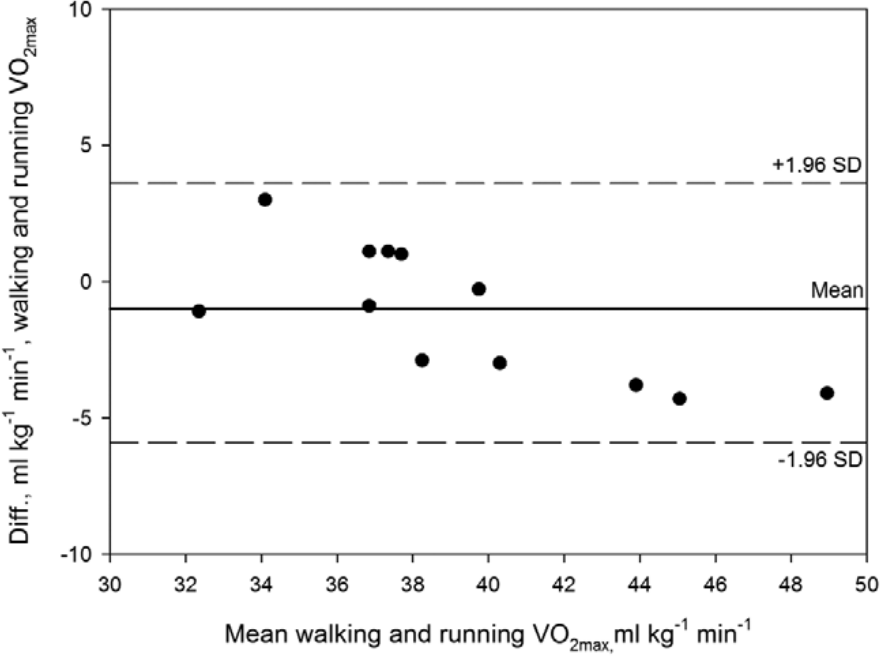
Bland–Altman plot of CON VO2max data following the running and walking protocol. Solid line is mean difference of walking and running VO2max (mL kg−1 min−1). The upper and lower limits of agreement (dashed lines) are plus and minus 1.96 × SD of the difference between measurements. All data-pairs are located within the limits of agreement (n = 12).
Physiological parameters at VO2max
The mean (SD) time to VO2max (excluding warmup) during the walk test for the TFA group was 16.3 (2.9) min. The mean (SD) time to VO2max of the CON group was 16.8 (1.5) min and not different from the TFA group. Mean HR at VO2max (HRmax) of the TFA group was similar to the mean (SD) age-predicted HRmax of 177 (14). HRmax for the CON group during walking and running was similar to the mean (SD) age-predicted HRmax of 177 (12) beats min−1. Following the running protocol, the speed at VO2max for the CON subjects varied between 9 and 13 km h−1, with a mean (SD) speed of 11 (1.5) km h−1.
Criteria for VO2max
For the TFAs, two subjects did not experience a plateau in the oxygen uptake at the time of exhaustion. If no plateau is reached, secondary parameters may assist in determining whether the test was maximal. That is, if RER is greater than 1.05 in combination with HRmax values close to or equal to the age-predicted HRmax, the test is probably maximal. The RER values at the time of exhaustion (RERmax) of the two participants without a plateau in the oxygen uptake were >1.06, and the HRmax during testing was within 2–4 beats of their age-predicted HRmax. For the CON subjects, three subjects did not experience a plateau in oxygen uptake during either test protocol. RERmax for these participants were >1.06 during walking, while running RERmax was >1.11, and also for these subjects, the measured HRmax during testing was within 2–4 beats of their age-predicted HRmax. Collectively, based on respective RPE scores and RER and HR values, the test was judged maximal also for the subjects without a plateau in oxygen uptake values.
Reliability of repeated treadmill tests
The ICC for the VO2 measurements were generally very high (mean; 0.97) over the whole range of treadmill inclinations (Tables 3 and 4). The within-subjects standard deviation (Sw) can be considered a measure of absolute reliability (method error), and in this study, the Sw of the VO2 measurements varied between 40 and 90 (mean = 60) mL min−1.
Oxygen uptake (VO2, L min−1) following repeated treadmill tests (REL group).
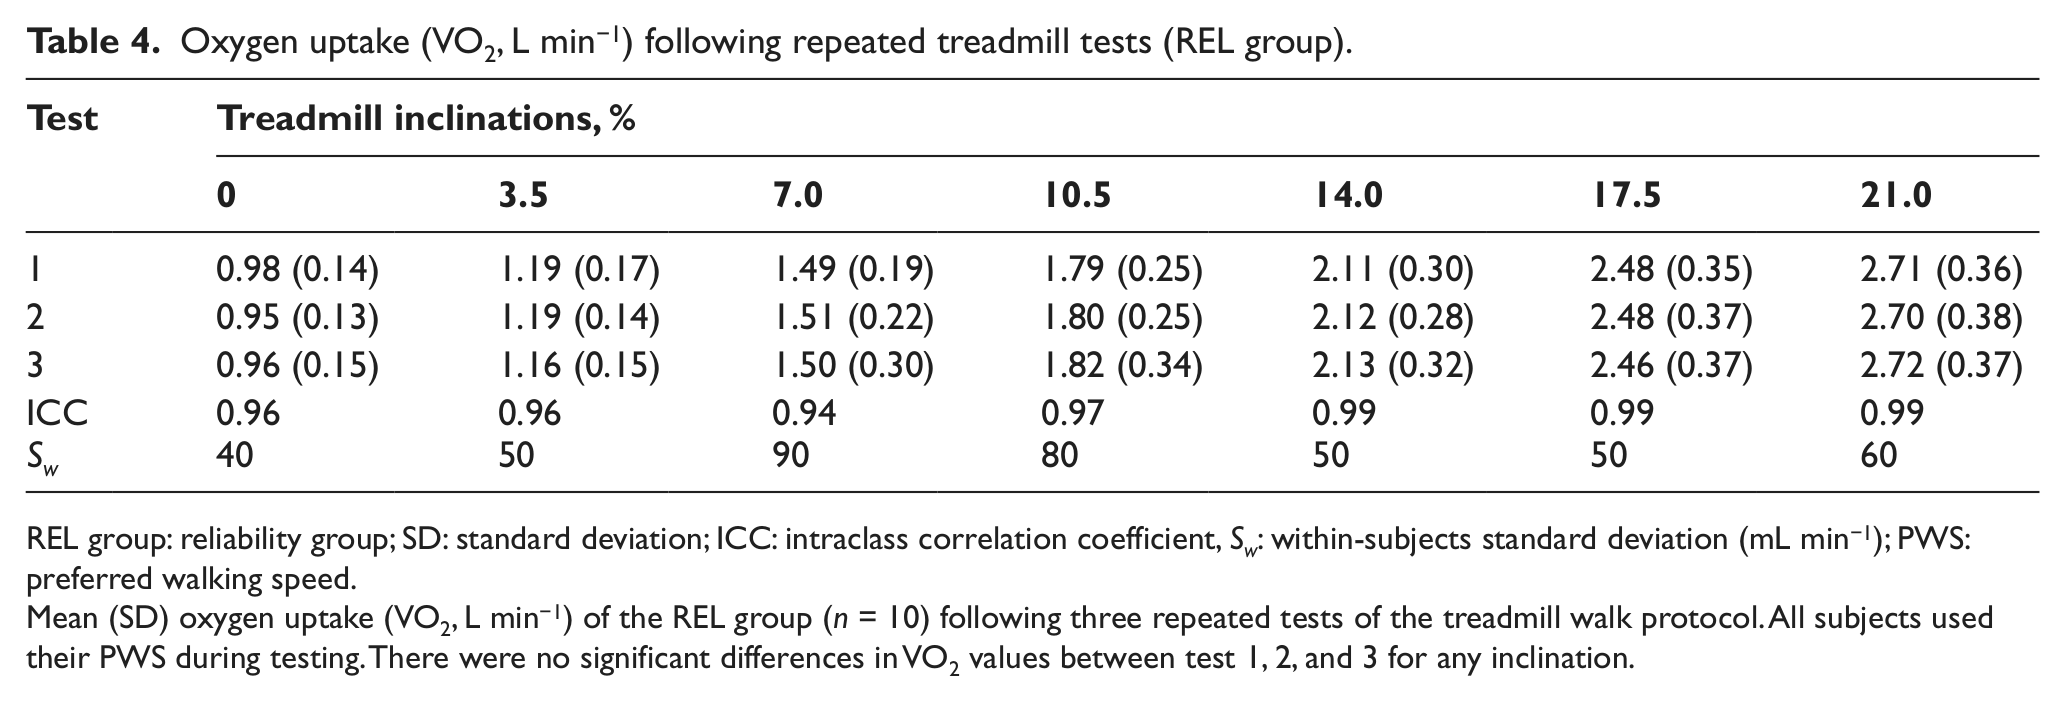
REL group: reliability group; SD: standard deviation; ICC: intraclass correlation coefficient, Sw: within-subjects standard deviation (mL min−1); PWS: preferred walking speed.
Mean (SD) oxygen uptake (VO2, L min−1) of the REL group (n = 10) following three repeated tests of the treadmill walk protocol. All subjects used their PWS during testing. There were no significant differences in VO2 values between test 1, 2, and 3 for any inclination.
Discussion
Validity of the walking protocol
In this study, a group of healthy adults (CON) with average self-reported fitness were tested on a treadmill with a VO2max walk protocol used by TFAs 15 and with a VO2max running test (“gold-standard” test). The VO2max values of the CON group were similar following the walking and the running protocol (~40 mL kg−1 min−1), demonstrating that the CON subjects achieved similar individual VO2max by both protocols. To judge the level of agreement between the “gold-standard” VO2max test and the VO2max of the walk test, a Bland–Altman plot was constructed (Figure 2).
All individual data points are relatively well collected and within the upper and lower control limits. In addition, the mean difference between the two tests was about −1.2 mL kg−1 min−1, and this small difference is within acceptable limits. In addition, judging by each subject’s work rate—VO2 relationship (plateau in VO2 measurements despite increases in work rate) and RER values at voluntary exhaustion—objective criterions for having achieved VO2max 8 seems to be satisfied. In sum, the walk test is a valid test of VO2max for moderately fit subjects. The average VO2max of the TFAs (~27 mL kg−1 min−1) in this study was higher than reported in earlier studies,2 –5,16 but still, these values are only about 70% of the CON group VO2max. Hence, the TFAs have considerably lower cardio-respiratory fitness than able-bodied subjects with similar age, height, weight, sex, and self-reported fitness. In this regard, it is argued that only those amputees who have adequate fitness will become successful prosthetic users. 4 Consequently, TFAs should engage in regular physical activity to reduce the risk of further reductions of their cardio-respiratory fitness and to ensure effective prosthetic ambulation.
To put the VO2max values of our TFAs and CON subjects into a larger perspective, the walking CON and TFA VO2max were compared to walk protocol VO2max data obtained from a large sample of norwegian healthy men and women of different ages. 8 In this context, we find that the CON VO2max (~40 mL kg−1 min−1) is similar to the average VO2max of healthy men and women with similar age as our participants (i.e. ~41 mL kg−1 min−1). Thus, the VO2max of the CON participants seems to be representative of healthy, moderately fit male and female norwegians, and this strengthens the assumption that the low VO2max values of the TFAs using the treadmill walking protocol are not the result of an inadequate test protocol but represent the actual VO2max of these subjects. Pitetti and Manske 17 have, however, raised concern that the combination of reduced walking economy (compared to able-bodied persons) and the risk of painful skin breakdowns and following infections during prolonged walking preclude walking as a useful physical activity pattern during exercise and testing. Skin breakdowns may be a problem if the prosthesis is not well fitted to the amputee. In this study, however, all participants had good skin quality and completed the walk test without problems of this kind.
Walking economy (Cw)
In this study, the relative oxygen uptake during level treadmill walking with the PWS was similar for the TFA and CON groups (12.2 and 13.4 mL kg−1 min−1, respectively). However, the Cw was significantly higher (64%) for the TFA group compared to the CON group (i.e. 0.24 vs 0.16 mL kg−1 m−1). Most prosthetic users have, however, considerably slower PWS than healthy persons. 18 Since the calculation of walking economy is considerably influenced by walking speed, it may not be correct to judge the physical burden of prosthetic ambulation based on the Cw, and especially not when the relative oxygen uptake is similar during PWS for able-bodied persons and TFAs.
It is, however, not uncommon in the literature to evaluate prosthetic gait based on calculations of the Cw,17 –19 but it would probably be more informative to evaluate the energy expenditure of prosthetic walking relative to the amputees’ maximal rate of oxygen uptake (VO2max). When subjects were tested on a flat treadmill with their PWS, the TFA group in average utilized 47% of their VO2max, while the corresponding value for the CON group was significantly lower at 35%. Thus, prosthetic ambulation is more strenuous than walking with two intact legs, not because of differences in walking economy, but because the TFA group uses a larger percentage of their total aerobic capacity than healthy individuals do. Hence, to judge correctly the physical burden of TFA gait, there is need of valid and reliable VO2max protocols. Interestingly, there is a positive relationship between the PWS of the TFAs and their respective VO2max (Figure 1), and to our knowledge, this is a novel finding for TFAs. Thus, while the prosthetic design, components, and prosthetic alignment are important for effective ambulation, clearly also the cardio-respiratory fitness of TFAs may be important. In further studies, it may be interesting to investigate whether improvements in aerobic capacity translate to improved walking speeds (and Cw) in TFAs.
Reliability of VO2 measurements
In order to investigate the reliability of the walk protocol, a group of healthy adults (REL group) performed the walking test a total of 3 times, and the ICC and within-subjects standard deviation (Sw) were calculated.12,13 In this study, the ICC scores were very high (Table 4) and better than reported for other comparable treadmill studies. 20 The ICC values in this study were also considerably better than reported for repeated arm ergometry testing, 21 and also considering the low test–retest correlations for arm-ergometry, 22 it seems that walking protocols may be preferable to other test modalities when considering test reliability. Probably, the high ICC scores are partly a result of a fairly homogenous test group, walking at a fixed speed, and that the test modality (walking) is a familiar type of movement. In addition, the measurement period was preceded by 10 min of habituation to treadmill walking, hence, variances in measurements due to learning effects are probably reduced. 23 The Sw, also called standard error of measurement (SEM) is commonly quoted as a measure of absolute reliability, 24 and in this study, Sw varied between 40 and 90 (mean = 60) mL min−1. For our participants, this corresponds to about 0.5–1.2 mL kg−1 min−1. There are several studies that have examined test–retest reliability of treadmill walk protocols, and typically reported Sw values for VO2max of 1.2–4.2 mL kg−1 min−1.20,25,26 Thus, the values of this study are comparable or better than other studies, and we believe the observed deviations are well within tolerable limits.
Limitations of the study
One limitation of this study may be that the VO2max data are collected from a homogenous group of healthy TFAs with no cardiovascular or other diseases. Thus, one can expect that older TFAs with circulatory or other diseases will have substantially lower VO2max values than the TFA group in this study. All TFAs in this study used advanced hydraulic or pneumatic knee components, and they had little difficulties with treadmill walking. It remains, however, to be investigated how subjects with less sophisticated knee components will manage a treadmill walking test with increasing inclinations.
Conclusion
In summary, we find that the VO2max values obtained either by running or walking in the CON group are similar, and that repeated VO2 measurements using the walk protocol show a high degree of accuracy. Thus, the walk protocol used in this study is a valid and reliable test for measuring VO2max of TFAs or healthy persons with average and less-than-average physical fitness. In addition, the VO2max of the TFA group is substantially lower than the VO2max of a matched control group, indicating that the TFA group in this study is deconditioned. TFAs should engage in regular physical activity, as improved fitness most probably would improve gait speed and ensure a more successful prosthetic ambulation.
Footnotes
Acknowledgements
The authors thank the participants for their dedication and willingness to participate in this study.
Conflict of interest
The authors declare that there is no conflict of interest.
Funding
This work was supported by a grant from Stiftelsen Sophies Minde (grant number 23/09).