
Abstract
Background:
Great emphasis is placed on the skeletal medio-lateral to maintain the normal adduction of the remnant femur and to ensure coronal plane stability in an ischial containment socket. Given the invasiveness of the skeletal medio-lateral measurement, an alternative approach using prediction based on non-invasive measures would be welcomed.
Objectives:
Determine the accuracy with which the skeletal medio-lateral dimension could be predicted using sex, stature, anterior–posterior dimension and iliofemoral angle.
Study design:
Cross-sectional.
Method:
Anthropometric measurements on 77 persons were recorded and used as input data into a standard multiple regression.
Results:
The regression model explained 59% of the variance in skeletal medio-lateral (r2 = 0.59) that was statistically significant (F(4, 72) = 25.37, p = 0.000). Only sex contributed significantly to the prediction of skeletal medio-lateral (β = 0.67, t = 6.15, p = 0.00). The degree of error associated with the regression model (sum of squared errors = 0.009) indicated that the actual skeletal medio-lateral could be predicted within ±18 mm in 95% of the cases.
Conclusion:
The regression model is not sufficiently accurate to predict skeletal medio-lateral for clinical purposes. Accuracy of the prediction could be improved with more accurate input data from computed tomography scans and use of other independent variables that explain the unique variance not already described by the participants’ sex.
Clinical relevance
This pilot study demonstrates potential for the skeletal medio-lateral to be predicted using non-invasive anthropometric measurements. Given this proof of concept, future investigators should use more accurate input data from computed tomography scans and identify alternative independent variables that explain the variance in the skeletal medio-lateral not attributable to sex.
Introduction
When you consider that the incidence of lower extremity amputations is about 12 per 100,000 in developed nations 1 and that about 20% of all amputations are at the transfemoral level,2–4 there are literally hundreds of thousands of people living with transfemoral amputation. For persons living with transfemoral amputation, the ischial containment socket has been a standard part of the prosthetic design for more than 20 years.
The ischial containment socket encapsulates some 2–4 cm of the inferior ischium and ischial ramus and bears up against the medial aspect of this bony anatomy. 5 By fashioning the lateral socket wall along the femoral shaft and into the subtrochanter, the prosthetist endeavours to create a socket with a medio-lateral (ML) dimension – a bone-to-bone dimension – that is the same as the skeleton; a dimension commonly known as the skeletal ML. 6
Great emphasis is placed on the skeletal ML of the ischial containment socket to maintain the normal adducted alignment of the remnant femur inside the socket as well as to ensure coronal plane stability of the residuum and pelvis. The importance of the skeletal ML dimension is perhaps best understood by considering what happens during single-limb support on the prosthesis.
During single-limb support on the prosthesis, the gluteus medius contracts to stabilise the pelvis in the coronal plane when the contralateral lower limb is in swing phase. As a result of the gluteus medius contraction, the remnant femur is pulled into the lateral socket wall, which, in turn, tends to push the socket laterally with respect to the residuum. The tendency for the socket to translate laterally is checked by the intimate contact between the socket brim and the medial aspect of the ischium and ischial ramus.7,8 As such, a socket with the correct skeletal ML dimension is thought to be essential to prevent pain on the lateral distal end of the femoral remnant and avoid gait adaptations such as Trendelenburg gait (i.e. lateral lean or lurch of the trunk towards the prosthetic side during single-limb support on the prosthetic limb).7,8
Given the importance of accurately replicating the client’s skeletal ML dimension in the socket, a prosthetist will measure this dimension directly on the client using a calliper – typically a modified furniture clamp. The process of measurement is difficult as it necessitates careful palpation of the medial aspect of the ischium and then accurate placement of the calliper arm directly onto the medial aspect of the ischium. Clinically, this is a challenge given the mass of gluteal tissue and the limited space in the intergluteal cleft within which to simultaneously locate hands and a measurement calliper. By tightening the calliper onto the medial aspect of the ischium and the subtrochanter of the femur, the prosthetist displaces any soft tissue to obtain the skeletal ML dimension. The prosthetist will often employ some cross-checks to ensure the measurement calliper is correctly positioned and thereby gain confidence that the skeletal ML is correct. For example, given that the inferior portion of the ischium is on the same horizontal plane as the subtrochanter of the femur, a prosthetist would expect the measurement calliper to be horizontal when correctly positioned.
Given an understanding of how the skeletal ML dimension is measured, it may come as little surprise that the technique is considered to be invasive by clients given the intimate physical contact and repeated measurement involved. While this may be considered a lay interpretation of the term invasiveness, we believe that if an alternative means could be used to accurately determine the skeletal ML measurement, it would be welcomed by persons with transfemoral amputation.
We propose that the skeletal ML dimension could be predicted using simple and non-invasive anthropometric measurements given literature that suggests the skeletal ML dimension is related to sex and the shape of the ischium in the coronal plane.6,7,9 Unfortunately, we were unable to identify additional literature to guide our choice of independent variables (IVs) given a lack of research describing the relationship between the skeletal ML dimension and other anthropometric measurements. As such, we turned to the anthropological and radiological literature describing sexual dimorphism given that sex was likely a major influence on the skeletal ML. On the basis of this literature, we suggest that some of the variance in the skeletal ML measurement could be explained by differences in stature given the observed relationship between stature and the distance between the ischial tuberoities. 10 Differences in the anterior–posterior (AP) length of the pubis and ischium are also distinctly different between the male and female pelvis, 11 and as such, we suggest that this too might explain a portion of the variance in the skeletal ML. While it would be impractical to measure these in vivo, a reasonable surrogate measure may be the distance from the origin of the adductor longus tendon to the ischial tuberosity in sitting – a measurement routinely recorded by prosthetists as the AP dimension. Similarly, the normal range of iliofemoral angles – the angle between the midline of the ilium and shaft of femur in the coronal plane – is larger in females 6 and may, therefore, serve as a useful predictor of the skeletal ML.
While many anthropometric measurements may explain part of the variance in the skeletal ML dimension and may therefore serve as useful IVs in a regression analysis, only a portion of these would be considered non-invasive by clients and routinely obtained by prosthetists during clinical practice. Therefore, we propose the use of four IVs as the basis for the prediction of the skeletal ML dimension: sex, stature, AP dimension and iliofemoral angle. The aims of this pilot study were to determine the accuracy with which the skeletal ML dimension could be predicted using sex, stature, AP dimension and iliofemoral angle and to determine which IVs make a significant contribution to the prediction of the skeletal ML dimension.
Method
Subjects
Persons with transfemoral amputation or knee disarticulation were recruited, using convenience sampling, through a private prosthetic service located in a large metropolitan city. Persons with these levels of amputation were recruited given their familiarity with the types of measurements and procedures necessary to record these data. Persons were excluded if they were under 18 years of age or could not provide written consent in English. We did not restrict recruitment based on sex, race or physical characteristics such as stature or mass.
The sample size required was estimated using G*Power 3.1.4 (Dusseldorf University – http://www.psycho.uni-duesseldorf.de/abteilungen/aap/gpower3) assuming α = 0.05, power = 0.9, the number of IVs was four (4) and an effect size of 0.2. The effect size was determined conservatively assuming weak relationships between the dependent variable (DV) and IVs (r = 0.2). This was necessary as data describing the strength of the relationship between the skeletal ML dimension and the IVs used in our study did not exist. On this basis, it was necessary to recruit 80 persons for an adequately powered investigation.
Apparatus
The skeletal ML dimension was measured using a modified steel woodworking clamp (Brink and Cotton Manufacturing Co., Bridgeport, CT, USA) that was modified by grinding away the top of the ratchet arm and installing a 16-cm-long, 5-mm-thick aluminium steel bar (Figure 1). The long arm of the calliper was used on the lateral side of the limb. Each ratchet click was associated with a 2-mm change in the distance between the two arms of the calliper.
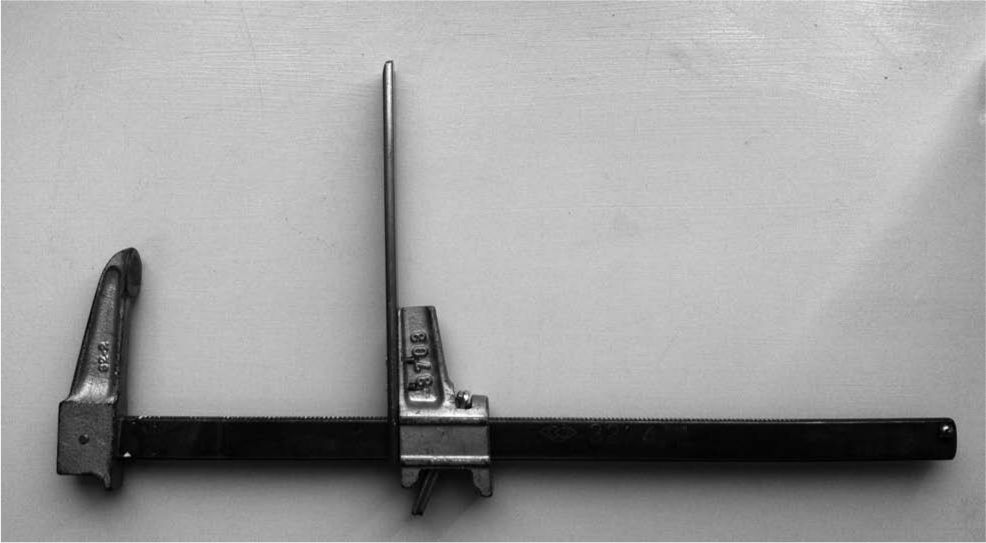
Skeletal ML measurement calliper: a steel woodworking clamp (Brink and Cotton Manufacturing Co., Bridgeport, CT, USA) that was modified by grinding away the top of the ratchet arm and installing a 16-cm-long, 5-mm-thick stainless steel bar. The long arm of the calliper was used on the lateral side of the limb. Each ratchet click was associated with a 2 mm change in the distance between the two arms of the calliper.
A 30-cm steel ruler (743E8 = 300; Otto Bock, Duderstadt, Germany) with marks at 1-mm increments was used to measure the distance between the arms of the skeletal ML calliper as well as to obtain the AP dimension of the residuum. The iliofemoral angle was measured using a goniometer (tractograph) marked with 2° increments (TRACT02; Briggate Medical Company, Braeside, VIC, Australia). Stature was measured using a wall-mounted stadiometer (Seca Portable Stadiometer 213; Seca Deutschland, Hamburg, Germany), and body mass was measured using a set of electronic scales (LASAR Posture (743L100 = 230); Otto Bock).
Procedures
Procedures used in this research were approved by the Faculty Human Ethics Committee of La Trobe University. Participants attending the prosthetic facility were invited to discuss participation in the research and had opportunity to learn about the purpose of the research, the procedures involved and have questions answered before providing written consent. Measurements were recorded for each participant during a single visit by a single clinician (S. L.) using the procedures described below.
The AP dimension was recorded with the participant sitting with an erect torso on a hard wooden surface (Figure 2). The clinician palpated the adductor longus tendon near its origin on the superior ramus of the pubis. The participant was then instructed to relax the residuum while the clinician measured the vertical distance from the wooden surface to the top of the adductor longus tendon. 5
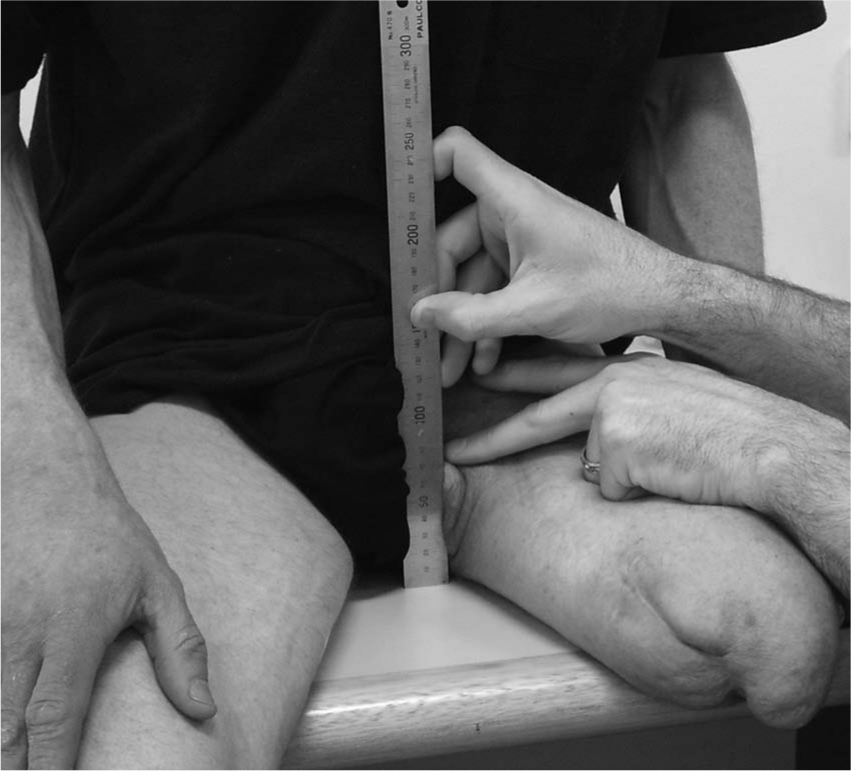
Measurement of AP dimension (photograph taken from anterior side) was recorded with the participant sitting with an erect torso on a hard wooden surface. The clinician palpated the tendonous portion of the adductor longus near its origin on the superior ramus of the pubis, and with the residuum relaxed, the vertical distance from the wooden surface to the top of the adductor longus tendon was measured.
The iliofemoral angle was measured on the sound limb by placing the axis of the goniometer over the apex of the greater trochanter of the femur (Figure 3). The arms of the goniometer followed the shaft of the femur and the ilium in the midline of the body. The client was then instructed to lean laterally towards the amputated side while the measurement was recorded.5,6
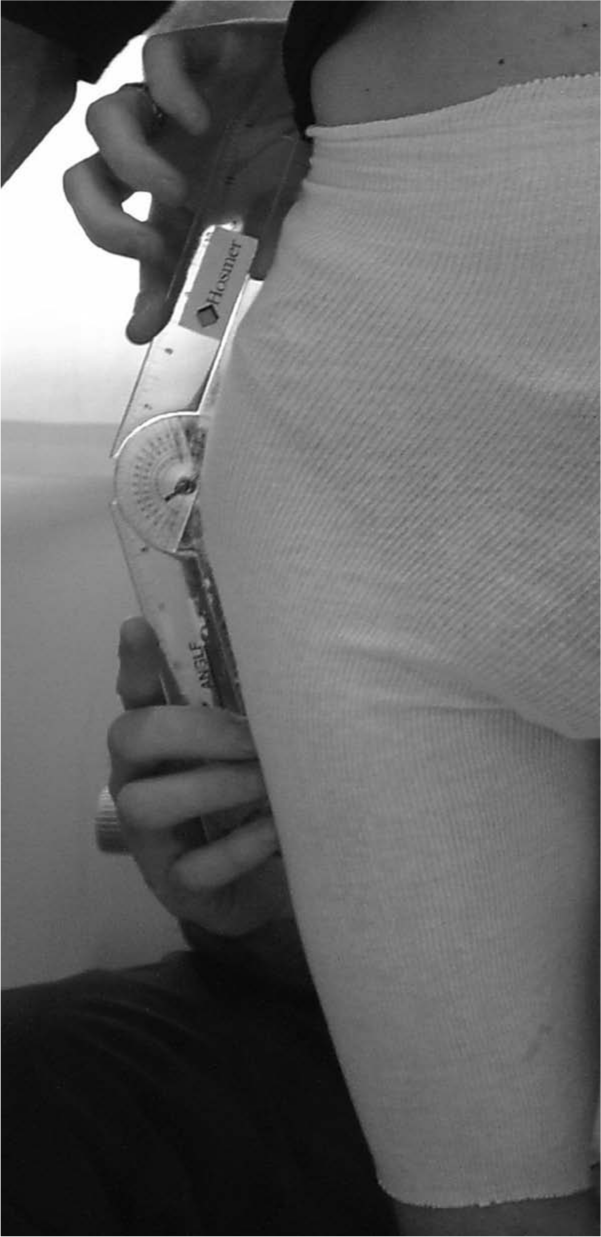
Iliofemoral angle (coronal plane view from anterior side) was measured on the sound limb by placing the axis of the goniometer over the apex of the greater trochanter of the femur. The arms of the goniometer followed the shaft of the femur and the ilium in the midline of the body. The client was then instructed to lean laterally towards the amputated side while the measurement was recorded.
Given the complexity involved in accurately replicating the skeletal measurement, we have elaborated on a previous textbook description 5 and included step-by-step images of a pelvic model for clarity (Figure 4). Prior to measuring the skeletal ML dimension, the clinician developed a familiarity with the shape and feel of the ischium in order to assist with correct location of the calliper. From posteriorly, the clinician palpated the medial aspect of the ischium to determine calliper placement (Figure 4(a)). With the pads of the second and third fingers correctly located on the medial aspect of the ischium, the clinician placed the end of the calliper’s short-arm over the second and third fingers, and while drawing the calliper laterally, withdrew the fingers until the calliper was correctly positioned on the medial aspect of the ischium (Figure 4(b)). With the calliper held in position using the thumb as support (Figure 4(c)), the long arm of the calliper was ratcheted medially until firmly pressed onto the shaft of the femur, immediately inferior to the inferior border of the greater trochanter (Figure 4(d)). The clinician then executed a number of cross-checks to ensure the calliper was correctly positioned, including visual inspection of the calliper placement to ensure it was well superior to the gluteal fold (Figure 5), palpation of the calliper position in relation to the inferior border of the greater trochanter (Figure 4(e)), palpation of the ischial tuberosity to ensure that the end of the calliper was positioned immediately superior to this bony landmark and that the bar joining the two arms of the calliper was horizontal (Figure 5). Finally, the calliper was gently pulled laterally and then medially, noting whether the pelvis moved synchronously to ensure that it was positioned on the bony anatomy. If the clinician was unsatisfied with any one of the cross-checks, the procedure was repeated.
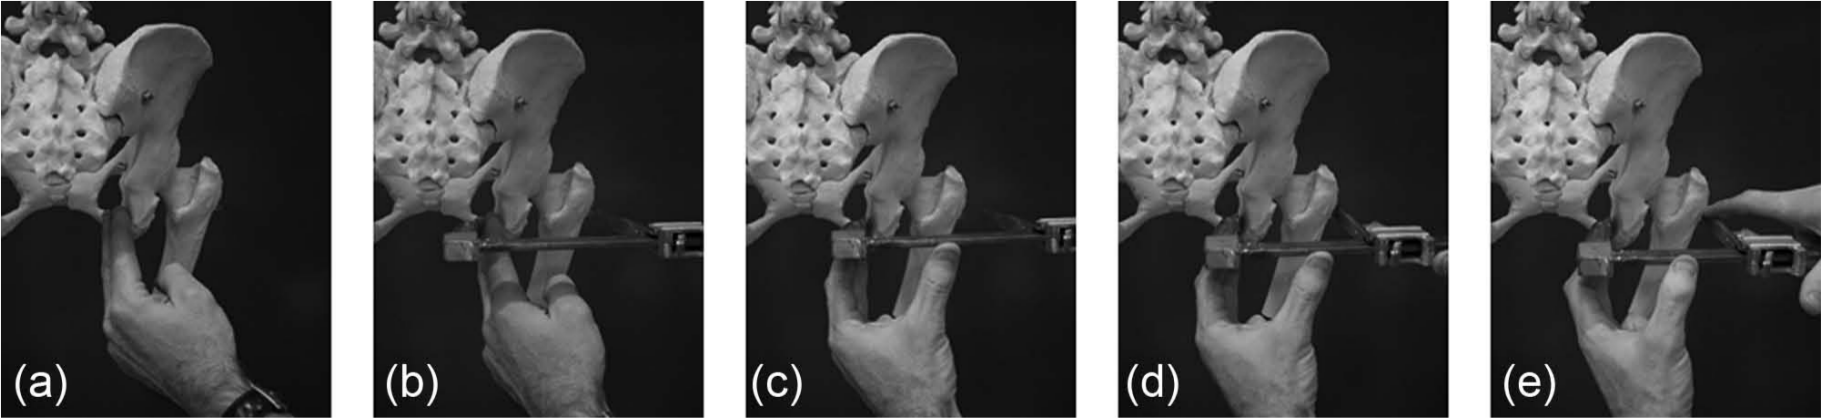
Skeletal ML measurement sequence, from left (a) to right (e): (a) from posteriorly, the clinician palpated the medial aspect of the ischium to determine the calliper placement; (b) with the pads of the second and third fingers correctly located on the medial aspect of the ischium, the clinician placed the end of the calliper’s short arm over the second and third fingers, and while drawing the calliper laterally, withdrew the fingers until the calliper was correctly positioned on the medial aspect of the ischium; (c) with the calliper held in position using the thumb as support, (d) the long arm of the calliper was ratcheted medially until pressed firmly onto the shaft of the femur, immediately inferior to the inferior border of the greater trochanter; (e) the clinician then executed a number of cross-checks to ensure that the calliper was correctly positioned including palpation of the calliper position in relation to the inferior border of the greater trochanter.
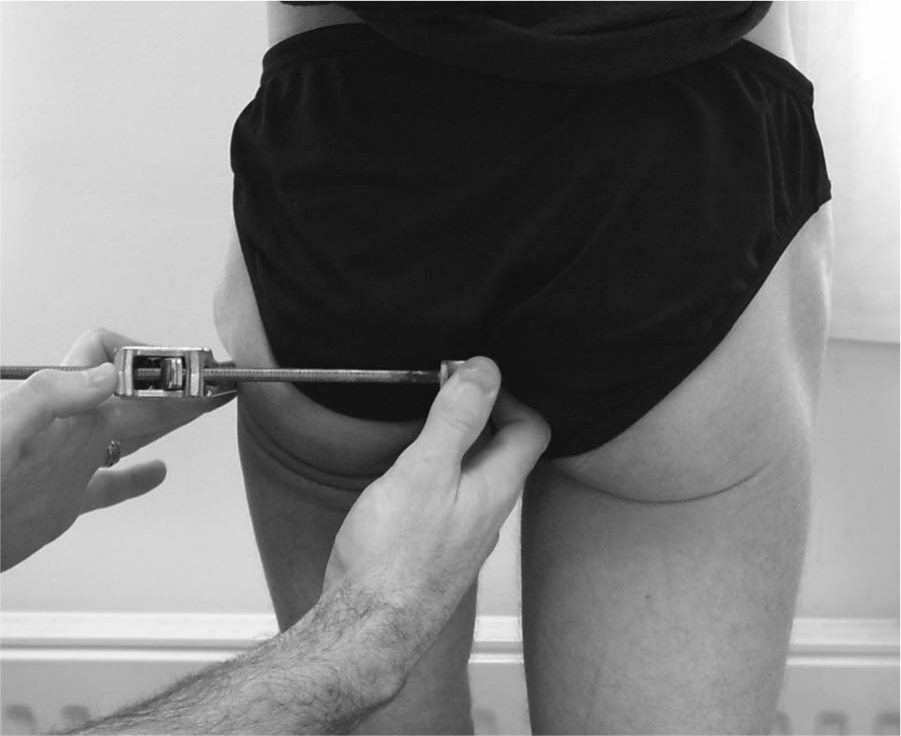
Skeletal ML measurement in vivo (posterior view of the residuum) showing correct position of the calliper on the pelvis. Note the calliper situated well superior to the gluteal fold and the horizontal orientation when correctly positioned on the femur and ischium.
Two measurements were taken for each IV and DV. When there were differences between successive attempts, a third measurement was recorded and the median value was used.
Data reduction and analysis
Participants’ de-identified data were entered into IBM SPSS Statistics 20 (IBM Corporation, Armonk, NY, USA) for analysis. We excluded participants whose body mass and stature were outside the population norm as defined by values more than 2 standard deviations beyond Australian population mean. 12 This required the participants’ measures of stature and mass to be within the following ranges for males (stature: 1.63–1.91 m, body mass: 54.8–97.0 kg) and females (stature: 1.48–1.75 m, body mass: 40.2–93.8 kg).
A standard multiple regression was undertaken in accordance with the techniques described by Pallant 13 and Tabachnick and Fidell. 14 To determine whether the assumptions of the multiple regression were violated, we tested for multicollinearity, normality, linearity and homoscedasticity. 13 Multicollinearity was determined on the basis of the bivariate correlation between any two IVs and the collinearity diagnostics reported by SPSS. Where the bivariate correlation between IVs was greater than r = 0.7, and one of these variables had a variance inflation factor greater than 5, the IV was removed from the analysis. The normal distribution of the residuals was determined using the normal probability plot of the residuals as well as the scatter plot of standardised residuals. Outliers were deemed to have standardised residuals >3.0 (or less than −3.0) and excluded on the basis of the case-wise diagnostics reported in SPSS. The unique contribution of each IV to the regression model was determined using the standardised regression coefficient and the related p value. By taking the square of the semipartial correlation coefficients, we were able to determine the unique contribution of each IV to the coefficient of determination and the impact of its removal from the model.
Results
In total, 82 participants enrolled in the study. Five participants were excluded because either their mass or their stature was outside the population norm. As such, the regression model included data on 77 persons, of which 53 were male. Descriptive statistics are as follows: skeletal ML (0.134 ± 0.0135 m), AP dimension (0.091 ± 0.011 m), iliofemoral angle (24.38° ± 6.89°), stature (1.71 ± 0.075 m) and mass (73.6 ± 12.3 kg). Distinct differences in the skeletal ML measure between men (0.140 ± 0.009 m, range = 0.121–0.168 m) and women (0.119 ± 0.008 m, range = 0.103–0.135 m) were noted.
Preliminary analyses showed no violation of the assumptions of normality, linearity, multicollinearity and homoscedasticity. The skeletal ML showed strong-to-moderate and statistically significant relationships to both sex (r = 0.75, p = 0.00) and stature (r = 0.59, p = 0.00). The relationship between the skeletal ML and both the AP dimension (r = 0.25, p = 0.02) and iliofemoral angle (r = −0.15, p = 0.10) were weak. The regression model was able to explain 59% of the variance in skeletal ML (r2 = 0.59), which was statistically significant (F(4, 72) = 25.37, p = 0.000).
Only sex contributed significantly to the prediction of skeletal ML (β = 0.67, t = 6.15, p = 0.00). The unique contributions of the AP dimension (β = 0.10, t = 1.29, p = 0.20), iliofemoral angle (β = −0.068, t = −0.89, p = 0.38) and stature (β = 0.084, t = 0.76, p = 0.45) were not statistically significant, and based on the square of the semipartial correlation coefficients, their omission from the regression model would each account for less than 1% change in the coefficient of determination.
To determine whether sex was a covariant masking the influence of the other IVs, we stratified by sex and found that the unique contributions of the other IVs were still not statistically significant. The degree of error associated with the regression model (sum of squared errors (SEE) = 0.009) indicates that in 95% of the cases, the actual skeletal ML could be predicted within ±0.018 m.
Discussion
This pilot investigation sought to determine the accuracy with which the skeletal ML dimension could be predicted using non-invasive measurements typically obtained during clinical practice, including sex, stature, AP dimension and iliofemoral angle, as well as to determine which IVs made a significant contribution to the prediction of the skeletal ML dimension.
While the regression model was able to explain a high proportion of the variability in the skeletal ML measurement (r2 = 0.59) and was statistically significant (F(4, 72) = 25.37, p = 0.000), the error associated with the prediction was large (SEE = 0.009). In a clinical context, this means that the predicted skeletal ML value would, in two-thirds of cases, be within ±0.009 m of the actual value and within ±0.018 m in 95% of the cases.
By way of context, it is important to remember that error of this scale would be considered problematic in a clinical setting. For example, if the predicted skeletal ML measurement was 0.010 m too small, the person with amputation would not be able to don the socket, and the ischium will be perched uncomfortably on top of the medial socket wall necessitating a recast for the socket. Similarly, a predicted skeletal ML that was 0.010 m too large would necessitate multiple pieces of packing (assuming the overall socket volume was also too large) and an additional check socket to determine that the adjusted socket was satisfactory.
Based on our clinical experience, we found it interesting to consider that errors of this magnitude may be similar to those experienced by many clinicians in practice, particularly those still developing their expertise as ischial containment practitioners. Unfortunately, we were unable to identify any literature that demonstrates the error (or variability) associated with conventional skeletal ML measurements, and this would be an avenue for future investigation. To address this gap in the literature, clinicians could use the descriptive statistics reported in this investigation to cross-check that the skeletal ML measurements obtained in vivo were within 2 standard deviations of the mean for men (0.122–0.158 m) and women (0.103–0.135 m), and thereby, help identify gross measurement error.
The large degree of error associated with the prediction of the skeletal ML dimension could be explained, at least in part, by the ability to accurately record the anthropometric input data in vivo using traditional measurement techniques in prosthetic clinical practice. While we were unable to locate any investigation detailing the accuracy of the skeletal ML measurement, a study using a similar anthropometric calliper – the VAPC prosthetic calliper (Seattle Systems, Poulsbo, WA, USA) – noted that the average range of measurements was 0.012 m, leading the author to conclude that the device was both inaccurate and unreliable; even given the relatively ideal measurement scenario involving a foam model of a transtibial residuum set-up in a laboratory bench-top vice. 15
We propose that the error associated with the prediction of the skeletal ML could be reduced using more accurate anthropometric input data obtained from CT scans or magnetic resonance imaging. Given that bone-to-bone measurements are more accurate and reliable than measurements involving soft tissue, 16 future investigations should endeavour to utilise these where possible. The accuracy of the model would also be improved by identifying other IVs that explain a large proportion of the variance in the DV not already described by, or strongly related to, sex.
Future investigations should continue to include sex as an IV in the regression model given that it explained a large proportion of the variance in the DV. In our regression model, stature, AP dimension and iliofemoral angle did not make a significant and unique contribution to the prediction of the DV and as such could be omitted from subsequent regression models. However, we are mindful that these IVs may become useful predictors of the skeletal ML if more accurate measurement techniques (e.g. CT scans) reduce variability and thereby explain a larger proportion of the variance in the DV. Future investigators may also wish to be more pragmatic in their approach to identifying IVs that are useful predictors of the skeletal ML. While we sought to identify IVs from the related radiological and anthropological literature, this body of work has focused on identifying women at risk of complicated childbirth or identification of human remains. For example, differences in the pubic arch angle, diameter of the pelvic inlet, the depth of the pelvis and distance between the anterior superior iliac spines (ASIS) are some of the features that have been used to characterise the pelvic geometry.10,11,17 Whether these measurements are strongly related to the skeletal ML dimension or account for the variance in the skeletal ML not already described by sex is unknown, and as such, a more pragmatic approach might be to look at measurements that clinicians could easily and reliably record during clinical practice (e.g. distance between the greater trochanters or ASIS) and simply test these.
Limitations
While our method of convenience sampling had potential to limit the representativeness of the cohort, we found that the high proportion of males in our study was representative 18 and that the distribution participant’s mass and stature were reflective of the broader Australian population. 12 However, the relatively small number of female participants limited the generalisability of the regression to this cross section of the population. Given that lower limb amputation affects more males, future investigators should be mindful of recruiting sufficient participants of each sex. We would recommend use of random sampling with stratification by sex, to ensure the representativeness of the study sample and sufficient participants of both sexes.
The accuracy of the anthropometric input data limited the predictive accuracy of the regression model and, presumably, the strength of the relationship between variables. We hope that by having discussed this in detail, future investigators may be more aware of this limitation and can adopt more accurate measurement technique (e.g. CT scans) for the anthropometric input data.
Conclusion
This pilot study sought to determine the accuracy with which the skeletal ML dimension could be predicted using simple and non-invasive measurements already used by prosthetists, including AP dimension, stature and iliofemoral angle. Prediction of the skeletal ML using our regression model and data is not sufficiently accurate to be of clinical value. The research does demonstrate potential for the prediction of the skeletal ML dimension if the error associated with the prediction could be reduced with use of more accurate anthropometric input data obtained from CT scans and selection of other IVs that explain the unique variance not already described by the participants’ sex.
Footnotes
Conflict of interest
None declared.
Funding
This research received no specific grant from any funding agency in the public, commercial or not-for-profit sectors.