
Abstract
Background:
Contemporary literature reports that the incidence of lower limb amputation has declined in many countries. This impression may be misleading given that many publications only describe the incidence of lower limb amputations above the ankle and fail to include lower limb amputations below the ankle.
Objectives:
To describe trends in the incidence of different levels of lower limb amputation in Australian hospitals over a 10-year period.
Study design:
Descriptive.
Method:
Data describing the age-standardised incidence of lower limb amputation were calculated from the Australian National Hospital Morbidity database and analysed for trends over a 10-year period.
Results:
The age-standardised incidence of lower limb amputation remained unchanged over time (p = 0.786). A significant increase in the incidence of partial foot amputations (p = 0.001) and a decline in the incidence of transfemoral (p = 0.00) and transtibial amputations (p = 0.00) were observed. There are now three lower limb amputations below the ankle for every lower limb amputation above the ankle.
Conclusion:
While the age-standardised incidence of all lower limb amputation has not changed, a shift in the proportion of lower limb amputations above the ankle and lower limb amputations below the ankle may be the result of improved management of precursor disease that makes partial foot amputation a more commonly utilised alternative to lower limb amputations above the ankle.
Clinical relevance
This article highlights that although the incidence of lower limb amputation has remained steady, the proportion of amputations above the ankle and below the ankle has changed dramatically over the last decade. This has implications for how we judge the success of efforts to reduce the incidence of lower limb amputation and the services required to meet the increasing proportion of persons with amputation below the ankle.
Introduction
The incidence of lower limb amputations (LLA) has declined in many countries with similar social, environmental and economic determinates of health as Australia.1–14 A prima facie evaluation might suggest that the declining rates of amputation are the result of successful interventions to reduce the incidence of LLAs.1,7,13 A more critical appraisal demonstrates that much of the epidemiological literature reports on the incidence of lower limb amputations above the ankle (LLA-AAs) only,2,4,5 and as such, the rates of lower limb amputations below the ankle (LLA-BAs) or partial foot amputations (PFAs) are inadequately reported as previously described in the literature. 15
The incidence of PFAs is inadequately reported given that some studies do not count amputation procedures distal to the tarsometatarsal, 7 transmetatarsal 16 or metatarsophalangeal joints. 9 Moreover, studies often pool data on the number of amputation procedures into a single, lower limb group,1,6,7,10,11 limiting their comprehensiveness and utility. When one considered that amputation of the toe(s), as a discrete group, accounted for over 40% of all LLAs in studies with this level of detail,12–14 the scale of the underreporting becomes apparent.
Accurate representation of the number of amputation procedures, by level, is important. It has been contended that as specialist care improves, the incidence of LLA-BAs is expected to rise, while LLA-AAs fall.15,17 Unfortunately, given the way data on the incidence of LLA have typically been presented in the literature, we do not know whether this thesis is true. If true, an increasing incidence of LLA-BAs has profound implications in terms of how we judge the success of our efforts to reduce LLA and highlights the need to plan for increased specialist health services (e.g. high-risk foot clinics), particularly when you consider that persons with LLA-BAs experience disproportionately high rates of complications18–20 and secondary amputation compared to those with LLA-AAs.18,21,22 The aim of this investigation was to describe population-wide trends in the incidence of all levels of LLAs in Australian hospitals over a 10-year period between 1 July 2000 and 30 June 2010, and in doing so, determine the effect of accounting for PFAs.
Method
Data source
Data for this investigation were extracted from the Australian National Hospital Morbidity database. 23 The database is compiled by the Australian Institute of Health and Welfare from electronic, de-identified records for each episode of care in almost all public and private hospitals in Australia. 23 Data are made publicly available in the form of Procedures Data Cubes 24 and presented from 1 July to 30 June of the following calendar year. As such, the 2000–2001 period, as it is described in the database and in this publication, includes data from 1 July 2000 to 30 June 2001.
The Australian National Hospital Morbidity database has rigorous data collection procedures to ensure data accuracy. The National Health Data Dictionary definitions form the basis of the database, ensuring a high standard of data comparability. 23 The Australian Institute of Health and Welfare undertakes extensive validations on receipt of data from state and territory health authorities, and potential errors are queried with jurisdictions. Corrections and resubmissions may be made in response to these queries. 25 Additional drivers for appropriate coding and counting are the reimbursement system for surgical procedures and regular internal coding audits by each hospital. The reliability and accuracy of datasets for LLA procedures have been shown in two separate investigations;26,27 one including persons with LLA-BAs. 27 While these observations do not exclude the possibility of some procedures being missed or miscoded, it does engender confidence that there is no systematic error of miscounting or miscoding.
All surgical procedures included in the database are coded according to Australian Modification of the International Classification of Diseases, 10th Revision (ICD-10-AM) (2000–2001 to 2001–2002) and Australian Classification of Health Interventions (ICD-10-AM-ACHI) (3rd to 6th editions) for the years 2002–2003 to 2009–2010. 23 The ICD-10-AM-ACHI is the national standard for procedure and intervention coding in Australian hospitals. There are some differences in the coding of procedures over the years of these data and the newer editions, for example, incorporation of knee and ankle disarticulation procedures as entities (2002–2003 onwards). While reporting these data using International Standards Organization (ISO) descriptors may be preferable, it was not possible given differences to the ICD upon which the database is built. To facilitate comparison between these different classification systems, we have included the ISO descriptor alongside that of the ICD-10-AM-ACHI in Table 1.
ICD-10-AM codes identifying lower limb amputation as well as the ISO standard descriptor.
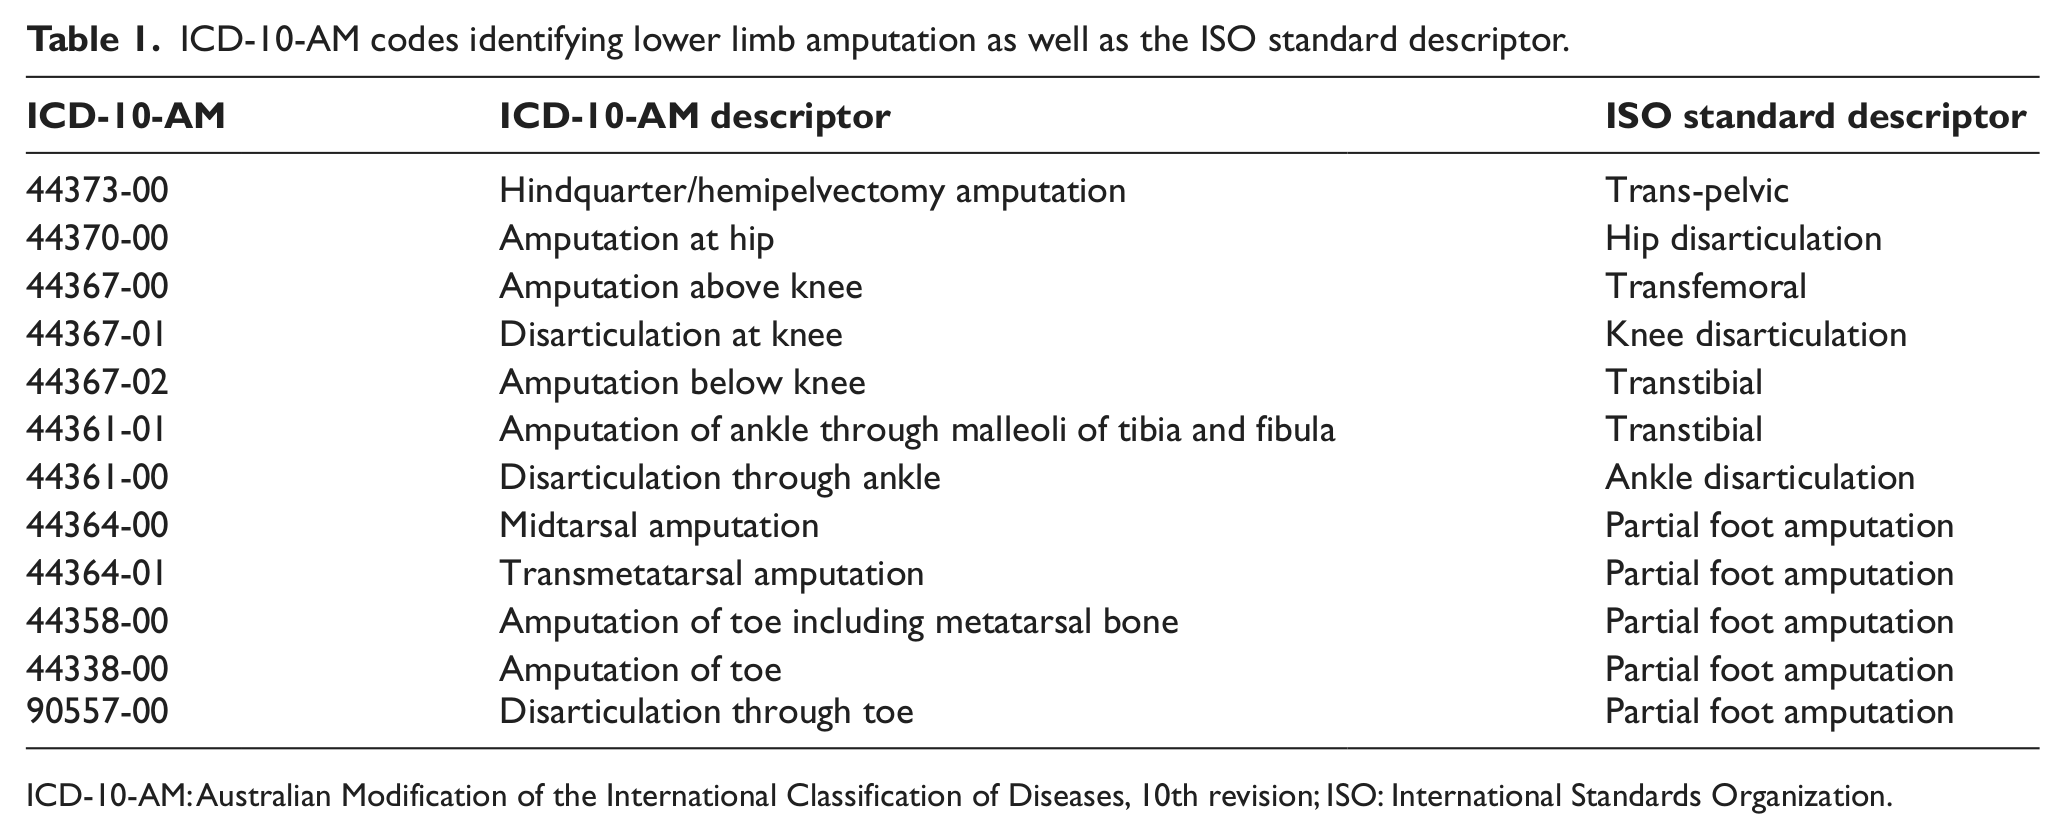
ICD-10-AM: Australian Modification of the International Classification of Diseases, 10th revision; ISO: International Standards Organization.
These data describe the total number of amputation procedures, and as such, there is no ability to delineate the first and subsequent procedures on the same limb or separate data by the number of persons affected. Auto-amputations are not recorded in the Australian National Hospital Morbidity database as these are not considered surgical procedures.
For the purpose of this investigation, the term LLA means all amputation procedures identified in Table 1. LLA-AA denotes all amputations at or proximal to the level of ankle disarticulation (ICD-10-AM code: 44361-00). LLA-BA was considered any amputation at or distal to the midtarsal level (ICD-10-AM code: 44364-00).
Data extraction
Data describing the number of amputations per age category were manually extracted from the Australian National Hospital Morbidity database 23 through the public portal for Procedures Data Cubes. 24 Data were entered into a Microsoft Excel spread sheet and subsequently cross-checked against the Procedures Data Cubes themselves.
There was an anomaly in the Procedures Data Cubes that made it impossible to separate data for the ICD-10-AM codes: 44370 – amputation at the hip from 44373-00 – hindquarter amputation in the 2000–2001, 2001–2003, 2004–2005 and 2005–2006 years, and as such, data in these categories were subsequently pooled to provide a common categorisation across the time series. Given that these categories, combined, represented less than half of 1% of all LLAs across the data collection period, it did not affect the fidelity of the data given the purpose of this study. Data on Australia’s population were extracted from the Australian Demographic Statistics reports. 28
Data analysis
Descriptive statistics were prepared using Microsoft Excel (version 14.0). Data describing the absolute number of amputation procedures – by amputation level – have been presented in Appendix 1. These data describe that transfemoral, transtibial and PFAs account for 99% of all LLA procedures across the data collection period. Data for the remaining amputation levels represented only a tiny proportion of all LLA procedures with little variation in the data from year to year (Appendix 1), and as such, subsequent descriptive analysis will consider these data collectively as other amputations.
Data on the absolute number of amputation procedures were expressed as age-standardised incidence (per 100,000 head of population). The high–low amputation ratio – the ratio of LLA-AA to PFA – was calculated as a metric of the change in the proportion of PFAs over time. 29
Trends in the number of amputations performed each year were described using a standard linear regression technique 30 where the analysis of variance of regression was used to determine whether the trend in the number of amputations (or incidence) over time occurred by chance. 30 These inferential statistics were calculated using IBM SPSS Statistics 20 (IBM Corporation, Armonk, NY, USA).
Results
Overall number of LLAs
The absolute number of LLA procedures in Australian hospitals increased from 2000–2001 to 2009–2010 (Figure 1(a)). Linear regression showed a significant, positive, relationship between time (years) and the absolute number of LLAs per annum (F(1, 9) = 29.37; p = 0.001), such that each year, the absolute number of LLAs increased by about 116 procedures (b = 116.42). Acknowledging the typical year-to-year variation, the absolute number of LLAs has risen by about 14% from around 7000 per annum to 8000 per annum over a 10-year period (Appendix 1). The age-standardised incidence remained constant over time (F(1, 9) = 0.093; p = 0.768) at 37.41 ± 1.01 procedures per 100,000 head of population per annum (Figure 1(b)).
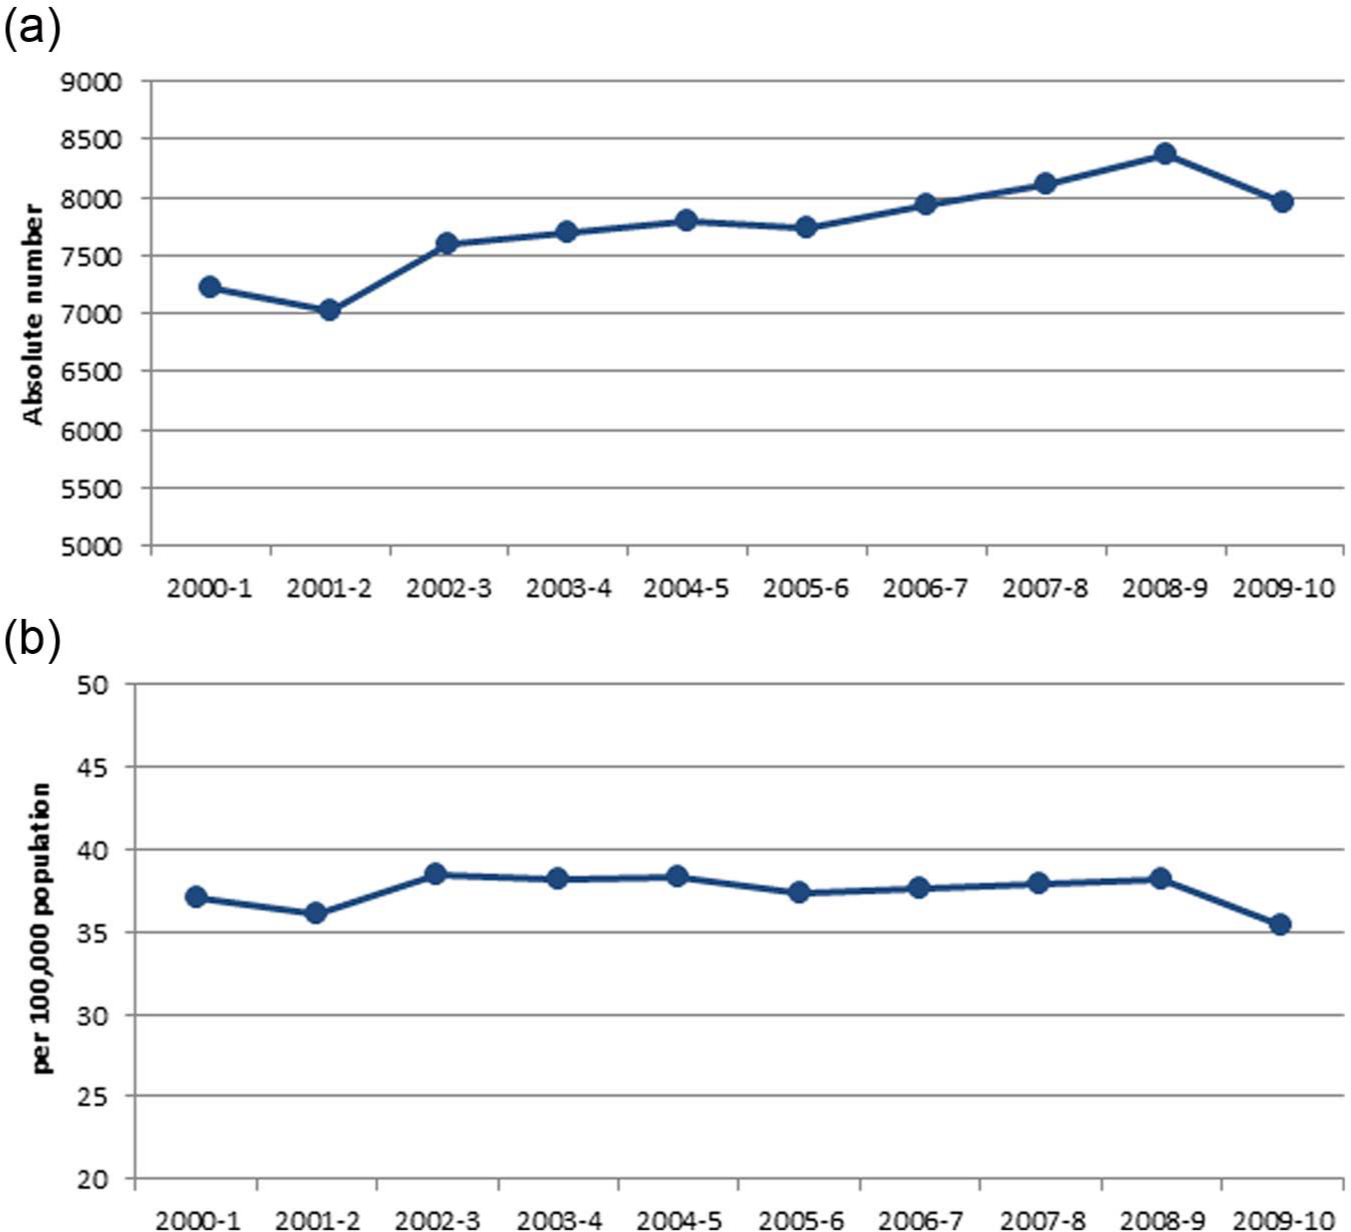
(a) The absolute number of lower limb amputations in Australian hospitals per annum from 2000–2001 to 2009–2010. (b) Age-standardised incidence of lower limb amputations (per 100,000 head of population) from 2000–2001 to 2009–2010.
Breakdown by amputation level
When the incidence of LLAs was described relative to amputation level, it can be seen that PFA accounts for the overwhelming majority of lower limb procedures (Figure 2). To use data from the 2009–2010 year as an illustrative example, the age-standardised incidence of PFAs was 25 per 100,000 head of population, some 5 times the incidence of transtibial and 6 times the incidence of transfemoral amputations (Appendix 2).
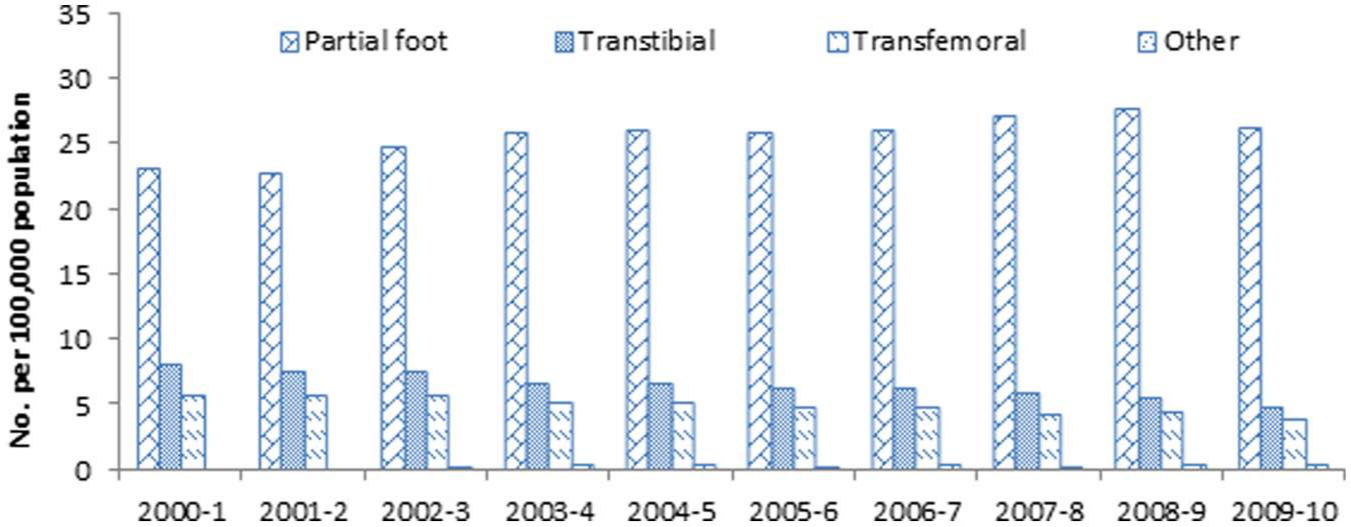
Age-standardised incidence of lower limb amputations in Australian hospitals by level of amputation.
The age-standardised incidence of transtibial and transfemoral amputations has declined over time (Figure 3(a)). Linear regression showed a significant, negative relationship between time (years) and the incidence of LLA for both the transtibial (F(1, 9) = 155.2; p = 0.00) and transfemoral populations (F(1, 9) = 172.6; p = 0.00). Over the time course of the data, the age-standardised incidence of transfemoral and transtibial amputation has declined by 33% and 40%, respectively (Appendix 2). The incidence of other amputations (e.g. hip disarticulations, Syme’s amputations) remained constant over time (F(1, 9) = 0.37; p = 0.565).
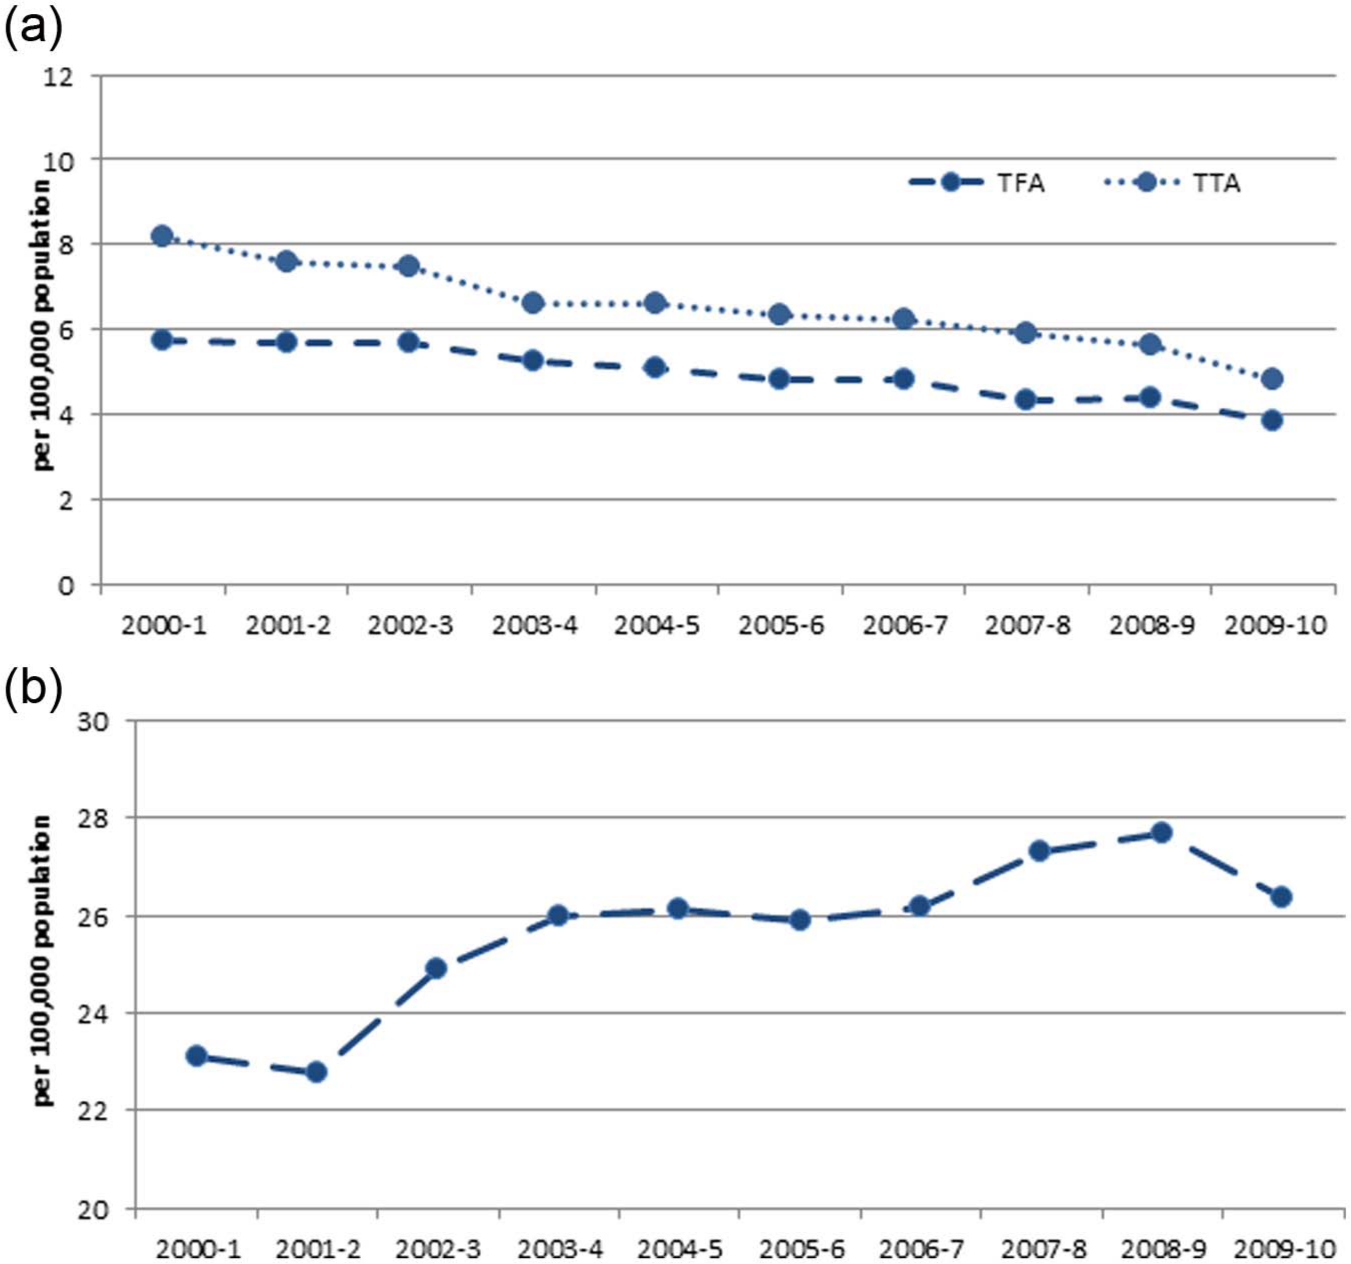
(a) Age-standardised incidence of transfemoral and transtibial amputations in Australian hospitals between 2000–2001 and 2009–2010. (b) Age-standardised incidence of partial foot amputations in Australian hospitals between 2000–2001 and 2009–2010.
The incidence of PFAs increased over the time course of the data (Figure 3(b)). Linear regression showed a significant, positive relationship between time (years) and the incidence of PFAs (F(1, 9) = 23.4; p = 0.001) such that every 2 years saw one additional PFA per 100,000 head of population (b = 0.460). In absolute terms, this equates to an increase of some 184 PFAs per annum (b = 183.9) based on a linear regression between time (years) and the number of PFA procedures per annum (F(1, 9) = 122.7; p = 0.000).
Breakdown by level of PFA
Over the years of the study, the proportion of amputations at the partial foot level has grown, while the proportion at the transtibial and transfemoral levels has reduced (Figure 4). The high–low ratio has changed markedly over the course of the data series from 0.61 to 0.34 across the 2000–2001 to 2009–2010 years such that now, there are three PFAs to every one LLA-AA (Figure 4). To use data from the 2009–2010 year as a case in point, PFA accounted for 74.72% of all LLAs followed by transtibial (13.56%) and transfemoral (10.77%), with all other amputation levels accounting for just below 1%.
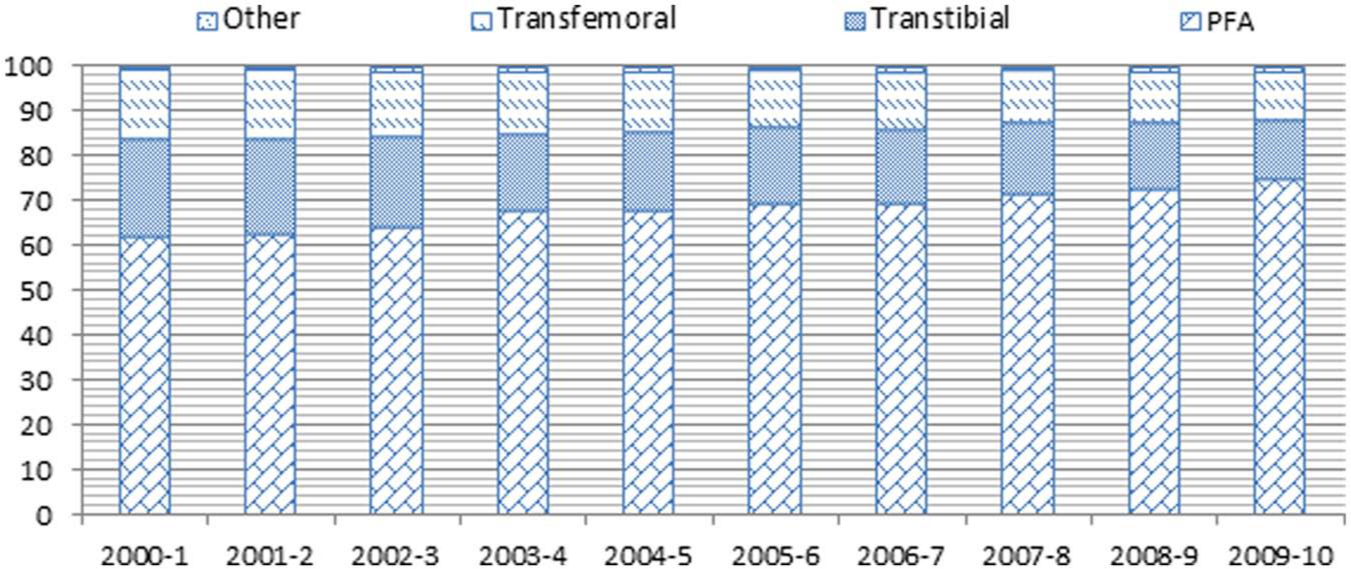
Proportion of lower limb amputations in Australian hospitals from 2000–2001 to 2009–2010 by amputation level.
The majority of PFAs are relatively distal with amputation of the toe and toe including metatarsal accounting for more than 90% of all PFAs (Figure 5). Over time, the age-standardised incidence of toe amputation has remained constant (F(1, 9) = 3.00; p = 0.121), while the number of procedures at the toe and metatarsal (F(1, 9) = 72.96; p = 0.000) as well as the transmetatarsal levels has increased (F(1, 9) = 9.79; p = 0.014). There was no significant change in the incidence of midtarsal (F(1, 9) = 0.641; p = 0.447) amputation (Figure 5).
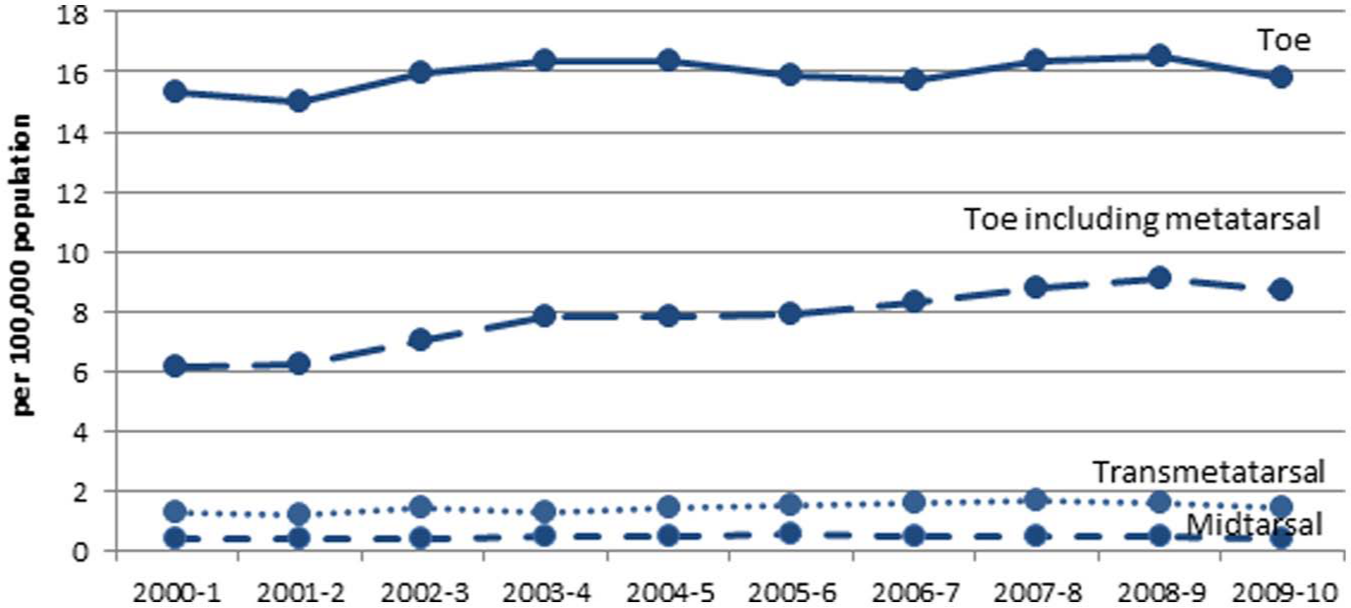
Age-standardised incidence of different levels of partial foot amputation between 2000–2001 and 2009–2010.
Discussion
The results of this investigation highlight that while the absolute number of LLAs has increased linearly over the time period of this investigation (Figure 1(a)), the incidence has remained constant (Figure 1(b)). On this basis, it could be argued that targets to significantly reduce the incidence of LLA as outlined in the St Vincent Declaration 31 or the Australian National Diabetes Strategy and Implementation Plan 32 have not been achieved.
While we have not observed a reduction in LLAs given the significant increase in the incidence of PFAs (Figure 3(b)), the marked decline in transtibial and transfemoral amputations was both noteworthy and significant (Figure 3(a)). The ratio of LLA-AAs to LLA-BAs has shifted over the time series such that three-quarters of all LLAs are now PFA procedures (Figure 4). Nearly all PFAs were of the toe(s) or toe(s) and metatarsal(s) (Figure 5). This can be viewed as a positive change in that persons who would once have had an LLA-AA are increasingly having a LLA-BA. It has been contended that reductions in the incidence of LLA-AAs are underpinned by a range of improved health-care practices: improved surgical techniques and training to revascularise the arterial structure of the lower limb and foot; improved antibiotic therapies to control ascending infection and septicaemia and introduction of high-risk foot clinics and improved wound/ulcer management. While it would be difficult to argue that these practices have not had a positive impact, it is likely that the reductions in LLA-AAs across this time series reflect a much longer term change in health practice with improved awareness and screening of diabetes and better monitoring and management of high blood glucose and lipid levels at a community level. As such, persons with late-stage complications may have less severe presentations that, combined with improved surgical options, drug interventions and the like, make PFA a viable alternative to LLA-AA.
Comparison to other literature is interesting. We observed that the incidence of all LLAs remained constant over time in keeping with methodologically similar investigations.9,12,33,34 Most investigators have sought to determine the incidence of amputation in populations at risk, and as such have reported the incidence of amputation in persons with diabetes relative to the total population of diabetics. This approach generally shows a decline in the incidence of LLA over time.1,6,13,14,35 When considered with respect to levels of amputation, the literature typically indicates that the incidence of LLA-AAs has declined,4,6,14,35 consistent with our observation. However, there were comparatively few investigations that reported time series data for persons with PFAs, and of those we did identify, their observations were quite disparate: a reduction in the rate over time, 14 no change34,35 or a small increase between the start and end of the time series typical of year-to-year variation reported. 8 No investigations reported a significant increase in the incidence of PFAs over time such as we observed.
Our observation that the incidence of PFAs is increasing in Australia reflects one of several notable differences when comparisons are drawn to the published literature. First, Australia’s incidence of PFAs is relatively high (28 PFAs per 100,000 head of population) compared to other investigations that describe the incidence of PFAs in single digits.8,35 Second, the ratio of LLA-AA to LLA-BA has declined significantly over time in comparison to the constant rate reported by the only other investigation reporting this outcome measure in a time series. 14 The high–low ratio (0.34) was relatively low in comparison to that reported in, or calculated from, most other investigations where figures ranged from 0.55 to nearly 1.14,29,34,36,37 Third, our observation that three-quarters of all LLAs are at the partial foot level – more than 90% of these involving amputation of toe(s) or toe and metatarsal – was in keeping with just one other investigation that focussed predominantly on the care of soldiers. 13
Unfortunately, there are an insufficient number of publications detailing the incidence of PFAs. It is difficult, therefore, to reconcile these differences between our observations and those reported in the published literature as simply the result of methodological variation such as inclusion of only persons with diabetic amputations,14,35 an almost exclusively Caucasian population,8,35 expressing incidence using the diabetic population as the denominator, 14 or counting amputations in close succession as one procedure.34,35 The last of these is likely to be the most significant source of discrepancy between our observations and previous literature, and as such, it will serve as a useful case-in-point. We know from existing literature that secondary amputation affects about one-third of persons with an initial PFA.18,21,22 Using data from this investigation and accounting for one-third of re-amputation rate involving persons with PFAs, we estimate that the incidence of PFAs in our study to be overstated – by 9 per 100,000 head of population – compared to other investigations.8,35 Acknowledging the significance of this methodological difference, it still accounts for only one-third of the difference between our observed rate of PFAs and that of other authors. While the methodological differences between our investigation and the published literature are likely to have played some part in the differing incidence and trends in PFAs, it must be acknowledged that the incidence of LLA is also influenced by the health-care systems and accepted norms of clinical practice. Decisions of when to continue with limb salvage or to proceed with amputation may evoke the complexity of the decisions involved and the potential for variability in clinical decision-making that has seen multi-fold differences in the incidence of LLA between and within countries.38,39 Similarly, minor forefoot amputation for osteomyelitis is considered routine practice in some countries and not in others. 17 Cultural sensitivities, social context and service availability may also contribute to differential rates and levels of amputation. We were unable to identify discrete examples of differences in practice between Australia and other countries that might explain the observed differences in the incidence of PFAs, and this would provide an avenue for further investigation.
It is interesting to note that the increase in the incidence of LLA-BAs described in this investigation is considerably less than that might be expected. When you consider that the incidence of diabetes has increased by about one-third over the time series of this investigation 40 and that three-quarters of all LLA-BAs are secondary to diabetes, 41 we might expect the incidence to have risen by up to 25% over the time series – nearly double what was actually observed. A more detailed epidemiological study would be required to understand the influence of diabetes, and other factors, on the changing incidence of amputation in Australia, and this would provide an avenue for future work. The increasing incidence of PFAs observed in our investigation is of particular concern given high rate of complications18,21,22,42 and secondary amputation on the same limb18,21,22 that will increase as the number of PFAs increases too. Even at the very crude monetary level, the implications are staggering when you consider that the direct costs have been estimated in excess of 26,700 AUD per minor procedure, and when the costs of outpatient and home care are included, this figure doubles.43,44
Our observations have wide ranging implications. It could be contended that the number of beds required for inpatient rehabilitation programmes as well as the provision of prosthetic services associated with LLA-AAs will continue to decline in the short term. By logical extension, the demand for specialist services – high-risk foot clinics, wound care expertise – will grow as the number of PFAs increase. As the work of clinicians shifts to include greater proportions of persons with PFAs, there will be a growing need for specialised education and training. Organisations providing training to health professionals will need to be mindful of these trends and the changing patient requirements when designing curriculum to meet the future challenges of practice. Referral practices will need to improve to recognise the very high risk of complications experienced by persons with PFAs – even those with minor foot amputations – and improve access to publicly funded specialist services; 45 particularly for Indigenous Australians. 46
Limitations
There are a number of limitations to this investigation and the results should be interpreted in light of these. While our definition of LLA-AA and LLA-BA may be consistent with the International Standards Organisation, 47 it does differ from a number of works.7,9,16,48 We have been explicit in describing our definition of the amputation procedures in the ‘Method’ section and utilised the ISO standard and ICD-10-AM in parallel so investigators can compare studies with like definitions. Further resolution of differing terminologies could be achieved by collaboration with the World Health Organization in the development of the ICD-11.
Our data described the number of amputation procedures. The number of persons involved will be fewer given that a proportion of persons will have undergone more than one amputation. We hope to have contextualised this limitation as part of our discussion and thereby facilitate comparison between investigations.
This article does not account for auto-amputations given these were not recorded as a surgical procedure in the Australian National Hospital Morbidity database. Describing the incidence of this amputation is difficult without routine collection and reporting of these data.
It may be considered a limitation that we did not extend the analysis to estimate the incidence of amputation in the future. We were deliberate in not including this sort of analysis given the short time period over which the prediction would have been based, the rapidly changing models of chronic disease management and the uncertainty that comes with assumptions about population growth and treatment practices into the future. While the current trends will likely hold true in the short term, we do not believe that the incidence of LLA-AAs will continue to decline linearly in the longer term. A more reasonable expectation is that the declining incidence in LLA-AAs will plateau at some point. How the trends in PFAs will change in the long term seems less certain.
Footnotes
Appendix
Age-standardised incidence of lower limb amputations from 2000–2001 to 2009–2010.
| ICD-10-AM | Level | 2000–2001 | 2001–2002 | 2002–2003 | 2003–2004 | 2004–2005 | 2005–2006 | 2006–2007 | 2007–2008 | 2008–2009 | 2009–2010 |
|---|---|---|---|---|---|---|---|---|---|---|---|
| 44370-00/44373-00 | Amputation hip or hindquarter | 0.15 | 0.14 | 0.13 | 0.09 | 0.14 | 0.07 | 0.16 | 0.12 | 0.14 | 0.15 |
| 44367-00 | Transfemoral | 5.76 | 5.70 | 5.67 | 5.28 | 5.11 | 4.84 | 4.83 | 4.35 | 4.42 | 3.83 |
| 44367-01 | Knee disarticulation | 0.20 | 0.17 | 0.17 | 0.14 | 0.18 | 0.14 | 0.15 | 0.13 | ||
| 44367-02 | Transtibial | 8.19 | 7.59 | 7.49 | 6.61 | 6.62 | 6.34 | 6.25 | 5.93 | 5.64 | 4.83 |
| 44361-00 | Disarticulation through ankle | 0.05 | 0.09 | 0.06 | 0.04 | 0.06 | 0.07 | 0.05 | 0.04 | ||
| 44364-00 | Midtarsal | 0.39 | 0.40 | 0.41 | 0.42 | 0.42 | 0.53 | 0.43 | 0.47 | 0.46 | 0.37 |
| 44364-01 | Transmetatarsal | 1.23 | 1.13 | 1.39 | 1.23 | 1.37 | 1.46 | 1.59 | 1.64 | 1.54 | 1.39 |
| 44358-00 | Amputation of toe including metatarsal | 6.11 | 6.20 | 6.98 | 7.84 | 7.78 | 7.91 | 8.25 | 8.73 | 9.06 | 8.66 |
| 44338-00 | Amputation of toe | 15.35 | 15.02 | 15.98 | 16.34 | 16.39 | 15.87 | 15.69 | 16.35 | 16.51 | 15.80 |
| 90557-00 | Disarticulation through toe | 0.16 | 0.15 | 0.16 | 0.13 | 0.18 | 0.10 | 0.10 | 0.12 |
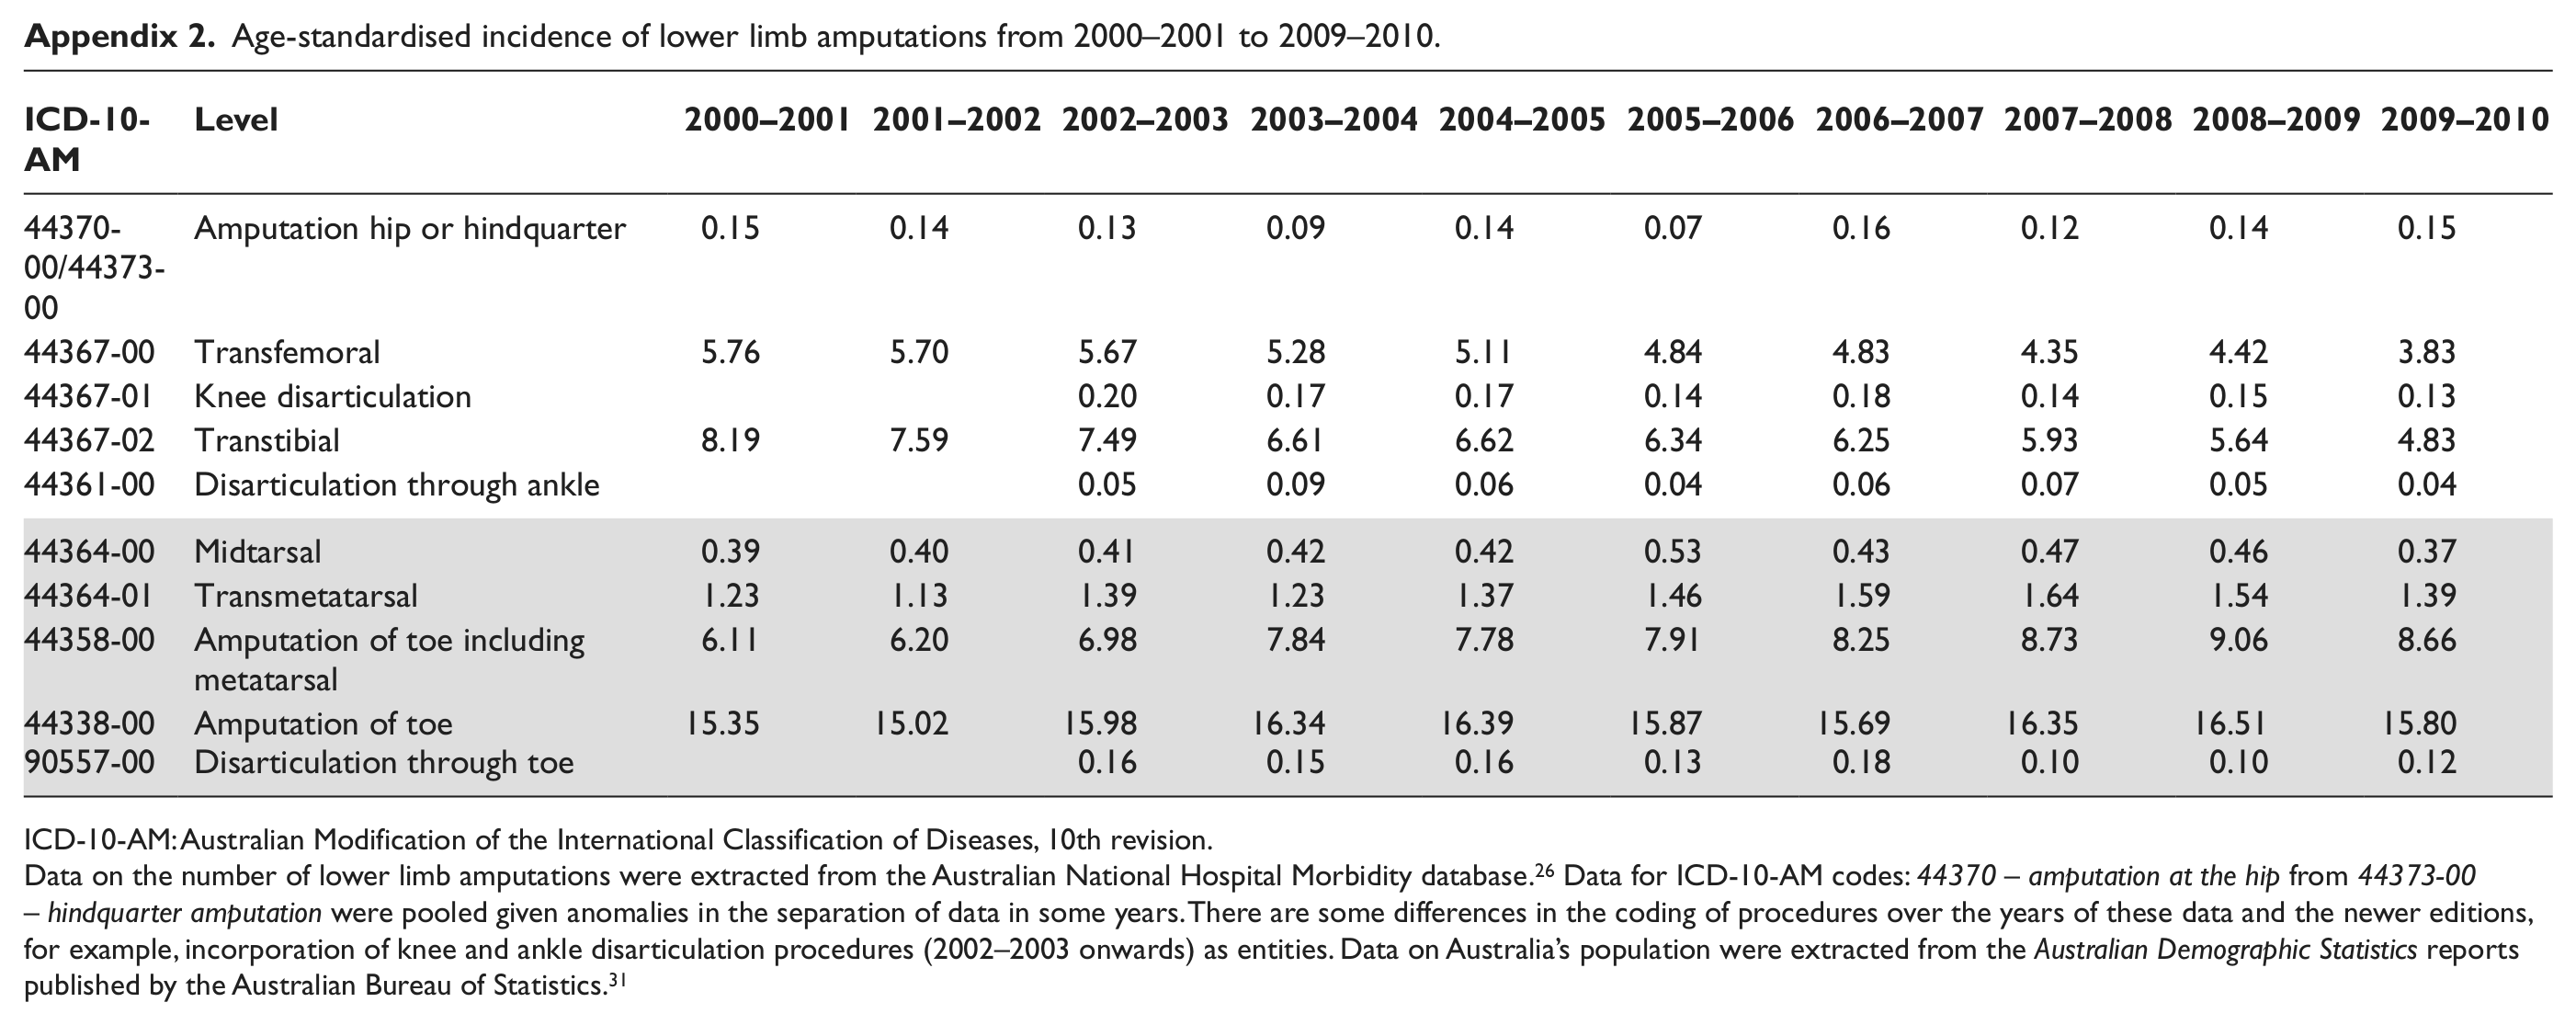
ICD-10-AM: Australian Modification of the International Classification of Diseases, 10th revision.
Data on the number of lower limb amputations were extracted from the Australian National Hospital Morbidity database. 26 Data for ICD-10-AM codes: 44370 – amputation at the hip from 44373-00 – hindquarter amputation were pooled given anomalies in the separation of data in some years. There are some differences in the coding of procedures over the years of these data and the newer editions, for example, incorporation of knee and ankle disarticulation procedures (2002–2003 onwards) as entities. Data on Australia’s population were extracted from the Australian Demographic Statistics reports published by the Australian Bureau of Statistics. 31
Acknowledgements
The authors wish to acknowledge the assistance of Associate Research Professor Stefania Fatone and Mr Harvey Blackney for their thoughtful reviews of the manuscript.
Conflict of interest
None declared.
Funding
This research received no specific grant from any funding agency in the public, commercial or not-for-profit sectors.