
Abstract
This paper analyses the research and teaching performance of the teaching staff of the Integrated Master in Mechanical Engineering (MIEM) at the Faculty of Engineering of the University of Porto (FEUP). Performance in the two strands of professional activity is measured by the number of publications authored by the individuals and their impact on the scientific community, and by the marks receive from the students through pedagogic questionnaires (PQs). The teaching staff includes all permanent elements involved in MIEM curricular units (CU), with the exception of those teaching just the CU Dissertation. The set has 74 professionals, with 62 from the Department of Mechanical Engineering. The staff bibliographic data are public and were collected from the Scopus database at the end of September, 2021. The PQs data are classified and were provided to the cycle of studies Board by FEUP” Sigarra administrative office. Data for all CUs were considered, with the exception of Dissertation, in a per semester basis, for the period 2016–2017 up to 2020–2021. The methodology consists of (i) processing and analyzing, separately, the datasets collected from Scopus and Sigarra to obtain statistical figures characterizing both areas of activity, and (ii) testing the research and teaching information to find out whether or not those data are correlated. The results show that the MIEM teaching staff has good publication rating, with (i) group h-index 117, (ii) 4 publications per capita in 2020, (iii) 23% owing more than 100 and 9% more than 200 works published, (iv) 22% having more than 1500 and 11% more than 3000 citations, and (iv) 19% holding h-index greater than 24 and 7% greater than 40. However, the distributions of research indicators are uneven, with (i) 50% of the staff contributing merely with 10% of the publications, (ii) 41% having less than 300 citations, and (iii) 43% holding h-index below 10. With respect to teaching, the MIEM staff is highly appreciated by the students. The average score over the period 2016–2020 is close to 5.3 points out of 7, with 19% receiving more than 6.0 and 51% more than 5.3. The scores are evenly distributed, with just 4% individuals rated below 4.0. Finally, it was found that the research and teaching data are not correlated (Pearson correlation coefficient less than 0.1), which strengthens the idea that all elements of the teaching staff can potentially be good on both components of activity, possibly, just needing appropriate stimuli and recognition.
Introduction
The Portuguese legislation that regulates the profession of university teacher is clear when it states that the duties of teachers include: (i) to carry out scientific research and technological development; (ii) to provide teaching service and to supervise students; (iii) to participate in university extension, scientific dissemination and economic and social valorization of knowledge; and (iv) to participate in the management of the institutions. The individual achievements on the first two points, generically referred to as research and teaching, are those that have the greatest visibility and impact on the evaluation processes of teachers and, consequently, institutions.
Normally, any teaching staff includes elements with different skills that translate into greater or lesser ability to do research and to teach, and many opinions sustain that those who are good on research tend to be weaker on their pedagogical duties and vice-versa. However, this judgement is debatable and many distinct cases may coexist.
A key issue that arises when trying to assess the teaching staff of a given cycle of studies (CS) is how to measure the performance of the individuals objectively. Indeed, the criteria adopted are often diverse and the weighs used for each item vary according to the end purpose. For instance, for career promotion in Portuguese Universities, the scientific component assessment weighs (i) the quantity and quality of bibliographic production, expressed by the number and type of publications (e.g., books, articles, and publications in conferences) and by the recognition that the publications obtained from the scientific community (e.g., the ranking of the journals that published the articles, and the number of citations that the publications received), (ii) the quality and quantity of scientific projects financed on a competitive basis by public funds, national or international agencies, and companies, as well as the results obtained, (iii) the number of scientific teams organized and led, as well as post-doc, doc and master's students supervised, and (iv) the ability to intervene in the scientific and professional communities, namely through the collaboration in the edition of journals, the presentation of invited lectures and the participation in academic juries in other institutions. On the other hand, the pedagogic strand of activity accounts on (i) the quantity of new pedagogical projects, coordinated and promoted (e.g., development of new curricular unit (CU) programs, creation and coordination of new CSs or new CUs), or reform and improvement of existing projects (e.g., reformulation of existing CUs, and participation in the reorganization of either CSs or CUs), (ii) the number of projects with impact on teaching/learning processes developed, as well as the participation in accreditation or certification procedures, (iii) the quality and quantity of pedagogical material produced, as well as the number of pedagogical publications in prestigious international journals and conferences, and (iv) the quality of the teaching activity carried out by the teachers measured, whenever possible, by objective methods based on broad opinion surveys (e.g., pedagogic questionnaires (PQ)). However, any assessment process of people is complex and involves delicate issues, and the topic has been widely investigated.1–7 Often, the adoption of metrics simplifies the procedures, and seems to improve objectivity. Nevertheless, the fairness of the formulae behind those metrics is also debatable, and they may be unable to capture all aspects of interest to the assessment processes, which are inherently multidimensional.
The h-index was introduced in 2005 by Hirsch 8 to quantify the scientific performance of researchers. 9 An individual holds an h-index of value h, when h is the largest integer such that his/her h most cited publications have at least h citations each. The h-index incorporates in a single-number information on both the visibility and quantity of publications,10,11 and is robust to high and low cited bibliographic items.12–14 Nevertheless, the h-index tends to filter out the multidimensional nature of the citation profiles (CP), 11 does not differentiate between inactive and active researchers,15,16 is too sensitive to long careers and to discipline-specific CP,17,18 and has difficulties to reflect co-authorship. 19 These drawbacks have led to the proposal of alternative measures to assess scientific performance, more effectively and fairly.20–24
Students” PQs were introduced in the 1920's decade to provide feedback on teaching activities to academics. Nowadays, PQs are in practice in many universities and their results are used with different purposes, such as for summative and formative assessment, to guide teachers” teaching practices, and to advise decision makers.25–27 The PQs reliability, validity and usefulness to identify either good teaching practices or good teachers were the main foci of interest of researchers for several years.28,29 Richardson 25 determined that, despite their potential to afford information to academics, students and managers, PQs were not taken seriously enough neither by staff nor by institutions due to the high level of kindness revealed by students in their answers. On the other hand, even passing through rigorous design and application processes, PQs results are often not communicated to students in a timely or useful way, and seldom led to recommendations for teachers. Marsh 30 reported five important purposes of the PQs, namely (i) a feedback tool to inform teachers about the effectiveness of their teaching, (ii) a measure to quantify teaching quality and to guide decisions related with appointment and promotion, (iii) a source of information to help students to select CUs and teachers, (iv) an element for use in quality assurance procedures, and (v) a source of data useful for research. Moreover, the author concluded that PQs are reliable, stable, robust to sources of potential biases, and useful in improving teaching performance, as long as they are designed and used accurately. In the last years, researchers raised a number of concerns related to PQs, all agreeing on the idea that PQs should be considered just as one element of highly comprehensive procedures aimed at impartial and equitable assessment and teachers. 30 Temple 31 found that, despite the proven value of PQs for quality assurance, there was little evidence that PQs information was really used to improve students” learning experiences. Arthur 32 concluded that teachers do not have great sympathy for PQs, but they are ready to accept and respond fast to the signs they convey. Other recent studies addressed a number of PQs related questions, such as students” happiness, causes of potential biases, 33 impact of technology on surveys application, 34 survey exhaustion and measures for raising response rates, 35 and design, content, validity and reliability. 36 Indeed, these are key issues and several methods have been investigated for handling them properly.37,38 For instance, it was shown that smaller class sizes tend to be associated with better teaching assessment, but some contradictory results have been also reported.39,40 Miscellaneous results were also obtained when relating PQs results and course grade.41,42 Some researchers suggested that the time and date of a course could affect PQs results. 43 Moreover, other aspects, like the type of classes taught and the physical appearance of the teachers may be relevant in the PQs marks. Indeed, laboratorial classes and most physical appealing teachers tend to receive better grades.
To sum up, findings demonstrated that while students” feedback is appreciated and used by universities, PQs may lack validity and reliability, and the information they convey is often used inappropriately. Teachers should be assessed using procedures in which valid, reliable, multidimensional and useful students” feedback is just one out of several components. 27
This paper analyses the research and teaching performance of the teaching staff of the Integrated Master in Mechanical Engineering (MIEM) at the Faculty of Engineering of the University of Porto (FEUP). The main objective is to know if there is any correlation between research and teaching performance. MIEM was created in 2006/2007, following the European reform of higher education known as Bologna process. The MIEM main objective was to prepare students so that, after completing the CS, they could initiate a career in industry or research, in any area of mechanical engineering or related fields. The MIEM was a 5-year CS, combining a bachelor (3 years) and a master (2 years) degrees, deep-rooted in the long experience of FEUP, which goes back to the Polytechnic Academy of Porto created in 1885. The MIEM ceased in 2020/2021 by decision of the Portuguese Government took in 2019 to separate the integrated masters” degrees in two distinct CS: the bachelor (first CS) and the master (second CS).
In this work, research and teaching performance is measured by scientometrics extracted from the CP of the staff elements, and by the marks given to the staff by the students, through PQs. Naturally, the method does not capture all aspects of either research and teaching activities, but is totally objective, provided that the datasets used are accurate. Moreover, it should be pointed out that the criteria adopted embrace a significant part of the effort of faculty members in their daily activities and can be directly interpreted outside the academy. Further, the methods implemented can be viewed as an indirect way of extracting information useful for assessment of performance, although they are not intended for the establishing of rankings (e.g., in the context of promotion or merit assessment).
The teaching staff includes all permanent elements involved in MIEM, with the exception of those teaching just the CU Dissertation. The set has 74 professionals, with the majority (62) from the Department of Mechanical Engineering (DEMec). The staff bibliographic data are from the Scopus database, collected in September 29th, 2021. The PQs data are from FEUP” Sigarra administrative office. Data for all CUs are considered in a per semester basis, for the period 2016–2017 up to 2020–2021, with the exception of Dissertation and CUs with response rates below 10% of the students registered. The research methodology consists of (i) processing and analyzing the research and teaching datasets to obtain statistical figures able to characterize both strands of activity, and (ii) comparing the research and teaching information to determine possible correlations.
The rest of the paper is organized as follows. Section ‘The integrated master in mechanical engineering (MIEM)’ introduces the MIEM. Section ‘Characterization of the datasets’ characterizes the datasets used in the study. Section ‘Assessing the teaching staff’ assesses the teaching staff both in their research and teaching strands of professional activity. Sections ‘Correlating the research and pedagogic data’ compares the information to seek for possible correlations. Finally, Section ‘Conclusions’ presents the main conclusions.
The integrated master in mechanical engineering (MIEM)
The MIEM has its roots in 1885, the year of the reorganization of the Polytechnic Academy of Porto, and the creation of the degrees in Engineering of Public Works, Mines and Industry. The Mechanical Engineering degree and FEUP were born in 1915 and 1926, respectively. FEUP's DEMec was created, and assumed the charge for the five years of the Mechanical Engineering degree, in 1974. The reform of the European higher education system, commonly referred to as Bologna process, took place in 2006/2007,44–46 leading to the creation of MIEM as a combination of a bachelor (3 years) and master (2 years) into a single 5-year CS. The last reformulation of the MIEM programme took place in 2014/2015, yielding an organization into 10 semesters (www.fe.up.pt). At the end of the bachelor the objective was that the students had acquired solid scientific and engineering skills, as well as non-specialized knowledge in broad domains of Mechanical Engineering. At the end of the master the goal was that the graduates had expanded their level of skills, concentrating in one of five Mechanical Engineering scientific areas.47–50
The Portuguese Government decreed in 2019 the dissolution of all engineering integrated masters. The decision led to the reformulation of MIEM in 2020/2021 and the creation of two new, autonomous, bachelor and master CS. The reformulation process was concluded in September 2021 and the new CS started in 2021/2022. 48
Characterization of the datasets
The MIEM teaching staff includes 74 elements, 62 from DEMec, 11 from the Department of Industrial Engineering and Management (DEGI), and 1 from the Department of Electrical and Computer Engineering (DEEC). All elements involved on MIEM CUs were considered, with the exception of those teaching just the CU Dissertation (Figure 1).
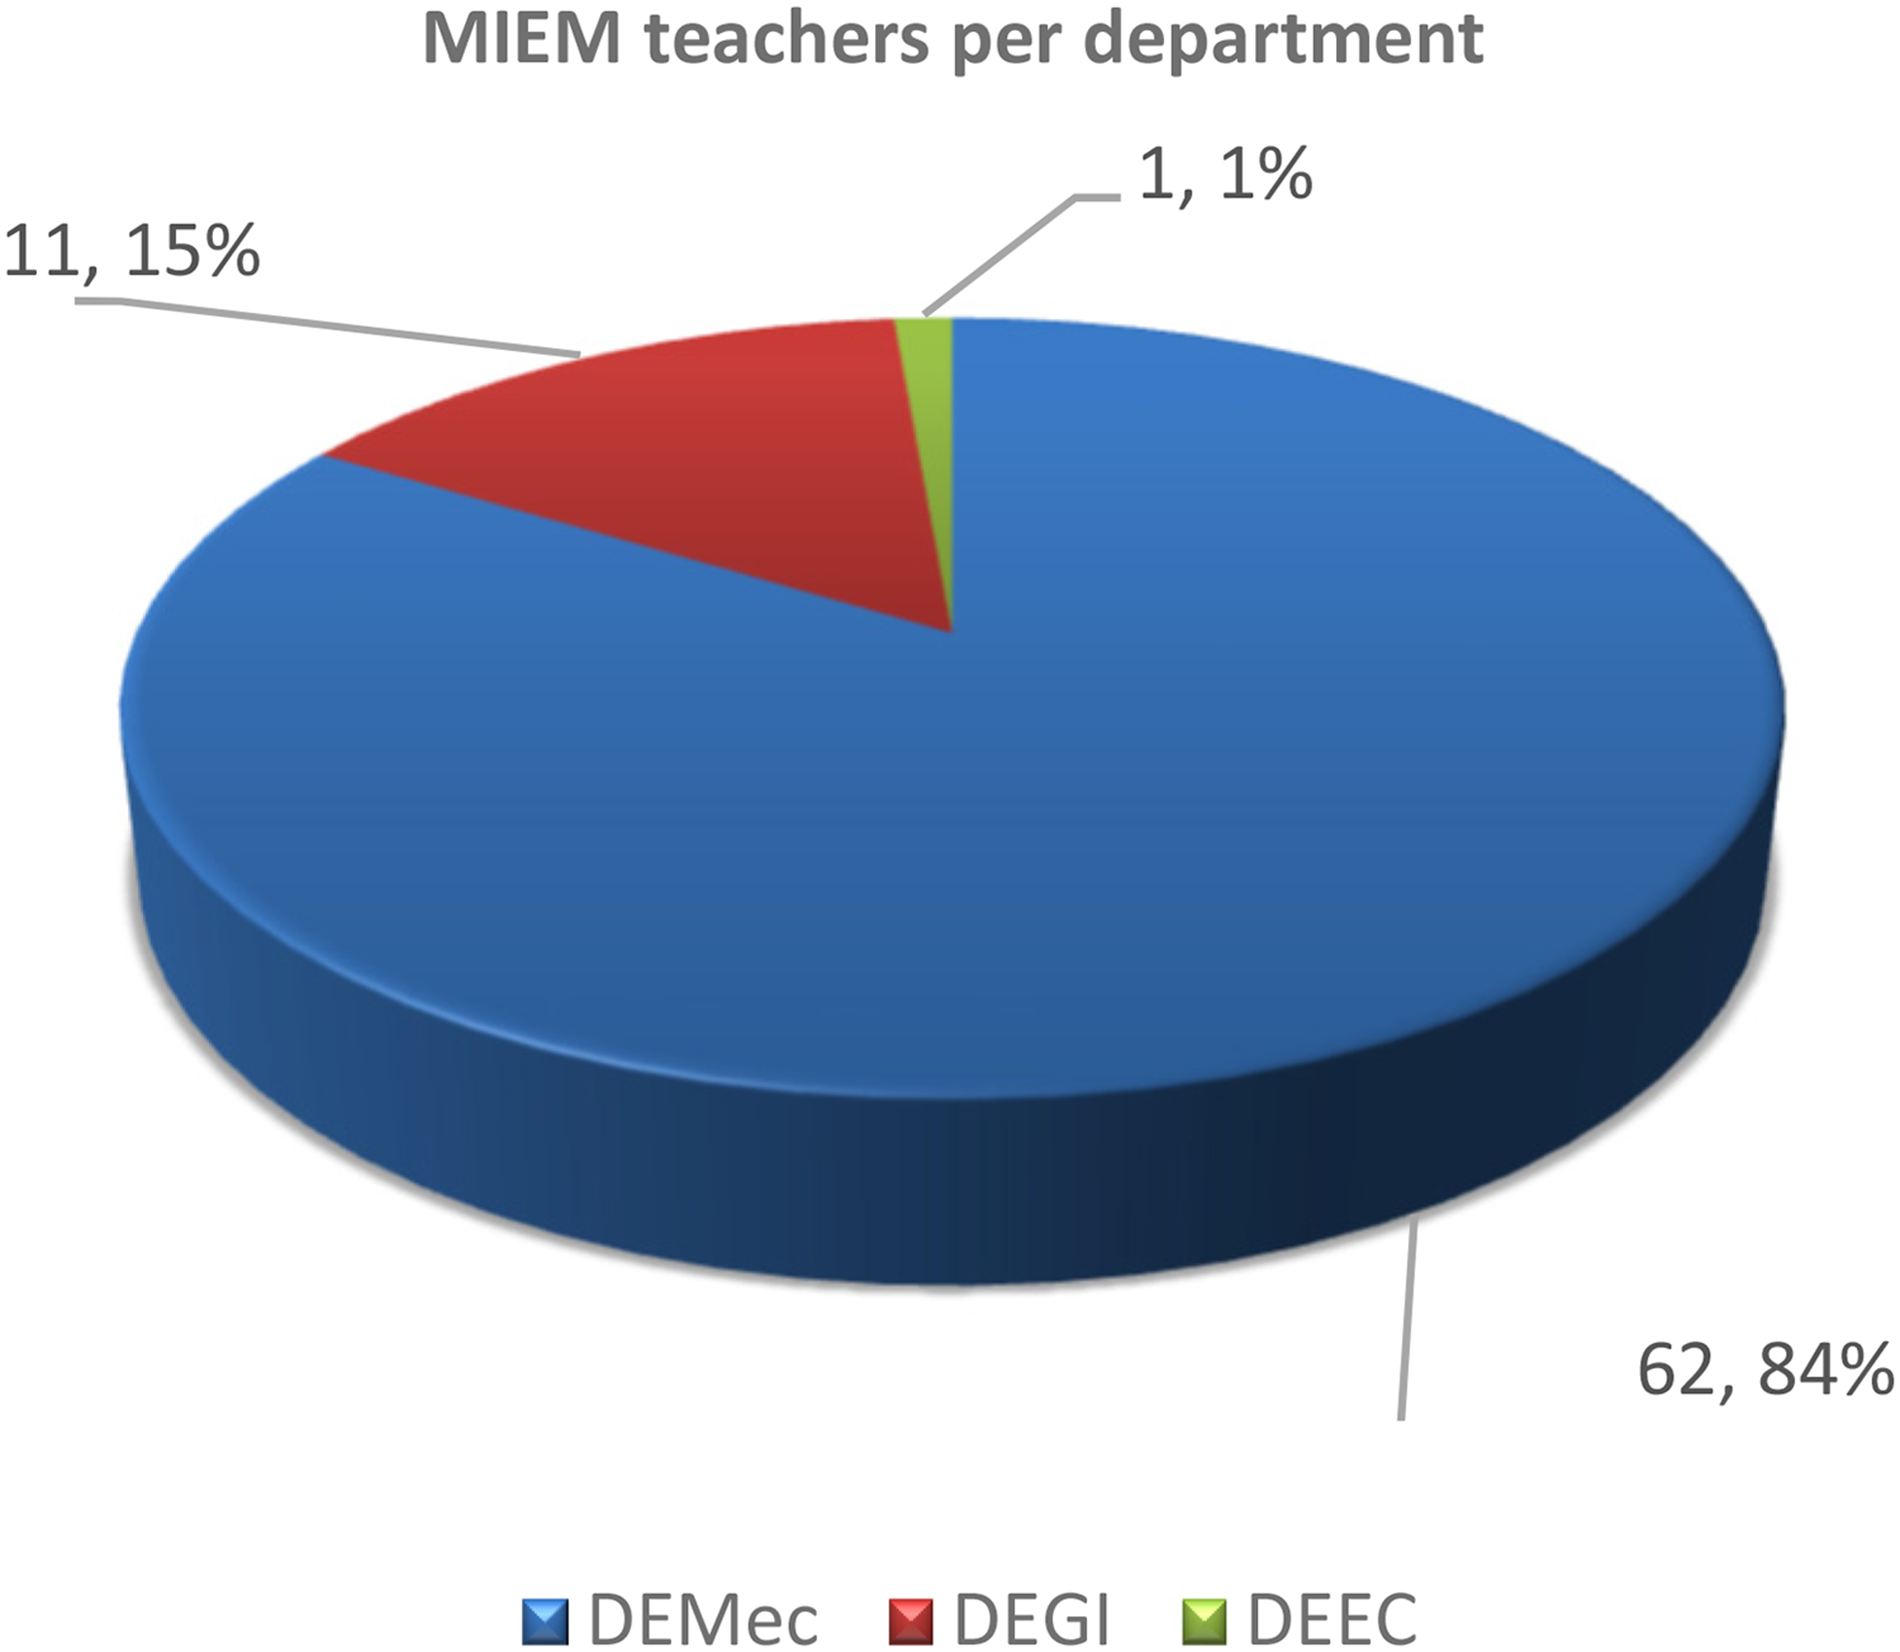
The distribution of the teaching staff per department.
Scientific dataset
Bibliographic data are available in several databases, such as Google Scholar (https://scholar.google.com), Clarivate Analytics” Web of Science (www.clarivate.com) and Elsevier's Scopus (www.scopus.com). Scopus is nowadays broadly accepted in scientometrics. Elsevier claims that Scopus database is currently the prime resource of peer-reviewed items, containing intelligent tools to analyse, visualize and track bibliographic research data. The database is updated regularly, and the sources covered are evaluated frequently.
The bibliographic data used in this paper correspond to the CPs of 74 individuals, retrieved on September 29th, 2021. The CPs are publicly available, include records for the period 1982–2020, and allow the determination of different indices to quantify scientific performance. Indeed, the formulation of new indices has been an active topic and many were proposed. In general, they present correlations between each other, but the question of knowing which index is the best for ranking CPs remains open. In this paper, to account for the multidimensional nature of the problem, the variables {number of publications, number of citations, h-index} are adopted.
Pedagogic dataset
The pedagogic data from the PQs are classified and were provided to the CS Board by the FEUP” administrative services of Sigarra. Data for all CUs are considered, with the exception of the CU Dissertation and those CUs with response rates below 10% of the target population, in a per semester basis, for the period 2016–2017 up to 2020–2021. This is to say, for 10 semesters.
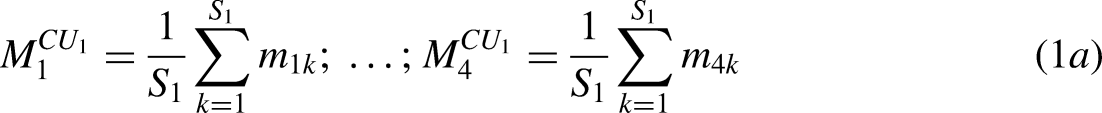
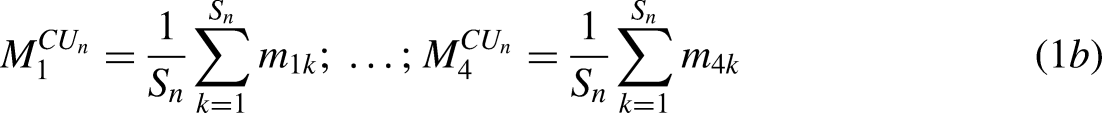
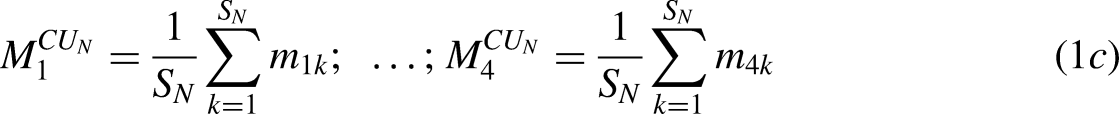
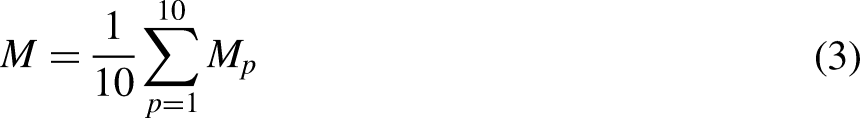
Consider that teacher x = 1, …, 74, in semester p = 1, …, 10, teaches N distinct CUs, namely {CU1, …, CU
n
, …, CU
N
}. Each student k = 1, …, Sn who fills in the PQ of the nth CU, with Sn denoting the total number of students, attributes the marks {


Assessing the teaching staff
The methodology adopted to assess the research and teaching performance of the MIEM teaching staff involves two main steps, specifically (i) processing and analyzing, separately, the data collected from Scopus and Sigarra to obtain statistical figures characterizing both areas of professional activity, and (ii) comparing the research and teaching information to find out whether or not those data are correlated (Figure 2).
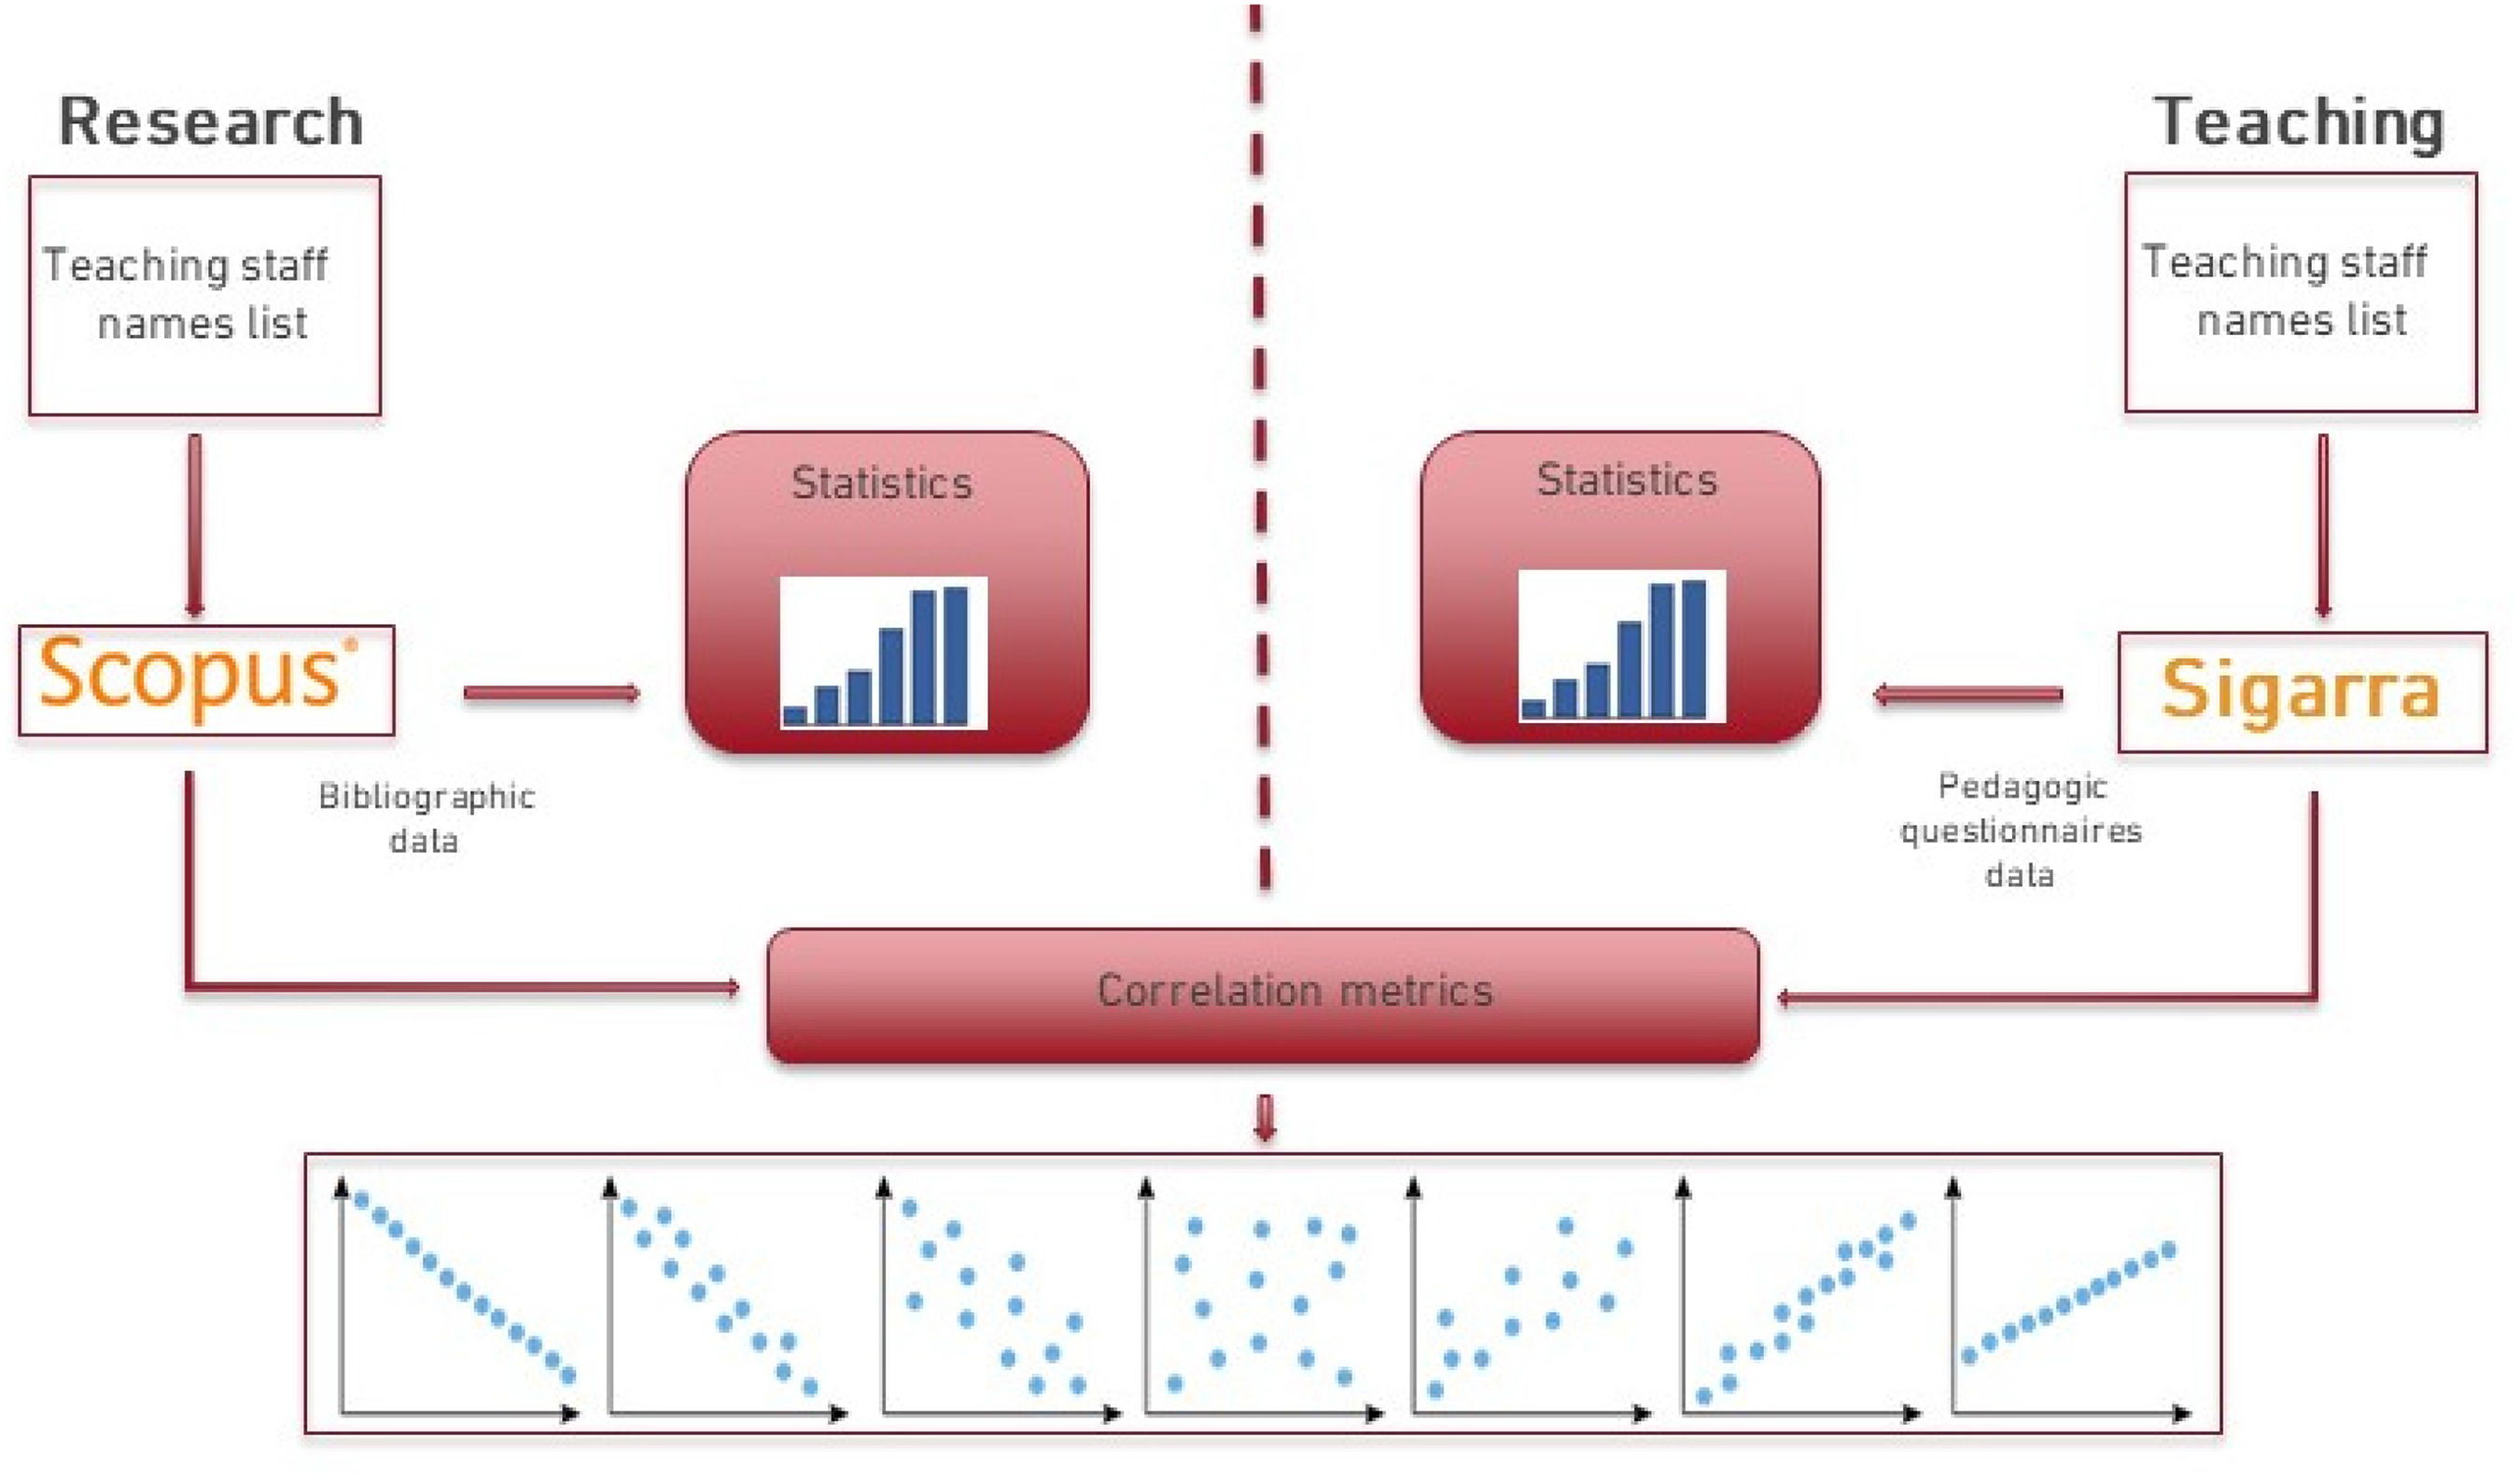
The methodology adopted to assess the research and teaching performance of the MIEM teaching staff.
Assessing the research performance
The bibliographic data of the K = 74 elements of the MIEM staff are analyzed as a whole to characterize the group. Then, the individual CP are compared and patterns are unveiled.
Figure 3 depicts the average number of publications and articles per year produced by the group in the period 2011–2020. One verifies that about 4 publications/person/year and 2.5 articles/person/year were published, with an increasing trend in the decade.
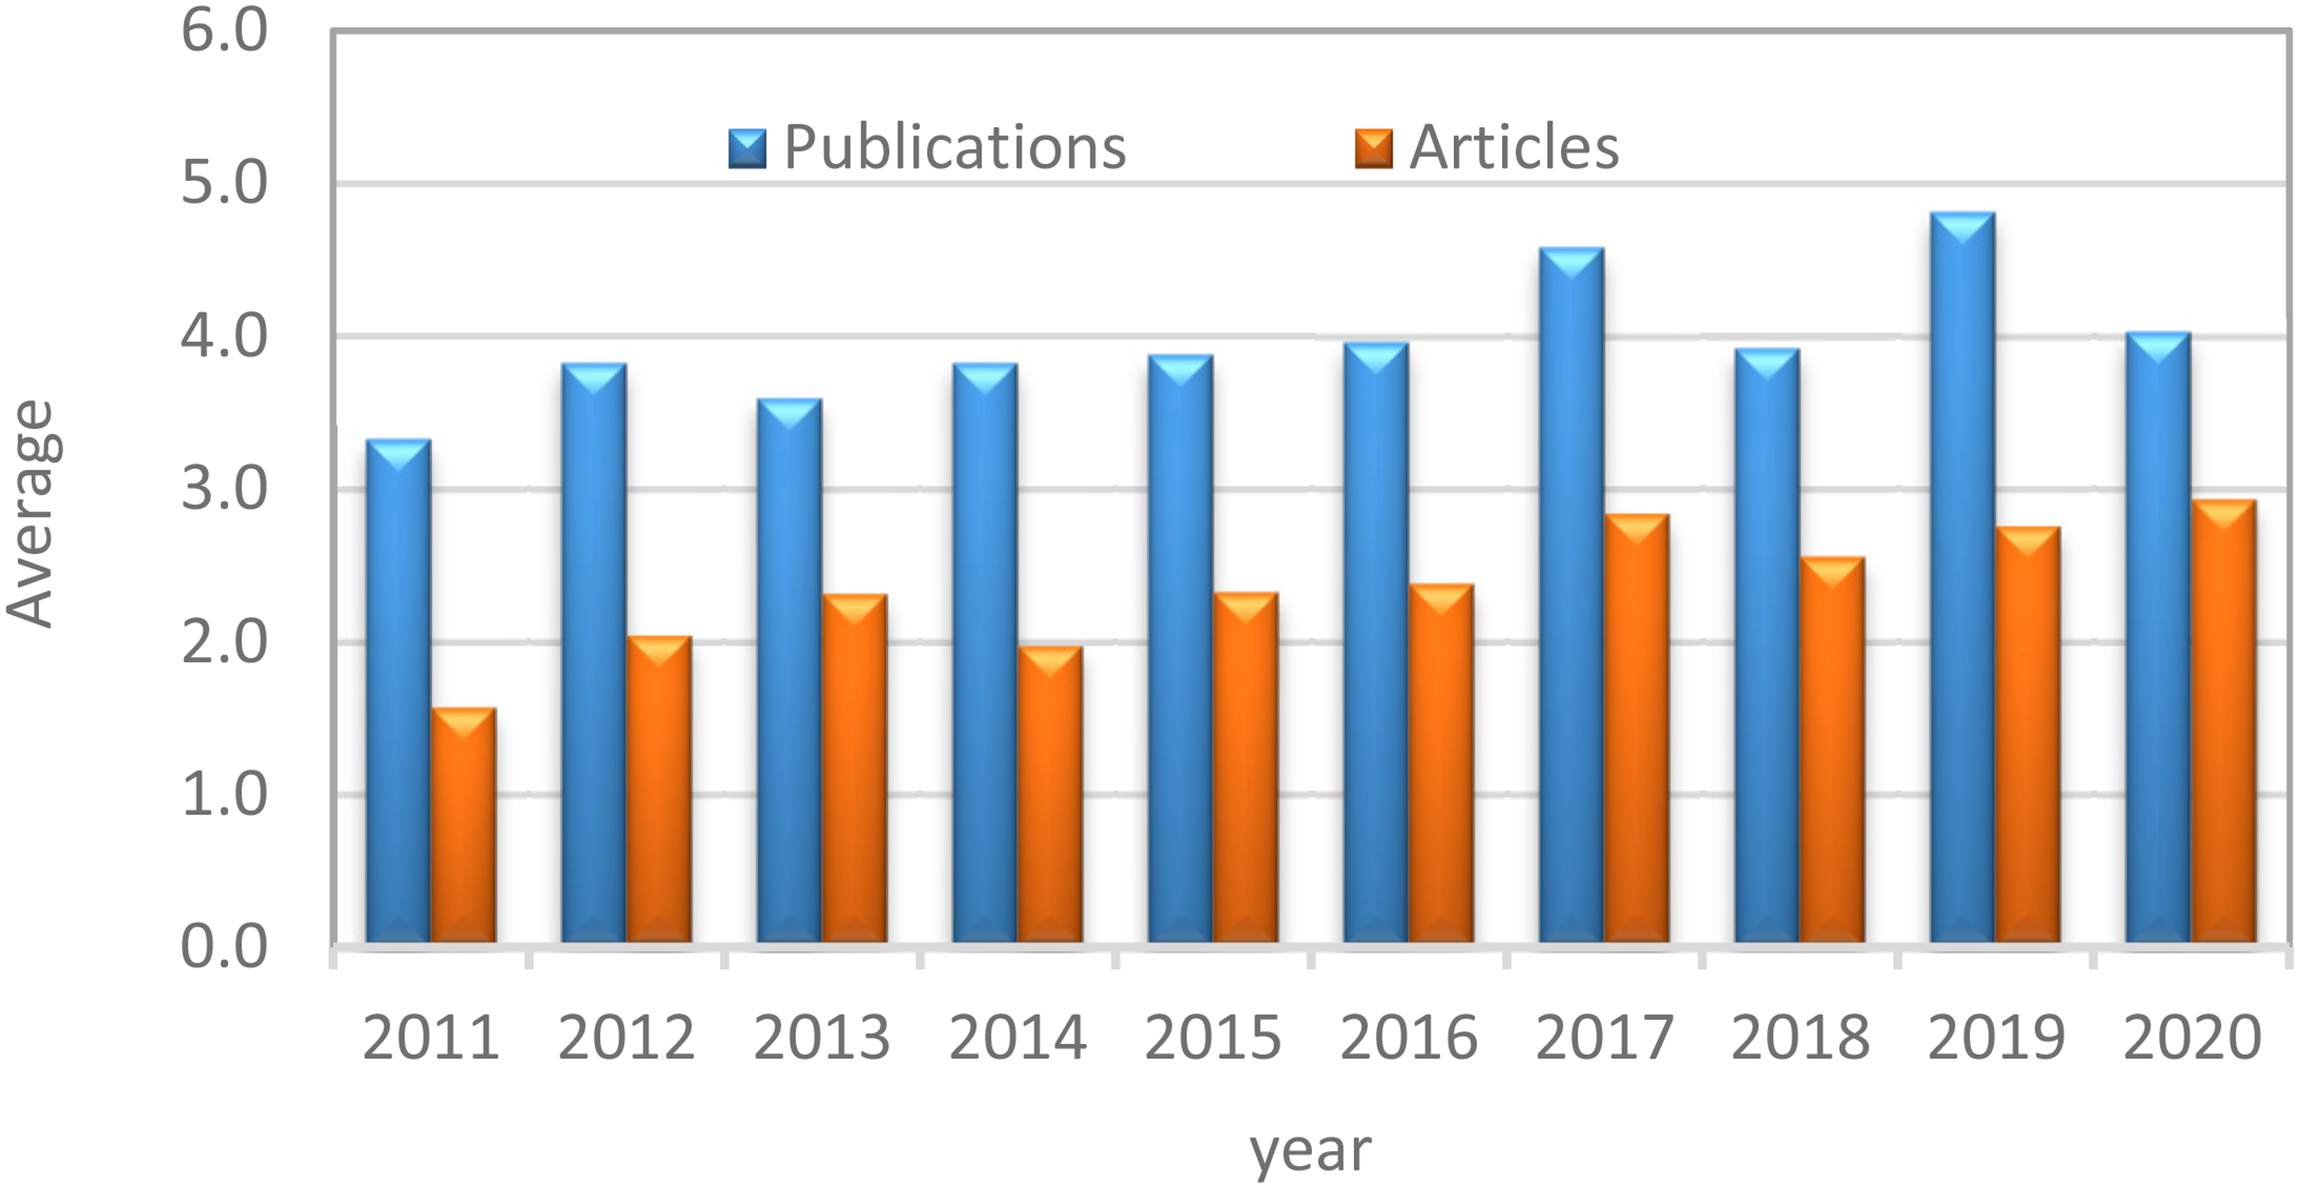
The average number of publications and articles per year and person produced by the group in the period 2011–2020.
Figure 4 portraits the h-index and the numbers of citations, publications and articles obtained by the top 10 elements of the group (sorted by the h-index on 29th September, 2021), showing reasonably high indicators in all variables.
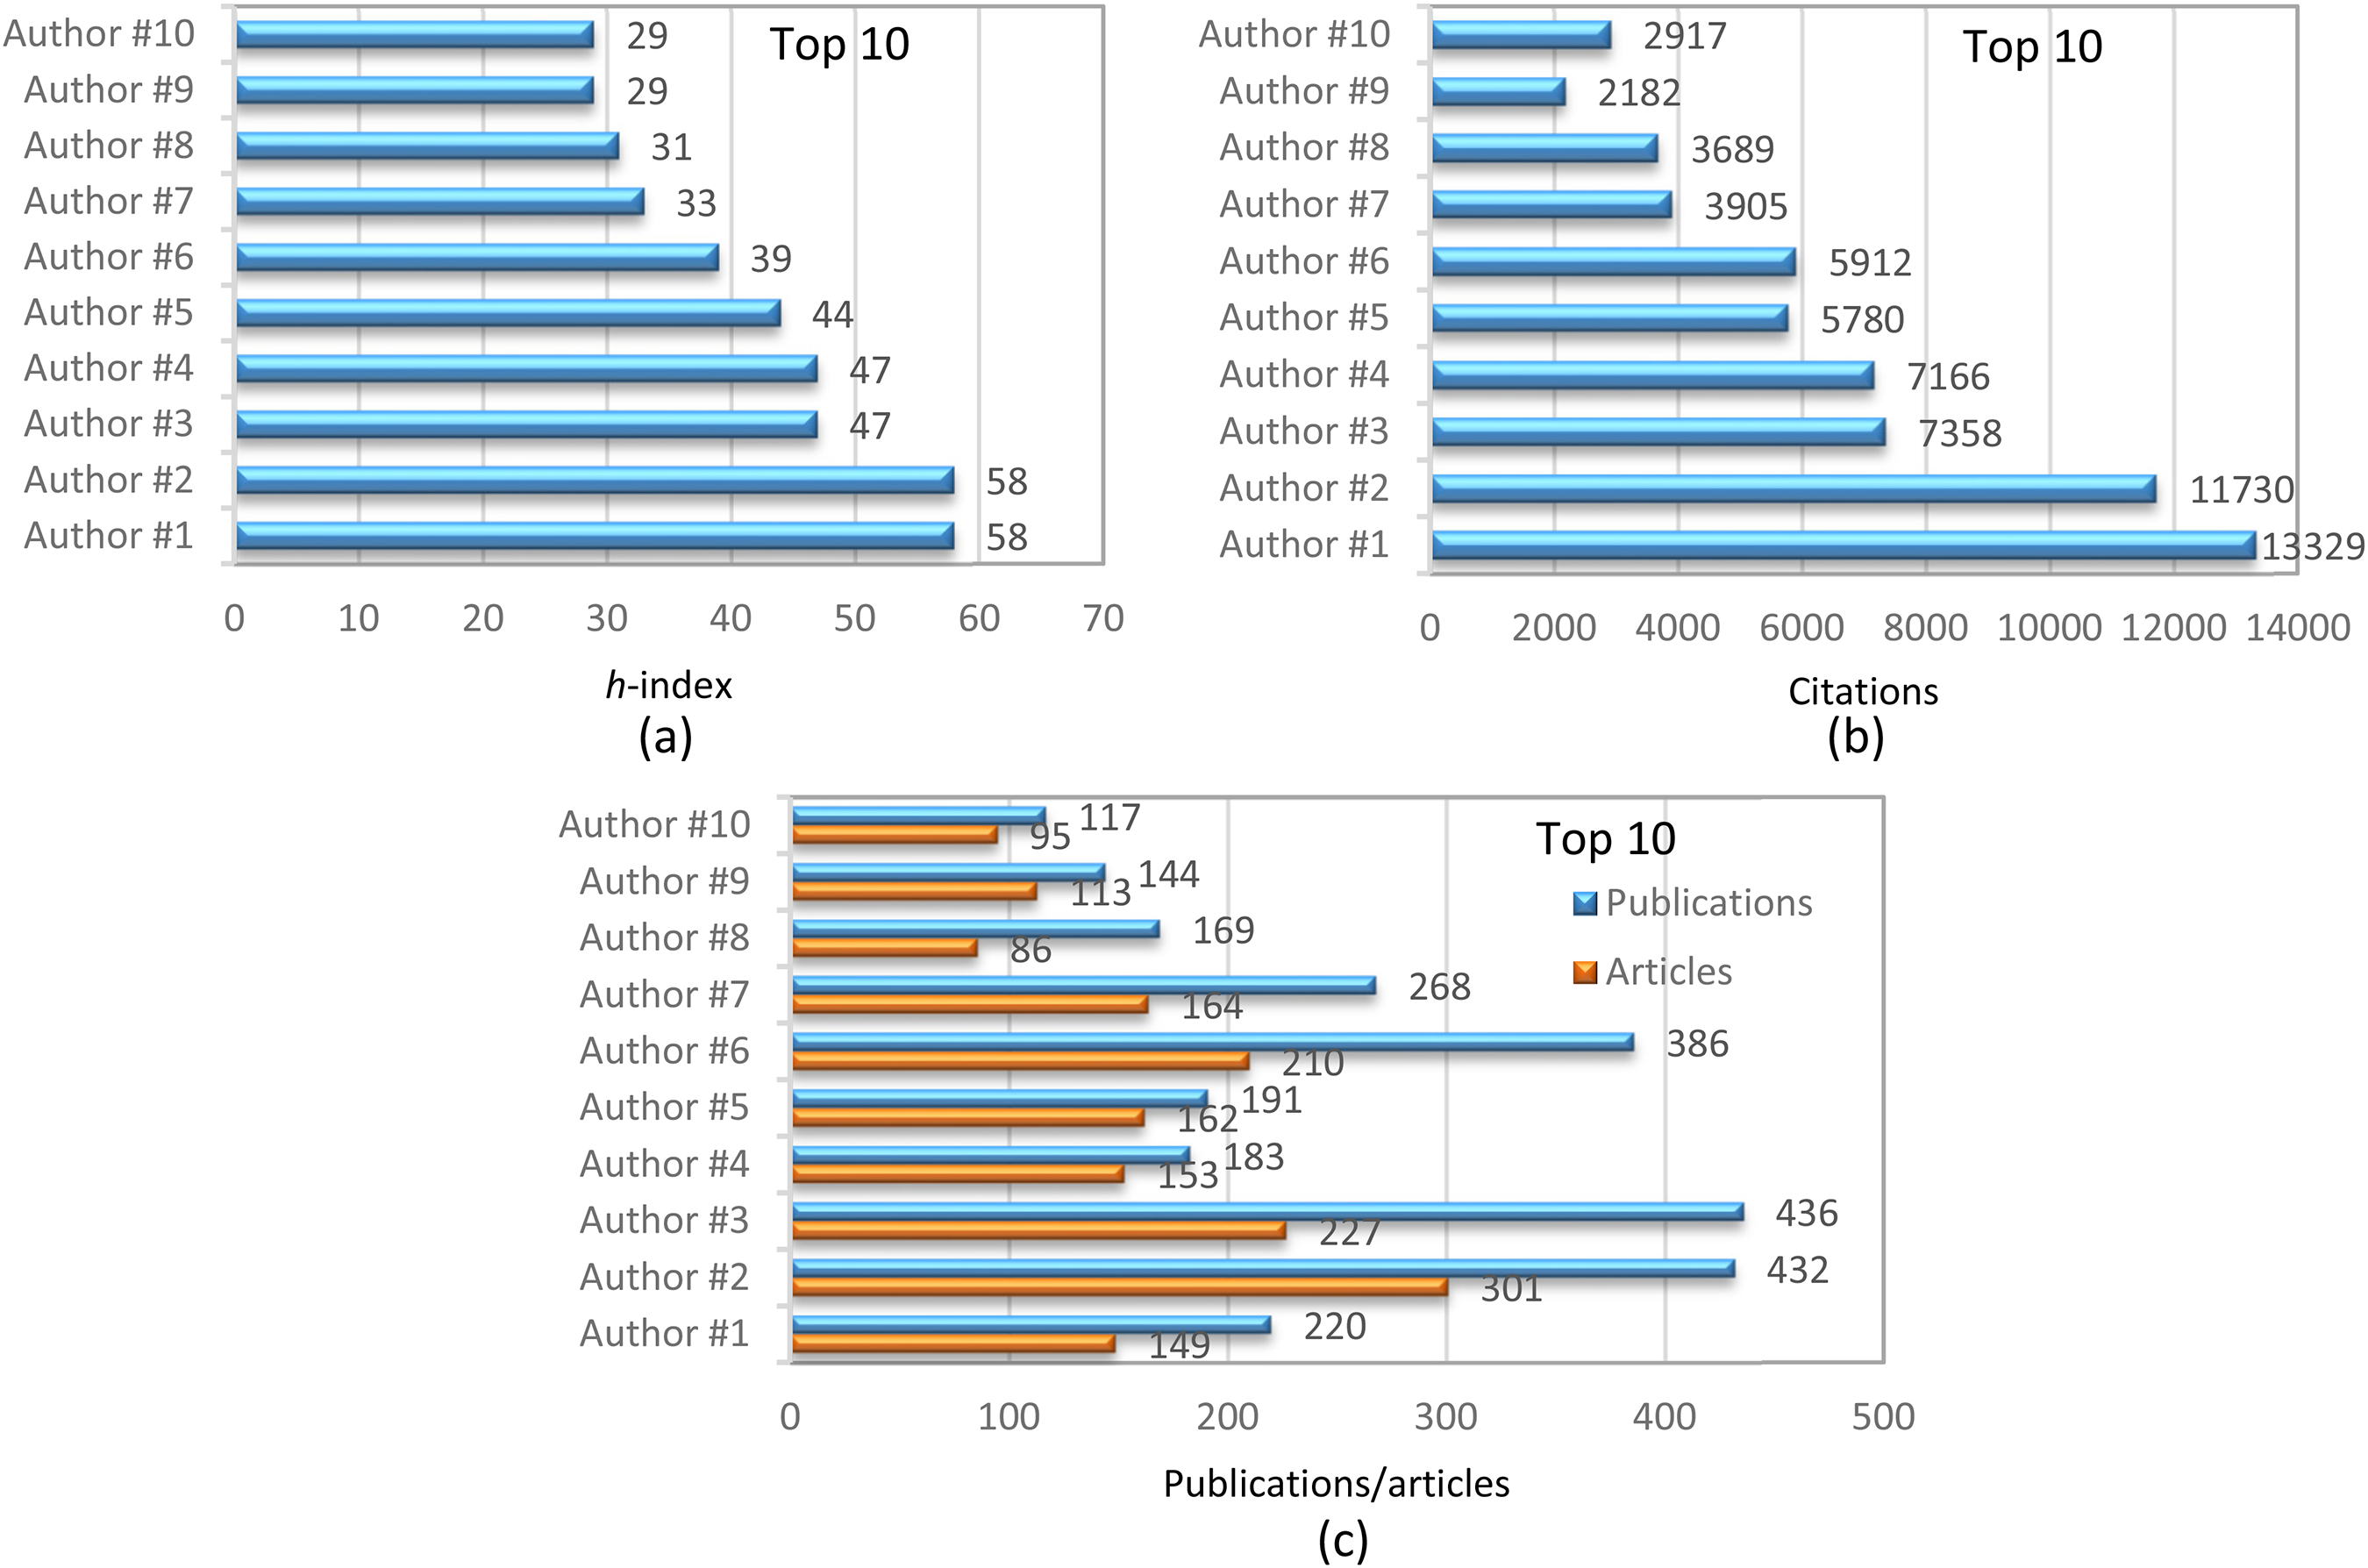
Some indicators of the scientific productivity by the top 10 elements in terms of h-index in 29th September, 2021: (a) h-index; (b) citations; (c): number of publications and articles.
For analyzing and comparing the performance of the elements of the staff between each other, the histograms and the Lorenz curves of the three variables {number of publications, number of citations, h-index} are calculated. Figure 5 illustrates the results obtained for the number of publications. The other variables yield graphs of the same type, being omitted for the sake of parsimony.
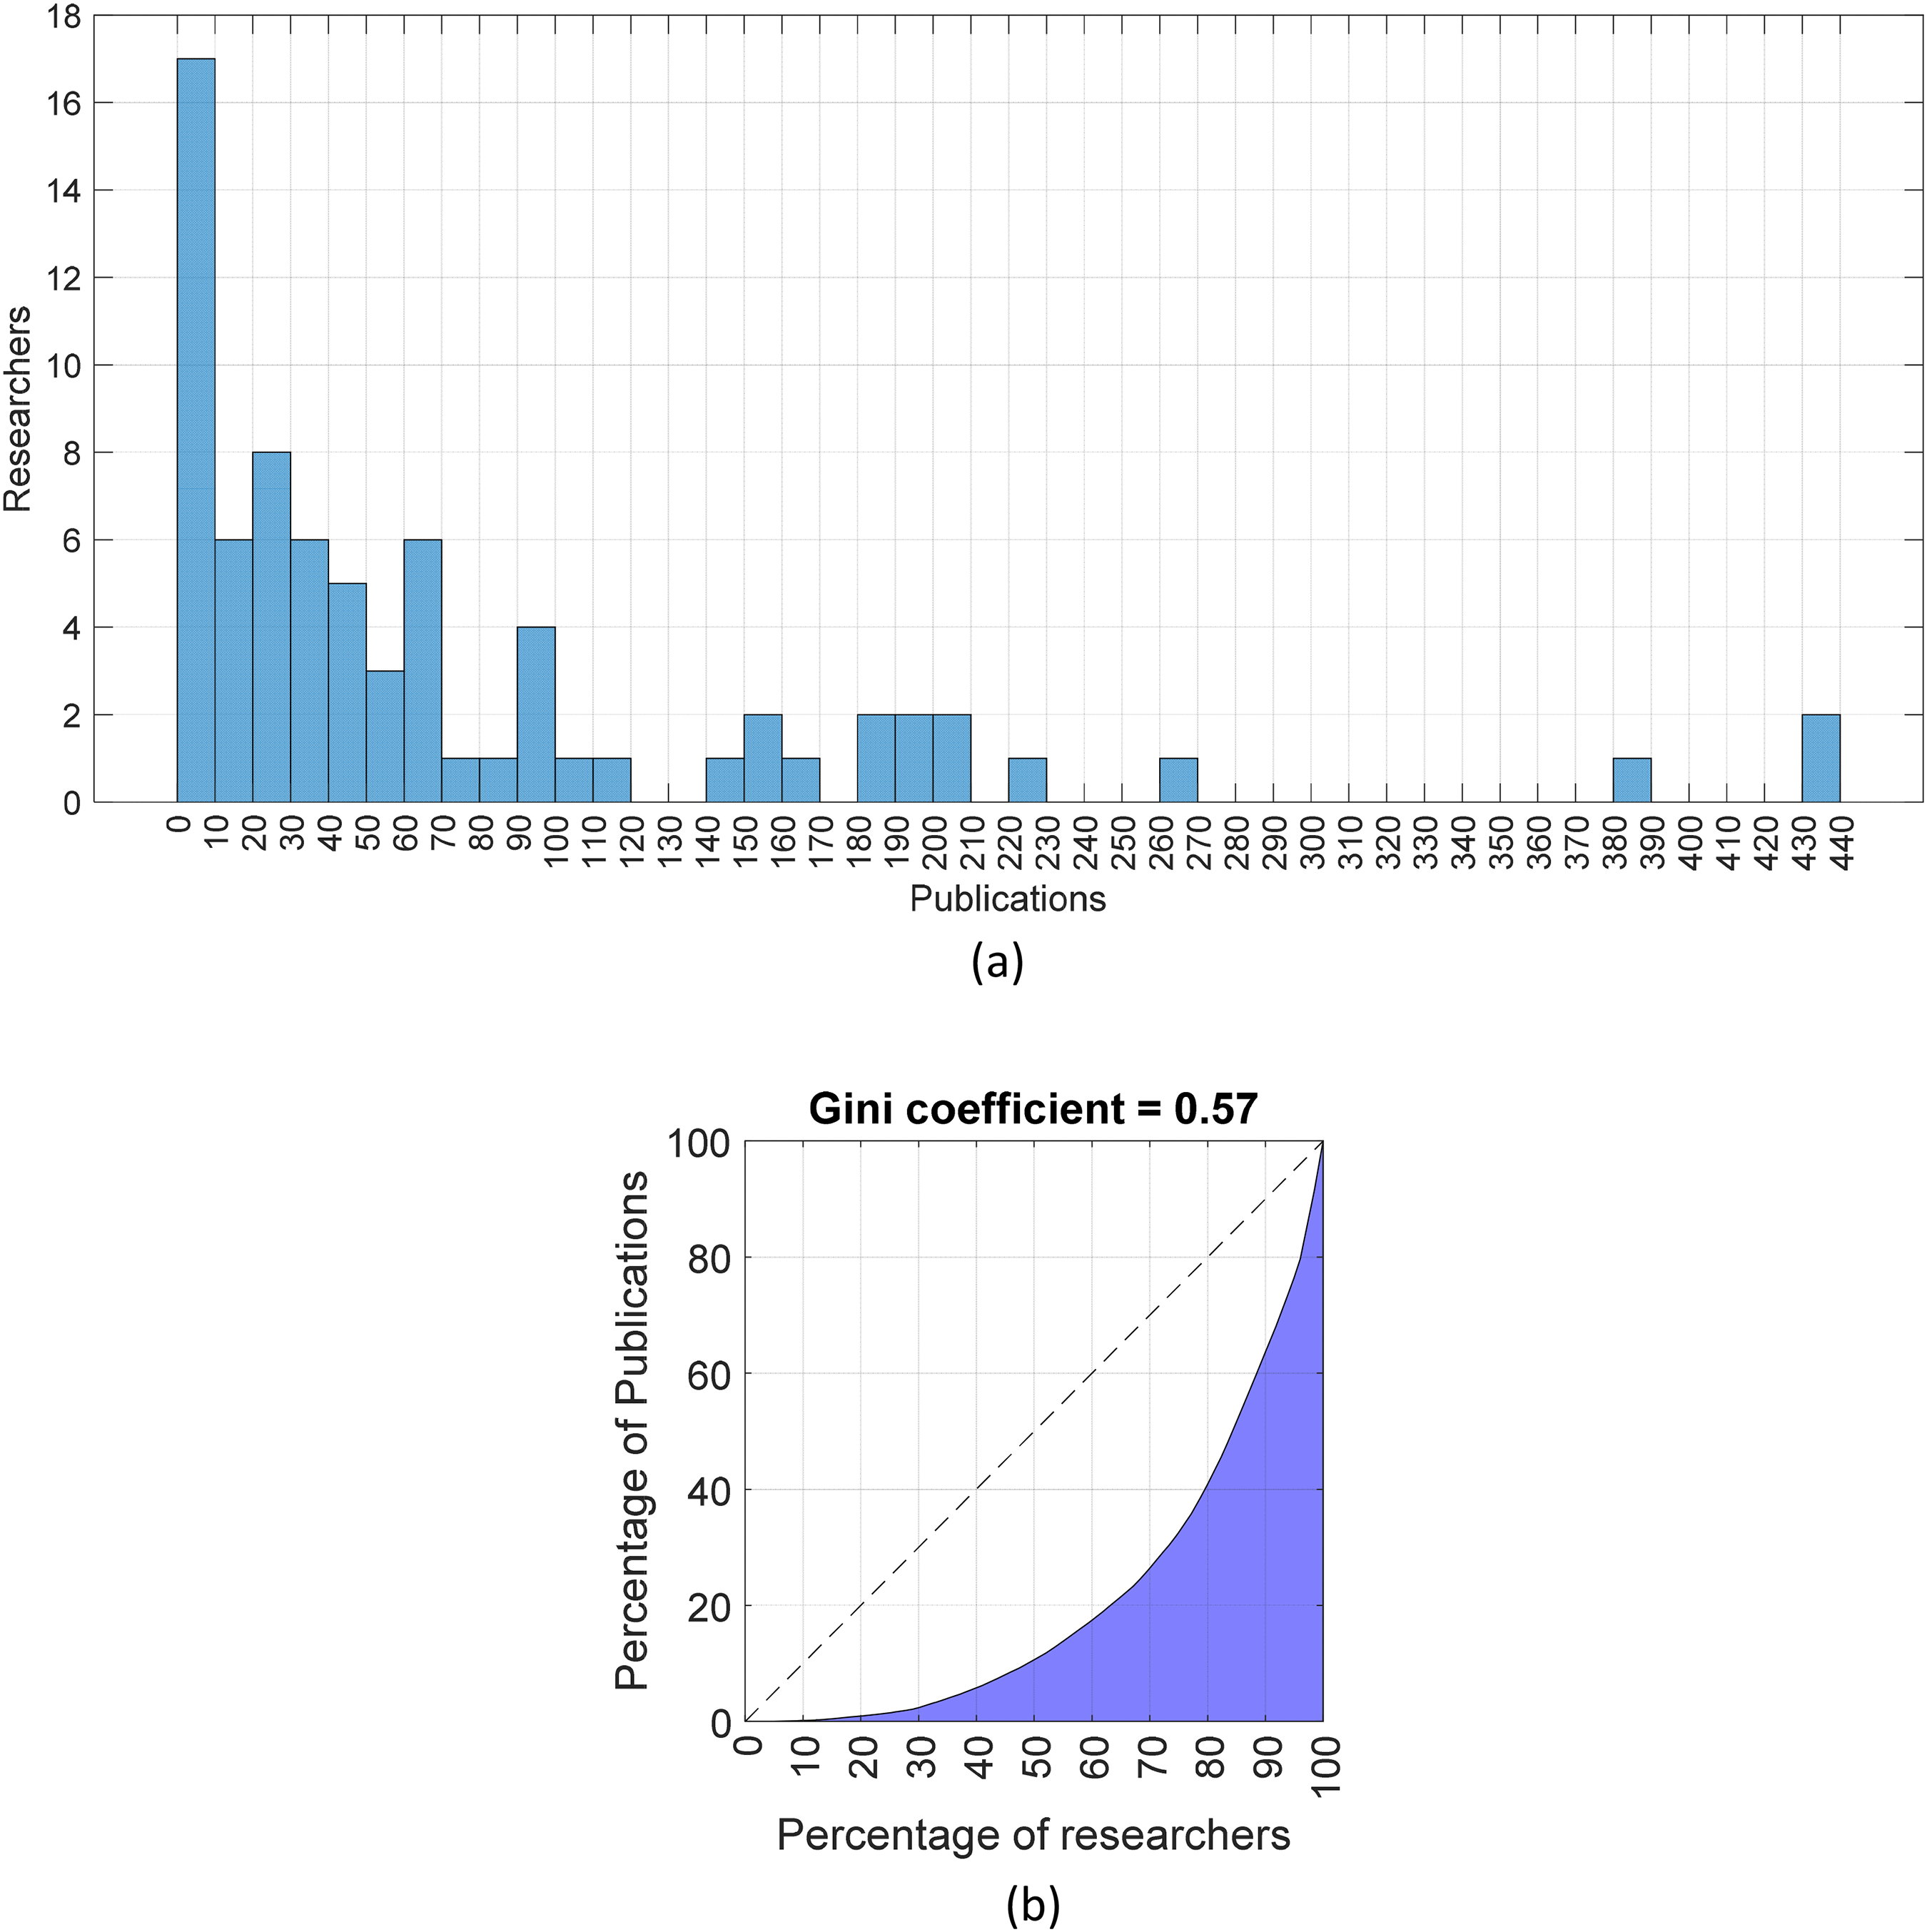
The distribution of the number of publications in the 29th September, 2021: (a) histogram; (b) Lorenz curve.
Several facts can be highlightened, namely (i) the group h-index amounts 117, (ii) 17 (23%) elements have more than 100, and 7 (9%) possess more than 200 publications, (iii) 16 (22%) researchers sum up more than 1500 citations, and 8 (11%) own more than 3000, (iv) 14 (19%) of the staff have h-index greater than 24, and 5 (7%) have h-index above 40. However, (i) 50% of the staff contributes merely with 10% of the publications, (ii) 30 (41%) elements have less than 300 citations, and (iii) 32 (43%) have h-index below 10. Therefore, MIEM teaching staff, as a whole, has good publication rating, which contributes to put FEUP on the top 20 European Institutions in the area of Mechanical Engineering, according to the Taiwan Ranking (http://nturanking.csti.tw/ranking/BySubject/MechEng). Simultaneously, the distributions of bibliographic indicators are quite uneven (e.g., Gini coefficient 0.57 for publications), with a considerable percentage of elements having residual contribution to the group rating.
Figure 6 depicts the dendrogram obtained by means of hierarchical clustering (HC), showing how the staff elements group with each other. The HC is a numerical tool that performs multivariate analysis of a dataset. The HC detects meaningful dimensions in the data, groups similar objects, and depicts these objects in a hierarchical tree that the user can visualize and interpret. Given K objects in a P-dimensional space, the computational algorithm has as input a K × K matrix
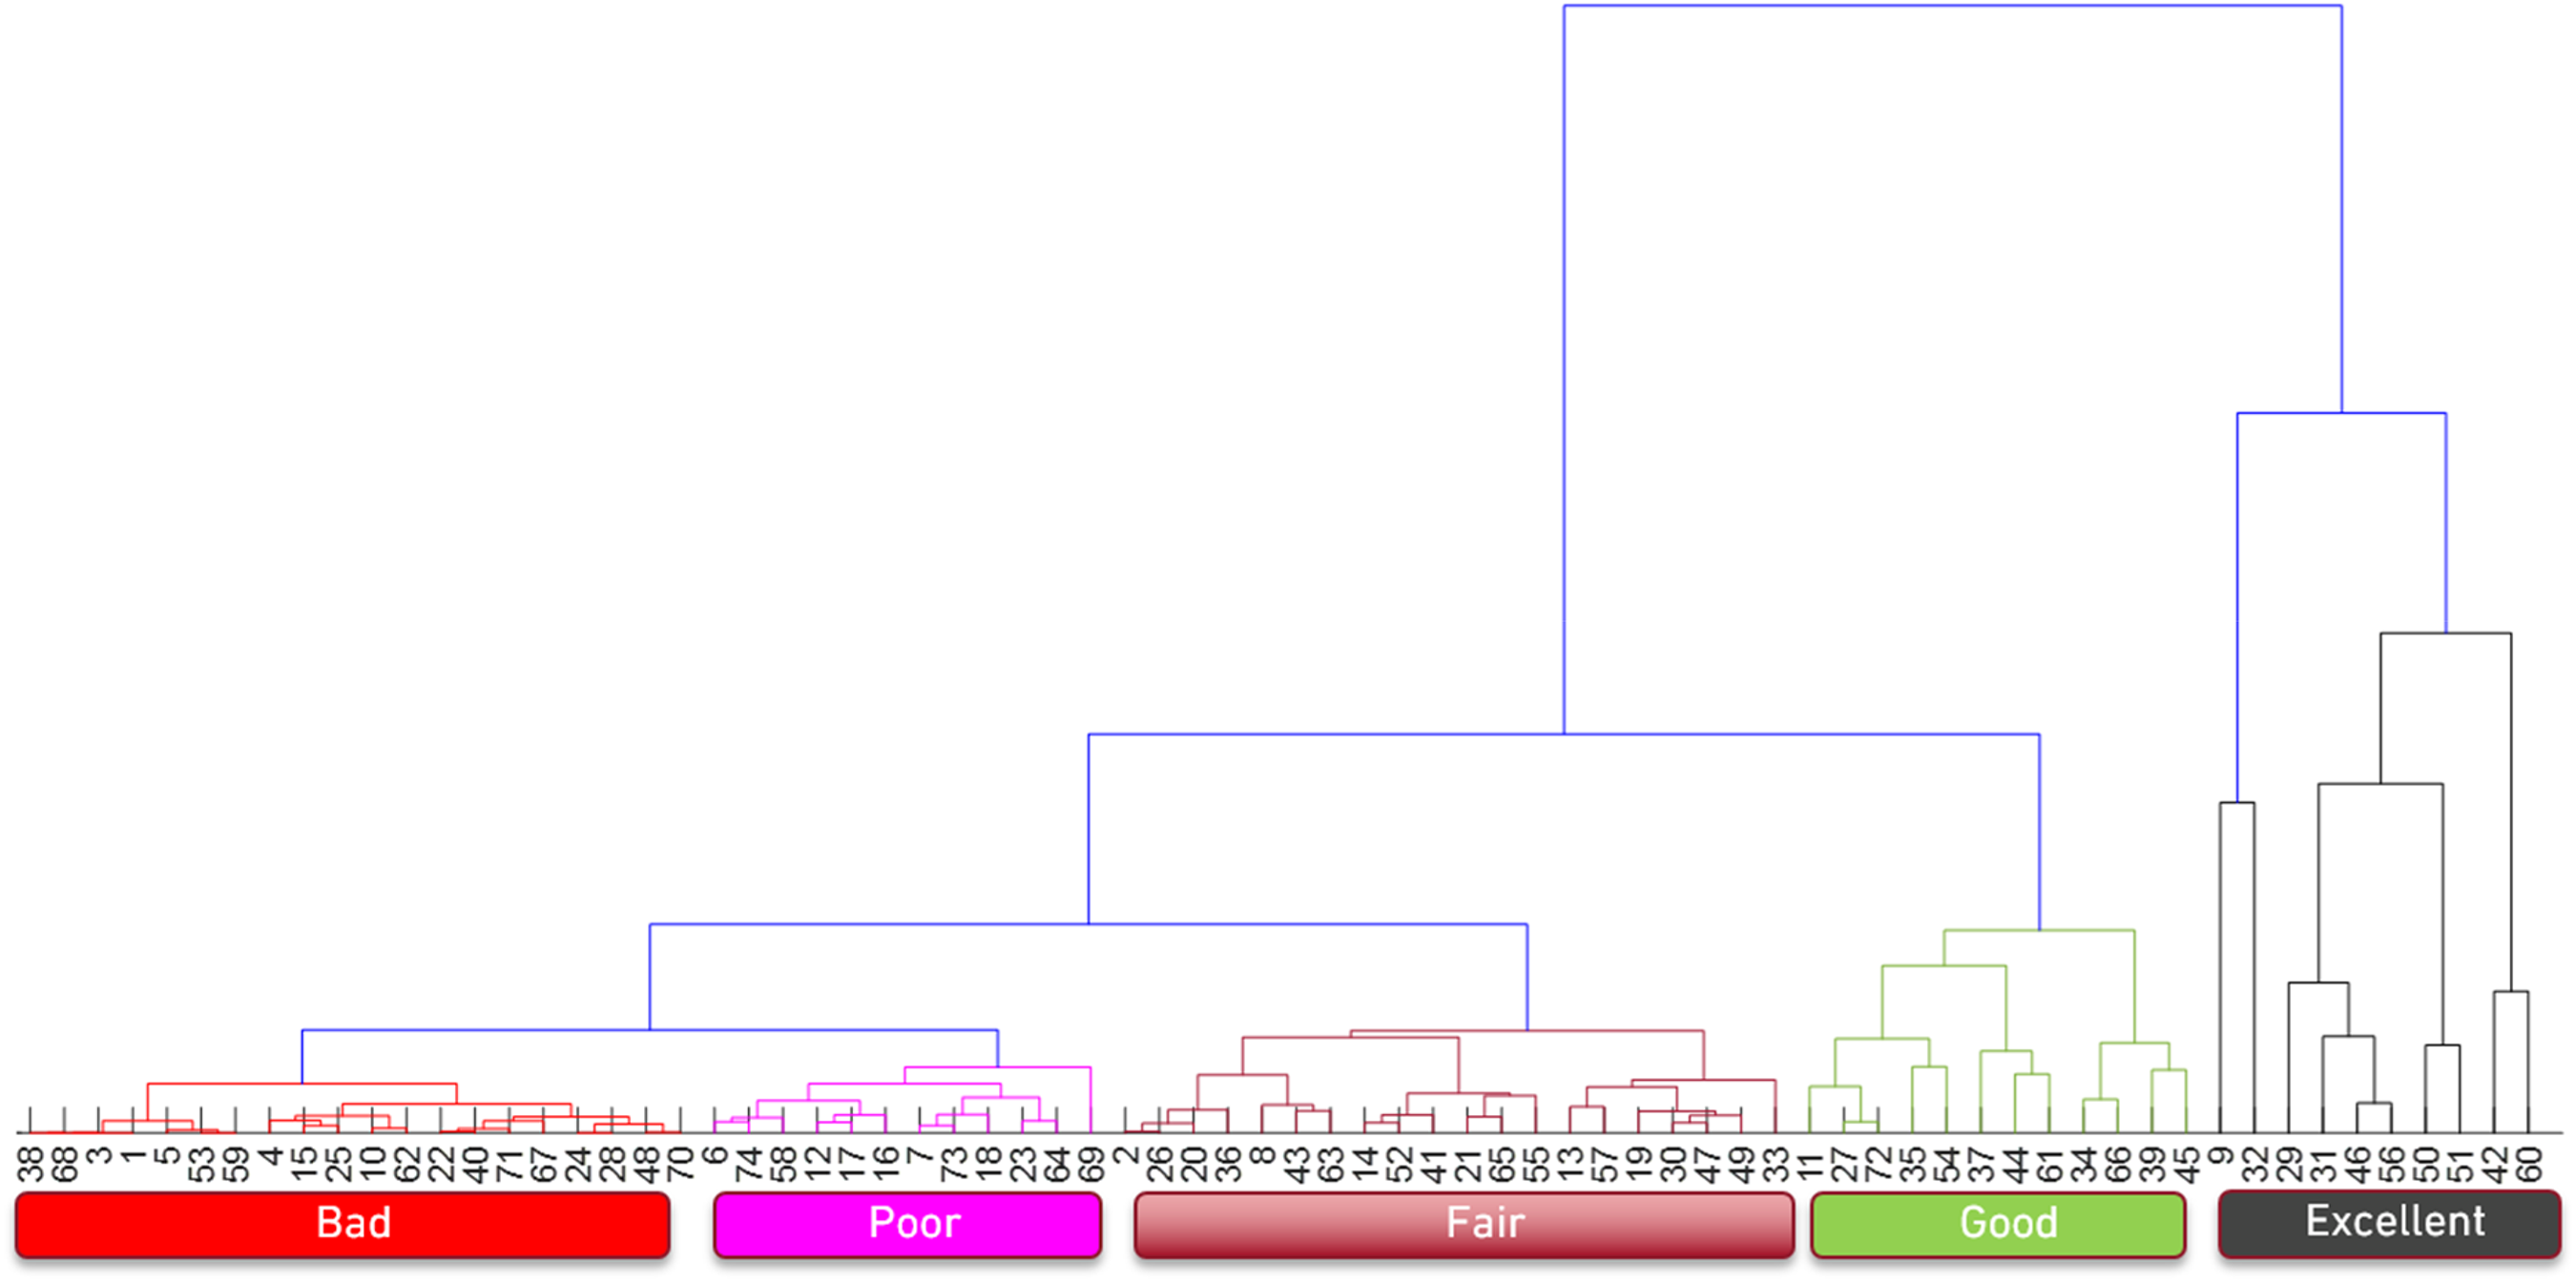
The dendrogram obtained by means of HC with the variables {number of publications, number of citations, h-index}, showing how the K = 74 staff elements group with each other.
The variables {number of publications, number of citations, h-index} are adopted to characterize every staff member. That is, each element is characterized by data in a 3-dim space. These data are organized in a 74 × 3 array,
One verifies the emergence of 5 clusters rated as {excellent, good, fair, poor, bad}. The dimension of the poor and bad groups is considerable, confirming the skewness of the distributions of {number of publications, number of citations, h-index}. It should be noted that neither the labels on the horizontal axis nor the order of the clusters in the dendrogram have a special meaning. Moreover, as the HC groups “objects” that are similar to each other, if a given “unknown object” appears in the same cluster of an “object” whose characteristics are already “known”, then it can be inferred that the “unknown object” has characteristics similar to those of the “known object”. Although this could be some indirect way of extracting information useful for assessing the performance and establishing rankings of faculty elements (e.g., in the context of promotion or merit assessment), the HC technique in not well suited for establishing rankings.
Assessing the pedagogic performance
The teaching performance of the staff was analyzed, and the individuals were compared between each other. As such, the histograms and the Lorenz curves of the variables M and Mp, p = 1, …, 10, were calculated. This is to say that the study was carried out for the whole period of time 2016–2020, as well as in a per semester basis. Figure 7 illustrates the results obtained when considering M. The other variables yield results of the same type, being omitted. One can note that (i) the average score is close to 5.3 points out of 7, (ii) 14 (19%) elements received more than 6.0, and 38 (51%) more than 5.3 (i.e., the average value). Conversely, only 3 (4%) individuals were rated below 4.0. Therefore, the distribution of M is well balanced, with few elements on the tail, which translates in a Gini coefficient equal to 0.08.
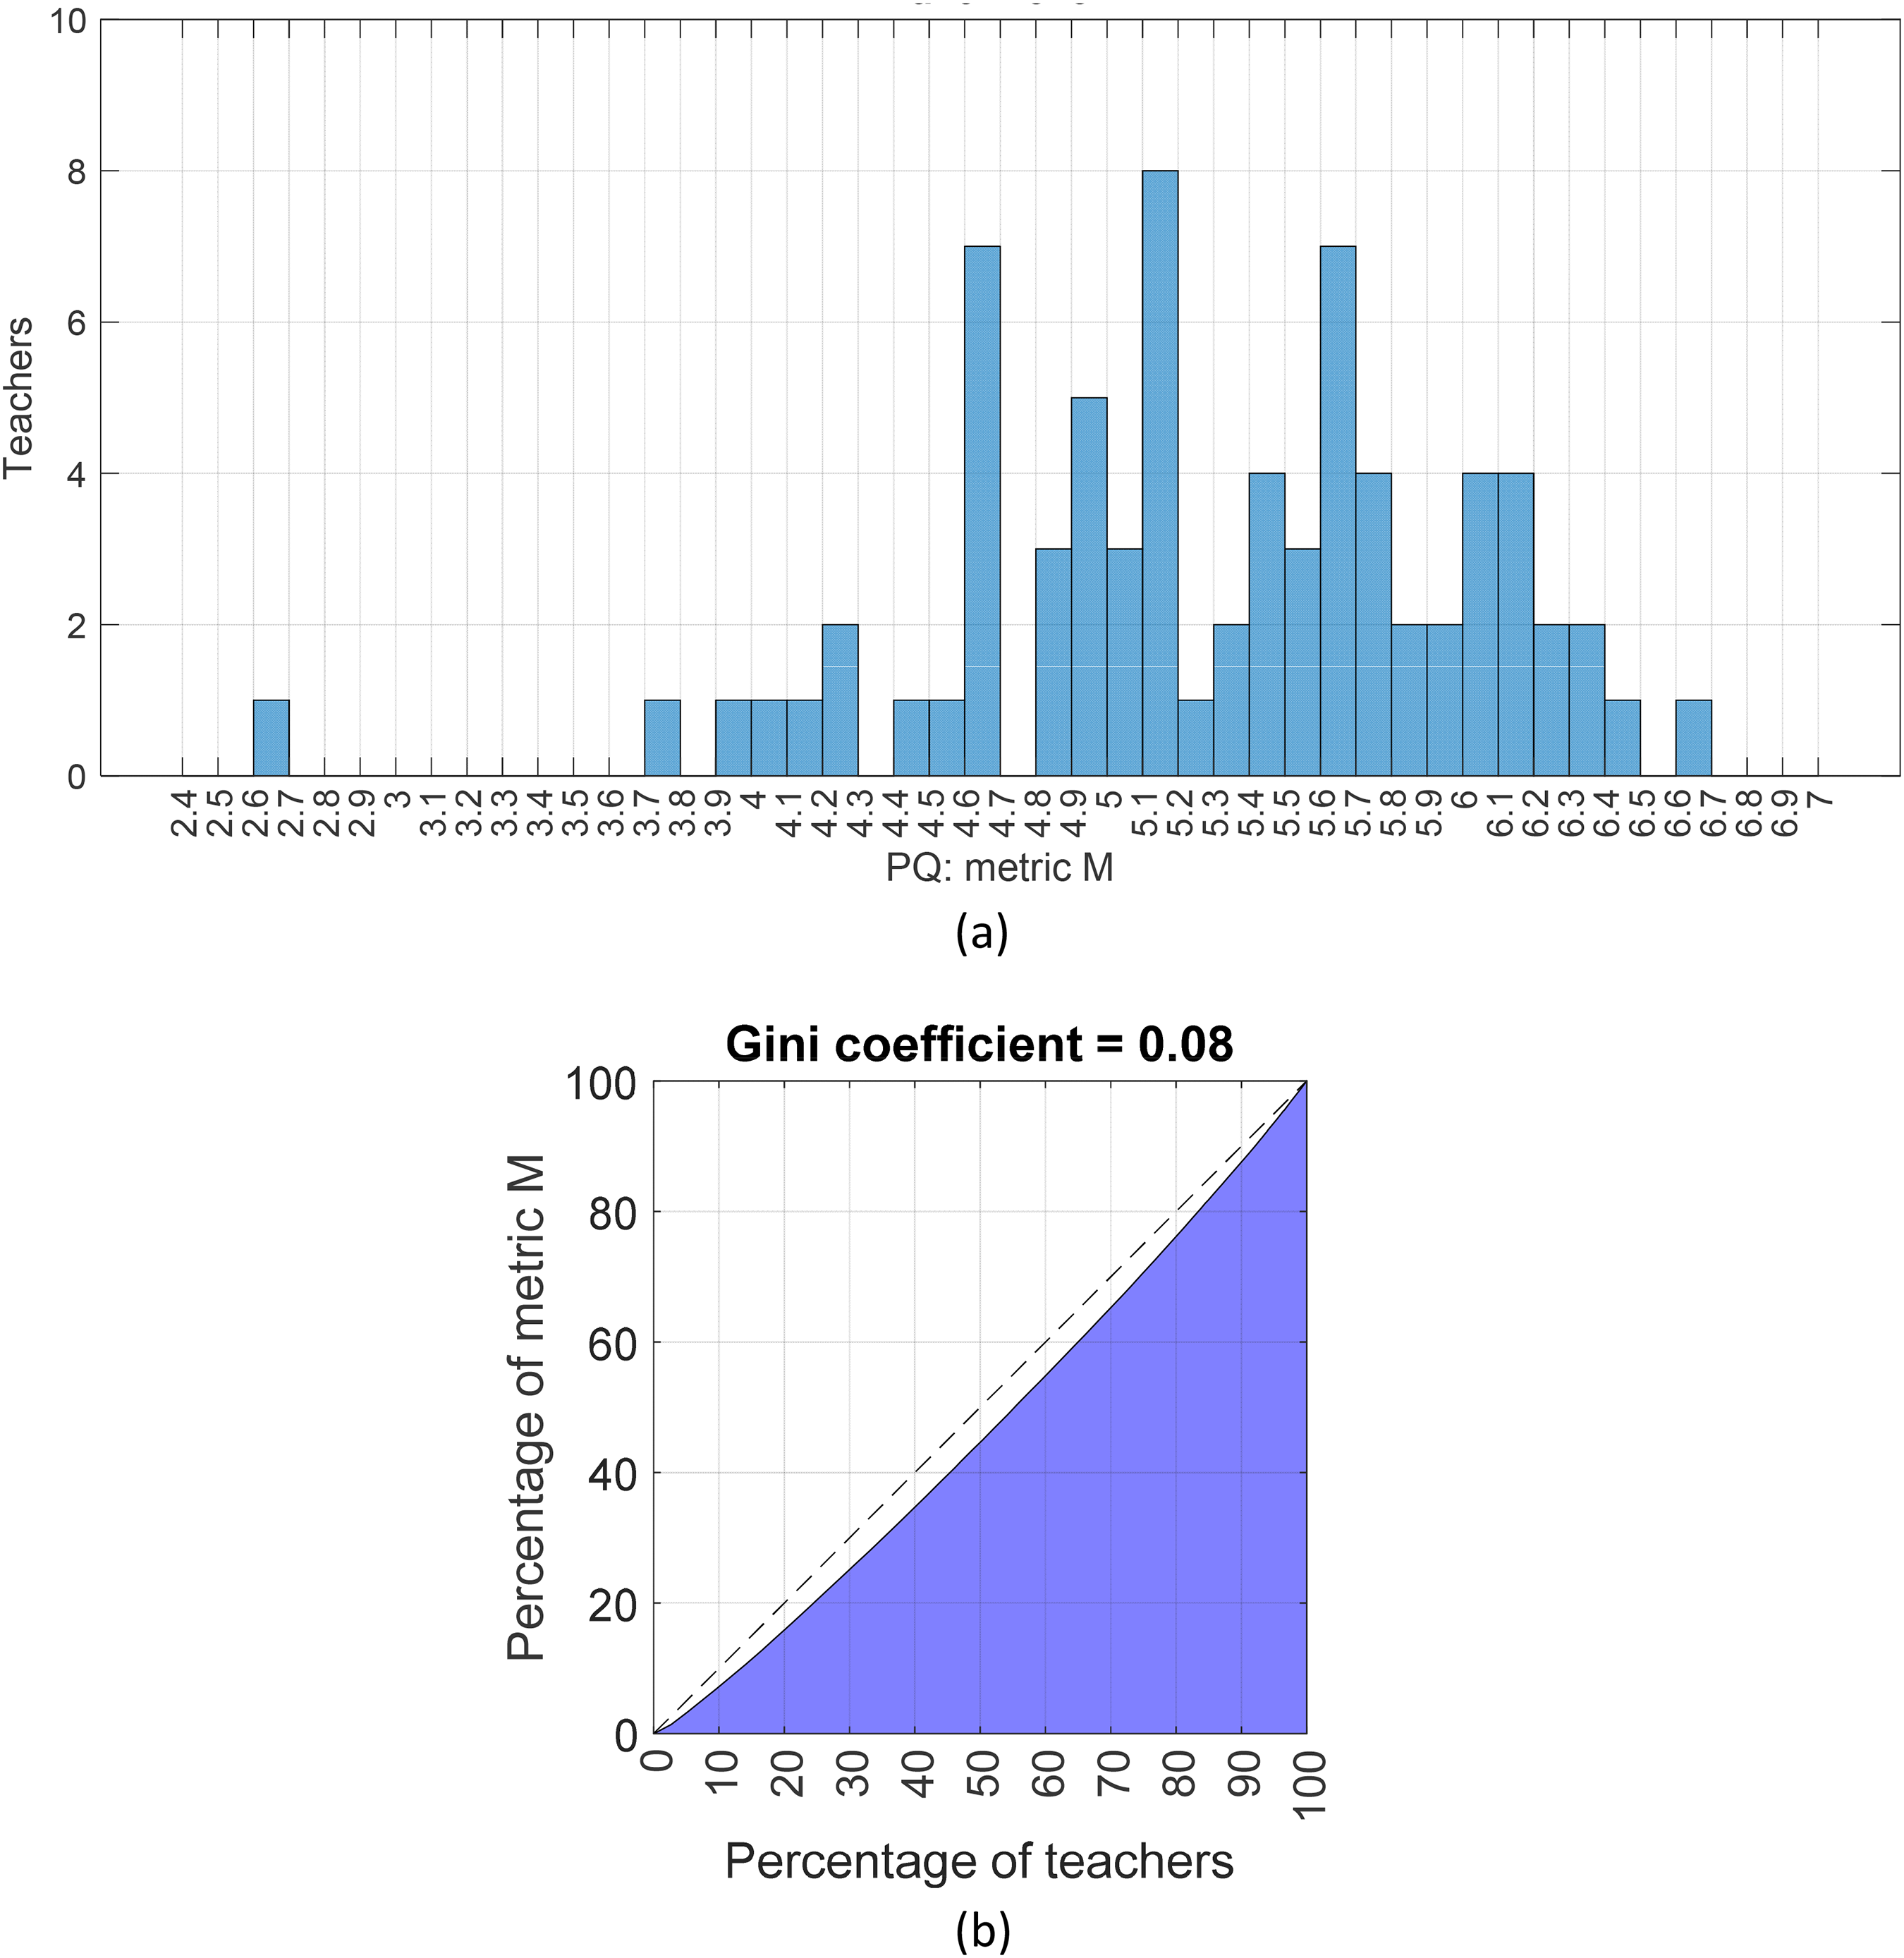
The distribution of the metric M in the period 2016–2020: (a) histogram; (b) Lorenz curve.
Figure 8 portraits the measure M obtained by the top 10 elements of the staff, showing quite high values.
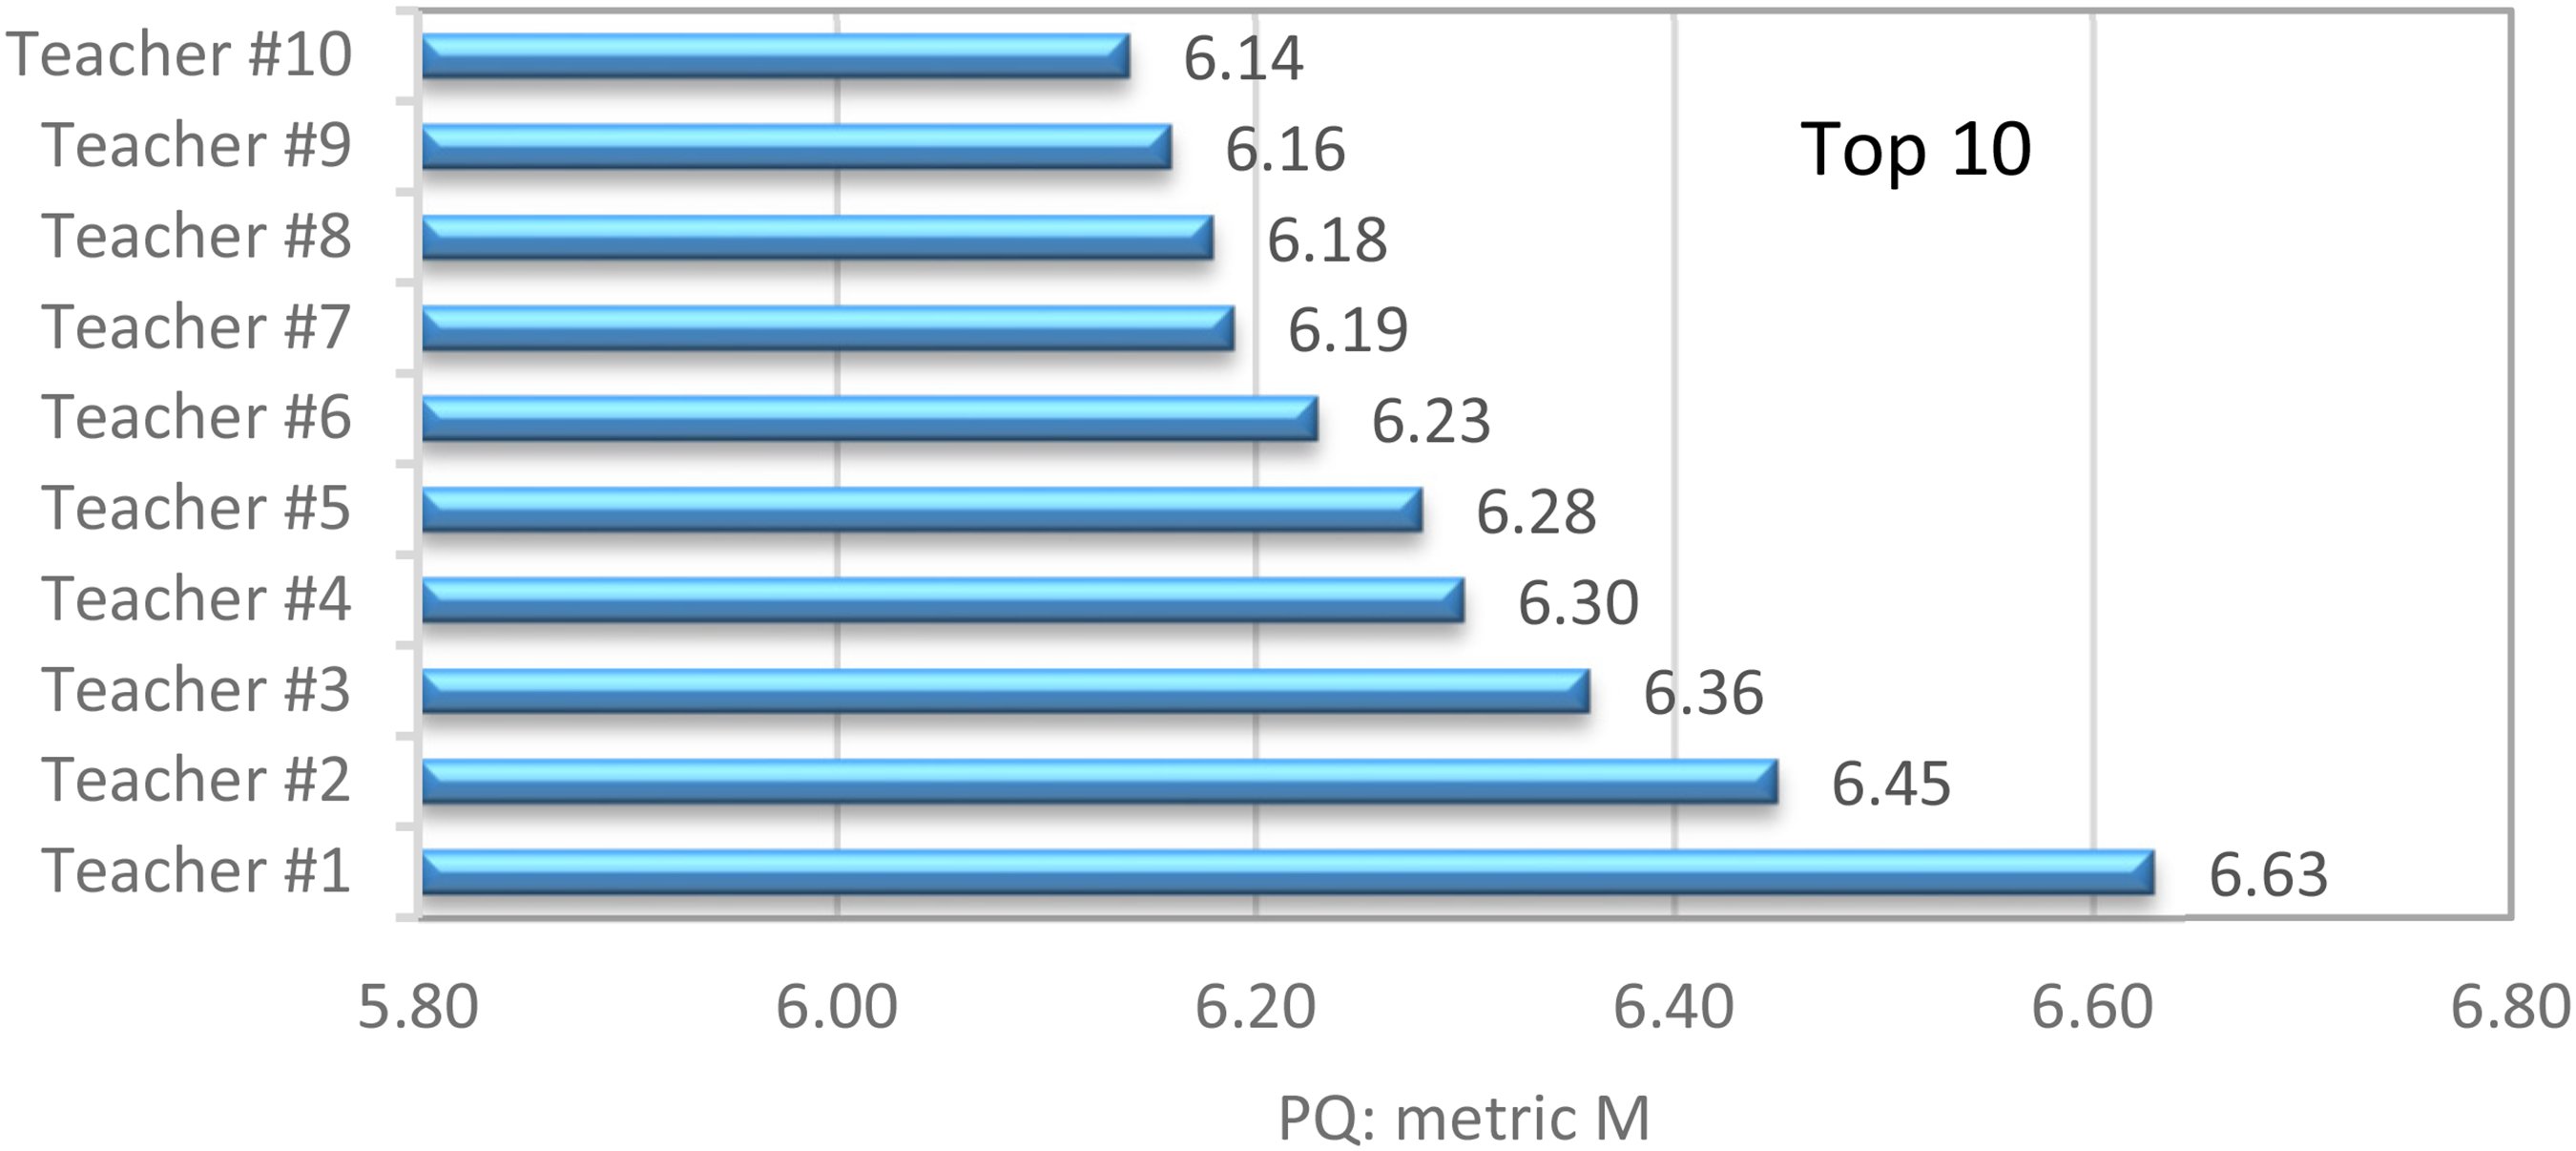
The rating M obtained by the top 10 elements of the staff in the period 2016–2020.
Figure 9 depicts the HC dendrogram that shows how the staff elements group with each other. The variables Mp, p = 1, …, 10, are considered, meaning that the dataset that characterizes each element of the staff is in a 10-dim space. The information is now gathered in a 74 × 10 array,
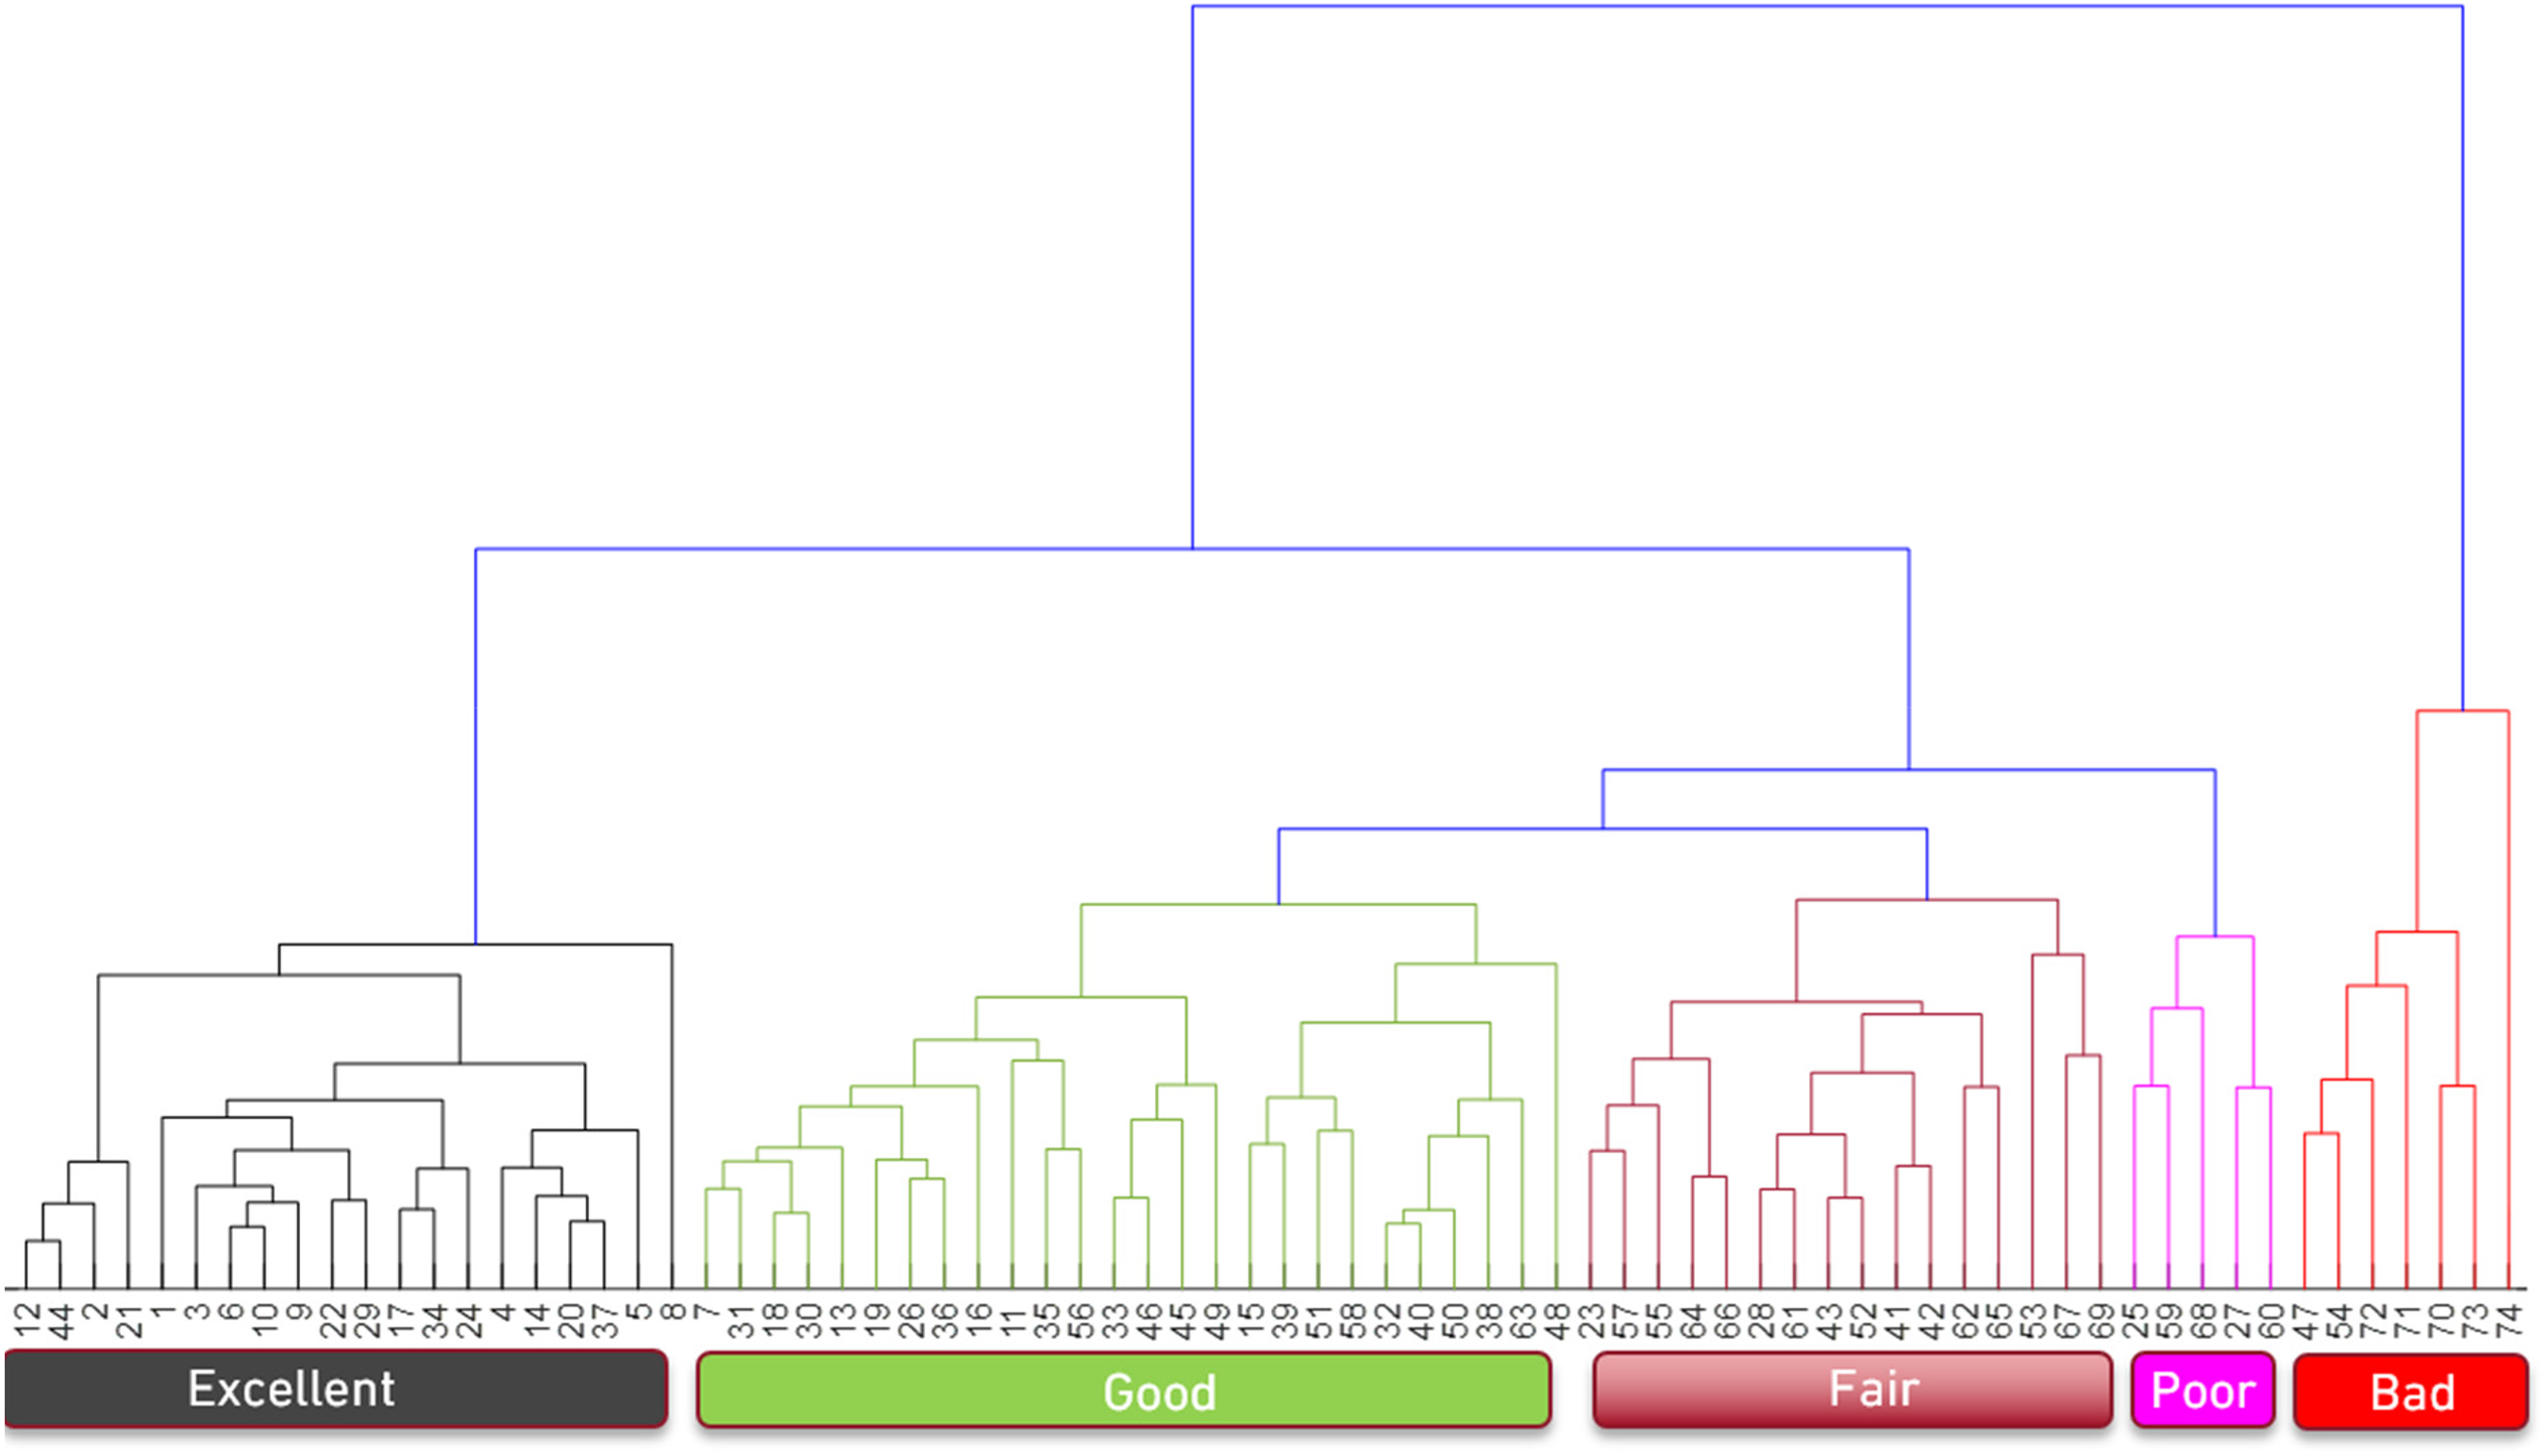
The dendrogram obtained by means of HC with the variables Mp, p = 1, …, 10, showing how the K = 74 staff elements group with each other.
Identically to the results obtained in subsection 4.1, it is observed the emergence of 5 clusters, which are rated as {excellent, good, fair, poor, bad}. However, now the size of the poor and bad groups is very small, confirming the uniformity of the distributions. Again, we underline that neither the labels on the horizontal axis nor the order of the cluster in the dendrogram have a special meaning.
Correlating the research and pedagogic data
In this Section the research and teaching scores of the MIEM teaching staff are compared. For this, the Pearson correlation coefficient between every pairs of variables in the sets {number of publications, number of citations, h-index} and {M, Mp, p = 1, …, 10} is calculated. For instance, the Pearson correlation of the pair (h-index, M) yields:
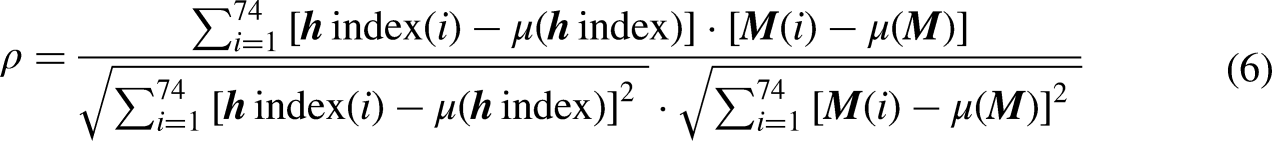
Figure 10 shows the loci of
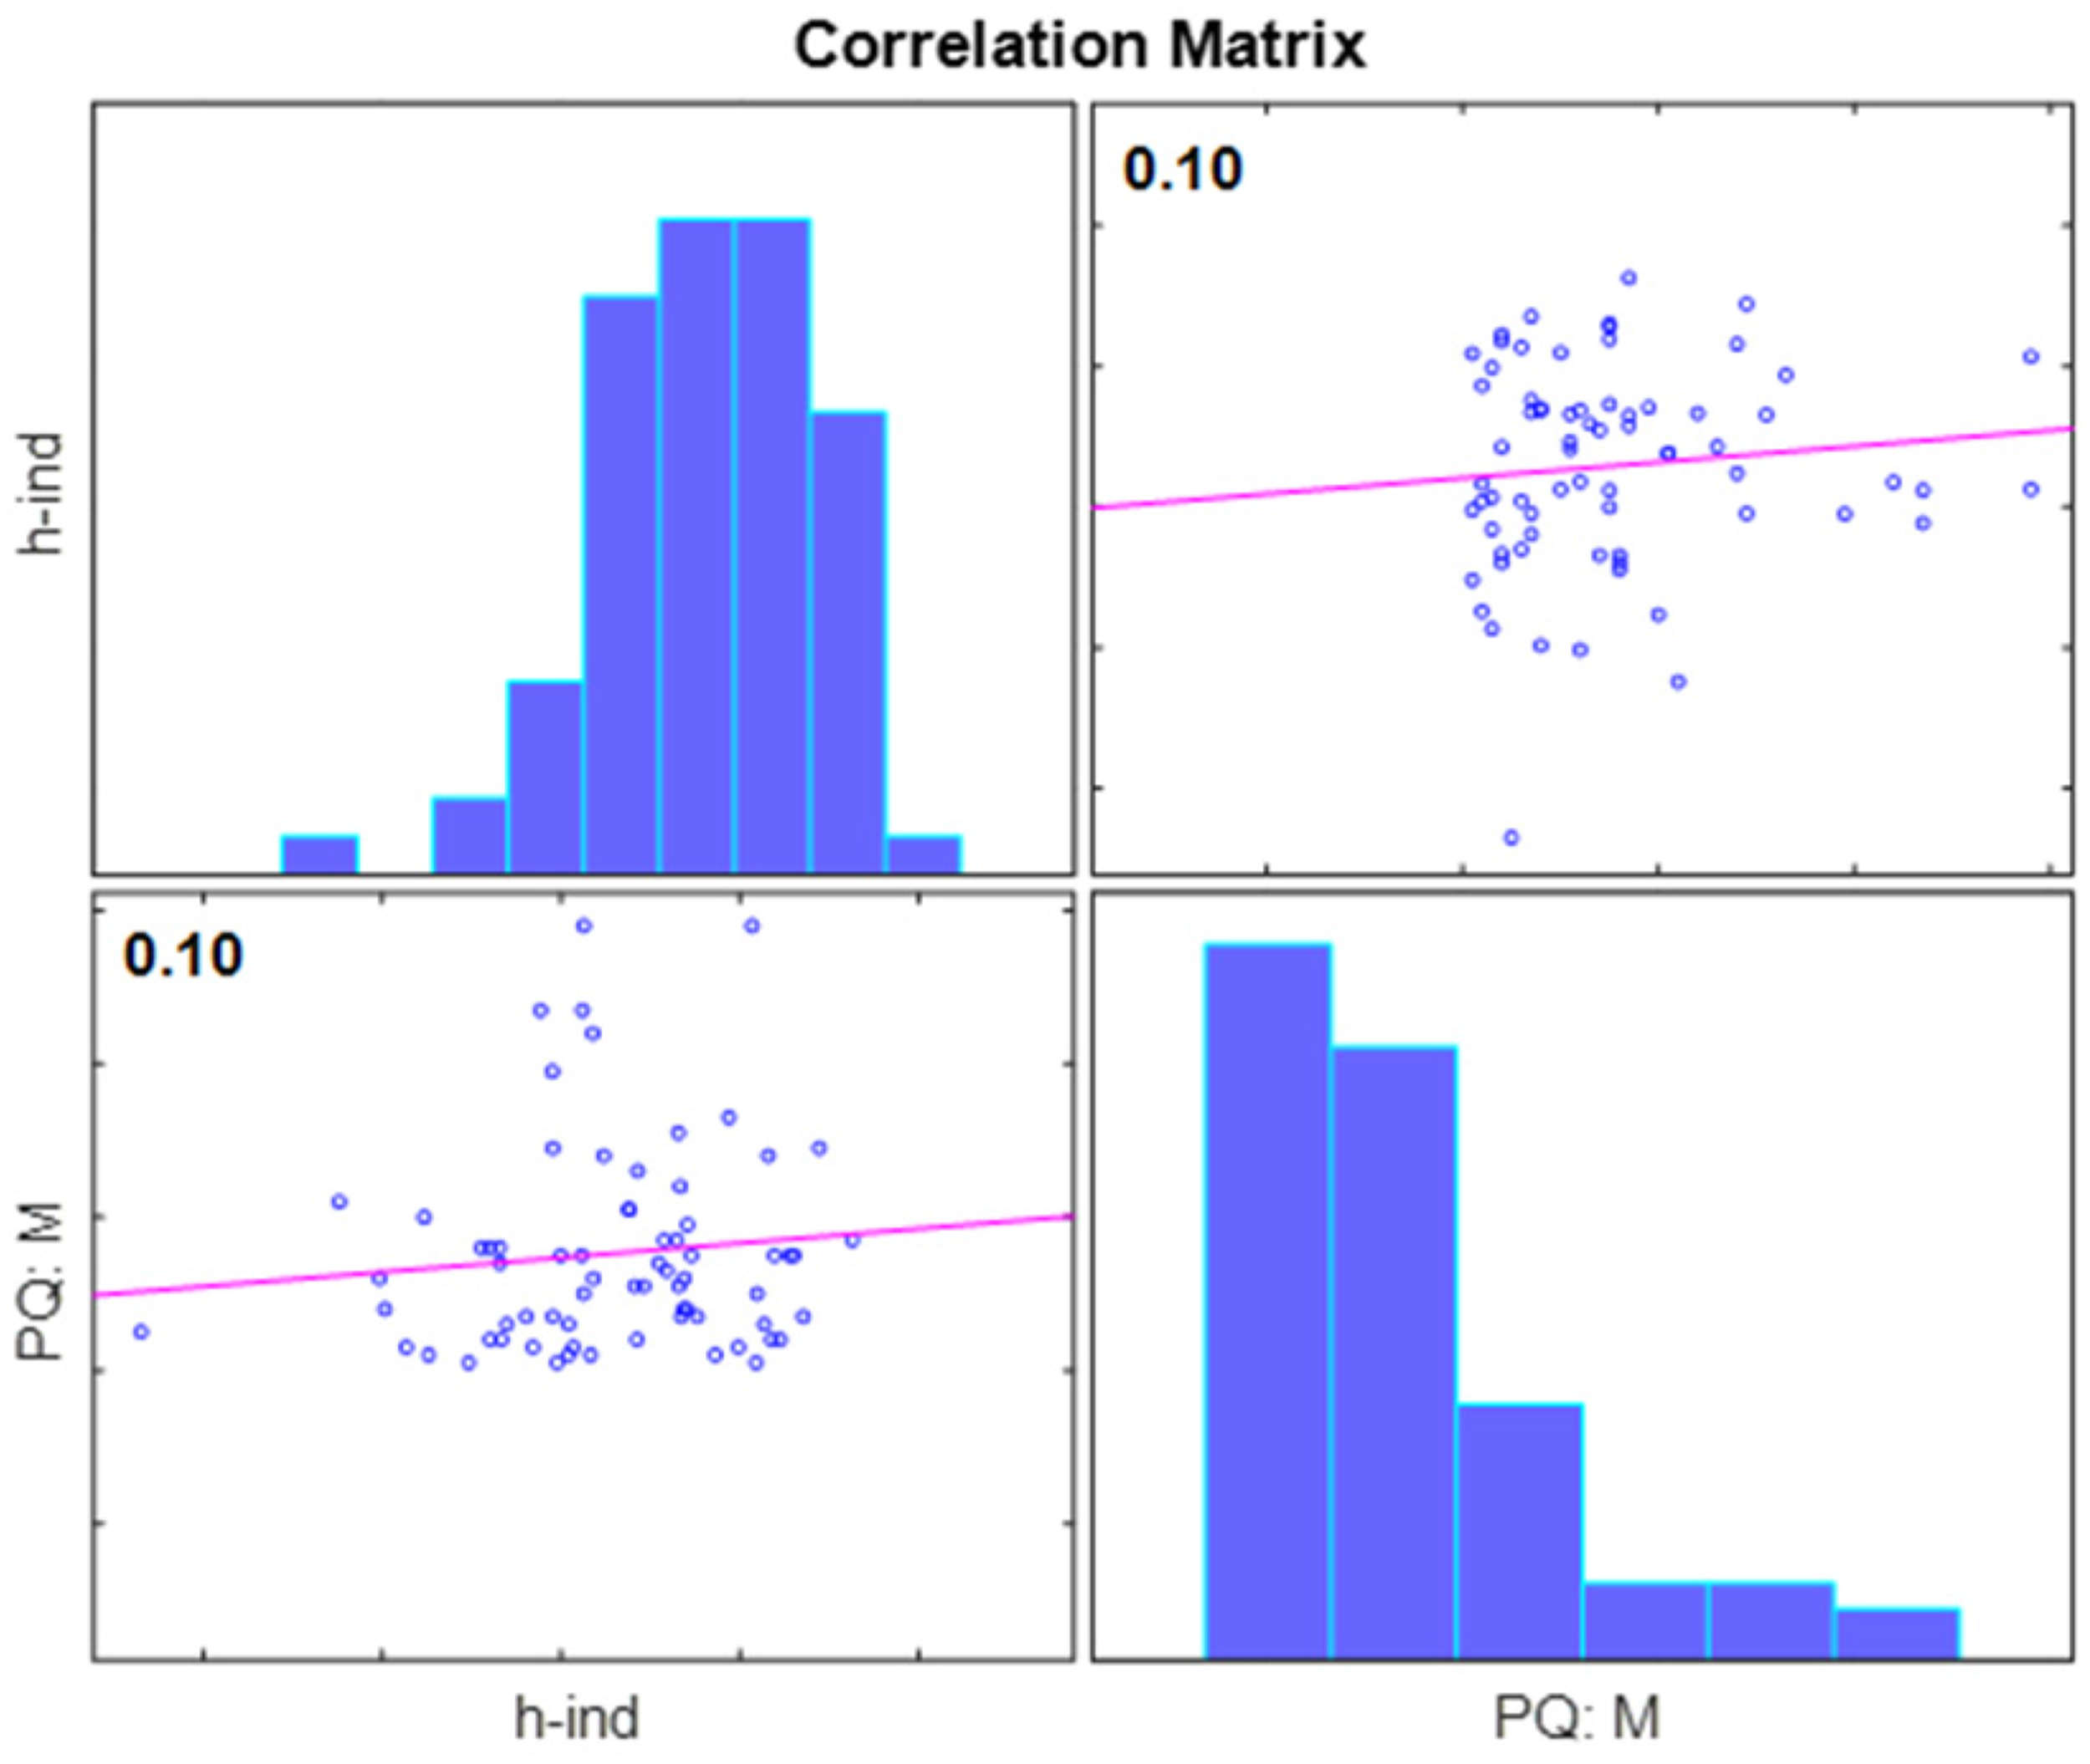
The loci of
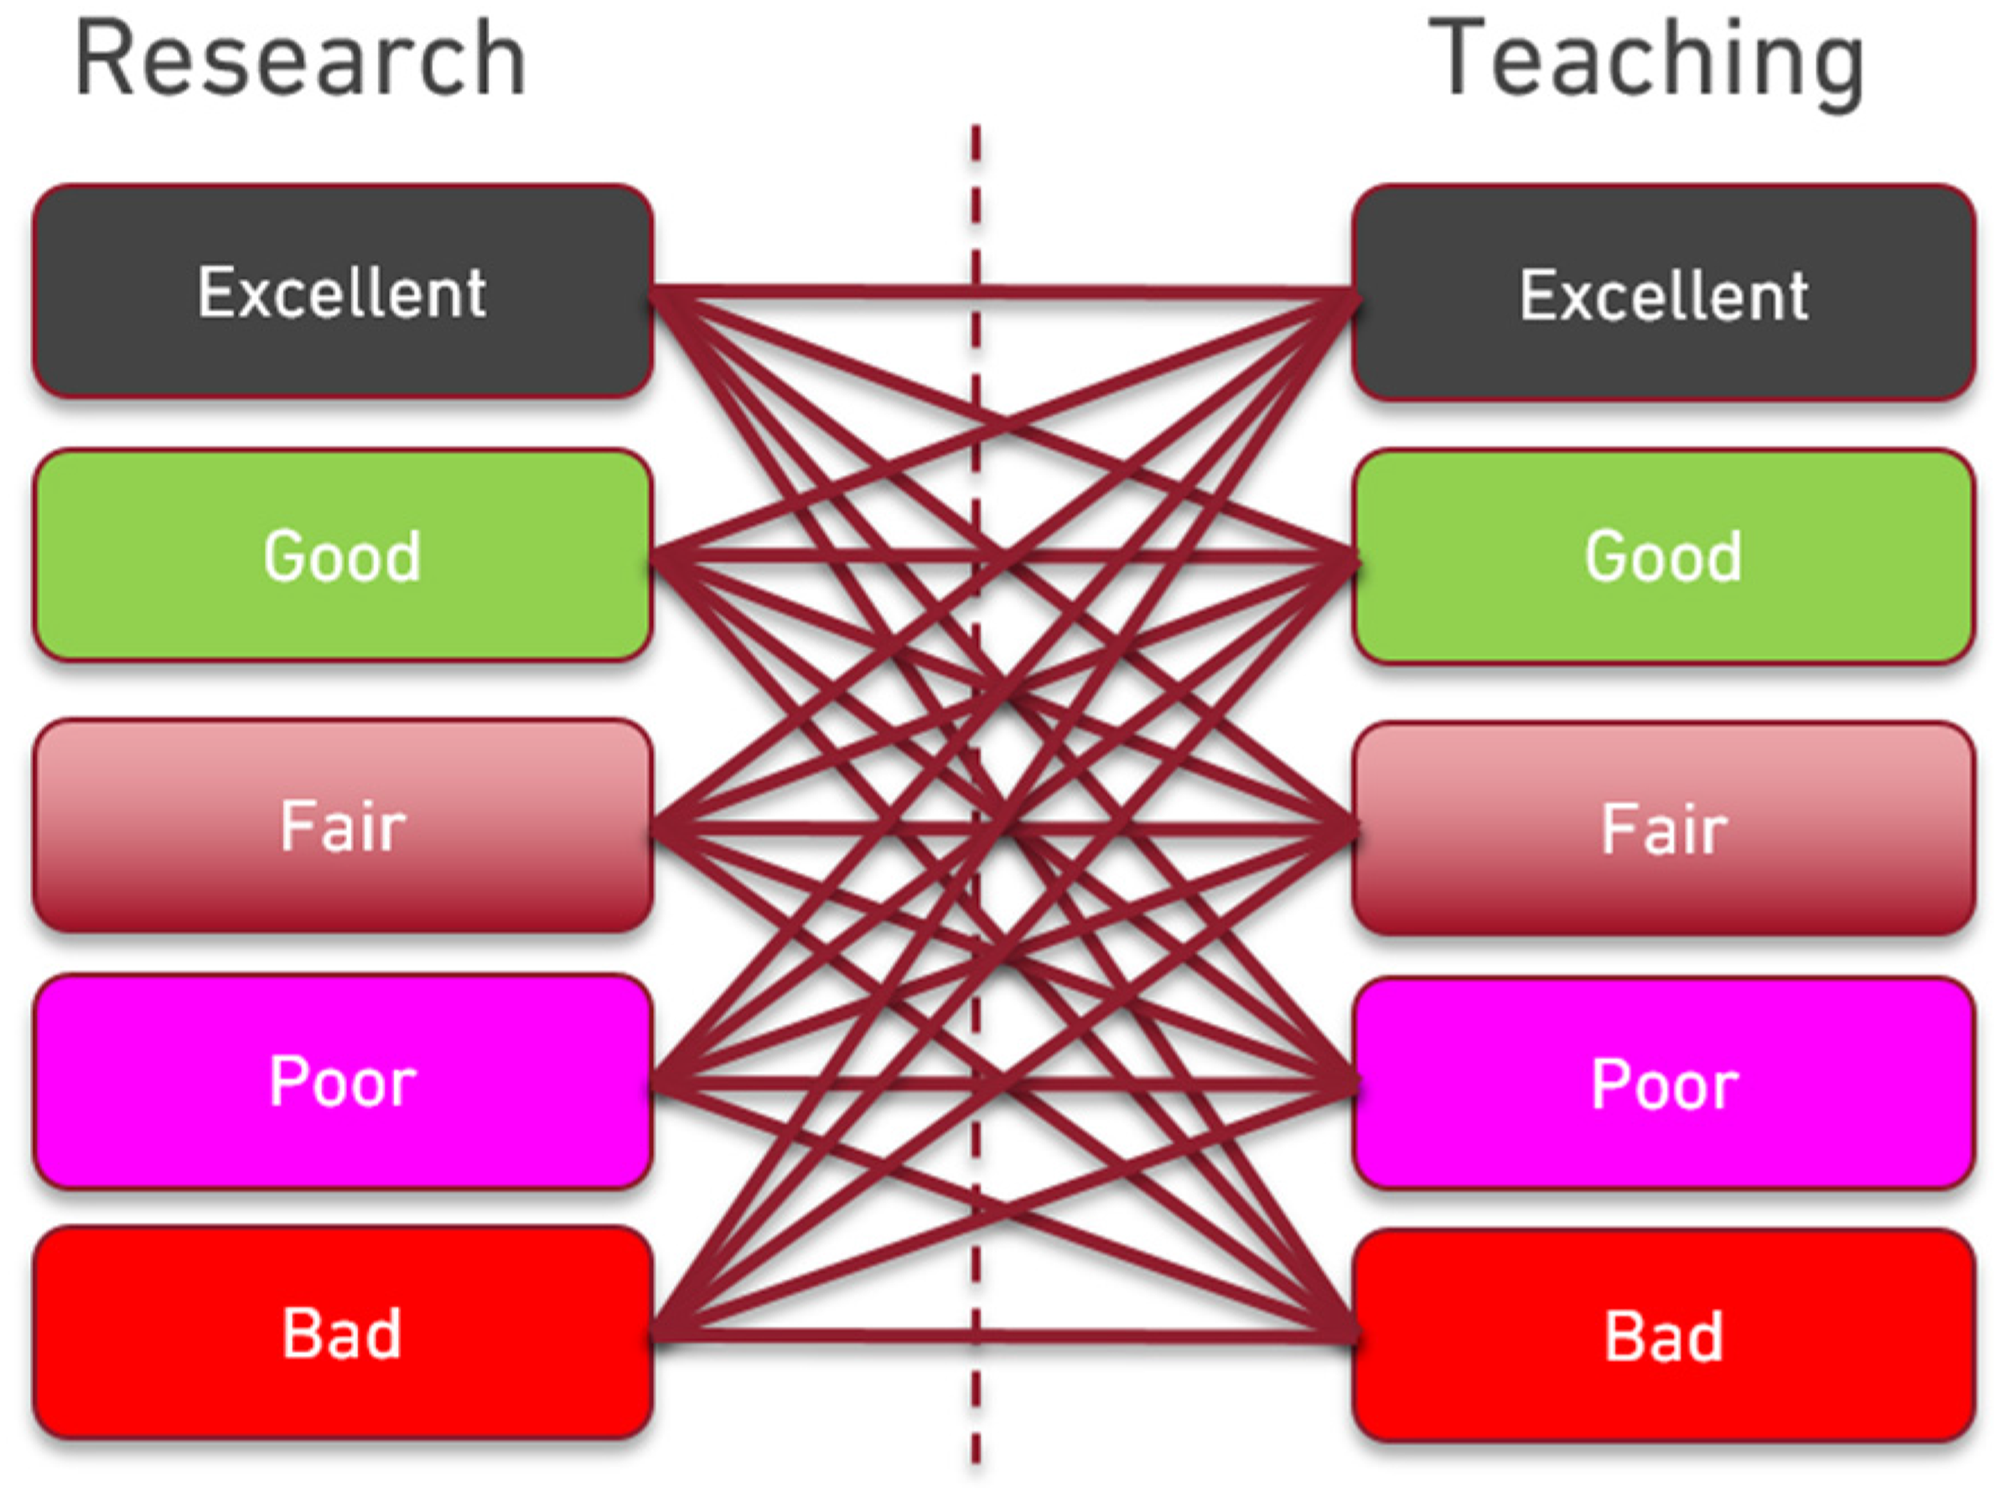
The performance combinations that each element of the MIEM teaching staff can unveil.
The findings strengthen the idea that all elements of the teaching staff can potentially be good on both areas of activity. However, the question of how to accomplish this endeavor remains open.
Conclusions
This paper studied the research and teaching performance of the teaching staff of the MIEM at FEUP. The performance was measured by distinct scientometrics, and by the marks attributed by the students to the teachers through PQs.
It was found that the MIEM teaching staff has good publication rating, which contributes to rank FEUP on the top 20 European institutions in the area of Mechanical Engineering However, the distribution of research metrics is uneven, showing that about 50% of the staff contributes just with 10% of the bibliometric production. Concerning the teaching performance, the MIEM staff is highly appreciated by the students, with just a few elements having modest rating. Moreover, the scientific and teaching data reveal weak correlation, demonstrating that neither a pre-established pattern nor fate determines the success or failure of teachers in any area of professional activity. Therefore, why are individuals not all good or excellent in both research and teaching? It is not expected that the answer to this question is simple, and many reasons may exist. However, would it be because we feel that:
It is not worth working harder because we feel that we will never get a promotion; It is not worth working harder because we feel that nobody recognizes our merit; It is not worth working harder because we feel that, even doing just the minimum, we will not get fired? Better organization; More support (e.g., financial, supervision from those more experienced); Fair recognition of merit?
On the other hand, would we become all good/excellent if we had:
When evaluating the performance of university teachers, multiple aspects are often considered. The different criteria must be somehow combined and, in the end, a score must be computed and a ranking obtained. Any process for assessment of performance is complex, controversial and often generates wide debate. However, the objective herein was not to propose an algorithm capable of elaborating a ranking of university teachers based on their performance indices, but just to know if there exists any correlation between research and teaching performance. Two important components, usually considered in assessment models of university teachers, were considered, and used separately: one is related to the quantity and quality of scientific publications, that is, the number of publications and citations, and the another is related to the quality of the classes taught, as seen by the students. They mirror only a part of the university teacher's performance, but they are: (i) objective, (ii) easy to obtain, and (iii) easy to handle numerically. Moreover, they capture a significant component of the effort of faculty members in their daily activities and they have the advantage of being directly interpreted outside the academy.
It should be pointed out that if the goal was to classify faculty members based on their overall productivity, then data of all components could have been used at once in the HC method, even with additional quantitative data measuring other faculty members” features. Indeed, the algorithm can handle multidimensional data, no matter how many dimensions there are, and no weights are needed to combine the data. However, it should be pointed out that, as more heterogeneous the data are, more precautions should be taken to choose a suitable normalization, so that numerical saturation is avoided.
Further research will try to include more variables in the analysis of performance and will seek more assertive answers to the raised questions.
Footnotes
Declaration of conflicting interests
The author(s) declared no potential conflicts of interest with respect to the research, authorship, and/or publication of this article.
Funding
The author(s) received no financial support for the research, authorship, and/or publication of this article