
Abstract
This paper undertakes an examination of bibliometric indicators by the faculty members affiliated in the Faculty of Engineering at the University of Porto (FEUP) and the other mechanical departments from Portuguese universities. Evaluation of the performance across both realms of associate and full professors is conducted through an assessment of individuals’ publication output and their impact within the scientific community. The teaching staff of FEUP includes engineering departments: mechanical; chemical; civil; informatics; metallurgical and materials; electrical and computer; industrial engineering and management. Outside the faculty, the mechanical engineering departments from University of Coimbra (UC) and University of Lisbon (IST-UL) where considered. The citation profiles (CP) pertaining to the professors are publicly accessible and were retrieved from the Scopus database as of April 2024. The methodology consists in processing and analysing Scopus datasheets recurring to bibliometric indices. The Canberra distance was one employed metric to qualify disparities between datasets. The results were compared through two approaches: i) presented in two-dimensional normalized graphics to easily compare both associate and full professors in each and throughout departments; ii) using multidimensional scaling techniques (MDS) and hierarchical clustering, which enables direct comparison of professors by leveraging their relative positioning and discernible patterns within two-dimensional maps. The results confirm expected trends of higher scientific performance with academic rank, while revealing notable inter- and intra-institutional differences, especially within FEUP, where strong internal categories stratification contrasts with the more uniform profiles of FCTUC and IST, and where full professors excel but assistant professors lag behind their peers elsewhere.
Keywords
Introduction
Quantifying the scientific output of researchers can be performed in terms of productivity, based on the volume of work produced and impact factor, measured by the recognition and influence that work garners within the scientific community. This has become increasingly vital in the contemporary academic and scientific landscape. Universities, research journals, funding bodies, promotion committees and employers rely heavily on bibliometric and performance-based indicators to evaluate individual and institutional success. These metrics are instrumental not only in assessing academic merit, but also in forming strategic decisions such as resource allocation, institutional rankings and, perhaps most notably, faculty promotions. 1
In the context of Portuguese public universities, academic career progression, chronologically advancing from assistant to associate to full professor, is governed by national legislation that outlines a comprehensive framework for academic duties. These include scientific research, technological development, teaching, student supervision, community engagement and participation in institutional governance. Among these, research and teaching are particularly influential in performance evaluations and promotion decisions, often bearing the greatest weight in formal assessments. 2 Despite the structured evaluation system, faculty members frequently display diverse profiles, with varying degrees of strength in different domains. A longstanding debate persists regarding the potential trade-off between excellence in research and effectiveness in teaching.
The academic career at the Faculty of Engineering of the University of Porto (FEUP) is governed by a structured framework that aligns with the national regulations established by the “Estatuto da Carreira Docente Universitária” (ECDU). Within this framework, the progression from assistant professor to associate professor and ultimately to full professor, reflects not only seniority but, more importantly, the merit demonstrated through teaching, research and institutional service. All stages of this career progression are subject to public scrutiny, as they involve formal open competitions whose notices and results are published as official ordinances in the official journal of the Portuguese Republic (“Diário da República”).3–6 This guarantees transparency, ensures compliance with legal standards and reinforces the meritocratic principles that underpin academic advancement. Although the specific evaluation criteria may differ between institutions and positions, they are typically organised into four principal domains: scientific merit (30–50%); pedagogical experience and excellence (20–30%); outreach activities and the economic and social valorisation of knowledge (5–10%); contributions to academic governance (5–20%); proposed scientific and pedagogical plan (15–20%). Once this framework is established, it is common for only 40% of the weight attributed to scientific merit to be allocated to the candidate's research output. The remaining percentage typically reflects contributions such as project coordination, leadership of scientific teams and the organisation of academic conferences. It is also important to note that, unlike scientific merit, which often relies on more quantifiable indicators, the evaluation of the remaining components may be influenced by the perspectives and priorities of the evaluation board. This can introduce a degree of subjectivity and variability, potentially leading to differing interpretations of merit between evaluation processes.
This paper aims to evaluate the research performance of faculty professors in several leading Portuguese engineering departments through two main analyses. The first focusses on the seven largest departments within FEUP, analysing associate and full positions. The second focusses on the three largest mechanical engineering departments in Portugal, those of FEUP, the University of Coimbra (UC) and the Technical Institute of the University of Lisbon (IST), evaluating the three professor categories. In total, the study examines 360 permanent faculty members from these institutions. Using bibliographic data retrieved from Scopus, the study conducts a comparative analysis of key scientific indices to assess individual and departmental research productivity, thereby deliberating and correlating it with professor positions in such departments. The methodology involves processing and analysing the data sets to identify the core elements of scientific output, evaluate career position and explore potential correlations and benchmarking opportunities between departments. This is possible recurring to the analysis of different scientific performance metrics by means of multidimensional scaling (MDS) and clustering, namely hierarchical (HC). The study applies a comparative analysis of key scientific indexes to assess individual and departmental research productivity. The methodology chosen involves processing and analysing both datasets to capture essential elements of research productivity and career position as a function of the scientific output and to investigate potential correlations between departments and to compare and benchmark them. Although this approach may not capture all academic contributions, it provides an objective assessment framework that reflects the primary responsibilities of faculty.
Characterization of the dataset
Scientific dataset
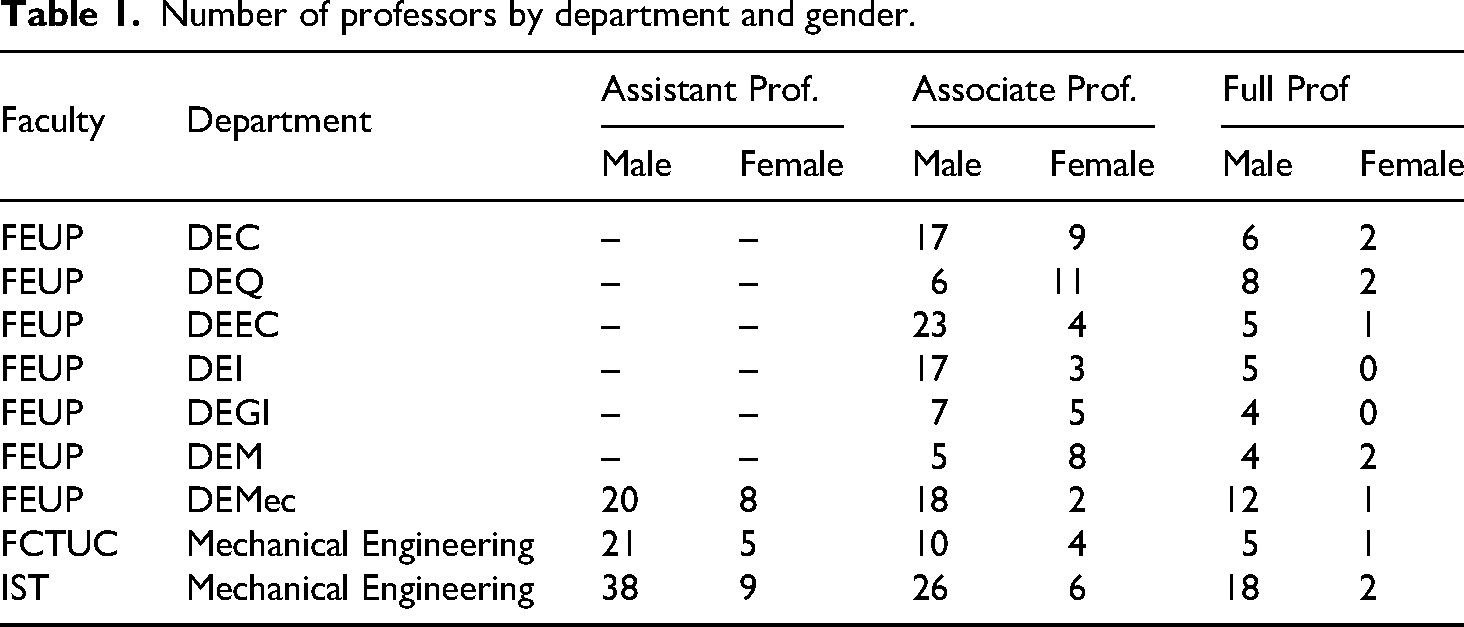
Bibliographic information can be found in various databases, including Elsevier's Scopus, which is widely recognised as a reliable resource in the field of scientometrics. According to Elsevier, Scopus serves as a leading repository of peer-reviewed publications, equipped with advanced tools to analyse, visualise and monitor research data. The database is regularly updated and its sources are rigorously evaluated to ensure quality. The bibliographic data used in this study relate to the career profiles (CPs) of 360 individuals (Table 1), retrieved on April 23 rd 2024. These individuals consist of associate and full professors in seven departments of the Faculty of Engineering of the University of Porto (FEUP): Department of Chemical Engineering (DEQ); Department of Civil Engineering (DEC); Department of Electrical and Computer Engineering (DEEC); Department of Industrial Engineering and Management (DEGI); Department of Informatics Engineering (DEI); Department of Materials Engineering (DEM); Department of Mechanical Engineering (DEMec). In addition, assistant professors as well as the other two highest category professors of the three largest mechanical engineering departments in Portugal are also part of the selected individuals, being the Department of Mechanical Engineering at FEUP (DEMec), Faculty of Science and Technology of the University of Coimbra (FCTUC) and Technical Institute of Lisbon (IST). These CPs, which cover the years 1982 to 2024, are publicly accessible and provide comprehensive records that enable the calculation of various indices to evaluate scientific performance.
Number of professors by department and gender.
Quantification indices
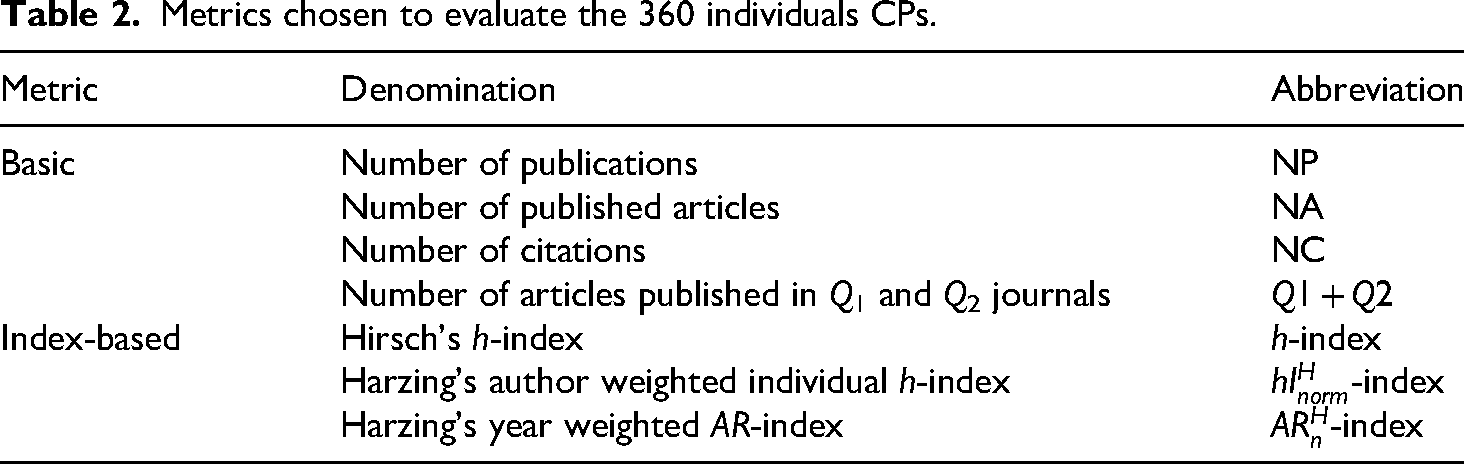
The development of new indices has been an active area of research, with numerous proposals put forward. Although indices generally exhibit correlations with each other, determining the most effective one to rank the CPs remains an unresolved question. In this paper, to address the multidimensional nature of the problem, the following metrics were adopted: number of publications; number of articles; number of citations; number of publications in Q1 and Q2 journals; h-index; Harzing's
Metrics chosen to evaluate the 360 individuals CPs.
Quantifying the scientific productivity and impact of researchers is essential in many contexts, including universities, academic journals, funding agencies, promotion committees and employers. The h-index, introduced by the physicist Jorge E. Hirsch,
7
has become one of the most recognised metrics for assessing research output. The h-index
The h-index is particularly valued for distillate work into a single score that remains stable between works of varying citation counts.
8
However, like any single-parameter measure, it has limitations: it fails to capture the full multidimensionality to career stage or research activity status and does not account for discipline-specific variations in CPs. These limitations have led to the development of complementary indices, such as the g-index,
9
h2-index and e-index,
10
each of which is different from highly cited publications or differentiating researchers with similar h-values but different CPs.
11
Other indices address the citation age,
12
co-authorship effects,13–15 and combinations of both time and authorship factors. Since the h-index is inherently cumulative and can only increase over time, it allows high-index research to relax, preserving its values for years without requiring ongoing contributions. In addition, this metric puts newcomers at a disadvantage and is influenced by self-citations. To address these disadvantages, an age weight index was adopted. The age-dependent AR-index was inspired by the work of Bihui Jin.
12
Jin's AR-index measures the number of citations to an entire body of work, adjusted for the age of each individual paper that contributed to the h-index, which is the amount represented by nh. Specifically, it calculates an age-weighted citation rate by dividing the number of citations for a given article (ci) by the age of that paper (agei). Jin defines the AR-index as the square root of the sum of all age-weighted citation counts for articles that contribute to the h-index. This index is based on Jin's A-index, which calculates the average citations per publication within the Hirsch core and the R-index, given by 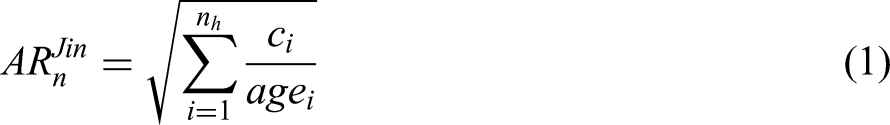
Harzing proposes summing age-weighted citation counts across all publications (
Another aspect of individual performance commonly addressed is the evaluation. This takes into account the number of authors per paper, which benefits the authors that appear in the lower number of authors. The Individual h-index, proposed by Bastista et al.,
13
divides the standard h-index by the average number of authors in the articles that contribute to the h-index, in order to reduce the effects of co-authorship; the resulting index is called hI. Harzing also implements an alternative individual h-index, hInorm, which takes a different approach: instead of dividing the total h-index, she first normalises the number of citations for each paper (
Let it be noted that all the indices have some kind of relationship, it being very difficult to have independent metrics, meaning that whether one index tends to increase, so do the others. Scientific publication metrics typically show varying degrees of correlation with one another. This can be calculated in succession recurring to a few correlation methods, being the Spearman monotonic relationship, 17 Kendall's τ, 18 Cosine similarity, 19 Mahalanobis distance 20 and Jaccard similarity, 21 depending on the tendency. Figure 1 illustrates the Pearson correlation, a well-known and simple method, value between each pair of metric {p,q}, for p, q = 1,…,7. Along the diagonal of the matrix, histograms of the seven indices are presented. The analysis reveals that most of the indices are strongly correlated, exhibiting an overall linear relationship. This was also indicated in previous work,1,22 in which more index-based metrics showed high Pearson correlation values (above 0.7), with one exception being the Sidiropoulos normalised h-index.
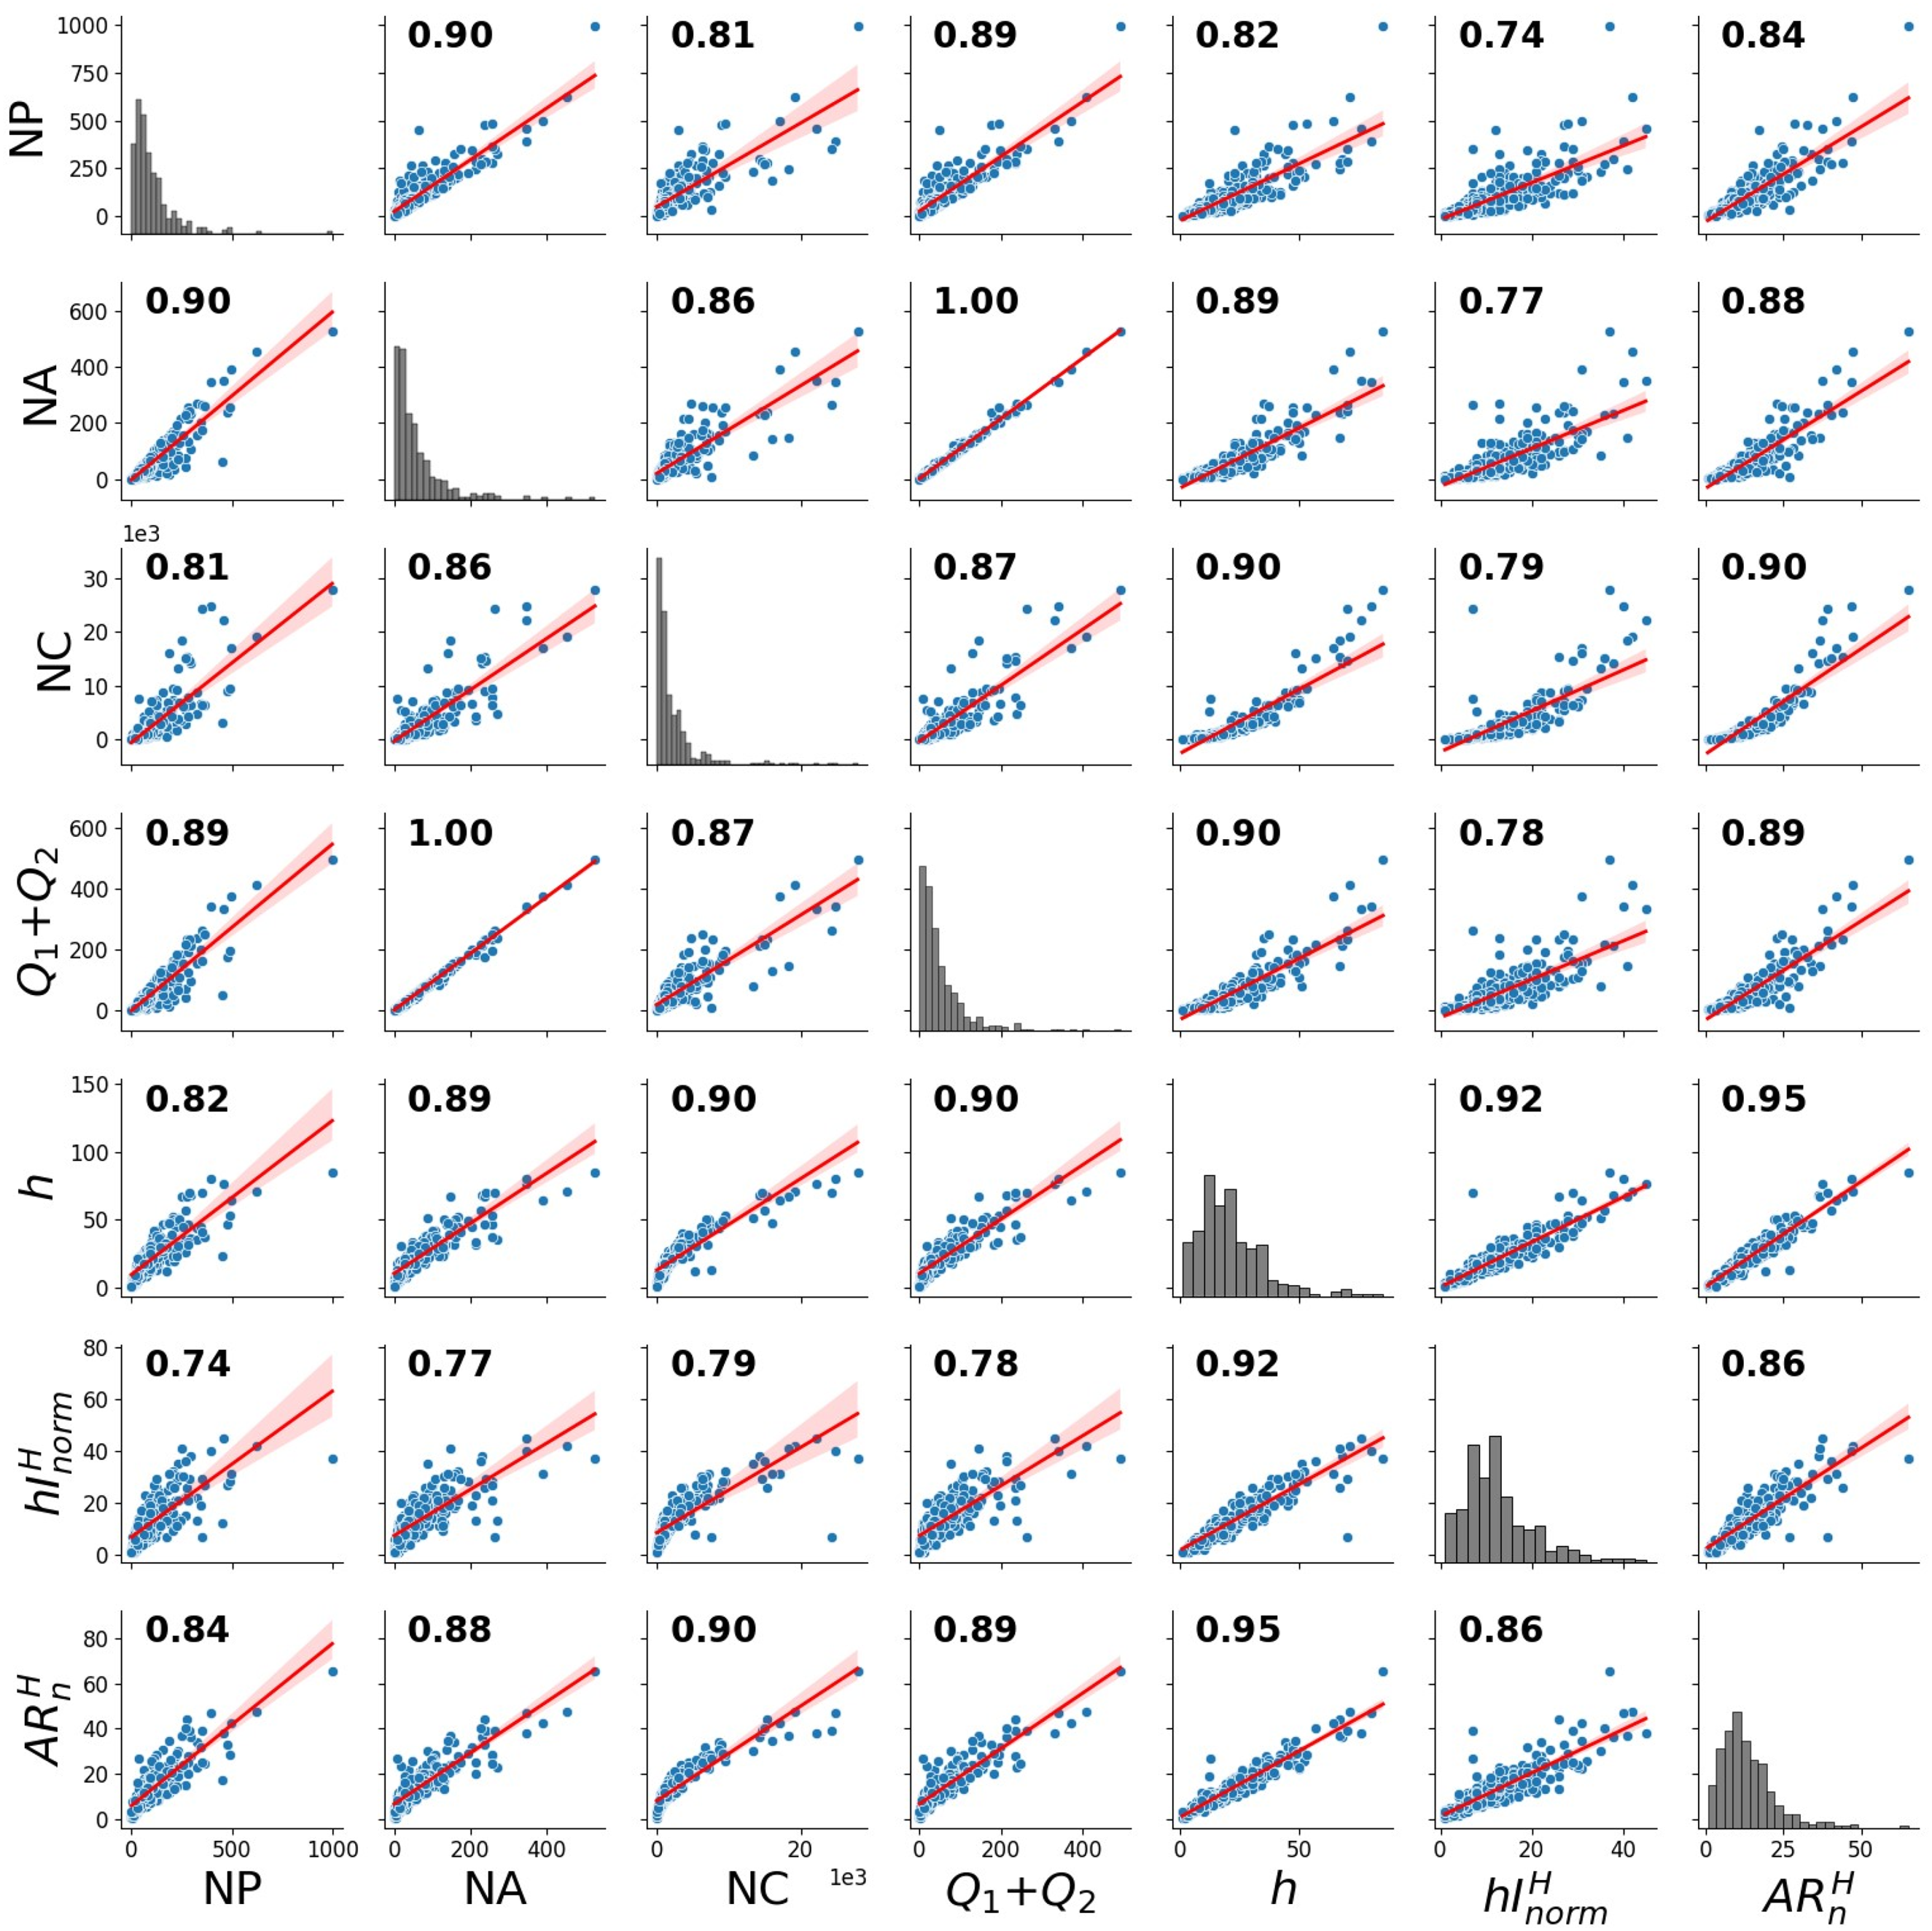
Pearson correlation between the seven metrics considering the 360 researchers CPs.
To assess the indices values and compare them with the CPs, a dissimilarity matrix can be computed using any metric or divergence method for further analysis. These methods can be the Eucledean distance,23,24 the Canberra distance 24 or the Jensen-Shannon divergence (JSD). 22
Mathematical and computational tools
This section provides the mathematical foundations required for processing the data, specifically focussing on the Canberra distance and the MDS and HC techniques. These methods are essential for analysing and interpreting complex datasets, offering insights into similarity measures, divergence performance metrics and dimensionality reduction.
The Canberra distance
The Canberra distance (CD) was initially proposed by Lance and Williams.
24
This distance metric is particularly useful for comparing points with values that span several orders of magnitude, since it normalises the differences by the sum of the absolute values.
22
Given two points in a K-dimensional space, X = (x1,…,xn) and Y = (y1,…,yn), the Canberra distance between them is given by: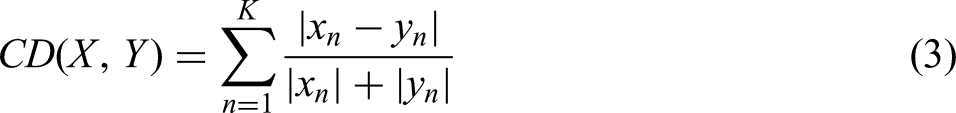
The equation above is commonly used to quantify the dissimilarity between data points that are distributed around an origin. The Canberra distance has several notable properties. It is unitary when the arguments are symmetric, meaning that the distance between two identical points is equal. It exhibits a bias when applied to data near the origin and it is particularly sensitive to small differences in values close to zero, making it a useful measure for detecting fine variations in such regions.
Multidimensional scaling
MDS is a computational technique widely used to cluster and visualise high-dimensional data, aiming to represent data items as points in a lower-dimensional space while preserving pairwise differences between elements as faithfully as possible.25,26
In the current work, the MDS process begins with a data set containing s indices and a measure of dissimilarity between them. In a first phase, given s items and a measure of dissimilarity, a 
The interpretation of MDS lies in the patterns formed by the points, which can be visualised on the generated three-dimensional map. Importantly, information retrieval does not depend on the exact coordinates of the points or the geometric shape of the clusters. Since the relative distances between the points remain unchanged, the map can be freely rotated or translated without affecting the underlying dissimilarity relationships.
To compile multidimensional indices on a shorter developmental scale, MDS requires a mapping technique. Sammon mapping, also known as non-linear mapping (NLM), is a non-linear dimensionality reduction technique, presented by John Sammon,
27
which complements the analysis performed using MDS. While MDS focusses on preserving the global structure of inter-point distances in high-dimensional space, Sammon mapping enhances this by emphasising the preservation of local relationships among data points. This is particularly important when dealing with complex datasets, as it allows for a more faithful representation of the inherent structure.
28
One of the key advantages of using Sammon mapping in conjunction with MDS is its ability to capture nonlinear relationships that may not be adequately represented by linear methods such as Principal Component Analysis (PCA). By placing greater emphasis on maintaining small pairwise distances, Sammon mapping helps preserve local structures that could otherwise be lost in linear projections. Sammon's non-linear mapping criterion differs from Kruskal's stress formula by placing greater emphasis on preserving smaller distances.29,30 Although Kruskal's formula treats all distances equally, Sammon's approach prioritises the accurate representation of small distances, often at the expense of increased computational complexity and slower convergence of the algorithm.
23
The technique operates by minimising a specific stress function known as Sammon's stress, which quantifies the difference between the original distances and those in the projected space. This stress function is defined as: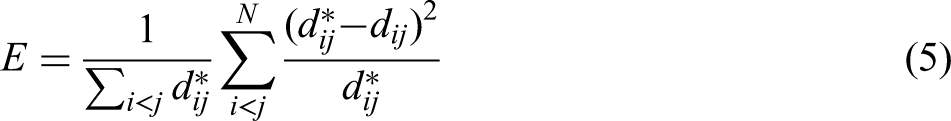
In this equation,
Hierarchical clustering
Clustering is a data analysis technique that groups similar items by identifying patterns of similarity or dissimilarity, facilitating the establishment of meaningful patterns and relationships in complex data sets. HC builds a hierarchy of clusters using two strategies, agglomerative and divisive clustering. In agglomerative clustering, each item starts in its own cluster and the algorithm iteratively merges the two most similar clusters until a single cluster remains. In divisive clustering, all items begin in one cluster and the algorithm successively separates the least cohesive clusters by removing “outsiders” until each item forms its own cluster. Both approaches rely on a linkage criterion to measure the dissimilarity between clusters, which is based on the distances between items in the clusters. Common linkage metrics include maximum (complete linkage), minimum (single linkage) and average linkage, which quantify distances between cluster members to guide the merging or splitting process. 31
Given two clusters, A and B, the distance 


After using one of the algorithms, the results of HC are presented in a graphical object such as a dendrogram or a hierarchical tree.24,32
Data analysis and results
This section evaluates differences between departments using the Canberra distance applied to 360 CPs. For each pair of researchers i and j with CPs
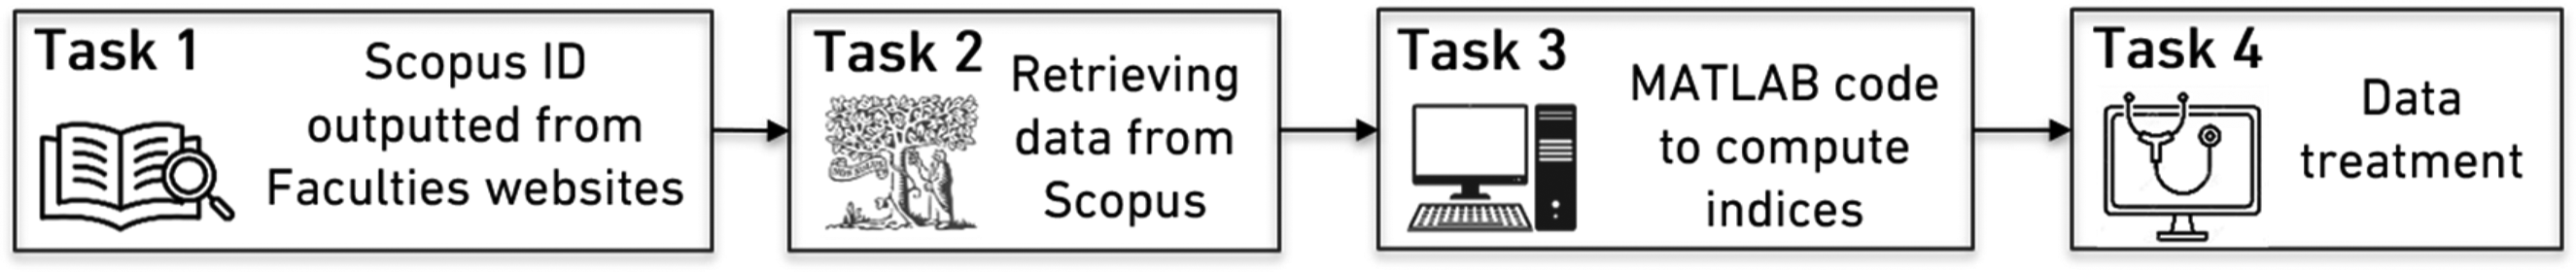
Methodology and work plan flow to assess the scientific output of the selected academia professors.
Assessment of FEUP departments
Having the selected data from the Elsevier Scopus database, it is possible to calculate the seven indices in which trivial statistics can be easily plotted, such as histograms, box plots and cumulative probability graphics. Figure 3 shows the box plots for each category of professors, associate and full, of each FEUP department for three basic metrics (total number of publications, total number of citations and total number of articles published) and for three index-based metric (h-index, h-individual Harzing normalisation index and AR-Harzing index). The number or percentage of articles published in Q1 or Q2 journals was not interesting to show, since most of the collected data show a high percentage of articles published in high Q journals.
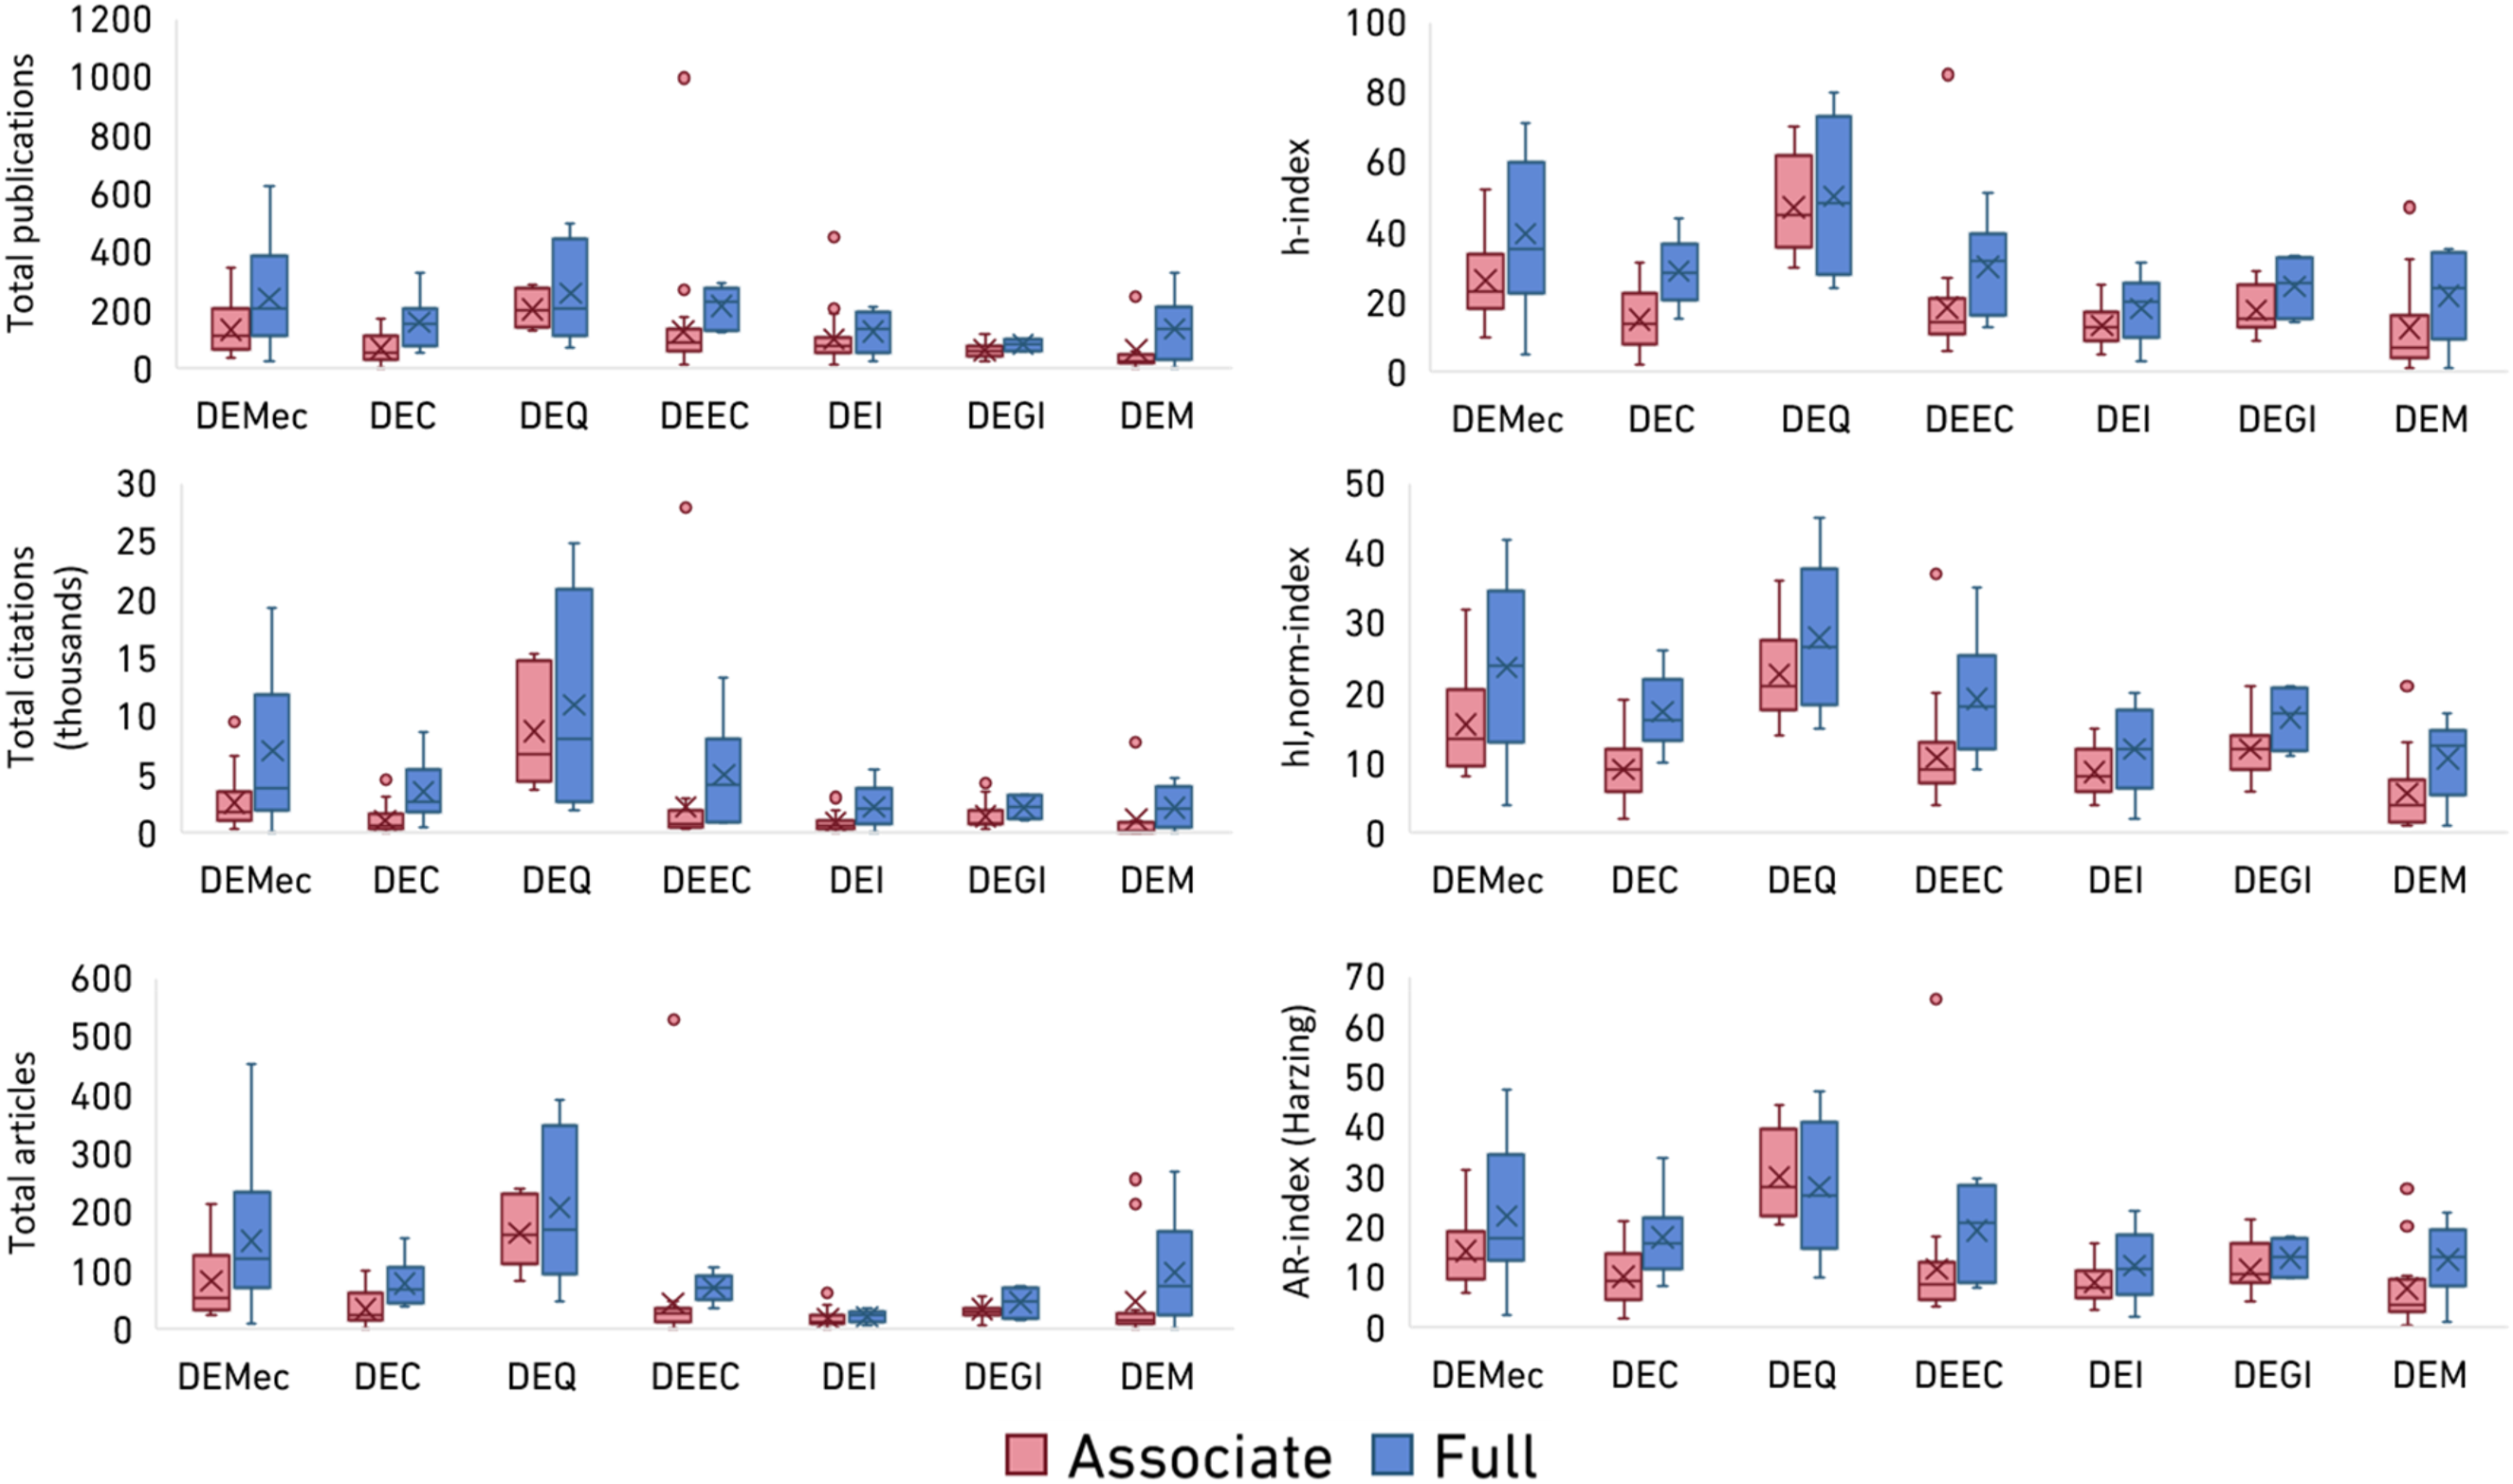
Boxplots charts of the six metrics for FEUP departments.
As expected, full professors tend to have higher scientific publication metrics than associate professors, as noted for all FEUP departments. However, among associate professors, there is a clear distinction for those in the DEQ department who not only publish more but also receive more citations. This results in not only a higher h-index, but also an increased
Another notable point is the size of each box plot, which is generally larger for full professors. Only the total number of articles published and citations generally has a higher deviation for full professor than for associate professor. As expected, the same trend is observed for the h-index. The only exception is the
To compare the average index values between associate and full professors in different departments, Figure 4 presents a radial graph that illustrates these values. Among associate professors, the DEQ stands out with significantly higher index values compared to other departments. However, for full professors, this gap narrows, with DEMec ranking second in terms of index values. In particular, all departments, regardless of rank, maintain a high percentage of articles published in Q1 and Q2 journals, highlighting the overall quality of publications.
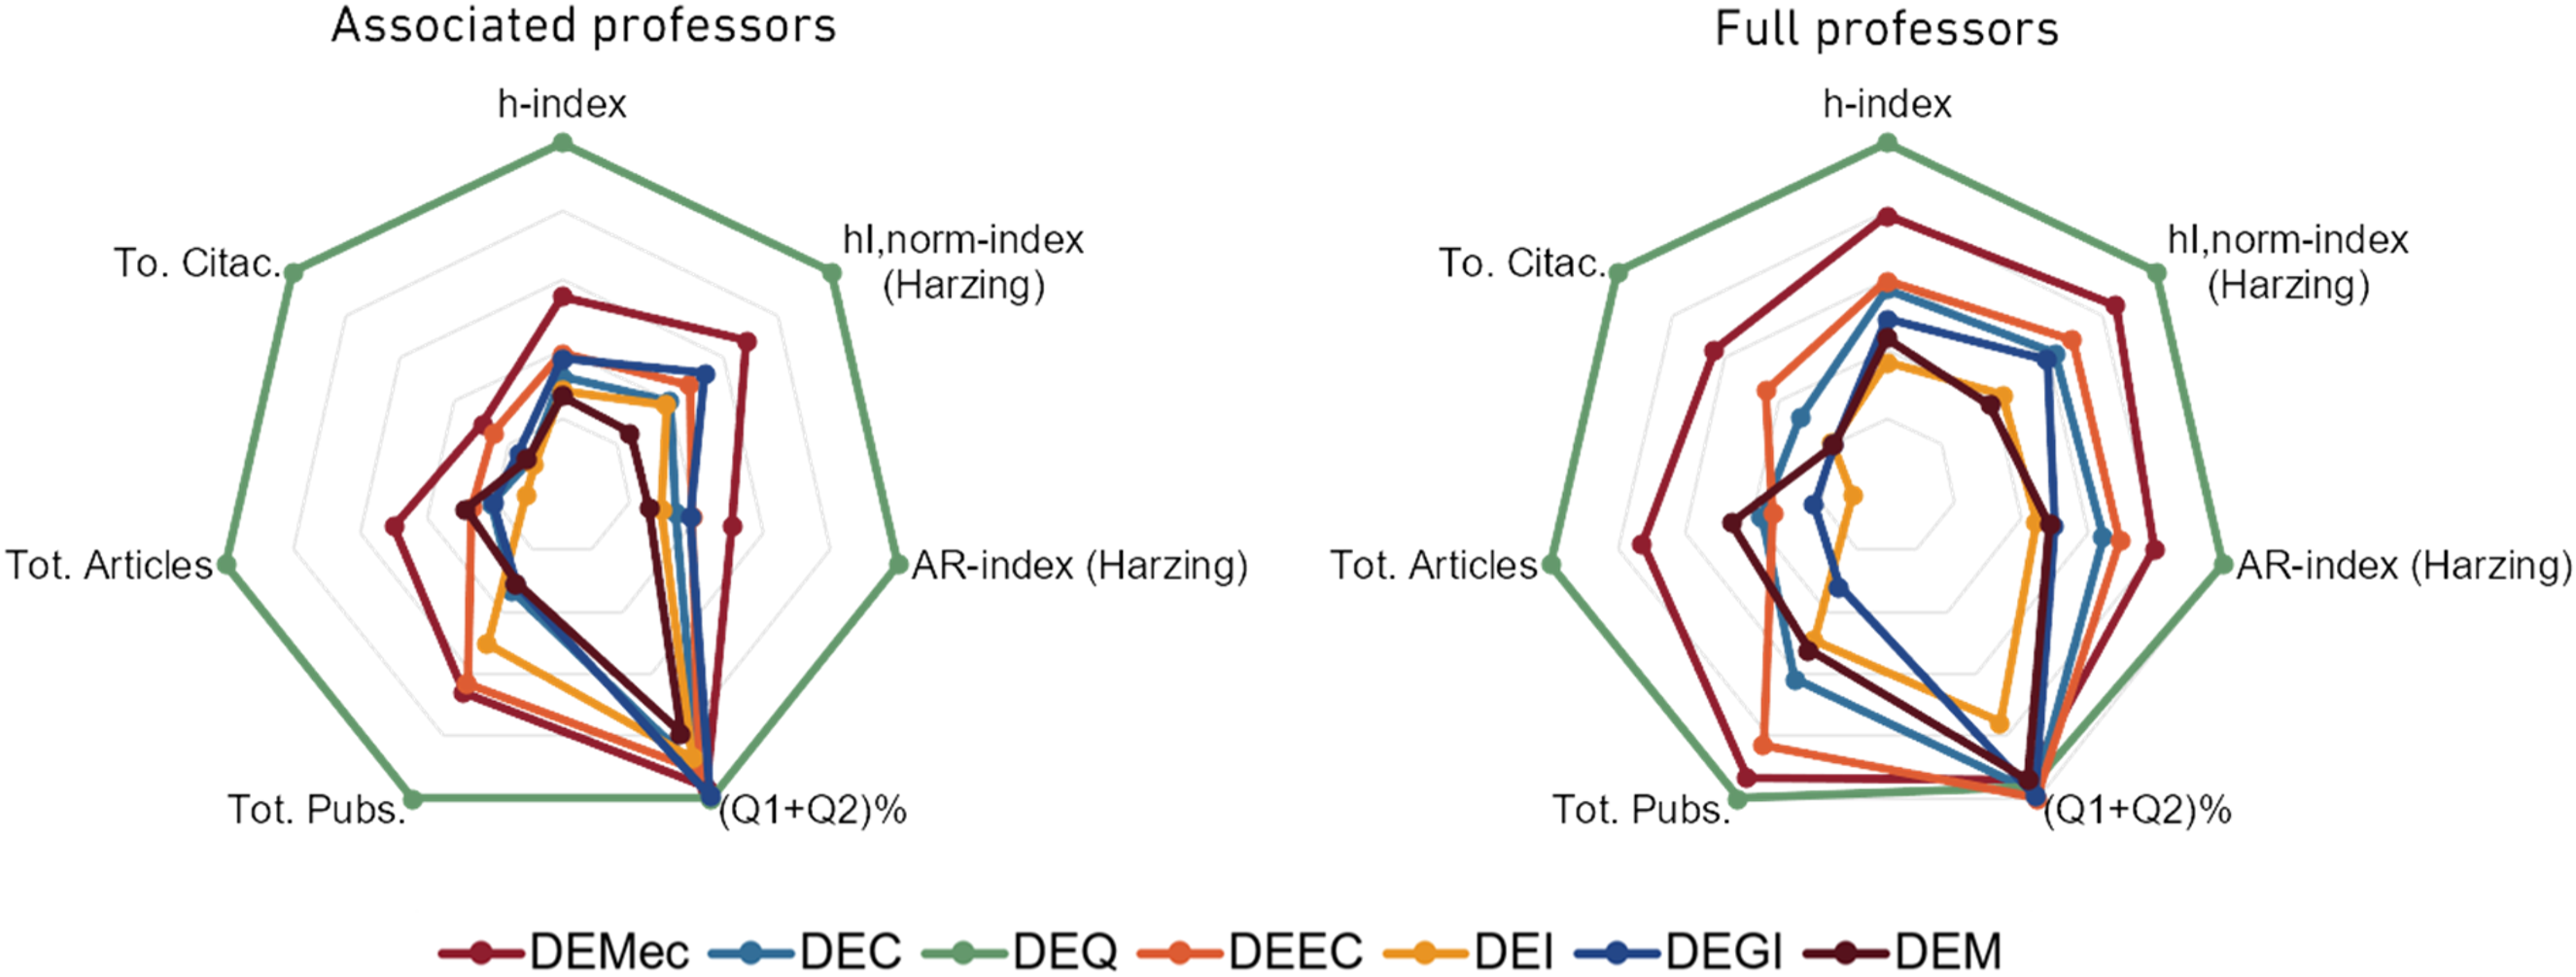
Comparison between average index value of the seven metrics for FEUP departments.
Assessment of mechanical engineering departments
Up to this point, only the CP of associate and full professors was analysed to compare and evaluate different departments at FEUP. To extend the analysis to the three largest mechanical engineering departments in Portugal, all three professor categories, assistant, associate and full were considered. The departments have in all categories a sizeable number of individuals which allow their characterisation and comparison, which would not be the same for the mechanical engineering departments of other Portuguese faculties such as the University of Aveiro (UA) and the University of Minho (UM).
To commence, a global analysis of the selected indexes can be performed. Figure 5 presents box plots for mechanical engineering departments in the three faculty categories. It is evident that all metric values increase with faculty rank, following a trend similar to that of other FEUP departments. The radial graphs in Figure 6 further illustrate the benchmark of each department's average CP performance across the seven metrics evaluated. Regarding assistant professors, FEUP generally exhibits lower index values compared to FCTUC and IST, which show a similar performance, with the exception of the number of articles published in the Q1 and Q2 journals. This highlights the fact that all departments maintain a strong percentage of publications in high-impact journals. Interestingly, for associate professors, the differences between departments diminish with all metrics converging. FEUP stands out in terms of total publications and h-index, while IST leads in the number of citations. Among full professors, FCTUC and IST exhibit similar performance levels. However, FEUP surpasses both in all evaluated metrics, except for publications in Q1 and Q2 journals, where all departments maintain a high percentage. This trend is particularly significant, as a strong presence in top-tier journals enhances the visibility and impact of research, subsequently influencing citation counts and the h-index.
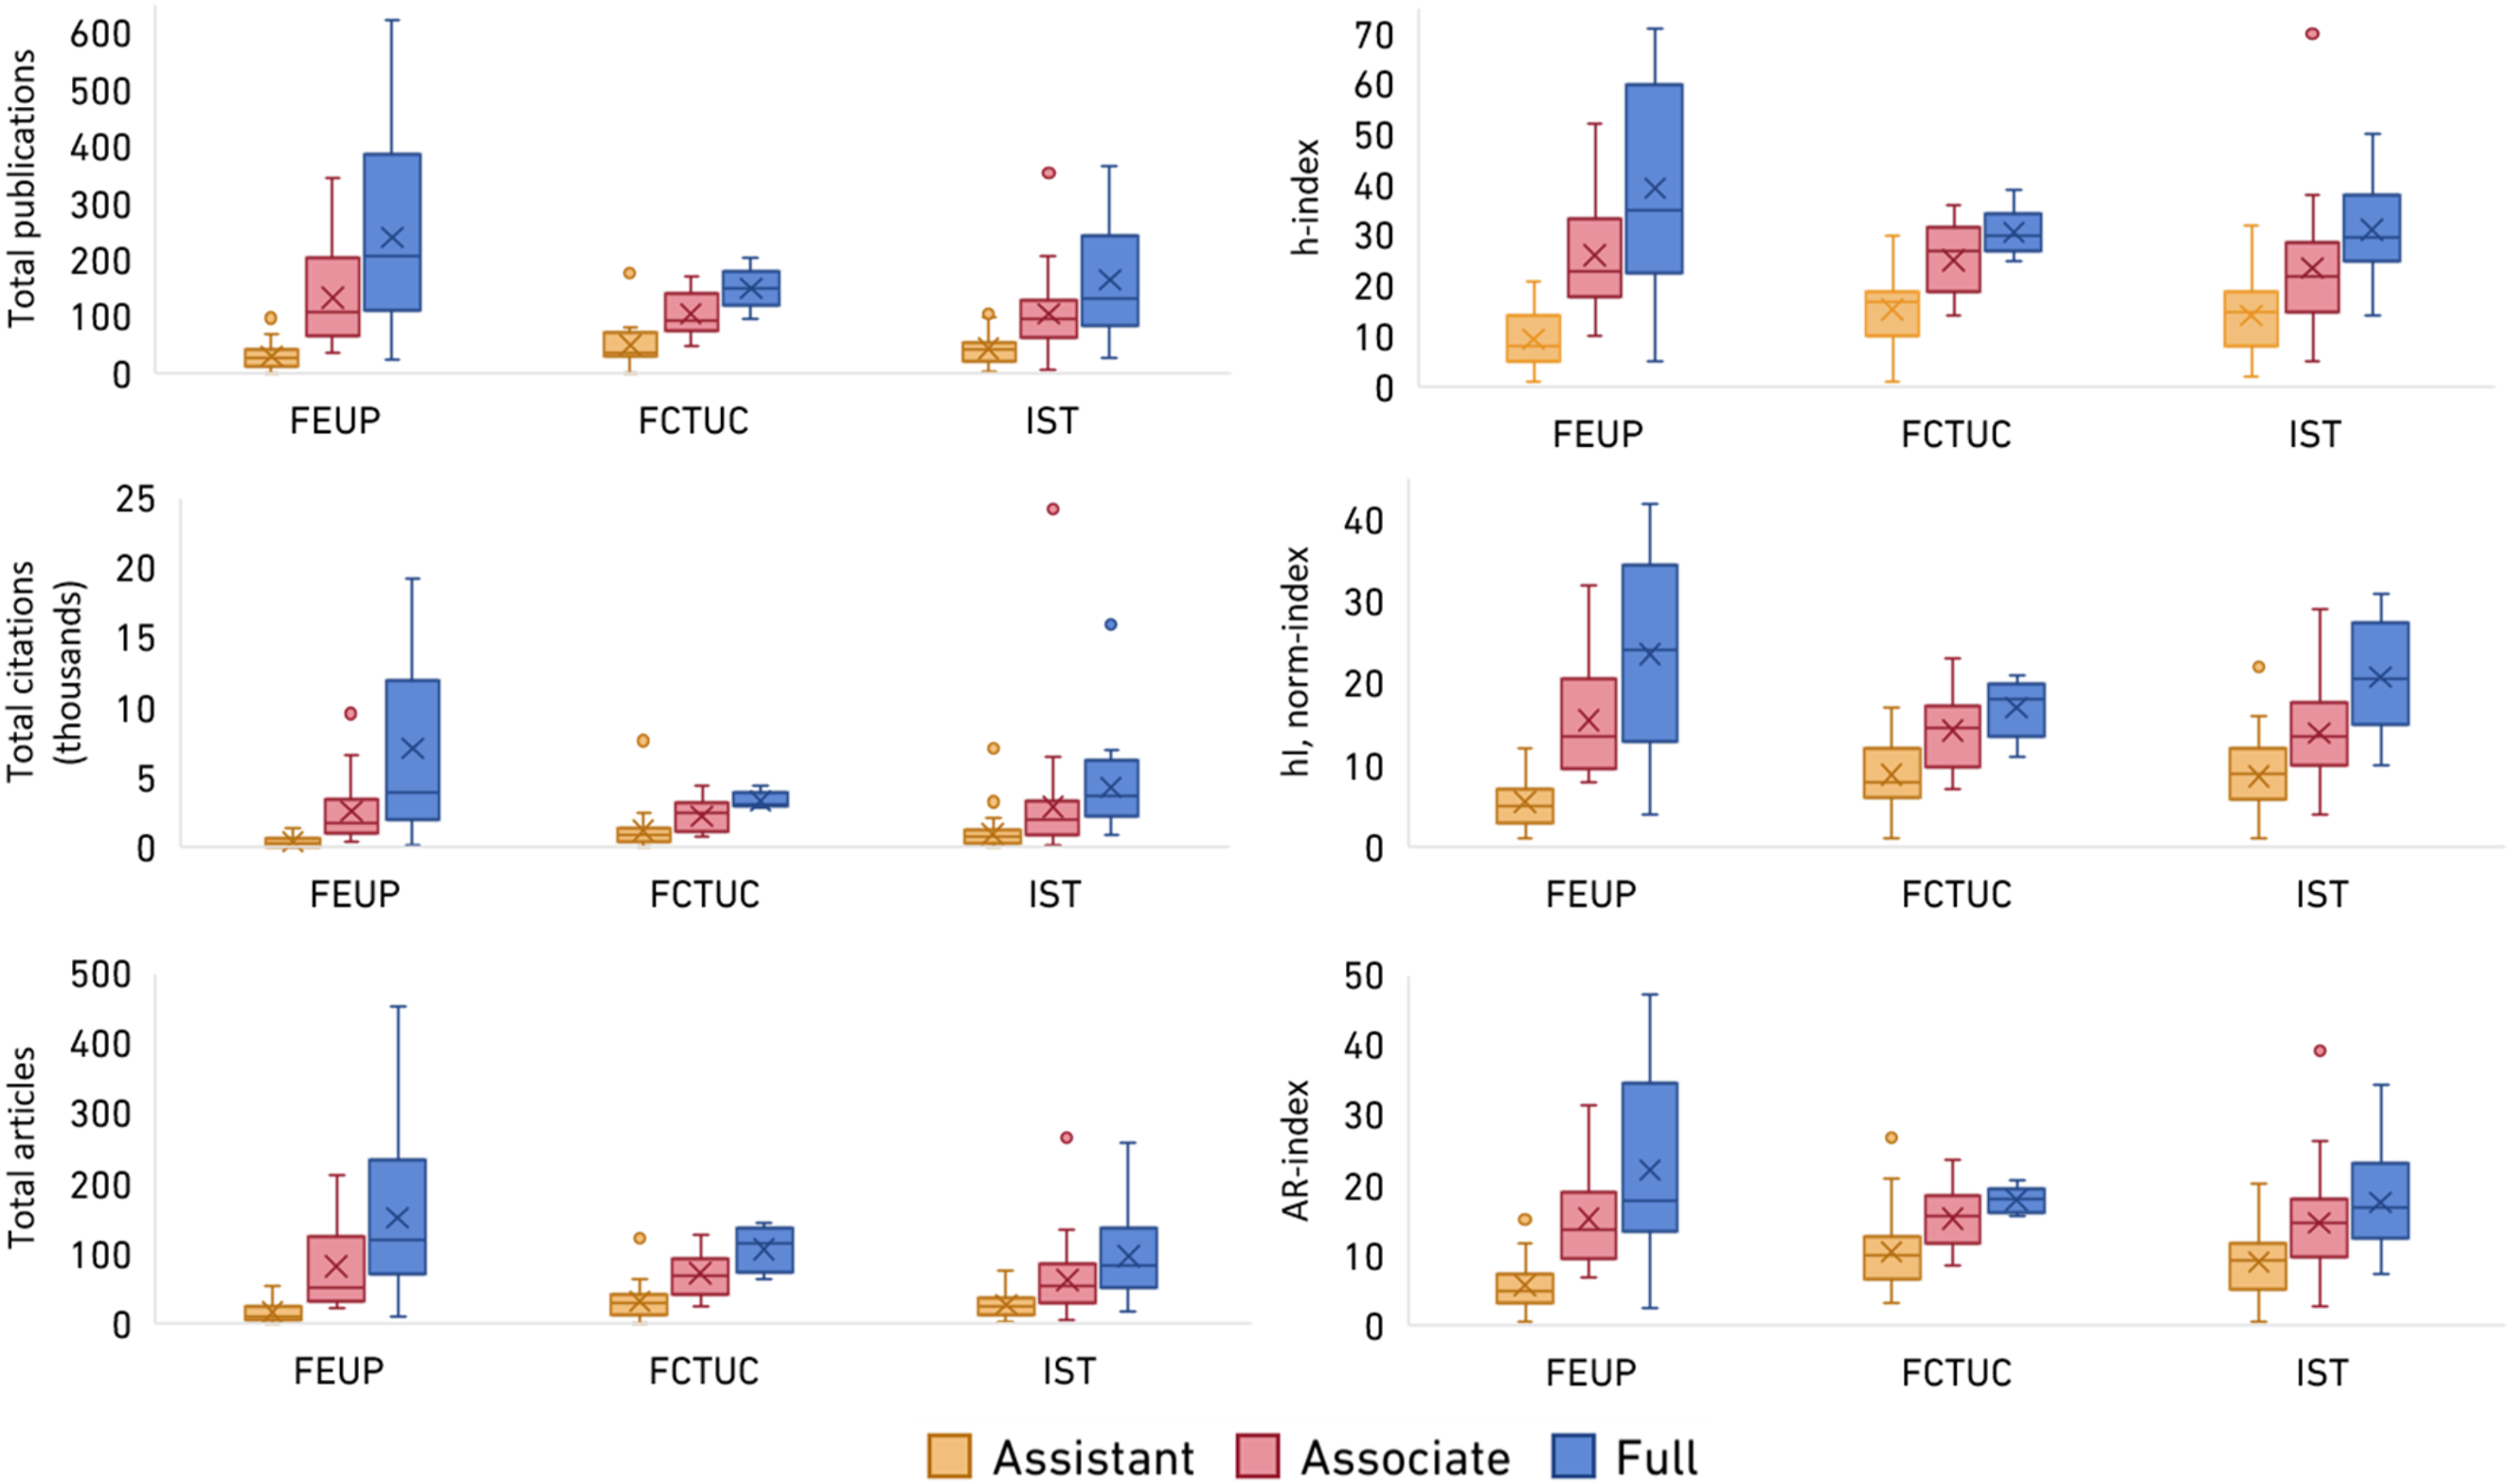
Boxplots charts of the six metrics for FEUP, FCTUC and IST mechanical engineering departments.
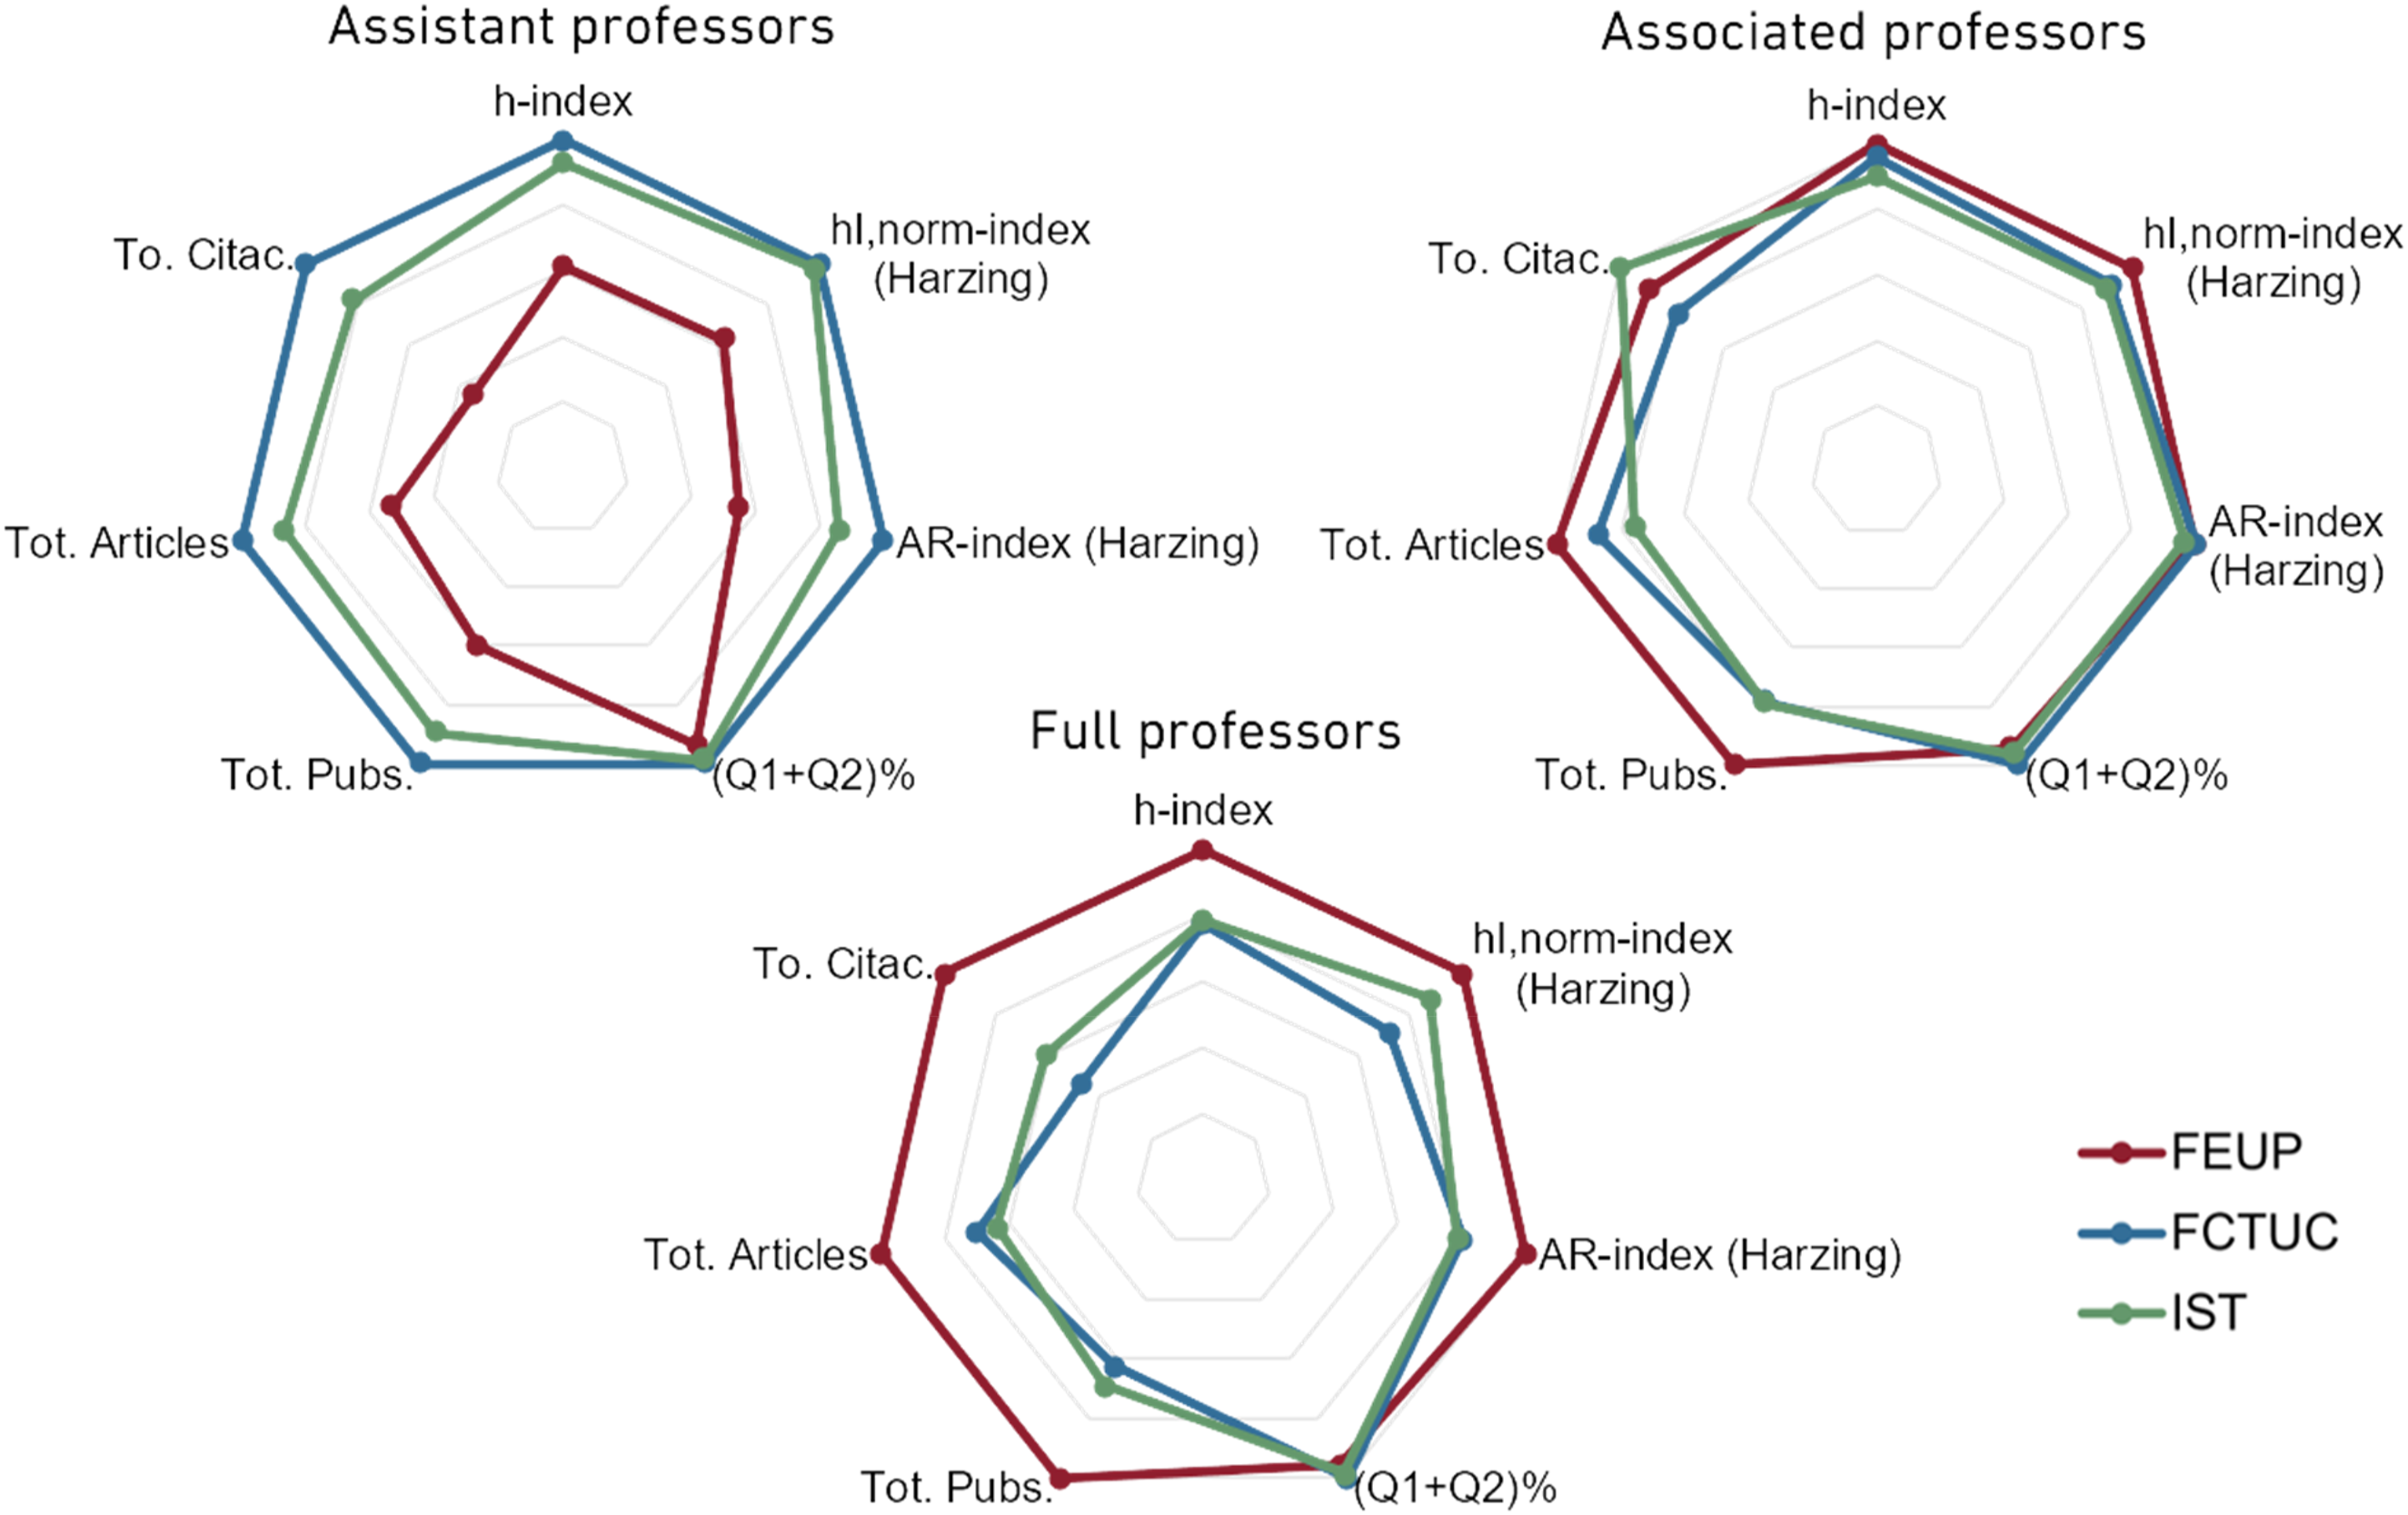
Comparison between average index value of the seven metrics for FEUP, FCTUC and IST mechanical engineering departments.
In general, FCTUC and IST exhibit relatively similar CP values across the corresponding professor categories, whereas FEUP shows lower CP values for assistant professors, comparable values for associate professors and higher CP values for full professors. This results in a clearer distinction in scientific performance between professor categories at FEUP, where the CP differences between categories are more pronounced compared to FCTUC and IST. These results invite further discussion. Assistant professors at FEUP tend to have a lower scientific performance compared to their counterparts at other universities, whereas full professors demonstrate significantly higher CP values than those at FCTUC and IST. Hence, FEUP professors must put in significantly more effort to enhance their scientific performance as they advance in their careers. The gap becomes even more evident at the full professor level, where performance expectations are substantially higher. This implies that climbing the academic hierarchy at FEUP requires a more intense effort in terms of publication indices compared to FCTUC and IST, especially for those aiming for the highest teaching positions. This statement is reasonable given that the proportion of teaching staff is similar in the mechanical engineering departments at FEUP and IST. At FEUP, approximately 46% of the faculty are assistant professors, 33% are associate professors and 21% are full professors. Similarly, at IST, these proportions are 47%, 33% and 20%, respectively. In contrast, the FCTUC mechanical engineering department has a higher proportion of assistant professors, making up 57% of the teaching staff, while associate and full professors account for 30% and 13%, respectively.
Multidimensional scaling analysis
In the following two subsections, the CPs are compared using the Canberra distance to measure dissimilarities between researchers’ profiles. The MDS is then applied for clustering and visualisation.
FEUP departments
To provide an initial visualisation of the results, we apply hierarchical clustering using the dissimilarity matrix Δ as input. The clustering is based on successive agglomeration and the average linkage method, resulting in the dendrogram presented in Figure 7. The dendrogram illustrates the grouping of associate and full professors across FEUP departments based on their scientific performance. Each branch of the dendrogram represents relationships between individuals and the height of each merge indicating the degree of dissimilarity between clusters. Professors of the same academic rank tend to cluster together, reflecting similar CP levels across departments.
Dendrogram obtained by means of HC of FEUP departments.
The height at which clusters merge provides insight into the variation in scientific performance. Clusters that merge at lower heights suggest that professors within them have relatively similar research output, while higher merging points indicate greater differences. Four different coefficients were used to enhance visualisation, corresponding green to the lowest CPs, red to the medium CP values and blue followed by purple to the highest CP. Full professors generally appear to the right of the dendrogram, consistently exhibiting higher CPs than associate professors. The clear separation between the leftmost and rightmost colour groups further emphasises the gap in performance levels between academic ranks. It is trivial to note that full professors are more positioned to the right than associate professors, and that, in all departments, full professors have a higher CP when compared to their counterparts. In some cases, as in DEQ, associate and full professors from the same department are grouped together at a low height, implying minimal performance differences. However, in other cases, associate professors are distinctly separated from their full professor counterparts, suggesting a more pronounced gap in research productivity. It should also be noted that the high is between the two right-coloured groups with the two left groups, showing a clear separation.
As an alternative view of the same data, a 3D MDS plot is shown in Figure 8. This plot visualises the spatial distribution of associate professors (red) and full professors (blue), representing their relative similarities and differences in CP. The degree of separation between associate and full professors varies between departments. In some, such as DEI and DEGI, the two groups are closely positioned, indicating relatively small differences in scientific performance. In others, such as DEQ, DEM, DEMec and DEEC, a clearer spatial distinction is visible, suggesting a wider performance gap.
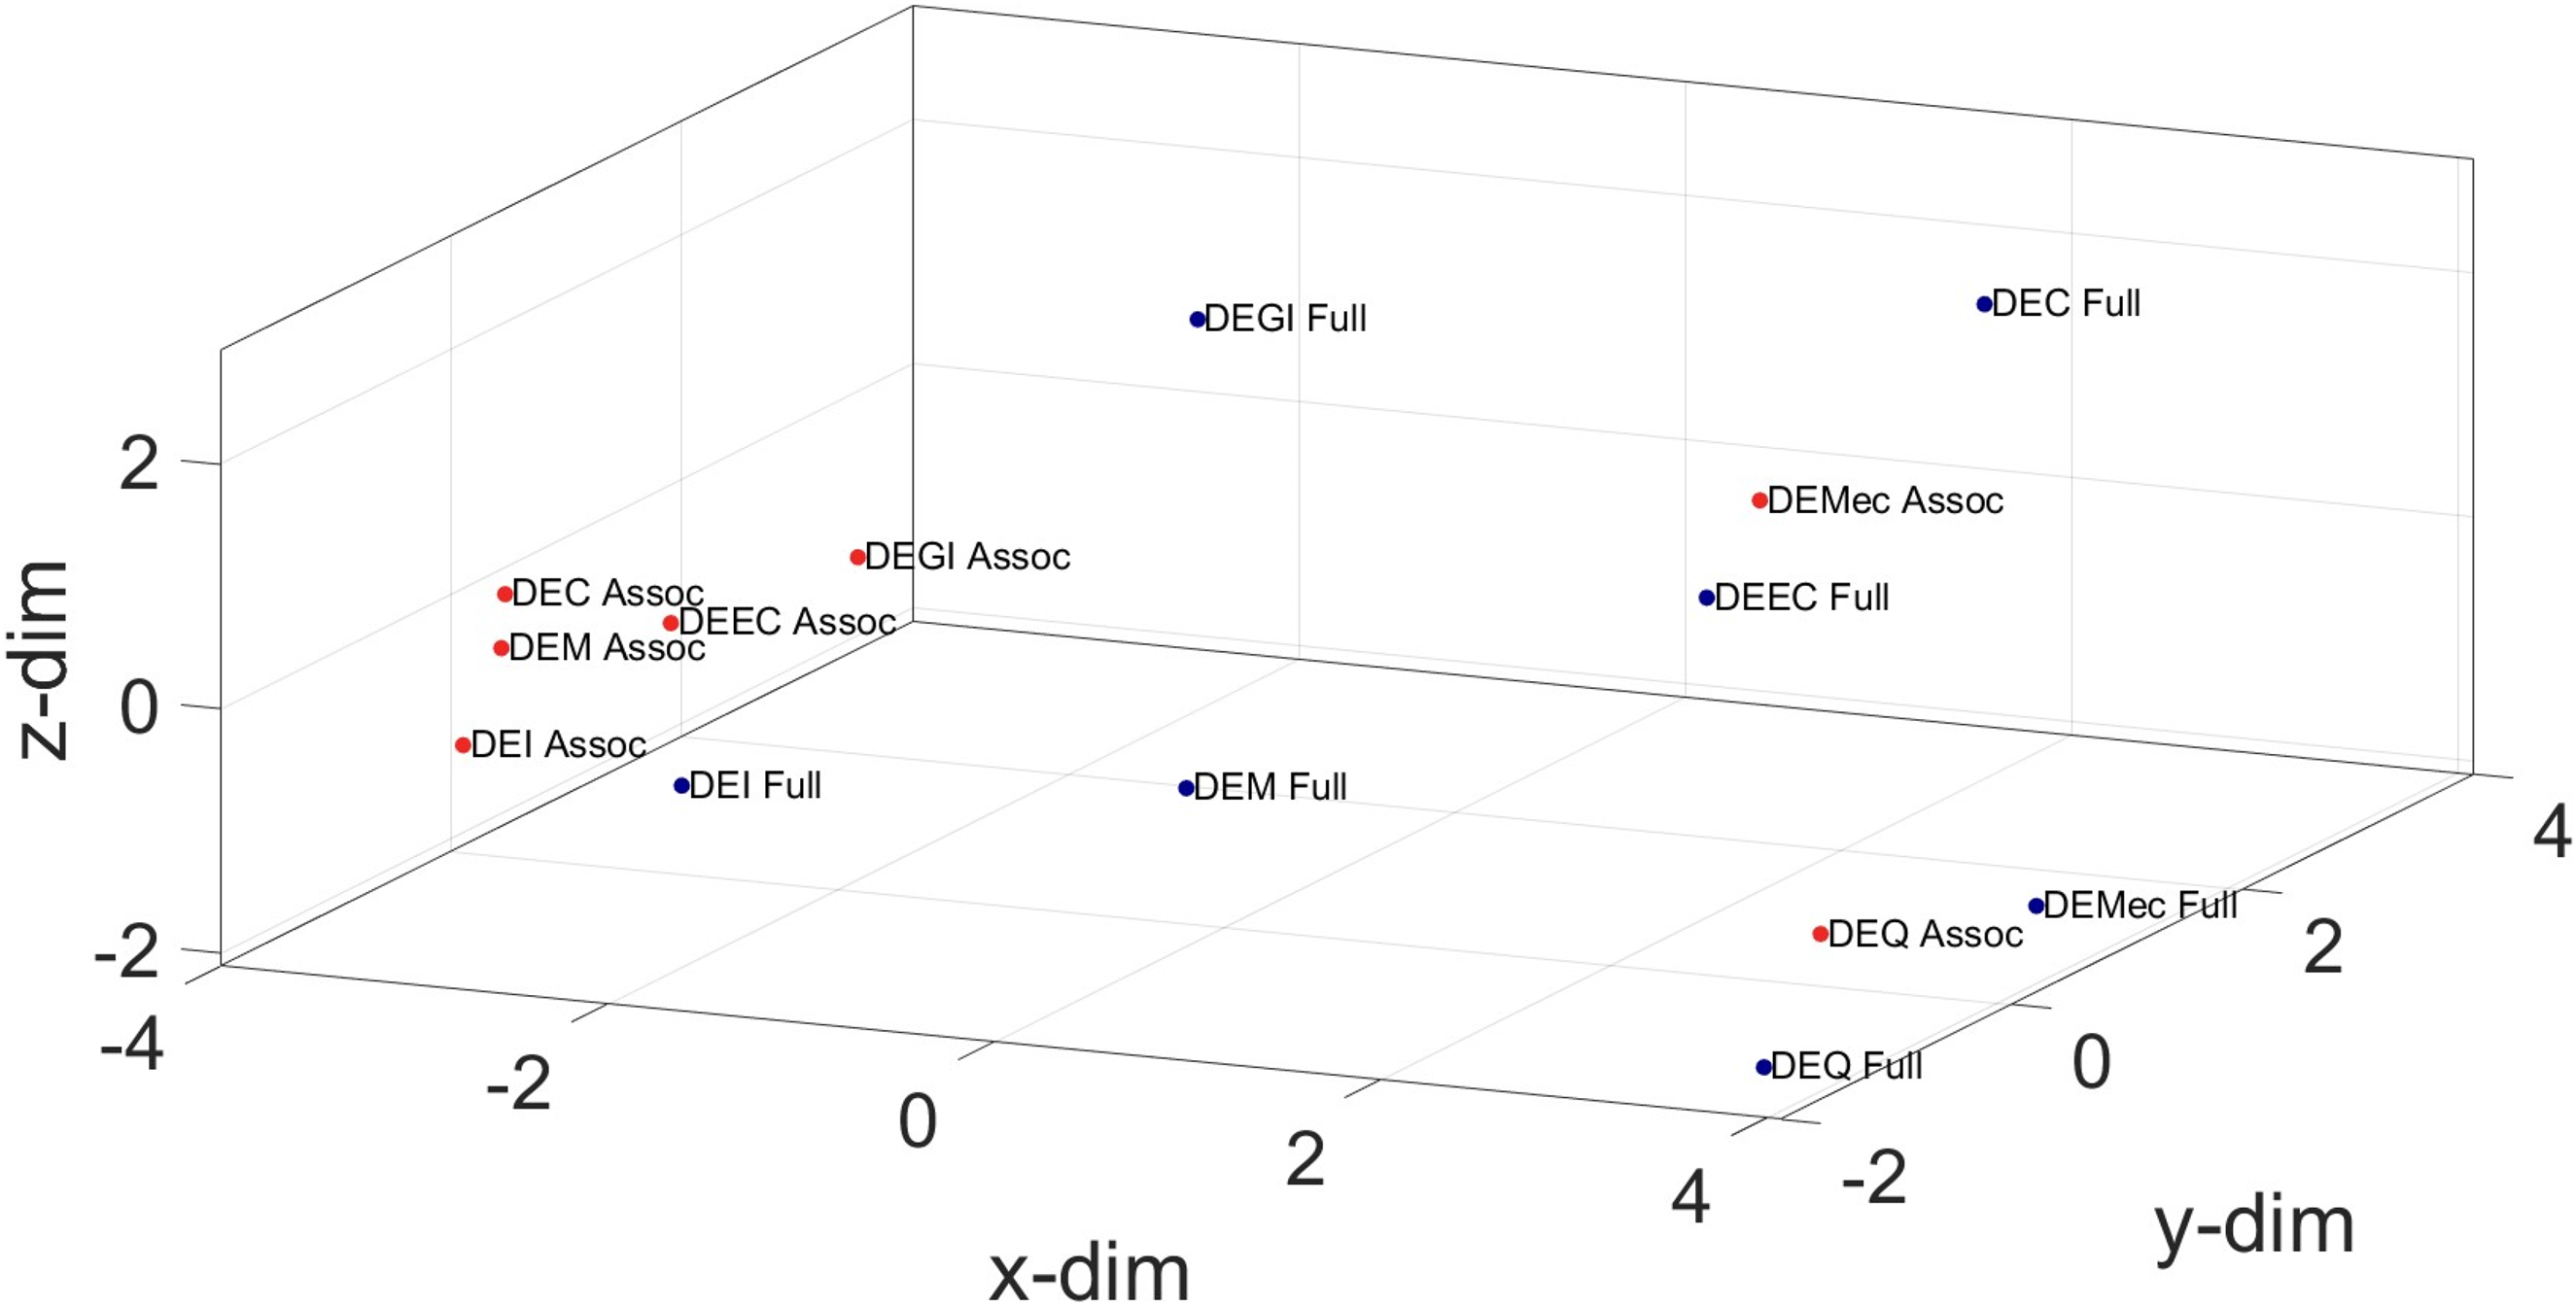
MDS for FEUP departments.
The spread of full professors tends to be wider, reflecting greater variability in research output at this higher academic rank. Some full professors are positioned far from their departmental peers, possibly due to specialised research areas or divergent career paths. In contrast, associate professors often appear more closely clustered, particularly in departments like DEQ, suggesting more uniform performance. Interestingly, in DEQ, both associate and full professors achieve the highest CP values in all departments and appear relatively close in the MDS space, indicating strong and consistent performance potentially linked to the department's research focus.
Mechanical engineering departments
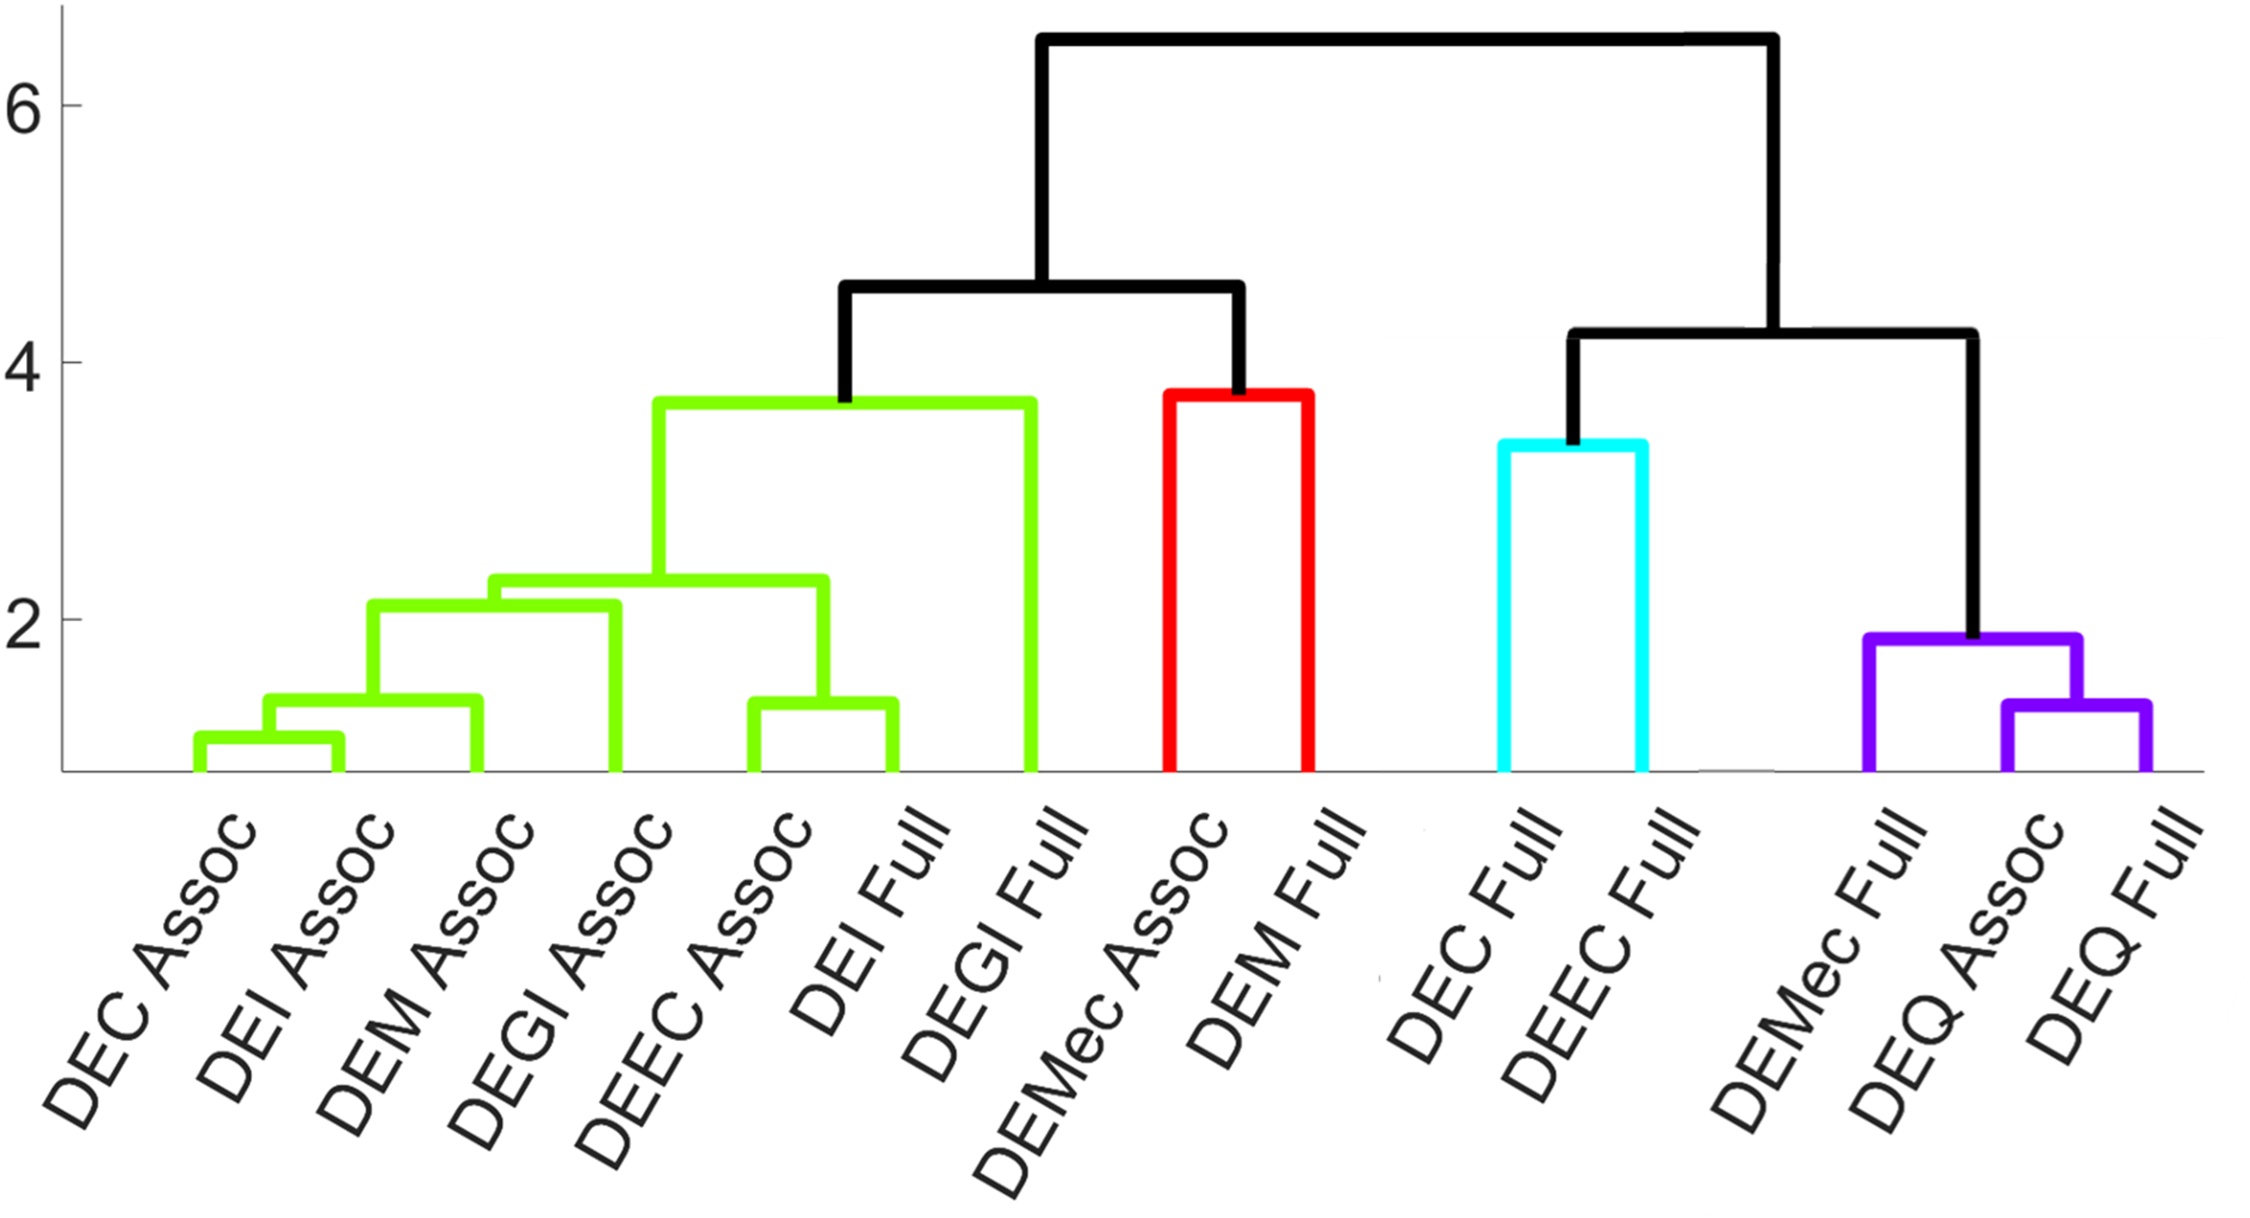
To analyse the average CP values across the three academic ranks in Portugal's largest departments of mechanical engineering (FEUP, FCTUC and IST), we start by evaluating the HC results. Figure 9 presents the dendrogram produced from the dissimilarity matrix using the average linkage method. The leftmost branch of the dendrogram reveals a tight and early merger of the three assistant professors from IST, FCTUC and DEMec at a very low dissimilarity level. This strongly suggests that assistant professors, regardless of institution, exhibit highly comparable scientific performance. This outcome is expected, given their similar academic seniority and limited time for the development of the research portfolio, which tends to reduce variability in performance.
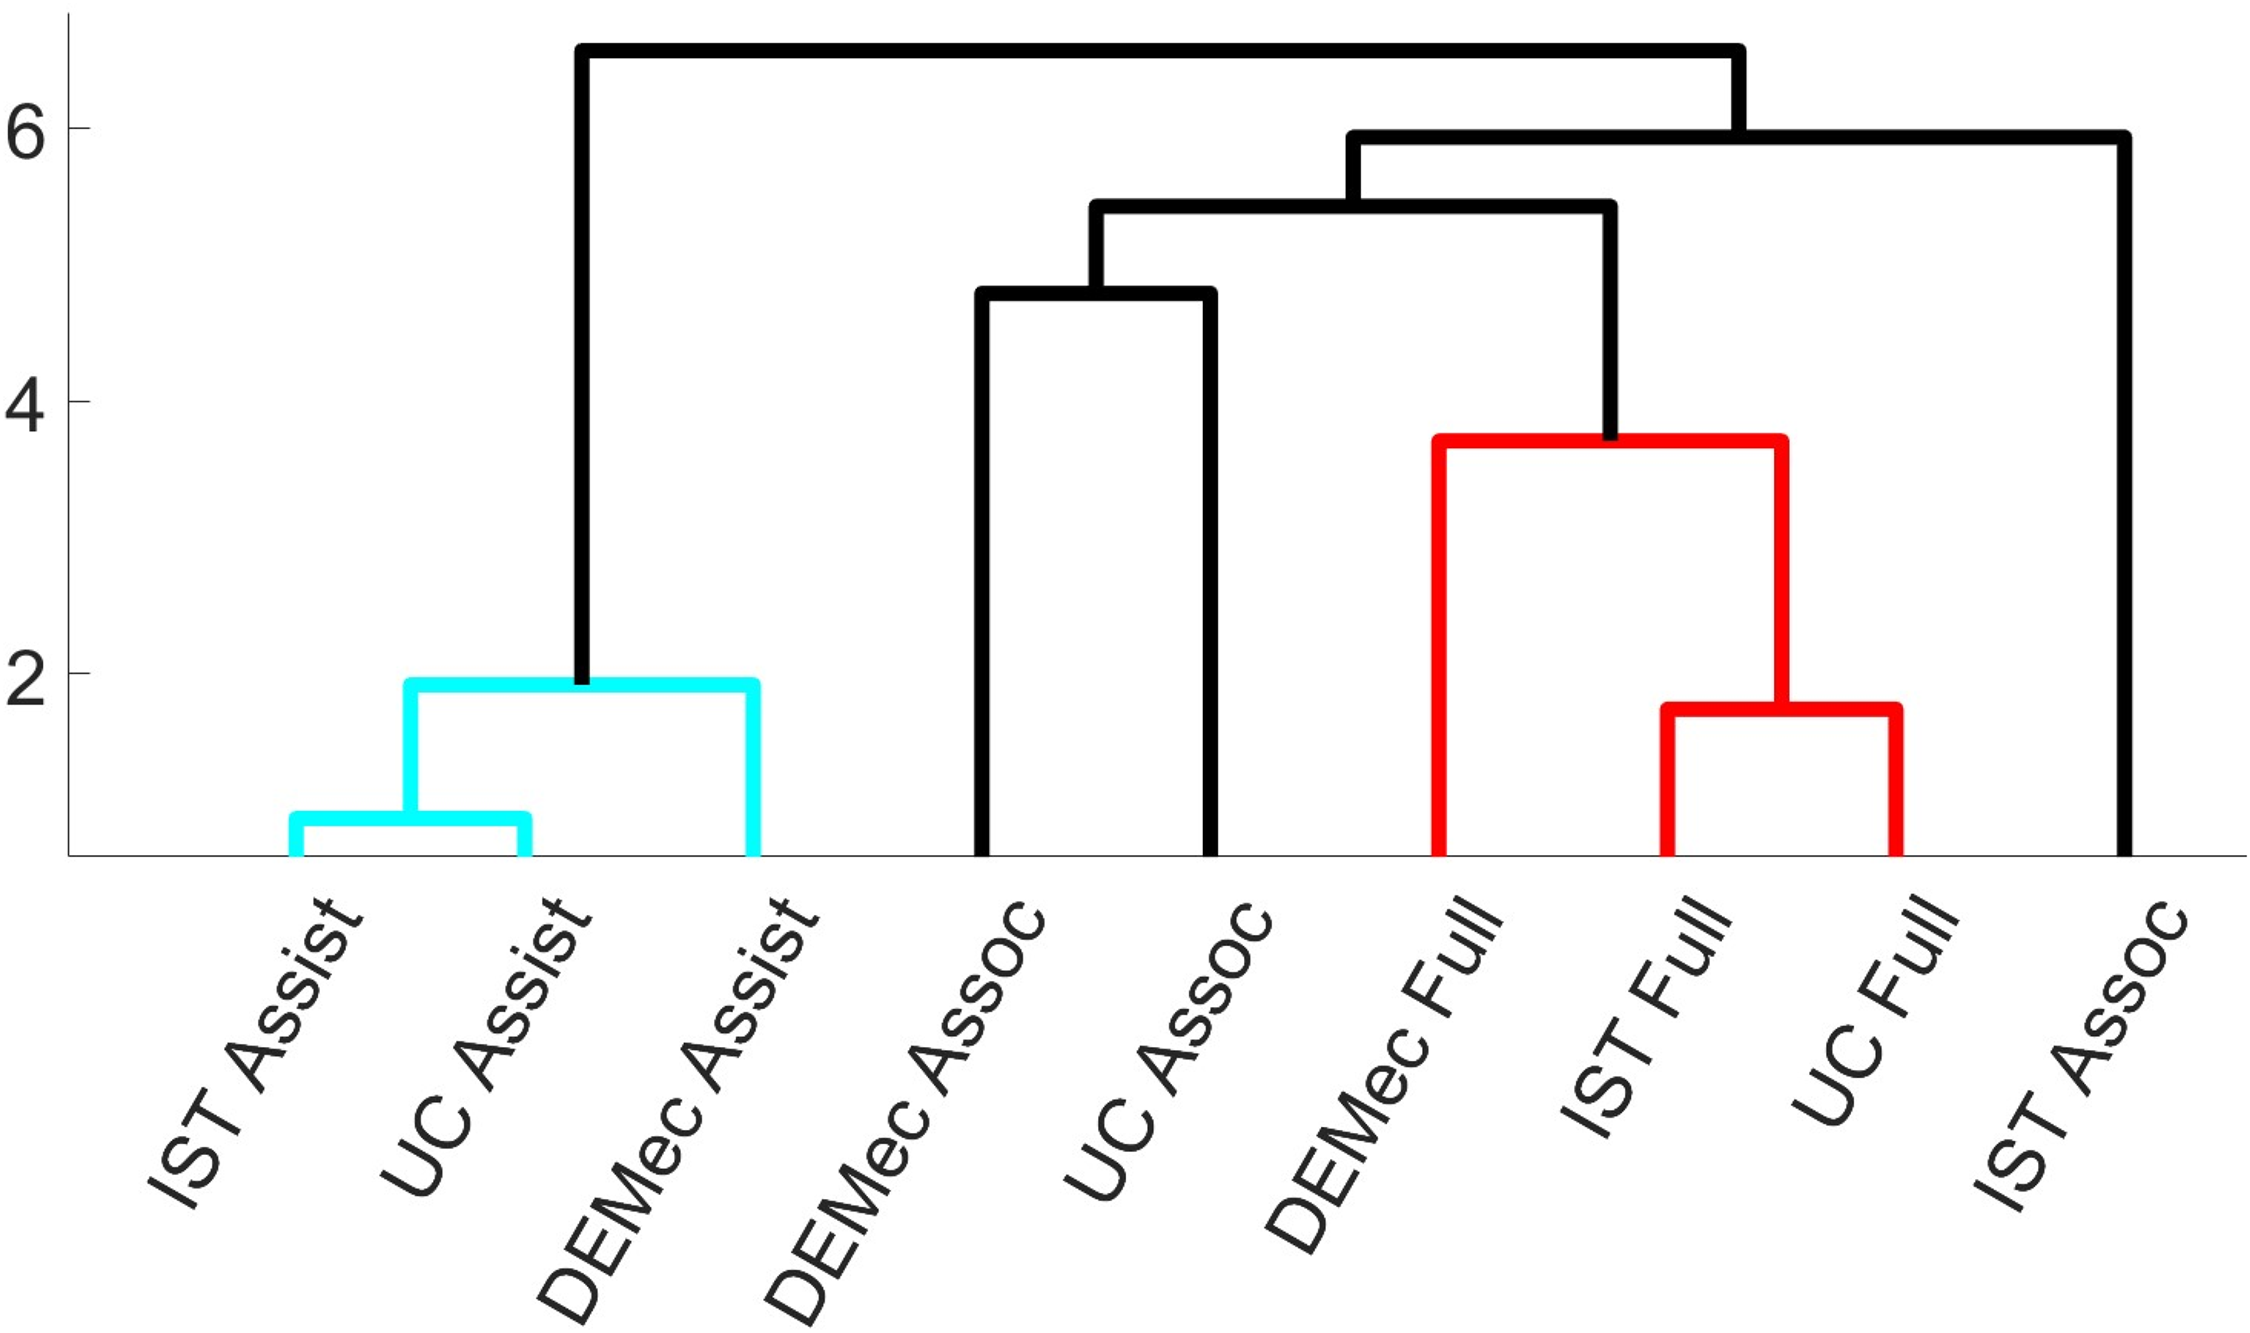
Dendrogram obtained by means of HC of mechanical engineering departments from FEUP, FCTUC and IST.
Associate professors show greater dispersion than assistants. DEMec and FCTUC associate professors form a moderately cohesive cluster, indicating similar research output or evaluation standards at the mid-career stage. In contrast, the associate professor from IST remains separate and only merges at a high level in the hierarchy, signalling a pronounced difference in performance. This divergence could reflect different institutional practices, research focus or individual productivity. The delayed merging may also indicate a transition profile, either approaching full professor productivity or deviating due to an alternative trajectory.
The rightmost red-highlighted cluster includes the full professors from all three departments, showing a compact and distinct grouping. This suggests a convergence in scientific output at the highest academic rank, likely driven by standardised promotion requirements or broader benchmarking practices. Within this group, the full professors of DEMec and IST merge earlier, reflecting a particularly close alignment in high-level performance. The full professor cluster remains clearly separate from the assistant and associate clusters, underscoring the performance leap typically associated with progression to senior academic levels.
As an alternative visualisation, the 3D MDS plot in Figure 10 displays the spatial distribution of assistant (green), associate (red) and full professor (blue), based on their relative similarities in CP. The three assistant professors are tightly grouped in the same region, regardless of institutional affiliation, again highlighting the high similarity in early career research output. This closely mirrors the early cluster observed in the HC dendrogram. The associate professors, though more dispersed in the MDS space, gave the closest index values in the radial graphs (Figure 6), revealing a discrepancy between numerical similarity and spatial representation. This may result from subtle inter-departmental differences that impact their positioning in the MDS plot. Full professors are placed closer together than associates in the MDS plot, further confirming the HC findings that senior-level academics demonstrate converging performance profiles. In particular, FEUP appears to be more distant from IST and FCTUC, which are situated closer together, a pattern also reflected in the radial chart discontinuities in Figure 6.
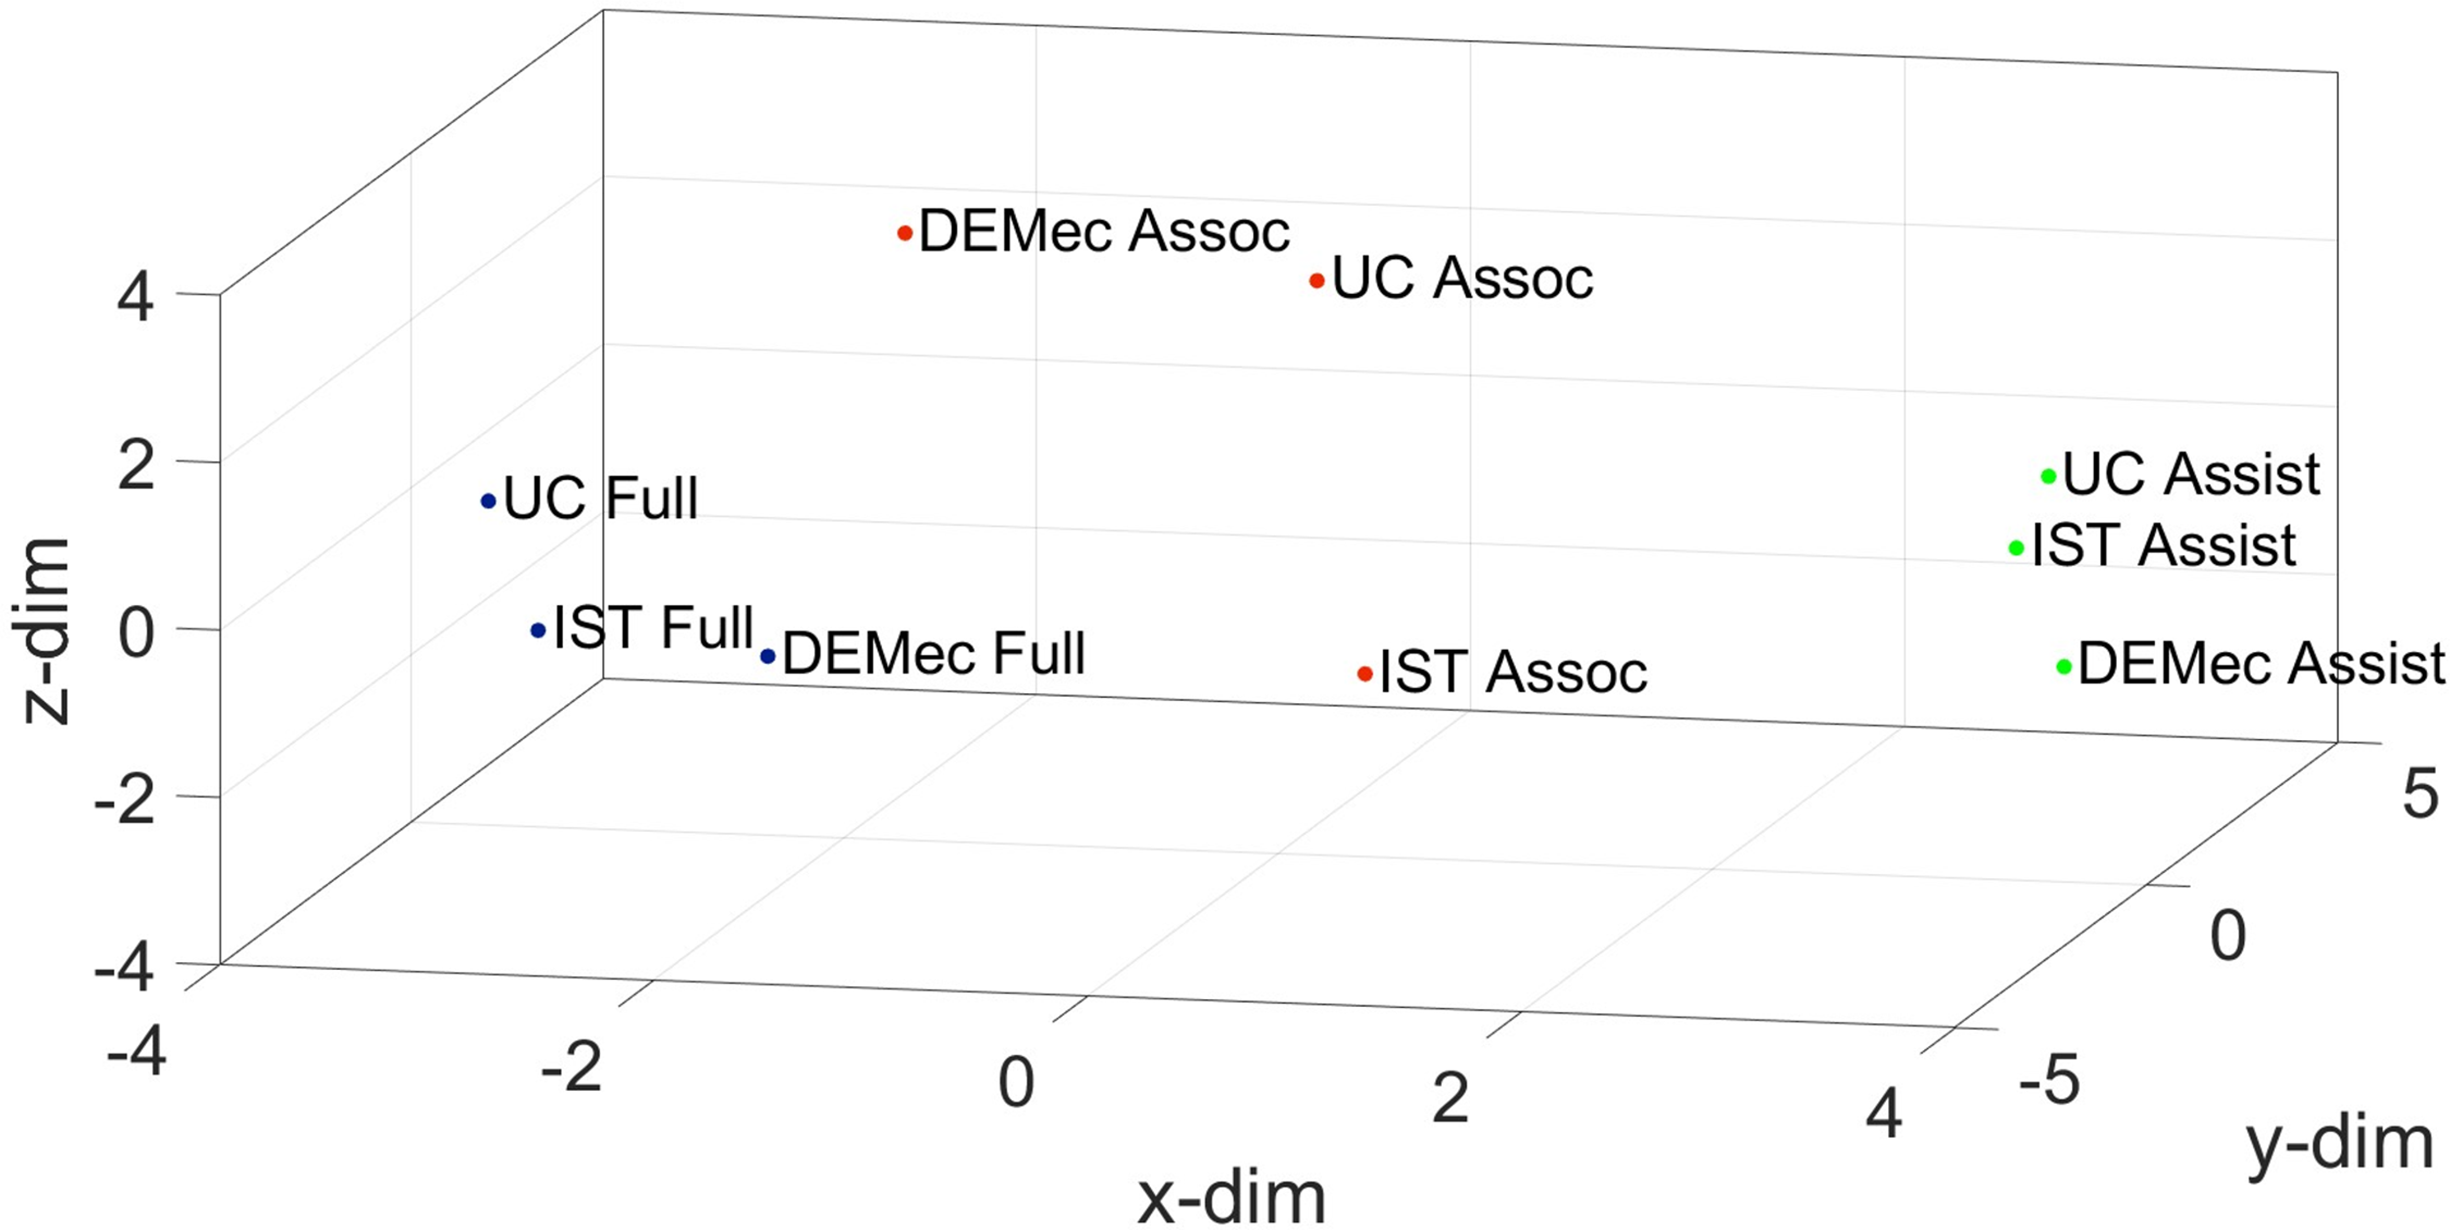
MDS for FEUP, FCTUC and IST mechanical engineering departments.
In summary, both the MDS and HC results indicate that FCTUC and IST share greater similarities in performance across all ranks, while DEMec exhibits more variation, performing relatively lower at the assistant level, comparably at the associate level and leading in the full professor category.
Harnessing promotion fairness
After evaluating all CP indices through MDS, we sought to assess whether the observed scientific performance, quantified through CP, aligns with academic rank, thus providing insight into promotion practices within FEUP and the mechanical engineering departments of other major Portuguese faculties. This analysis allows us to explore potential discrepancies between academic rank and research output.
In terms of analysis in most FEUP departments, full professors consistently demonstrate higher CP scores than associate professors. This pattern is evident in both the MDS plots, where full professors are generally positioned farther from associates, and in the dendrograms, where full professors often form distinct, higher-performing clusters. This suggests that promotions are broadly aligned with scientific productivity, which supports the notion of fairness in the evaluation process. Although the overall trend supports fair promotions, interdepartmental variations highlight nuances. In departments such as DEQ, associate and full professors are not only highly performing but also closely grouped. This could suggest that promotions in such departments occur relatively quickly once minimum thresholds are met, or that a strong departmental research culture drives uniformly high performance across ranks. In contrast, departments such as DEEC, DEM and DEMec show larger gaps between ranks, particularly in CP performance. This may reflect greater heterogeneity in promotion standards or differences in how research performance is weighed in career advancement.
The tight clustering of associate professors in some departments, paired with greater dispersion among full professors, suggests that promotions to the full professor rank may be based on more varied or individualised performance trajectories. These may include factors beyond quantitative performance alone, such as leadership roles, administrative responsibilities, or the pursuit of specialised research niches. Such patterns are consistent with the idea that while early- and mid-career progression is largely performance-driven, senior promotions may place more emphasis on broader contributions to the academic community.
In conducting this study, we did not impose any assumptions regarding the specific engineering focus of each department, nor did we evaluate which engineering fields have the greatest scientific impact or weight in terms of research metrics. Our aim was to assess performance and career position independently of disciplinary differences, focussing solely on the relative CP values within and between academic ranks and institutions. In this part of the study, we focused on a single engineering discipline, mechanical engineering, and compared the CP of professors at different institutions. Since most Portuguese faculties have only one department dedicated to each engineering field, we were able to conduct a more in-depth analysis by narrowing our scope to the mechanical engineering departments of FEUP, FCTUC and IST. This allowed for a more controlled and focused comparison of research performance and category within a single-disciplinary context.
To assess the distribution in each department category, two metrics were selected to facilitate the evaluation of disparities: the h-index and the number of publications in Q1 and Q2 journals. These metrics were chosen because they mostly evaluate productivity, impact and quality. When plotted in two dimensions, they allow for straightforward comparisons between departments and professor categories, providing a clear visual representation of how different categories and departments perform relative to one another. Figure 11 presents three graphs, one for each department of mechanical engineering, showing data for the three teaching categories while highlighting the top 50% researchers in each category.
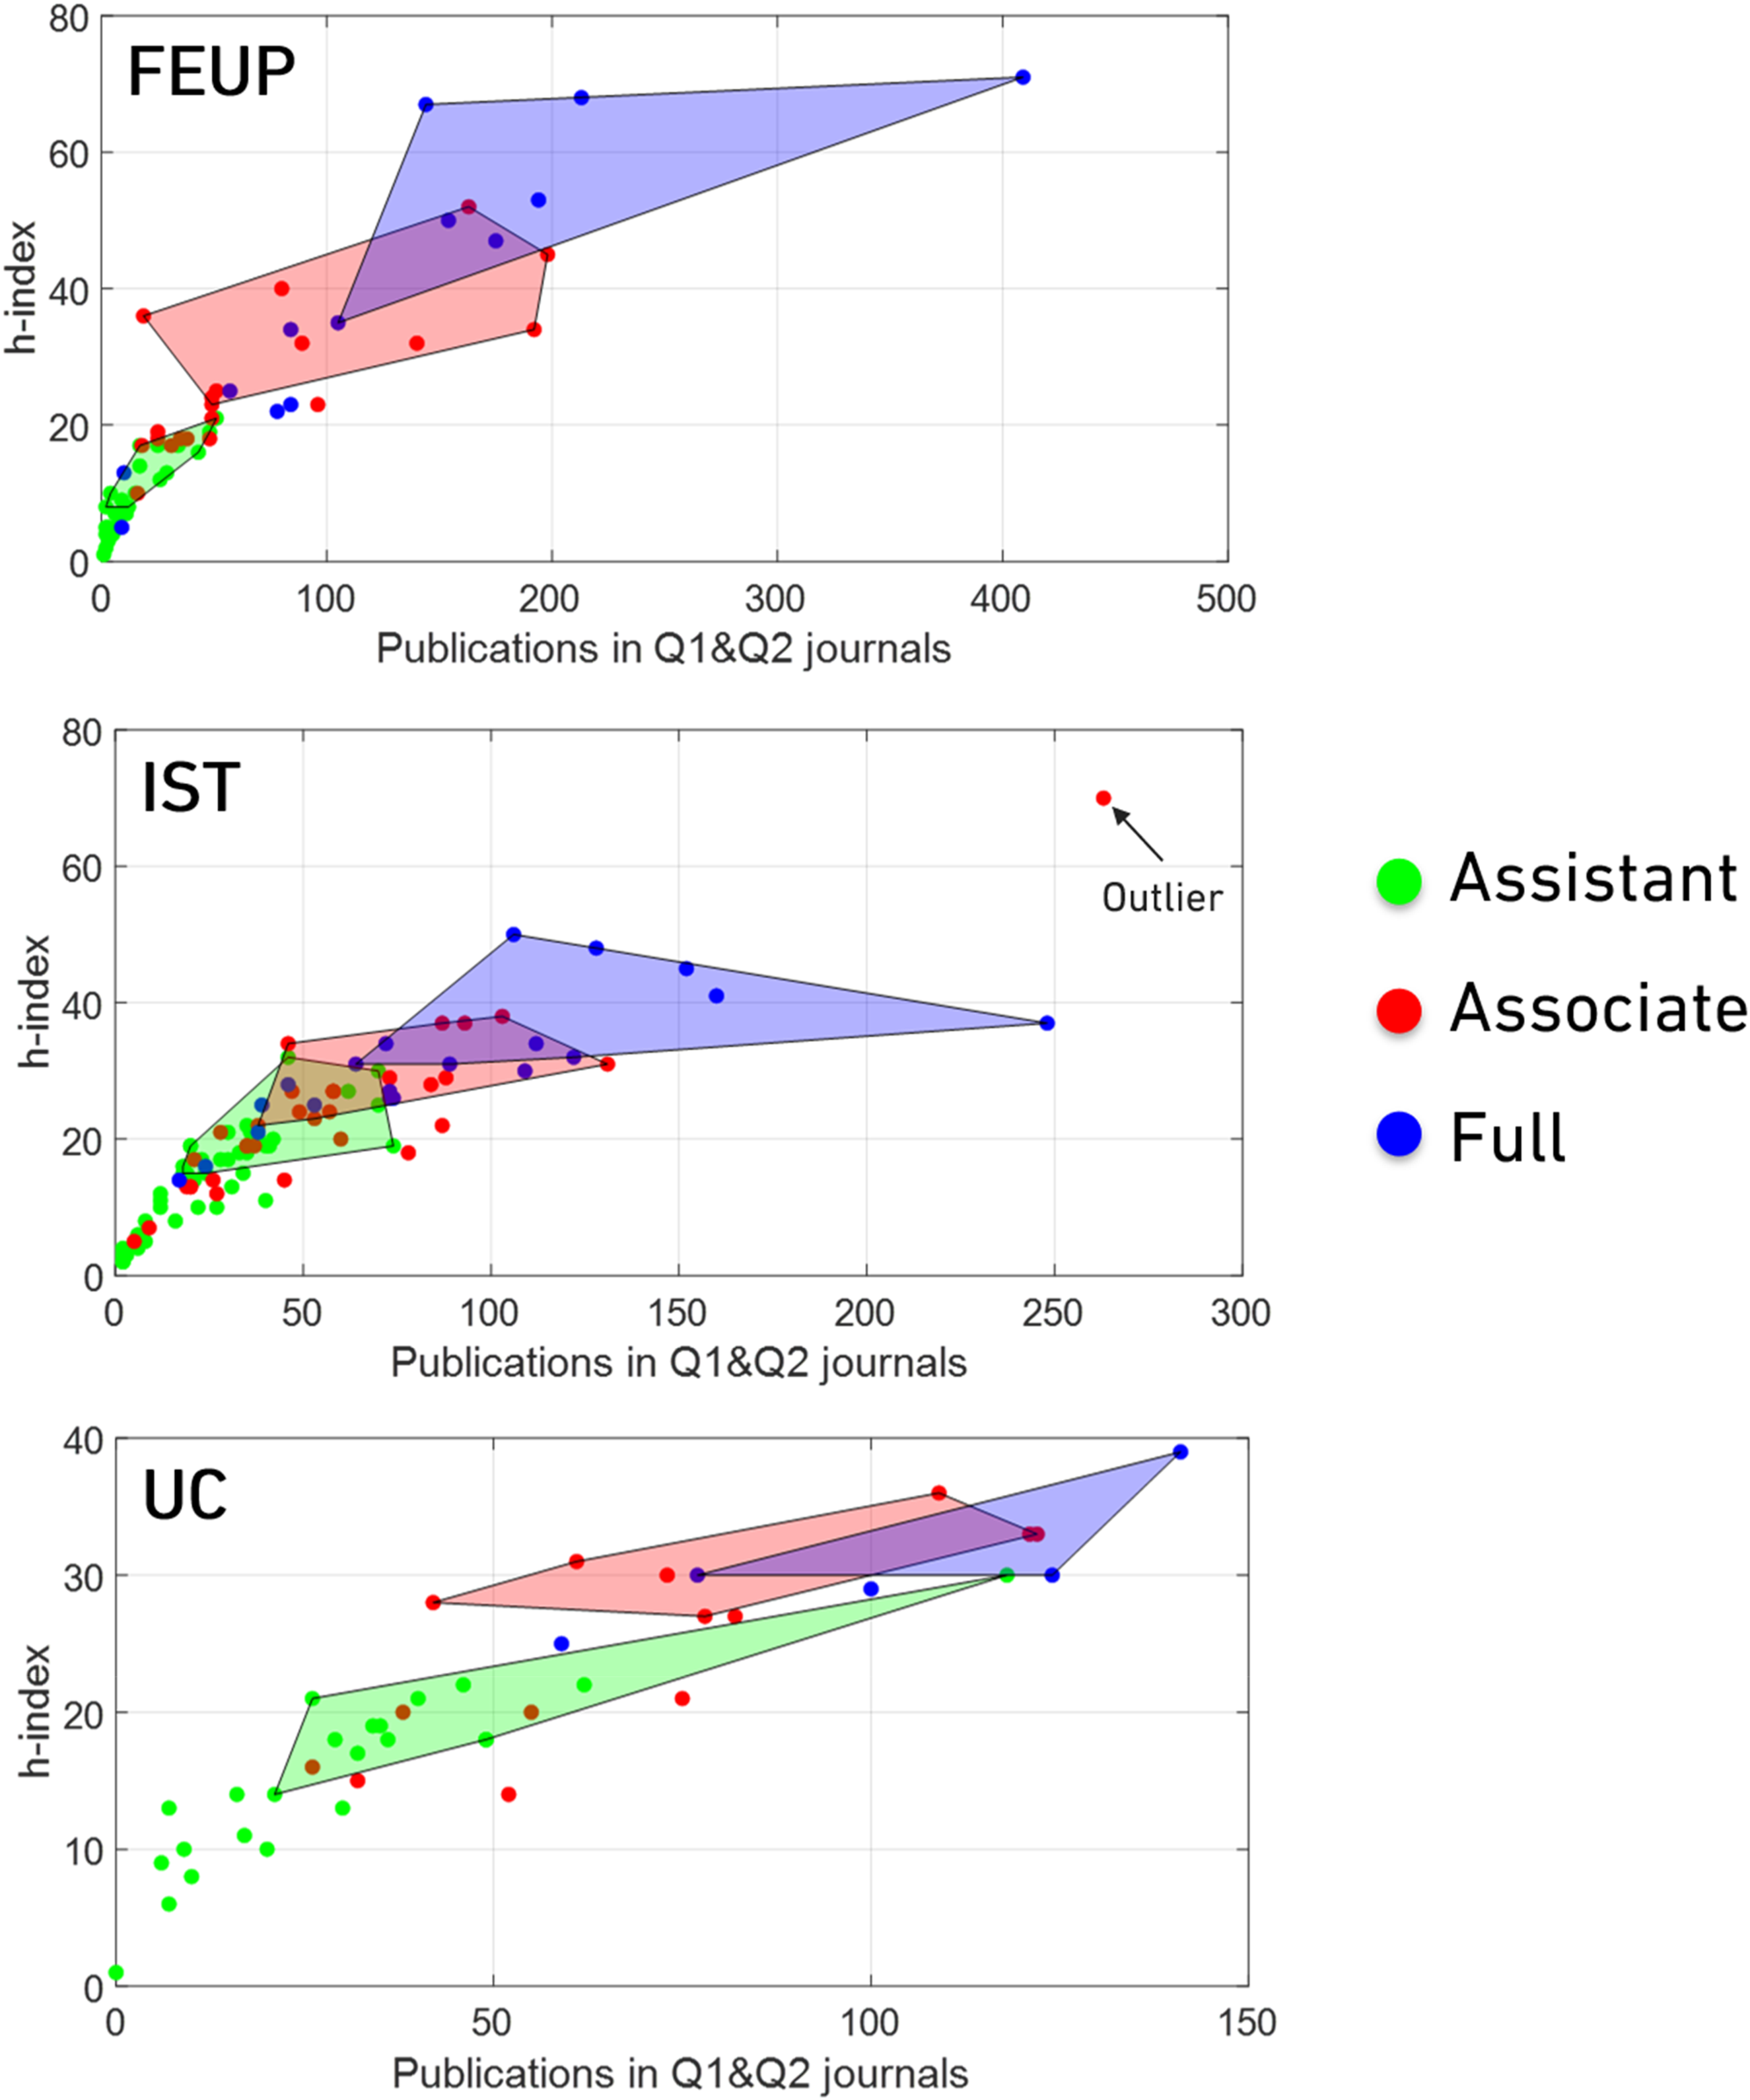
Scientific performance of professors from the mechanical departments of FEUP, FCTUC and IST in terms of h-index and number of articles published in Q1 and Q2 journals (shadowed areas correspond to the best half of each category).
The results indicate that assistant professors at FCTUC and IST outperform their counterparts at FEUP, whereas full professors at FEUP excel beyond those of the other mechanical engineering departments. Furthermore, the FEUP mechanical engineering department exhibits less overlap in the shaded areas, a trend also observed in Figures 5 and 6. It is further noted that the IST department displays an outlier associate professor. To quantify the separation between professor categories and facilitate comparisons between departments, the Euclidean distance between the centroids of the shaded areas, representing the upper half of each professor category, was calculated (Figure 12). As observed, the mechanical engineering department at FEUP exhibits a greater hierarchical gap between professor categories compared to the other two institutions. In contrast, FCTUC shows the smallest distance between associate and full professors, suggesting a more comparable level of scientific output between these two ranks, according to this analysis. At FEUP, the larger distance between assistant and full professors indicates that career progression is strongly associated with long-term productivity and the accumulation of a substantial body of work. This suggests that promotion at FEUP is contingent on significant, sustained contributions rather than incremental improvements. Conversely, the smaller distances observed at FCTUC imply that performance thresholds for promotion are more evenly distributed across academic ranks, potentially fostering a more uniform career trajectory.
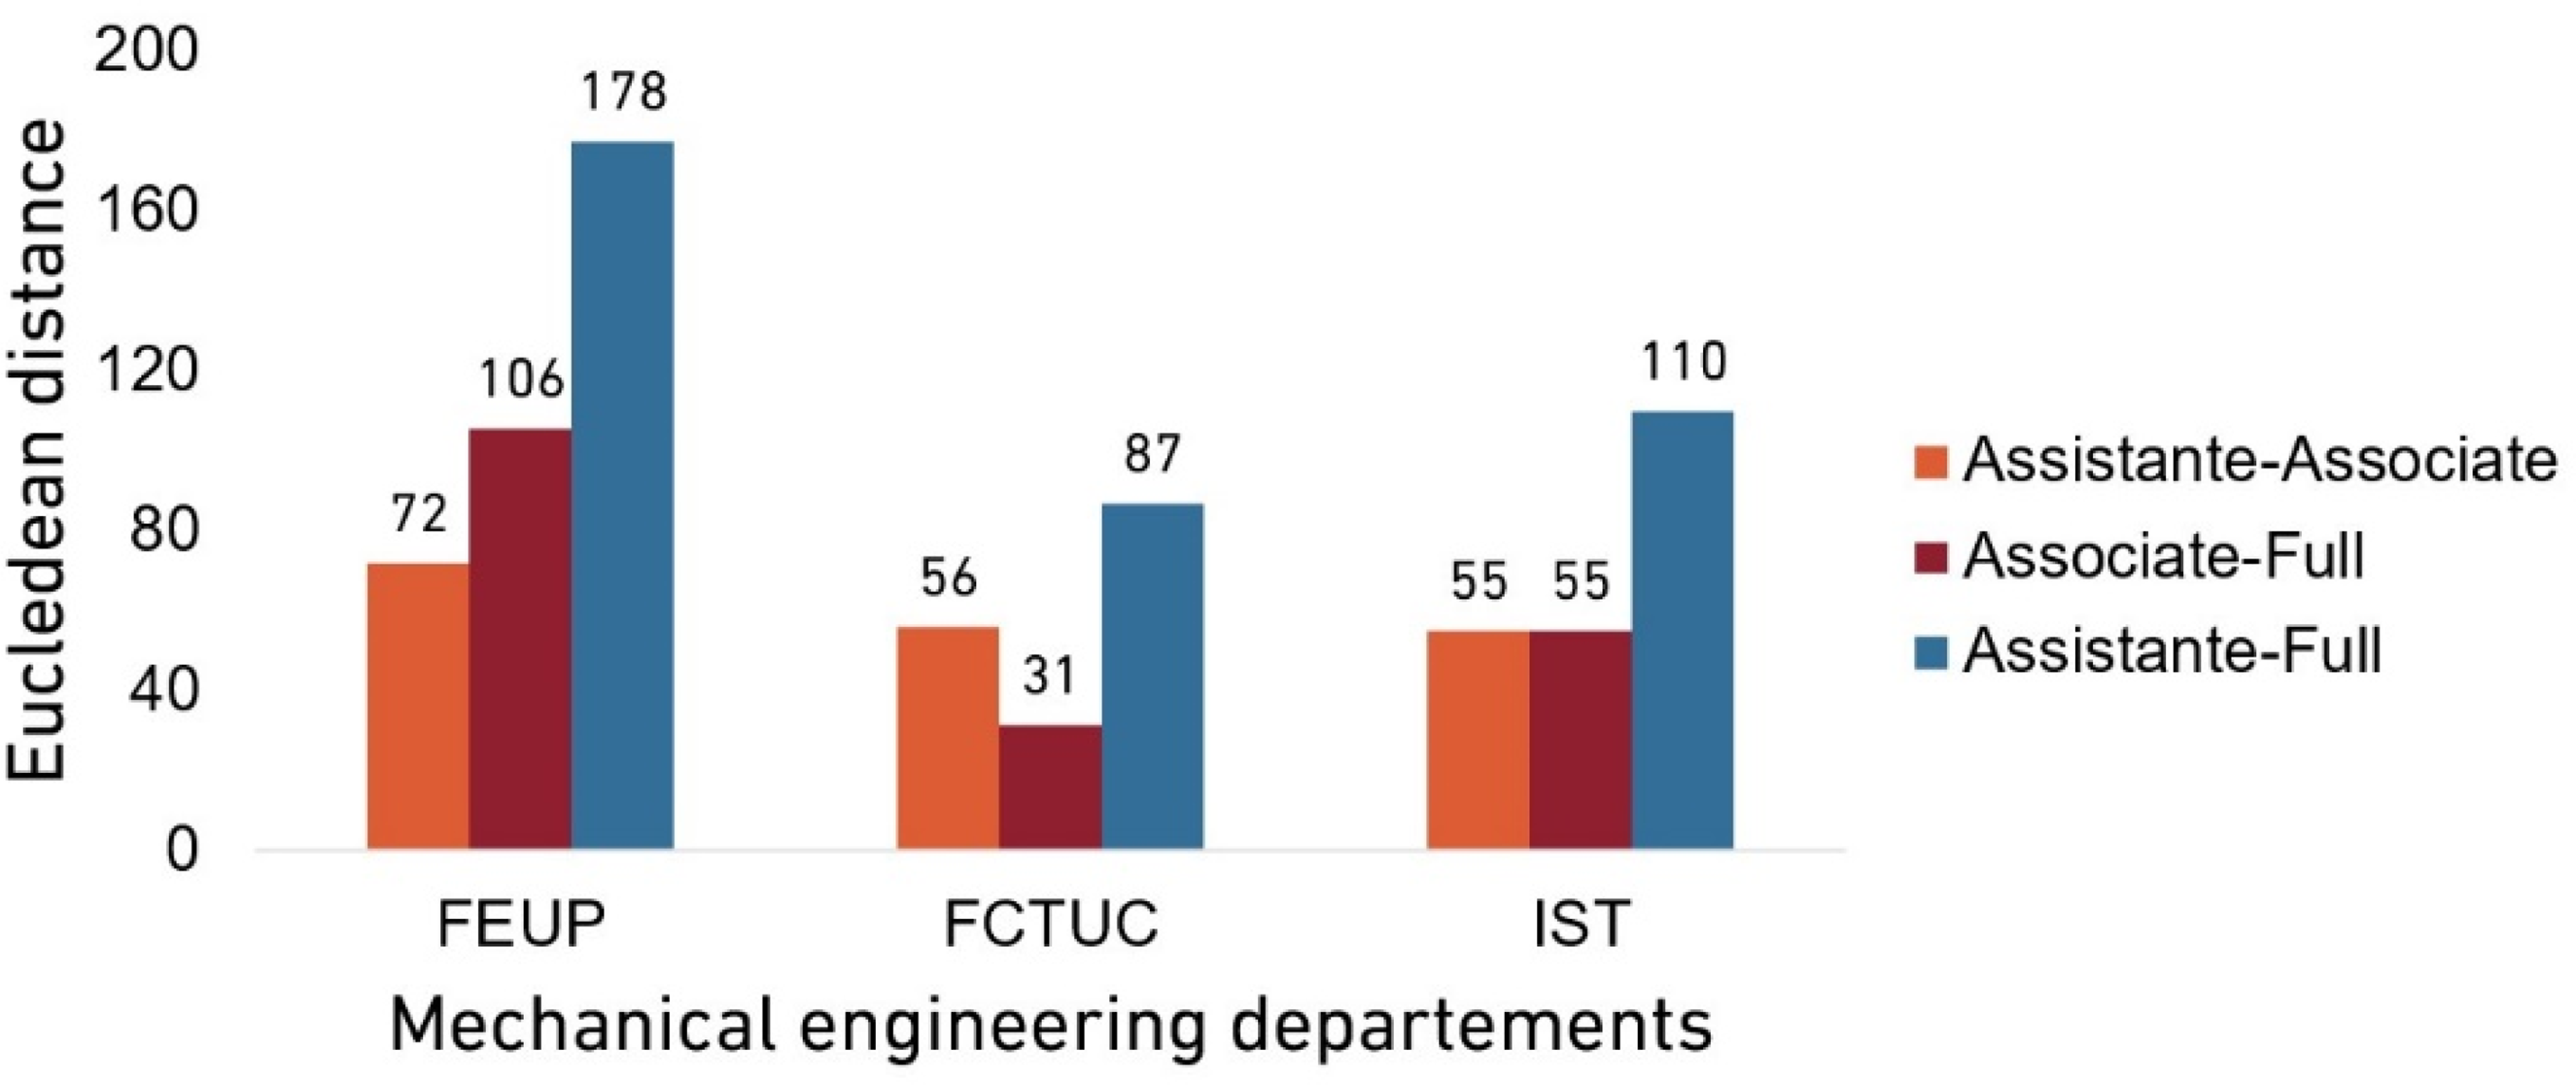
Euclidean distance of the centroid (according to results in Figure 11) of each professor category across FEUP, FCTUC and IST mechanical engineering departments.
While this study provides a structured comparison across departments, several limitations should be acknowledged. First, reliance on the Scopus database may introduce bias, as its coverage is uneven across fields and may underrepresent conference papers, which are particularly relevant in engineering.33–35 Second, the analysis focuses exclusively on bibliometric indicators. Other factors such as teaching performance, administrative responsibilities, societal impact and other aspects which contribute to improve teaching career, which also weigh in promotion decisions, were not considered.3–6 Third, differences in co-authorship practices and collaboration intensity across fields may influence the comparability of indices such as the h-index or hInorm. Finally, although the Canberra distance and MDS approach provided clear clustering and visualization, alternative similarity measures might capture other dimensions of research performance not reflected here.
Conclusions
This study presents a comprehensive bibliometric analysis of the scientific performance of engineering faculty members across departments at FEUP and among the top three departments of mechanical engineering in Portugal, FEUP, FCTUC and IST. Leveraging data from Elsevier's Scopus database, the analysis applied seven bibliometric indices that collectively reflect research productivity, impact and quality. Through box plots, radial charts, polygonal area comparisons and advanced dimensionality reduction techniques, such as MDS and HC, a multifaceted comparison of faculty CPs was achieved.
The results largely corroborate expected patterns: full professors generally exhibit higher scientific performance than associate or assistant professors, with increasing CP values along academic ranks. Nonetheless, significant interdepartmental and inter-institutional nuances were revealed. Within FEUP, the DEQ consistently ranked high in all metrics, particularly among associate professors, suggesting a dynamic and productive research culture. Box plots and MDS analyses further revealed a wider performance dispersion among full professors, reflecting diverse research trajectories and greater variability in senior ranks.
Upon focussing on the mechanical engineering departments across FEUP, FCTUC and IST, the analysis uncovered notable institutional contrasts. FEUP assistant professors lag behind their peers at FCTUC and IST, while FEUP full professors outperform counterparts from other institutions. This sharp intra-institutional contrast suggests a steeper progression in performance expectations and potentially a more demanding career trajectory within FEUP as measured by the adopted bibliometric indices. Such patterns were validated through centroid comparisons and clustering methods, which consistently placed FEUP as more internally stratified compared to the relatively homogeneous profiles of FCTUC and IST. The dendrograms provided further clarity on the alignment of scientific output between faculty and institutions: they revealed not only clear clustering by academic rank but also strong similarities among full professors across institutions, which is indicative of converging standards at the highest academic levels.
The study has limitations, including reliance on Scopus (potentially excluding some outputs), sole use of bibliometric indicators (excluding teaching, mentoring or societal impact) and sensitivity of MDS and HC methods. Cross-sectional analysis also captures only a snapshot, which may mask career dynamics.
Future research may expand upon this foundation by exploring the temporal dynamics of CP evolution, incorporating field-normalised metrics for cross-disciplinary comparison and integrating qualitative factors such as institutional funding policies, collaboration networks and mentoring structures. These dimensions could offer a more holistic understanding of academic trajectories and help inform more equitable and effective faculty development policies.
Footnotes
Funding
The authors received no financial support for the research, authorship, and/or publication of this article.
Declaration of conflicting interests
The authors declared no potential conflicts of interest with respect to the research, authorship, and/or publication of this article.
Data Availability Statement
Data sharing not applicable to this article as no datasets were generated or analyzed during the current study.