
Abstract
Background
The sella turcica (ST) is important in forensic identification and in the assessment of craniofacial morphology and pathologies within the sella region.
Aims
The study sought to elucidate the normal dimensions and variant shapes of the ST in a selected Nigerian population.
Methods
This descriptive cross-sectional retrospective study investigated the dimensions and shapes of the ST on cranial computed tomography scans of 336 patients. Inferential statistics were performed for age and sex comparisons and considered significant at <.05.
Results
The round (199, 59.2%) and normal sella turcica shapes (209, 62.2%) and the concave-shaped floor (239, 71.1%) were predominant. The depth, length, sella height median and the configuration of the ST floor were sexually dimorphic (P < .05). The dimensions had a positive correlation with each other (P < .05).
Conclusion
The study provides normal measurements of the ST and the prevalence of its variant shapes, which are important to orthodontists, radiologists and neurosurgeons in aiding the diagnosis and follow-up of pituitary and dentofacial pathologies.
Introduction
The concavity within the body of the sphenoid bone, which encases the pituitary gland, is referred to as the sella turcica (ST).1, 2 This saddle-shaped hypophyseal fossa is bordered anteriorly by the tuberculum sella, inferiorly by the sphenoid sinus and posteriorly by the dorsum sella.3–5 Adjacent to it are two anterior clinoid processes derived from the lesser wing of the sphenoid and two posterior clinoid processes, which exist as terminations of the dorsum sella.6–8 The hypophyseal fossa accommodates 80% of the pituitary gland, and their relationship is variable, meaning alterations in the gland can impact the ST and vice versa.1, 7
The ST and its centre, the sella point, act as a standard landmark for assessing the spatial position of the jaws in relation to the base of the cranium. Additionally, it is essential in the morphological evaluation of the craniofacial region and neurocranium.1, 2, 8 The cephalometric location of the sella point is used to assess growth changes and assess the outcomes of orthodontic treatment. 9 Given its susceptibility to intrasella and extrasella pathologies, a comprehensive knowledge of the ST’s anatomy is fundamental for radiologists, endocrinologists and dentists.1, 2 The analysis of hypophyseal fossa’s morphometry is also valuable for neurosurgeons, aiding in the selection of suitable surgical procedures and minimizing the risk of damage to neighbouring anatomical components, for example, the cranial nerves and internal carotid artery.4, 5, 10
The hypophyseal fossa’s shape and size exhibit variations influenced by age, sex and population, making them useful parameters for age estimation and sex determination in scenarios involving unidentified human remains, for instance, natural disasters, criminal investigations and accidents.3, 6, 10–12
Although plain radiograph has limitations in accurately evaluating the ST due to superimposition of structures, geometric unsharpness and inherent magnification, computed tomography (CT) emerges as a more precise tool. CT not only enhances the assessment of the sella region but also aids in planning of neurosurgical procedures related to the hypophysis, evaluating conditions prior to orthodontic treatment, examining craniofacial defects and establishing a baseline data on ST morphometry.1, 6, 7 This study sheds light on morphological variations and analyzes the morphometrics of the ST using a sample of brain CT scans in Nigeria.
Materials and Methods
This cross-sectional study was conducted at a radiological unit in Delta State, Nigeria, after obtaining ethical approval from the hospital (EREC/PAN/2020/030/0371). Digital brain CT images taken with a CT scanner (64 slice, Toshiba Aquilion, Japan) operating at 120 kV and 300 mA, from 1 June 2015 to 1 July 2020, were accessed through the picture archiving communication system (PACS). The study used the convenience sampling technique to select high-quality images of patients aged 20 years and above, taken within a 5-year duration. The exclusion criteria encompassed images depicting skull base fractures, sinus pathologies, congenital anomalies, evidence of surgery and poor-quality images with inadequate field of view, artefacts or patient rotation. Prospective sample size calculation was not performed. Instead, all brain CT images that met the study’s selection criteria were selected; hence, 336 patients were evaluated. This sample size is larger than those reported in similar studies in the literature6–8 and is therefore considered adequate for this type of radiological investigation.
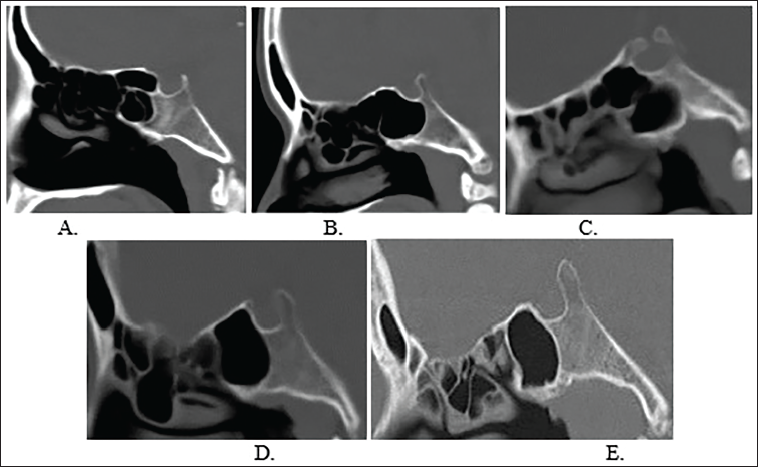
The axial images were reconfigured to produce sagittal reconstructed images that were subsequently employed in evaluating the ST. The ST shapes were grouped in accordance with the traditional classification (oval, flat and circular). Additionally, the modern classification proposed by Axelsson et al. 9 was utilized, grouping the hypophyseal fossa into six morphological categories: normal, oblique anterior wall, ST bridging, double contour floor, irregular dorsum sella and pyramidal shape (Figure 1). The configuration of the hypophyseal fossa floor was characterized as either concave, flat or convex.
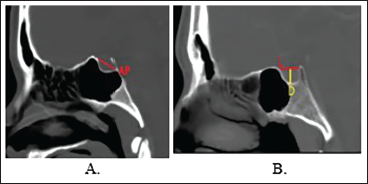
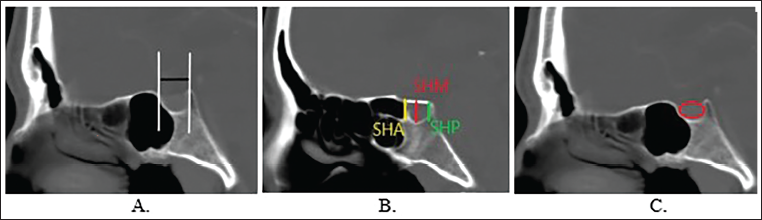
The linear measurements were conducted on midsagittal views guided by the position of the anterior nasal spine on axial views. These measurements, expressed in cm, were taken using a digital linear rule. The length, anteroposterior (AP) diameter and depth of the ST were determined using the approach outlined by Kiran et al. 13 (Method 1; Figure 2). We also adopted the method introduced by Makhbul et al. 14 to obtain the metrics of the ST, including sella length (SL), sella width (SW), sella height median (SHM), sella height anterior (SHA) and sella height posterior (SHP) (Method 2). The ST area was calculated by delineating its margins using the calliper provided by PACS (Figure 3).
The data, processed using the IBM® Statistical Package for Social Sciences (SPSS) version 23 (Armonk, New York, USA), were stratified by sex and age categories. Dimensional comparisons within these groups were performed using the independent t-test and one-way analysis of variance (ANOVA) for sex and age, respectively. Chi-square analysis was employed to assess the variance in the hypophyseal fossa configurations between groups. The interrelation between the measured variables was assessed using Pearson’s correlation test. Statistical significance was attributed to a P value below 5%.
Results
The average age of the 336 patients under evaluation was 53.29 ± 18.18 years. A total of 199 images belonged to males, accounting for 59.2%, while 137 were scans for females, constituting 40.8%. The majority fell within the 50-59 years’ age group (67, 19.9%), followed by 60-69 years (55, 16.4%), 40-49 years (52, 15.5%) and 30-39 years (50, 14.9%). The distribution in the remaining age groups was 46 (13.7%), 40 (11.9%), 19 (5.7%) and 7 (2.1%) individuals in the 70-79, 20-29, 80-89 and ≥90 years’ age groups, respectively.
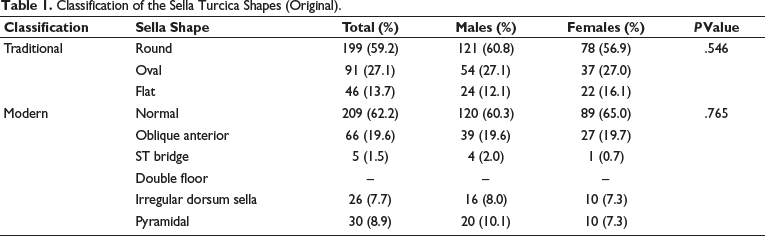
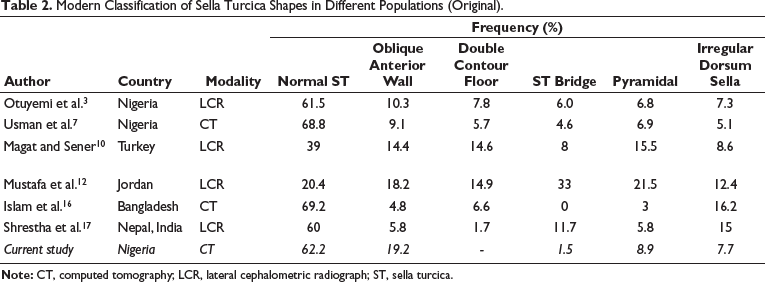
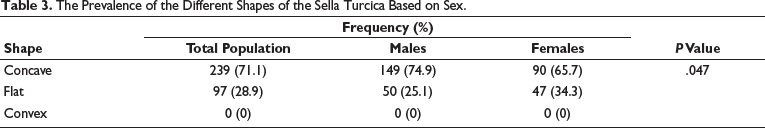
The most predominant shapes were round (199, 59.2%) and normal ST (209, 62.2%). The frequencies of the ST configurations categorized by the traditional and modern classification systems lacked substantial association with sex (P > .05; Table 1). The comparison of the prevalence of these ST shapes among diverse populations is shown in Table 2. We observed the concave (239, 71.1%) and flat (97, 28.9%) ST floor, with a significantly higher occurrence in males and females, respectively (P = .047). The convex-shaped floor was not observed (Table 3).
Classification of the Sella Turcica Shapes (Original).
Modern Classification of Sella Turcica Shapes in Different Populations (Original).
The Prevalence of the Different Shapes of the Sella Turcica Based on Sex.
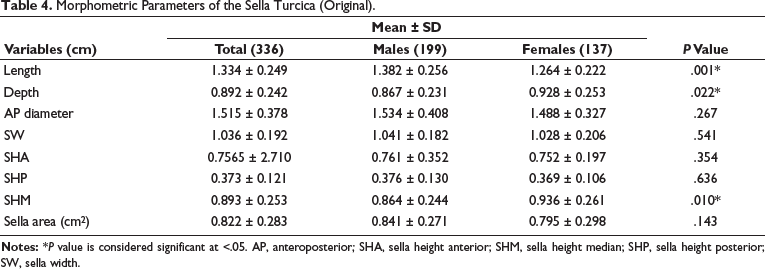
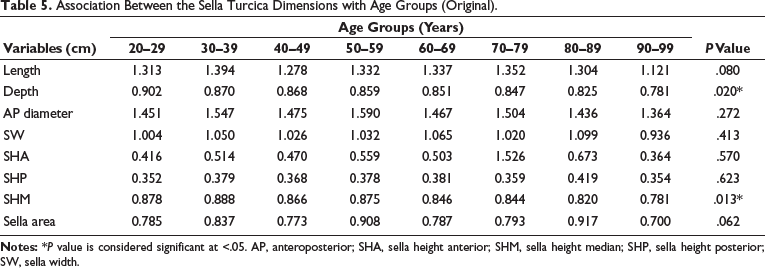
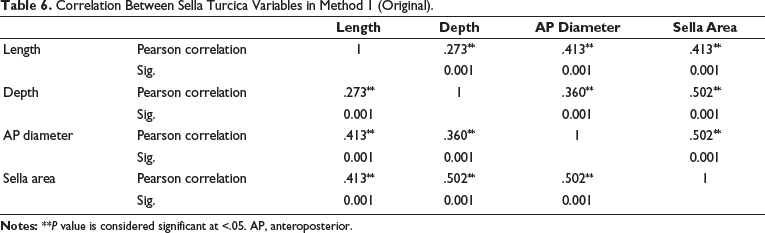
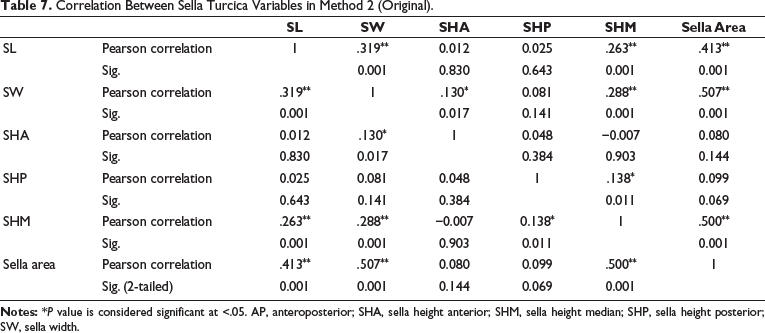
The mean dimensions of the hypophyseal floor obtained through both Methods 1 and 2 are detailed in Table 4. Sex differences were statistically significant for the depth, length and SHM, while the depth and SHM exhibited statistically significant variations across different age categories (P < .05, Table 5). Significant weak positive correlation was noted between some dimensions as follows: length/depth, length/AP diameter, depth/AP diameter and length/area (0 < r < 0.5; P < .05). The ST area displayed a significantly strong positive correlation with the depth and AP diameter (0.5 ≤ r < 1; P < .05; Table 6). Moreover, there was a notable weak positive correlation between SW/SHA, SW/SHM, SHP/SHM, SL/SW, SL/SHM and SL/area (0 < r < 0.5; P < .05) while a significant strong positive correlation was identified between SW/area and SHM/area (0.5 ≤ r < 1; P < .05; Table 7).
Morphometric Parameters of the Sella Turcica (Original).
Association Between the Sella Turcica Dimensions with Age Groups (Original).
Correlation Between Sella Turcica Variables in Method 1 (Original).
Correlation Between Sella Turcica Variables in Method 2 (Original).
Discussion
The round ST was the most prevalent (59.2%), followed by oval (27.1%) and lastly, flat (13.7%) shapes. These frequencies closely resembled the CT findings by Usman et al. 7 in Sokoto, Nigeria. Bello and Usman 8 noted a higher occurrence of the round (70.4%) and oval (29.6%) ST and no instances of a flat ST. A dominant occurrence of the oval ST, followed by the round and lastly, the flat shape, was reported by another research conducted in Nigeria by Zagga et al., 15 and this aligned with findings from Jordan and Saudi Arabia. 12 In Bangladesh, Islam et al. 16 reported a predominance of the oval (48.1%), followed by the flat (28.3%) and lastly, the round shape (23.4%).
We observed the normal ST shape in 62.2% of the evaluated patients, while the remaining 37.8% exhibited variant ST shapes. These findings were in keeping with earlier Nigerian and Indian studies.3, 17 In Jordan, the frequencies of normal ST and ST variants were reported as 80% and 20%, respectively. 12 The observed variants in our study include oblique anterior (19.6%), pyramidal (8.9%), irregular dorsum sella (7.7%) and ST bridging (1.5%). Their prevalence varied from reports in other literature from various populations (Table 2). Discrepancies in the ST shapes may be ascribed to genetics, sex, age, race, ethnicity, type of skull, local factors, environmental factors and the development and pneumatization of the sphenoid sinus.4, 5, 8, 18
There was no observed association between the displayed ST shapes and sex, suggesting minimal influence by sex genes and hormones. Recognizing normal ST variants is crucial due to their links with certain craniofacial anomalies and their significant role in discriminating anomalies in the sella region. 10 The oblique anterior ST wall is associated with Down’s syndrome, Fragile X syndrome and lumbosacral myelomeningocele.1, 2, 7 The sella bridge, moulded by the union of ipsilateral posterior and anterior clinoid processes, corresponds to the ossification of the interclinoid ligament and is often linked with craniofacial and dental anomalies.9, 14, 17 The ST bridging is significantly associated with long face and open bite conditions, which are more prevalent in females. It can be used as a diagnostic indicator to aid in predicting the severity of malocclusion. 19
The ST floor was predominantly concave in shape (71.1%), consistent with findings from other Nigerian studies, which report variant frequencies of different shapes.8, 15 Similarly, in accordance with these reports, we noted significant sex variances in the shapes of the ST floor, suggesting the impact of sex hormones. The occurrence of variant shapes could be attributed to individual, ethnic and environmental factors. The configuration of the ST floor is affected by degenerative changes resulting from somatic growth and hormonal action of the pituitary gland. 1 Awareness of the normal variants is important, as it can be eroded by sphenoid sinus mucoceles, nasopharyngeal carcinoma or secondary metastasis. 7
The ST measurements obtained through both methods were greater than those reported in earlier studies.10,11,14,16,17 These disparities may stem from dissimilarities in genetics, sample size, sex distribution, age and age grouping, the imaging modality utilized, degree of magnification, software employed and the landmarks selected for morphometry.1, 7, 10 Congruent with some earlier studies, certain ST dimensions were sexually dimorphic, with males having longer dimensions and females showing larger ST depth and SHM.3, 17, 20 On the contrary, Islam et al. 16 reported no sexual dimorphism in the ST dimensions. The variations in literature may be influenced by genetics, sex distribution and age of the population sampled. Females undergo a pubertal growth spurt 2 years earlier than males, leading to a significant increase in the ST size between the ages of 11 and 15 years. Eventually, the ST becomes equal in size in both sexes. The delayed action of the Y chromosome in males results in a more prolonged growth period, contributing to a greater overall growth. 7 The degree of sexual dimorphism varies with the ethnic background, evolutionary changes and genetic influence. The significant sex differences observed in the ST depth and length suggest their potential utility in sex determination. 2
The SHM and depth displayed significant variations across the age groups. According to Mustafa et al., 12 the height or depth is the most representative parameter of change, with its increase slowing down and ceasing in early adulthood. Usman et al. 6 documented notable age-related discrepancies in the morphometry of ST. However, Shrestha et al. 17 found no significant relationship between ST dimensions and age. These discrepancies may be attributed to differences in the race and age distribution of the analyzed samples. Additionally, variations in genetic and environmental influences on the growth hormone levels affect skeletal maturation.1, 3 The age-related ST changes are correlated with the growth of the hypophysis with respect to the neuroendocrine differences between sexes. 10
Understanding the ST’s standard measurements and shape is important, as deviations from the normal may indicate an undetected pathology of the hypophysis, disrupting the normal regulation of hormone secretion.10, 11 A large ST may be linked with conditions like empty sella syndrome and pituitary tumours with concomitant hormonal disturbance as seen in acromegaly, Cushing’s disease, menstrual disturbance, galactorrhoea and hyperthyroidism.1, 2 Conversely, a smaller ST size is indicative of a low-functioning pituitary gland allied with conditions like short stature/dwarfism, Cushing’s syndrome, Sheehan’s syndrome and stunted skeletal growth.1–3, 21 A shorter length and higher depth of the ST may be associated with a long face, which commonly has a larger angle between the mandibular and occlusal planes, leading to an anterior open bite. 18
Significant positive correlations between the ST dimensions were observed, indicating potential utility in estimating the hypophyseal fossa’s size during neurosurgical procedures and orthodontic treatments. 6 The study findings are limited by the retrospective design and diverse sample selected. The study suggests the use of three-dimensional models on an expanded sample size of a specific sample group to verify the variant ST configuration. Further exploration of the interrelationship between morphological variants and dentofacial anomalies, involving vertical growth patterns of the face and malocclusion, is recommended.
Conclusion
The study provides normal measurements of the ST and the prevalence of its variant shapes, which are important to orthodontists, radiologists and neurosurgeons in aiding the diagnosis and follow-up of pituitary and dentofacial pathologies.
Footnotes
Acknowledgements
The authors express their gratitude to Ms Priscilla Ejiroghene for her valuable contribution to data collection, Dr Jaiyeoba-Ojigho Jennifer Efe for her expertise in data analysis and the resident doctors in the Radiology department of the Teaching Hospital for their technical support.
Data Availability Statement
The data sets generated and analyzed during the current study are available from the corresponding author on reasonable request.
Declaration of Conflicting Interests
The authors declared no potential conflicts of interest with respect to the research, authorship and/or publication of this article.
Ethical Approval
The Health Research and Ethics Committee of the Delta State University Teaching Hospital approved the study protocol prior to the commencement of this research (HREC/PAN/2020/030/0371). Being a retrospective study, acquisition of patient consent was waived.
Funding
The authors received no financial support for the research, authorship and/or publication of this article.