
Abstract
Introduction
The sella turcica (ST) is an important anatomical landmark occasionally filled with cerebrospinal fluid in a condition known as empty sella disorder (ESS). ESS occurs when the pituitary gland contracts due to issues with the contents inside the ST and has been linked with malocclusion, which remains less explored.
Aim
This study intended to investigate morphological and morphometric variations of ST in terms of sex, age, and race as well as document the prevalence of malocclusions in a South African adult sample.
Methodology
ST scans of 32 patients and 21 dry and cadaveric skulls were investigated. Volume was measured using plasticine, and other parameters were measured using a sliding vernier caliper and 3D slicer software.
Results
The width is the only linear parameter that showed significant (p < .05) variations against sex. The mean length, width, AP diameter, and volume variation between groups ages 31-50 and 51-70 were 0.54 mm, 3.60 mm, 1.48 mm, and 39.47 mm. The length of ST in Black people varied from that of White people by 1.58 mm. The width of ST in Black people was 10.90 ± 2.68 mm, and in White people, it was 12.99 ± 2.41 mm, which was statistically significant (p < .05). Class I malocclusion was the most common type in this study, and bridging of the ST was common in class II.
Conclusion
This study revealed that the ST varies among different ethnic groups. Also, the width of the ST can be used to identify sex, but the size of the ST at various ages cannot be used to gauge an individual’s growth because there were no significant differences.
Introduction
The sella turcica (ST) is a saddle-shaped anatomical landmark in the middle cranial fossa that is related to some important brain structures, such as the pituitary gland. 1 It has a hypophyseal depression between its ventral and dorsal walls (tuberculum sellae and dorsum sellae, respectively). 2 It has two anterior and two posterior clinoid processes on the superolateral angles that vary in size and shape, and it is bounded laterally by cavernous sinuses. 3 Notably, the ST is an essential anatomical reference for medical and dental assessments; however, sella bridging may complicate medical and dental procedures.4, 5
In a study conducted in the Irish population, it was discovered that in the patients treated by combined surgical-orthodontic means, the incidence of bridging was 16.7%, whereas it was 7.3% in the orthodontics-only group. 6 These findings appear to indicate a greater likelihood of ST bridging and abnormal ST dimensions in subjects treated by combined surgical-orthodontic means rather than by orthodontics-only. 6
The pituitary gland’s anatomical or pathological anomalies are the primary causes of the ST’s typical variations in size, shape, and volume. 7 The change in ST bridging, a type of ST alteration, may lead to dental anomalies like tooth agenesis, craniofacial deviation, and hypodontia, which is mostly found in females. 8 In Yemeni individuals, it was discovered that there was a significant difference in ST length between genders and age groups, indicating that individual differences exist in ST patterns. 9
The ST is regarded as a crucial marker for several radiographic investigations of the neurocranial and craniofacial complex. 10 It is used to evaluate craniofacial morphology and make the distinction between skeletal irregularities and dentoalveolar malocclusions. 4 Another study investigated aspects and morphological variation of ST in various ages and the relationship between ST and the kind of malocclusion. Malocclusion is a dental condition where the upper and lower teeth do not adjust when you close your mouth. There are three primary classes of malocclusion: Class I (maxilla just barely touches/slightly overlaps the lower jaw), class II (posterior positioning of the mandible to maxilla), and class III (ventral positioning of the mandible to maxilla). 11 When skeletal type malocclusion was assessed, the authors noticed that there was little correlation between ST morphology, linear aspects, and classes I, II, and III of malocclusion in any of the samples that had been investigated based on linear measurements. 12
Studies have reported a significant correlation between length and the anteroposterior (AP) diameter of ST bridging in different age groups, which marks the growth of an individual.9, 13, 14 More so, morphological variations, including dimension, size, and shape of ST, have been linked to the pituitary gland’s size. 15 Size may be an indication of a pituitary tumor, which can cause Cushing’s disease and acromegaly. 16 Although several studies have been conducted to investigate the morphology and morphometric changes of the ST in terms of sex and age. However, there is a dearth of information about the morphology and morphometric variations in ST concerning sex, age, and ethnic groups in the South African (SA) population, considering its multiethnic groups (Black, White, Colored, and Indian), which may be different across these ethnic groups. Hence, this study was designed to observe the morphology and measure the morphometric variations in ST with relation to age and sex, and to document the commonality of malocclusion in various SA ethnic populations.
Materials and Methods
Ethical Approval
The ethical approval for this study was obtained from the institutional Biomedical Research Ethics Committee (BREC) with the ethical reference number BREC/00004332/2022 for the bone samples and BREC/00002263/2020 for the CT scans.
Inclusion and Exclusion Criteria
Dry skulls and cadaveric skulls without deformations were used in this study. Computed tomography (CT) scans that were visible on the ST and are from existing records going back 10 years, whose sex is known and are from subjects who are above 18 years old, were used in this study and had a slice thickness of 0.44.
Morphological Parameters
The morphological parameters include ST bridging.
Measurements of the Sella Turcica
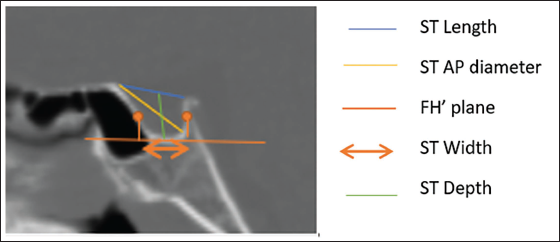
According to Silverman and Kisling’s procedures, three linear measurements of the ST were taken during CT scans, including its length, AP diameter, and depth in the midsagittal plane (Figure 1). The methods of Dryden and Mardia 17 and Halazonetis 18 were used to measure the breadth.
ST length was calculated as the linear distance between the tuberculum sella’s superiormost point and its dorsum sella tip.
ST depth: This was determined by drawing a line parallel to the floor’s lowest point from the line connecting the tuberculum sella and dorsum sella.
ST AP diameter was measured from the farthest point on the posteroinferior face of the hypophyseal fossa to the superiormost point on the tuberculum sella.
ST width: The biggest AP dimension from sella posterior to sella anterior was measured parallel to the Frankfort plane (FH) (Figure 1).
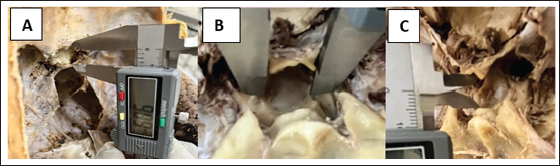
In dry and cadaveric skulls, all proportions, that is, length, width, and AP diameter, were measured using a digital vernier caliper (Figure 2).
ST length was measured by the distance along a straight line from the tuberculum sellae to the tip of the dorsum sellae, which was used to determine the length.
ST width was measured in the frontal plane at the floor of the fossa, which is the greatest distance between the medial margins of the sigmoid sinuses.
ST AP diameter was measured from the furthest point on the posterior inner wall of the fossa to the tip of the tuberculum sellae (Figure 2).
Procedure for Measuring the Dimensions of the Sella Turcica (ST) in Computed Tomography (CT) Scans. This Figure depicts How the Linear Osteological Parameters of ST in CT Scans, which include the Length, Anteroposterior (AP) Diameter, Width, and Depth in the Midsagittal Plane, were Measured at Frankfort Plane (FH).
Procedure for Measuring the Dimensions of the Sella Turcica (ST) in Dry Skulls and Cadavers. This Figure shows How the Dimensions of Sella Turcica were Measured in Dry Skulls and Cadavers, Where (A) ST Length, (B) ST Width, and (C) ST Anteroposterior (AP) Diameter.
Volume of the Sella Turcica
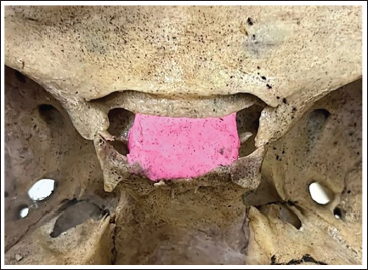
In dry/cadaveric skulls, an initial mass of plasticine was accurately weighed (grams to 2 decimal places using a Mettler balance). Plasticine was then manually filled into the ST, with the care of filling uniformly to reference marks and avoiding localized air pockets. The specimens were photographed for future reference (Figure 3). The remaining plasticine was measured again after this procedure. The ST volume was then calculated using the formula: Volume = Mass/Density. To avoid sticking to plasticine, an easy-release 200 spray for bones was used before filling in the plasticine. The density of plasticine was predetermined from the manufacturer’s specifications or calculated from a known mass using the technique of water/fluid displacement and applying the same formula.
This Figure Displays How the Volume was Measured in Dry Skulls and Cadavers.
In CT scans, volume was calculated using the formula: Slice thickness × width × length was used for this study.
Identifying Malocclusion
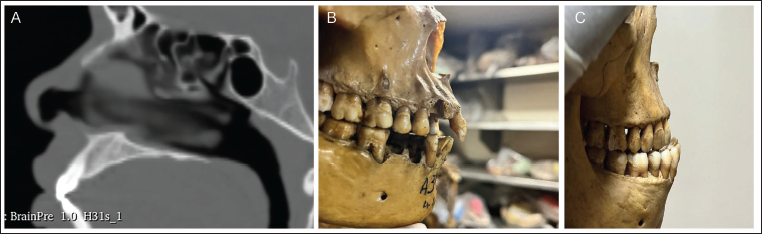
To identify classes of malocclusion, the upper jaw and lower jaw teeth were used (Figure 4).
Class I: The maxilla just barely touches the lower jaw.
Class II (retrognathism): Upper jaw teeth overly overlap lower jaw teeth. The mandible is posteriorly positioned to the maxilla.
Class III (prognathism): Lower jaw teeth overlap upper jaw teeth. There is ventral positioning of the mandible to the maxilla (Figure 4).
Various Classes of Malocclusion in the Sella Turcica. This Figure shows Various Classes of Sella Turcica Malocclusion that Exits, Which Include (A) Class I: Where the Maxilla Just Barely Touches the Lower Jaw, (B) Class II, also known as Retrognathism, Where Upper Jaw Teeth Overly Overlap Lower Jaw Teeth, and (C) Class III (Prognathism), Characterized by the Ventral Positioning of the Mandible to Maxilla and the Overlap of Lower Jaw Teeth.
Statistical Analysis
The dataset obtained was analyzed using IBM’s Statistical Package for the Social Sciences (SPSS) version 24. The mean difference in the ST’s dimensions between the male and female groups, over a range of ages and races, was evaluated using a t-test. An analysis of variance (ANOVA) test was performed to assess the mean difference in the dimensions of the ST in different age groups, sexes, and races. The threshold for statistical significance was established at p < .05.
Results
Prevalence of Malocclusion
This study observed 22.64% of class I, 26.42% of class II, and 9.43% of class III. According to the study conducted by Shah et al., 10 there was no association between the size of the ST and any other factor. Sella turcica bridging was not the common variation of this study, 7.55%.
Dimensions and Sex
The mean length in males and females was found to be 12.19 mm and 11.07 mm, respectively. The mean value varied by 1.12 mm in males and females. A significant difference (p < .028) in the mean width values between males (10.77 mm) and females (12.42 mm) was observed in this study, where males were narrower than females by 1.65 mm. The depth in males was 8.28 mm and 8.00 mm in females. The mean AP diameter in males was 13.35 mm and 12.02 mm in females, with a difference of 1.33 mm between the two sexes. The volume varied by 15.00 mm in males and females. Length and depth parameters had a p < .05 (Table 1). The volume and AP diameter were minimal and did not demonstrate any importance.
Dimensions and Age
The direct measurements of the ST with ages of both males and females, that is, length, width, depth, AP diameter, and volume for subjects with age range from 18 to 30 were 11.66 ± 2.71, 9.92 ± 1.68, 8.04 ± 1.11, 12.60 ± 2.86, and 48.11 ± 19.50, respectively. The mean length, width, AP diameter, and volume variation between age groups 31-50 and 51-70 were 0.54 mm, 3.60 mm, 1.48 mm, and 39.47 mm, as displayed in Table 2. No depth was found in the group ages 51-70 because these ages were only found on cadaveric/dry skull subjects, whose depth was not measured as it was not an objective. The length, width, AP diameter, and volume for the 71-90 age group were 10.56 ± 1.27, 13.74 ± 2.41, 11.51 ± 1.32, and 0.28 ± 0.05 mm, respectively. Only the width parameter was statistically significant with a p value < .01 (Table 2).
Dimensions and Race
The length of Black and White people was detected to be 12.16 ± 3.01 and 10.58 ± 1.21, respectively. The width of Black people was 10.90 ± 2.68 mm, and for White people, it was 12.99 ± 2.41 mm, which had statistical significance (p ˂ .008). The depth of ST only varied by 0.12 mm from Black and White people. The mean AP diameter of Black people was 13.33 ± 2.76 mm and 11.40 ± 1.20 mm for White people. The mean volume parameter for Blacks and Whites was 40.52 ± 26.14 mm and 11.56 ± 21.78 mm, respectively. Only the depth parameter did not have any statistical significance (Table 3).
Discussion
To establish reference standards that aid in the identification of abnormalities and pathologies of the ST, numerous studies have been carried out to assess the prevalence and distribution of differences in the ST’s morphology in healthy and normal individuals. 14 Many genetic disorders, including Down syndrome and Turner syndrome, influence the size of the Sella turcica. Since the hypophysis develops before the hypophyseal fossa does, the development of the ST will be afflicted by pituitary gland-related developmental issues. 19 Pituitary cancer typically spreads vertically in the rostral direction towards the suprasellar region because the ST forms a firm caudal line for the pituitary organ. This may put pressure on the optic chiasm, which surrounds and wraps around the pituitary. Bitemporal hemianopsia can be caused by pressure on the optic chiasm, and when there is no significant lesion, this clinical feature is pathognomonic for pituitary malignancy. 2 A few pituitary adenomas have limited growth potential; they may develop lower and assault the sphenoid bone and large sinus. 20 Large adenomas can change the shape of the ST and the basic sphenoid bone. In cephalometric examinations, the ST is frequently used as a direct source of perspective with the nasion to demonstrate the foundation of the skull. Usually, this is done before receiving orthodontic treatment. 19 This study focused on the proportions of the ST and compared them to the gender, age, and race of SA adults.
Prevalence of Malocclusion
According to the literature, there have been very few investigations comparing the size of the ST with the type of malocclusion that is present to determine whether there is a relationship between the two. This study observed 22.64% of class I, 26.42% of class II, and 9.43% of class III. According to the study conducted by Shah et al., 10 there was no association between the size of the ST and any other factor. Sella turcica bridging was not a common variation of this study, 7.55%. The current study found all bridging of the ST in malocclusion class II, which does not agree with the study done by Meyer-Marcotty et al., 21 who observed it in class III.
Dimensions and Sex
The ST’s size has been the subject of most investigations. However, there are other approaches, such as imaging studies, hormonal assessment, clinical assessment, and specialized studies. Al-Mohan et al. 9 reported a value of 8.24 mm in males and 7.67 mm, as shown in Table 4. Motwani et al. 12 found the length in males to be 9.104 mm and 8.126 in females. In the present study, the length was found to range from a minimum of 7.32 mm to a maximum of 19.083 mm. In the SA study, the length in males was 12.19 ± 3.13 mm, and in females, it was 11.07 ± 1.97 mm. In a study by Andredaki et al., 22 they observed a width of 8.9 mm in males and 9.1 mm in females. In the current study, the mean was 10.77 mm in males and 12.42 mm in females, and both these studies showed less variation in the width of the ST. The AP diameter ranged between 7.30 and 20.13 mm. The depth in the current study was 8.28 mm in males and 8.00 mm in females, which is slightly bigger than the observations of Andredaki et al., 22 who got 6.6 mm for males and 6.8 mm for females. The volume of the ST had a variation of 15.00 mm between males and females. Table 1 data suggest that males have larger dimensions than females, 23 which is also like a previous study carried out by Nagaraj et al. 19 The pubertal growth spurt, which occurs 2 years sooner in males, may be the likelihood for the variations in the dimensions of ST about sex and is the cause of this. 12 The implications of these varieties are not clear-cut. Research in this space is continuous, expecting to grasp the likely implications, if any, of sex-based differences in ST size or shape on well-being or hormonal regulation. 24
Dimensions and Age
Hass stated in 1954 that until the age of 17, the area of the ST in males was more than that of the ST in females; however, after the age of 17, the ST area in females is somewhat larger than that of males. When the age criteria in the current study were compared to those of Axelsson et al. 25 and Nagaraj et al., 19 the studies were not comparable in terms of linear measures because males’ values tend to rise with age. However, the present study discovered that the dimensions of the ST in subjects aged 31 ≤ 50 have greater length, width, depth, AP diameter, and volume than in subjects aged 18 ≤ 30, as presented in Table 2. There was no statistical difference in length, depth, and AP diameter parameters. Only the width and volume had statistical differences (p < .01) on both parameters. Hormonal changes, particularly during puberty, can impact the development and improvement of the pituitary gland, and the implications could be an unusual ST, demonstrating issues with the pituitary organ, like tumors. 26
Dimensions and Race
The length of Black people varied from the length of White people by 1.58 mm. There was a small variation in the mean depth in both racial ethnicities. In the present study of SA people, it was detected that Blacks had larger proportions of the ST than Whites. Length, width, AP diameter, and volume parameters all had a statistical difference (p ˂ .05), which agrees with previous studies that dimensions of the ST change depending on the individual race. 13 Although the genetic basis for these differences is unknown, genetic factors may play a role in the variations of the ST. 2 The distinctions in the size and state of the ST may have suggestions for orthodontic treatment arranging and determination of the pituitary pathology. 26
Conclusion
In this study, it was observed that a few linear measurements were linked with age, albeit to a modest degree. A statistical difference was found in the width in comparison to sex, in the width and volume in comparison to age and length, and width, AP diameter, and volume in comparison to race. This study revealed that the ST varies among different ethnic groups. Also, the width of the ST can be used to identify sex, but the size of the ST at various ages cannot be used to gauge an individual’s growth because there were no significant differences. Also, class I malocclusion was the most common type in this study, and bridging of the ST was common in class II. To distinguish between the normal and abnormal appearance of the ST, the orthodontist needs to be knowledgeable about its morphological variations to avoid pitfalls during medical and dental procedures.
Limitations
The limitations of this study are the small sample size and probably the method of volume estimation. Therefore, a large sample size with more than two ethnic groups is recommended for future studies. Also, using another similar inert material to calculate volume on dry skulls/cadavers in the SA population of younger people is recommended.
Footnotes
Acknowledgments
The authors extend special thanks to Makgotso Nchodu for their assistance in the data collection of CT scans. We appreciate Devon Bailey, Matome Matsipi, and James Ngcongo for their dedication to assisting in data collection for this study on dry skulls/cadavers.
Availability of Data and Materials
All the data and materials to support this study are included in this manuscript.
Declaration of Conflicting Interests
The authors declared no potential conflicts of interest with respect to the research, authorship, and/or publication of this article.
Ethical Approval
The ethical approval for this study was obtained from the institutional Biomedical Research Ethics Committee (BREC) with the ethical reference number BREC/00004332/2022 for the bone samples and BREC/00002263/2020 for the CT scans.
Funding
The authors received no financial support for the research, authorship, and/or publication of this article.
Informed Consent
NA.