
Abstract
Introduction
The bio-stimulatory effects of low-intensity ultrasound on dental tissues which were clinically introduced in 2004 demonstrated a reduction in root resorption in maxillary premolars subjected to a force level of 50 g. Similar results by applying a torque of 50 g to the maxillary premolars were obtained in 2016; however, the effects of low-intensity pulsed ultrasound (LIPUS) on the presence of high-intensity forces are not yet known.
Aim
The purpose of this study was to examine the effects of LIPUS on a sample of 40 patients.
Methods
The analysis was conducted by applying two forces to teeth no. 14 and 24, each with an intensity greater than 50 g, and applied at two different points on the coronal surface. Subsequently, LIPUS was applied daily for 20 minutes to tooth no. 14, while tooth no. 24 served as a control. The study lasted for 28 days.
Results
Overall, the group treated with LIPUS demonstrated an improvement in the average total volume and percentage of root resorption compared to the control group. The same results emerged for the diameter, depth, and surface of the gaps of resorption.
Conclusion
This study showed that it was possible to reduce root resorption in the presence of forces with intensities greater than 50 g. Nevertheless, a longer period of study will make it possible to obtain more rational results as to the effectiveness of low-intensity ultrasound on root resorption induced by orthodontic treatment.
Introduction
Orthodontics is a discipline that focuses on meeting the urgent needs of young people, often in aesthetic and functional contexts, while the orthodontists must ensure that the patient’s dental organ is treated appropriately. 1
Indeed, root resorption is one of the undesirable effects of orthodontic therapy. Its causes are multifactorial 2 ; however, the intensity of the force applied to the dental system is the most important factor involved in this inflammatory resorption mechanism.2–4
In terms of frequency, 50-60% of cases show apical root resorption, according to Samadet.5–7 Other authors 8 have reported that root resorption is a common occurrence in 90% of orthodontic patients. Severe forms exceeding 4 mm are present in 6% of this group.
It is interesting to note that resorption is frequently seen at the apical ends. 9 This may be a result of high compression state of desmodont with version-type tooth movement. 10
Many animal model experiments have attempted to prevent the progression of orthodontic root resorption using various molecules such as thyroxin, bisphosphonate, and corticosteroids.
However, none have been applied to human clinical studies.11–16 Low-intensity ultrasound could be taken into consideration as a promising treatment.
They have been initially employed in medicine to make a diagnosis of expectant patient and in brain imaging with a range of 7-20 MHz. 17 In dentistry, they are used for ultrasonic scaling, and in conservative dentistry as a method of canal disinfection.
The first clinical trial was carried out by Tarek El-Bialy in 2004. In this study, the author applied a force of 50 g to the maxillary premolars allowing them to move in the buccal direction, with one group receiving low-intensity ultrasound and the other group serving as a control. The group receiving low-intensity pulsed ultrasound (LIPUS) had less incidence of resorption lacunae.
In another study, RAZA, this time using the same vestibular torque intensity, showed the same results. The action of ultrasound when using higher forces is still unknown. Thus, in this clinical study, the effect of LIPUS on root resorption was assessed when two types of high-intensity forces were applied to maxillary first premolars: a force of 150 g to induce movement in the vestibular direction and a force of 100 g incorporated in the bracket to move the tooth in mesiodistal version.
Materials and Methods
The present study was approved by the Faculty of Medicine’s Research Ethics Committee and all participants were informed of the purpose of the study and provided informed consent by signing the consent document. The patient recruitment period started in December 2015 and ended in May 2016. The size of the sample was calculated as follows: for a resorption P0 value without LIPUS and P1 resorption with LIPUS; estimating that P1 – P0 (the difference to be detected) varies from 10% to 30% and for α = 0, 05 and 1 – β = 0, 9. n = [z1 – α/2 x√(P0 (1 – P0)) + z1 – β/2x√(P1 56 (1 – P1))]2.
Forty-one patients in this study had a mean age of 21.07 ± 1.29 and were selected from patients requiring maxillary first premolars extractions to treat malocclusion. During these extractions, a right upper premolar was fractured; we thus excluded its counter-lateral counterpart from the sample in order to obtain two balanced study groups. We carried out nonrandom and empirical sampling. Patients (university students) agreed to take part in the study voluntarily.
The device consists of bands that are positioned on the upper first molars. On the palatal side, a 0.7 mm wire is welded to the band and its extremity exerts a force of 150 g on the first premolar.
In this study, edgewise brackets were used as well as an orthodontic composite like a bonding agent.
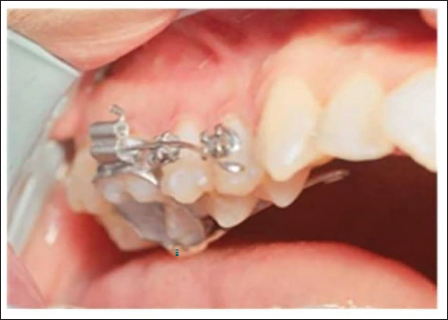
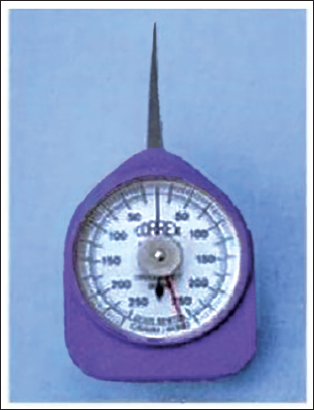
A rectangular sectional arch measuring (0.018 × 0.025 inch) was inserted on each side of the dental arch. A second-order plication was applied to the first premolar producing a moment of 100 g-m. This moment was measured with a dynamometer (Figures 1, 2 and 3a, b, and c).
Second-order Plication in the First Right Maxillary Premolar.
Dynamometer.
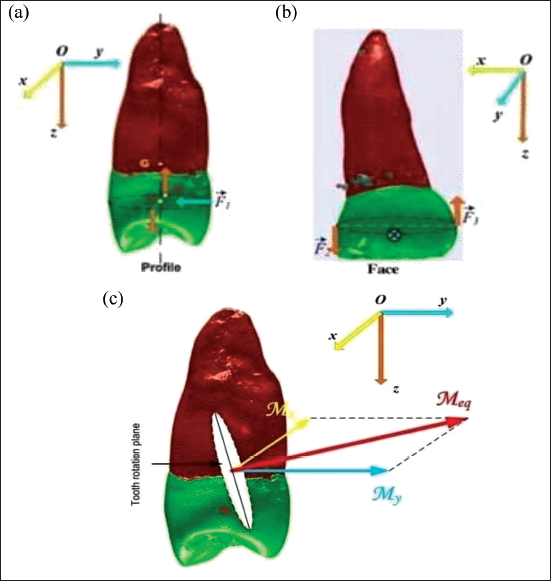
Vector Representation of the Force System in Place. Profile View (a): Vertical Arrows (Orange) Represent the Forces Exerted in the Bracket (Second Order), While the Horizontal (Blue) Arrow Represents the Force Exerted on the Palatal Face. Front View (b): the Force is Represented in the Form of a Cross. (c) Diagram of the Resultant of the Force System Put in Place.
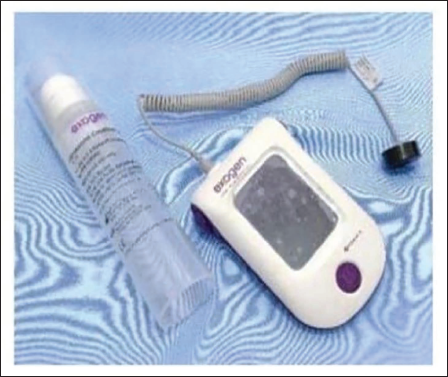
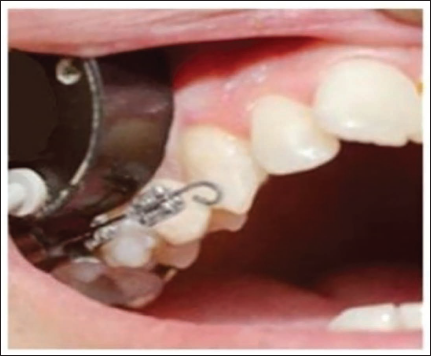
On the palatal face, the arc segment was activated by the dynamometer, generating a labial moment of 150 g-mm for all patients in the sample. A small amount of gel was applied to the transducer surface and firmly held by on the gingival mucosa of the first right premolar (no. 14) while the first left premolar (no. 24) served as a control (Figures 4 and 5).
Exogen Device and Bottle of Gel.
Transducer Applied to the Gingival Mucosa.
The device is started by pressing the button to display the startup screen. After 5 seconds, the 20-minute countdown appears on the screen and the ultrasound treatment begins automatically. The patient hears a beep to signal the end of the treatment when the timer reaches zero. The device beeps once more and shuts off after five seconds. LIPUS is applied daily for 28 days.
After four weeks, the first right and left premolars were extracted by the same practitioner from the Department of Pathology and Oral Surgery and were then preserved in tubes filled with ethanol 75°.
Just before their extractions, a fine-sized round bur mounted on a turbine was used to locate perforations (one on the mesio-vestibular wall and two on the mesio-palatine wall) near the cervical region. This process was carried out to make it easier to identify resorption gaps on the various walls using an algorithm created especially for the task. The device used is called exogen, from the Bioventus laboratory. Initially, it was used to accelerate the healing process of bone fractures. Its physical parameters are as follows: (F: 1.5 MHz; FRP: 1 KHz, in pulse mode 200 µs, and an intensity of 30 mW/cm2 per surface transducer).
Laboratory Stage
The premolar sample was sent to the dental surgery faculty’s orofacial pathologies, imaging, and biotherapy laboratory. The premolar scanning was obtained by micro-tomography X-ray. The radiology device used in this study was a Quantum FX caliber, Life Sciences, Perkin Elmer, and Waltham, MA. The X-ray source was set at 90 V and 160 µA. Each premolar was scanned with a 20 mm vision field (FOV 20) and digital acquisitions were performed using an isotropic of 40 × 40 × 40 µm3. The raw data were obtained by rotating both the X-ray source and the flat-screen detector 360° around the sample with a rotation step of 0.1° (scan time: 3 minutes).
Subsequently, 3,600 corresponding image projections were automatically reconstructed (using Rigaku software, Caliper) in a DICOM stack of 512 files using standard rear projection techniques (reconstruction time: less than 1 minute).
Using an algorithm developed especially for this study, all of the resorption gaps were determined methodically across all microvolumetric acquisitions (Annex 1). The evaluation criteria used in this study are the diameter, depth, surface area, total volume of root resorption, and the percentage of resorption.
To determine the gaps’ position, calculate their diameter, depth, and surface; refer to Annex 2. The volume was calculated on each root, and then the average of all premolars was obtained. The percentage of resorption was obtained by calculating the ratio of the total resorption volume to the total volume of root dentin.
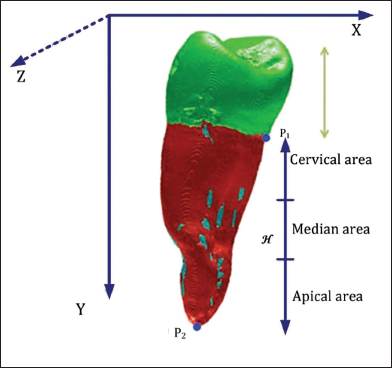
The gaps of resorption were localized on the cervical, median, and apical thirds from the cementoenamel junction, as well as through the different mesial, distal, vestibular, and palatal walls (as illustrated in Figures 6 and 7).
Location of Gaps in the Different Walls.
Localization of the Gaps through the Different Third Radicular.
Statistical Analysis
Data entry and analysis were performed using EpiData software (version 3.01) and EpiInfo (version 3.5.4). The results are expressed in numbers, percentages, means, and standard deviation.
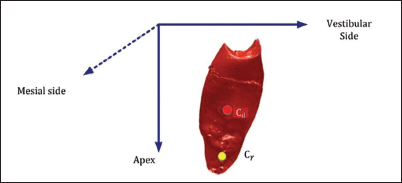
With Cd (Xd, Yd, Zd) and Cy (Xy, Yy, Zy) the respective mass centers of the dentine and the gap; the location of the gap can be determined:
Xd < Xy the gap is on the vestibular side,
Zd < Zy the gap is towards the apex,
Yd < Yy the gap is on the mesial side.
We determine p1 (x1 y1 z1) to be the lowest point of Ω email.
We determine p2 (x2 y2 z2) to be the lowest point of Ω dentine.
It is a comparison between independent series; therefore, we used the Z-test to compare two pair-matched quantitative means and the variance test for the comparison of several quantitative averages.
Results
Initially, the sample consisted of 81 premolars; one premolar was fragmented during extraction and removed from the study along with its homologue. This results in a balanced sample of 40 premolars on each maxillary side.
According to the gender distribution of the data, the sample is divided into 33 girls (82.5 %) and 7 boys (17.5 %) with an average age of 20.97 (±1.31) years for boys and 21.57 (±1.13) years for girls, totaling an overall average of 21.07 (±1.29).
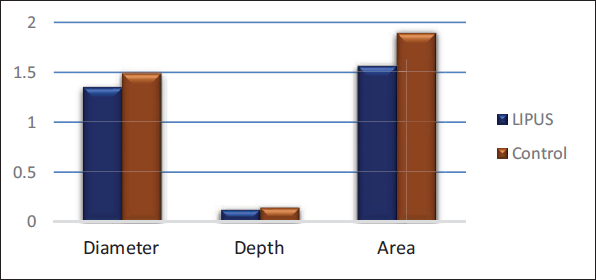
Overall, each of the studied variables decreased significantly in the LIPUS group compared to the control group; the diameter, depth, and area of the gaps were significantly reduced in the LIPUS group compared to the control group (Figures 8 and 9).
Diameter (mm), Depth (mm), and Area (mm2) of Root Resorption in Low-intensity Pulsed Ultrasound (LIPUS) and Control Group.
Comparison of CT Images between Right (no. 14) and Left Maxillary First Premolar (no. 24).
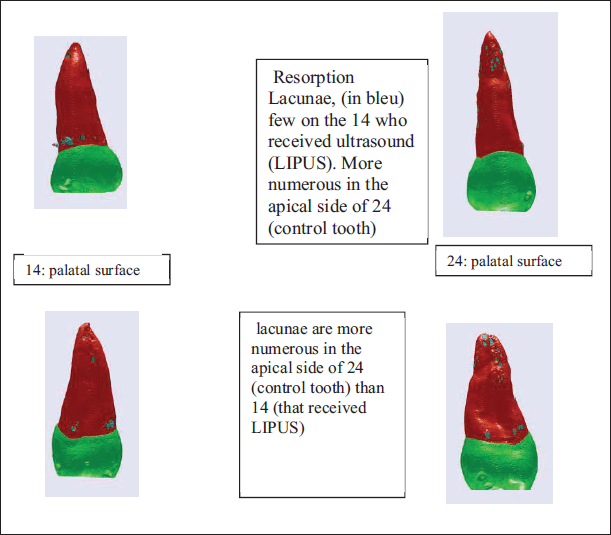
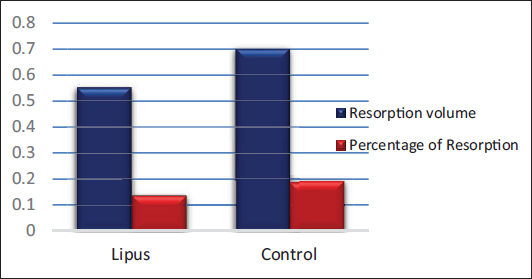
Comparable results were observed for the resorption percentage and average volume, both significantly reduced in the LIPUS group (Figure 10).
Total Volume (mm3) and Percentage of Root Resorption (%) in Low-intensity Pulsed Ultrasound (LIPUS) and Control Groups.
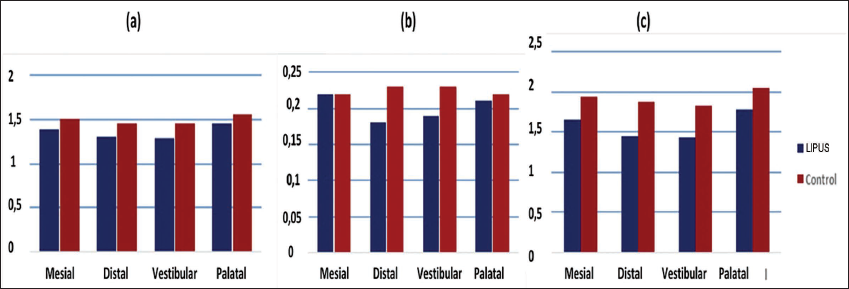
On the other hand, the diameter, depth, and surface of the gaps were reduced on all sides; however, this reduction was only significant on the vestibular and distal sides and not on the mesial and palatal sides (Figure 11a, b, and c).
(a) Resorption Lacunae Diameter (mm) on Different Root Surfaces in LIPUS and Control Groups. (b) Resorption Lacunae Depth (mm) on Different Root Surfaces in LIPUS and Control Groups. (c) Resorption Lacunae Area (mm2) on Different Root Surfaces in LIPUS and Control Groups.
Discussion
To begin, it is important to remember Owman’s observation in a histological study on premolars of orthodontically treated adolescent patients; in fact, he observed that after eight weeks of dental retention, approximately 50% of root resorption defects had not yet been repaired or had only been partially repaired. 18
The overall significant improvement of the studied variables in the LIPUS group compared to the control group could be attributed to molecular and cellular mechanisms resulting from LIPUS action, leading to an increase in the number of cementoblastic cells of their differentiations through increased transcription of alkaline phosphatase, collagen-1, RUNX protein, and even an increase in their mineralization potential through high prostaglandin synthesis in the LIPUS group.19–22
In the present study, the LIPUS group showed approximately 20% improvement in root resorption after only 4 weeks of orthodontic treatment; however, RAZA 8 found a 50% improvement in resorption volume at a much lower force intensity (50 g) compared to our force system. Similarly, the depth of the gaps was repaired twice as effectively in the RAZA study 8 as it was in our study.
The surface of lacunae obtained in El-Bialy’s study was smaller compared to the values we found.
Although the comparability of our findings with these two clinical studies is not perfectly sure because of different resorption evaluation tools, we can nevertheless offer some insights that may explain these differences:
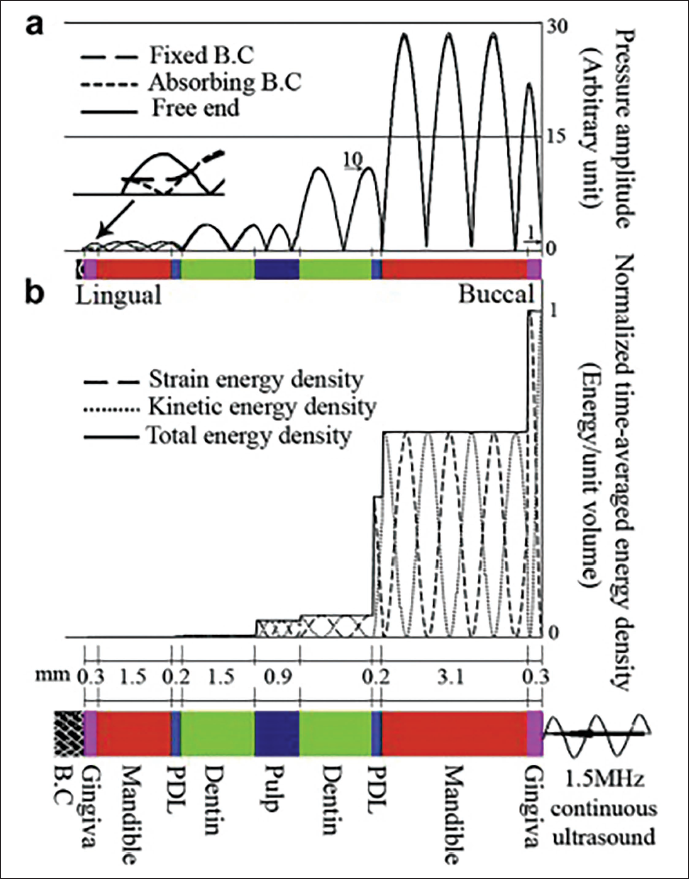
The forces applied in our study were significantly greater and risked severe ligament compression. The loss of acoustic energy due to the disproportionate size of the transducer (3.88 cm) compared to the working surface of the first premolar. Other factors, such as anatomical obstacles (e.g., formula of the attenuation coefficient) may also contribute. In this context, a study carried out on the dog
23
showed that the effect of the dentoalveolar thickness on the reduction of the ultrasound energy density was evident due to the internal reflections (Figure 12); this would lead to a reduction in the repair effect of the LIPUS on root resorption. The quality of the gel–transducer and transducer–gingival coupling are other factors that can explain the loss of ultrasound energy and lead to low root resorption repair rates.
Overall hyalinized areas due to high forces increase the severity of root resorption and decrease the potential of healing. They may increase the extent of the gaps and reduce repair possibilities.
On different side of the root, all variables were reduced in favor of the LIPUS group and at different significance levels, possibly implicating low-intensity ultrasound in the root repair process.
Recent studies have shown that periodontal hyalinization in pressure areas exposes repair cells to apoptosis, thus reducing their number.24–26
On the other hand, the improvement of various variables in the LIPUS-treated group, especially in compression zones, may be due to the inhibition of the molecular mechanism of cell apoptosis by action of LIPUS, resulting in an increasing number of cementocytes favorable to healing process. 27
Finally, the lower repair rates obtained in the mid and palatal walls are consistent with the line of action of the resulting force passing between the two walls and may be responsible for the high pressure at this level.
Conclusion
The objective of this study was to show that LIPUS can reduce the extent of resorption gaps, especially in the presence of high forces and the results generally support this hypothesis.
However, we recommend the application of LIPUS in other long-term clinical studies to better evaluate its effectiveness on resorption of orthodontic origin.
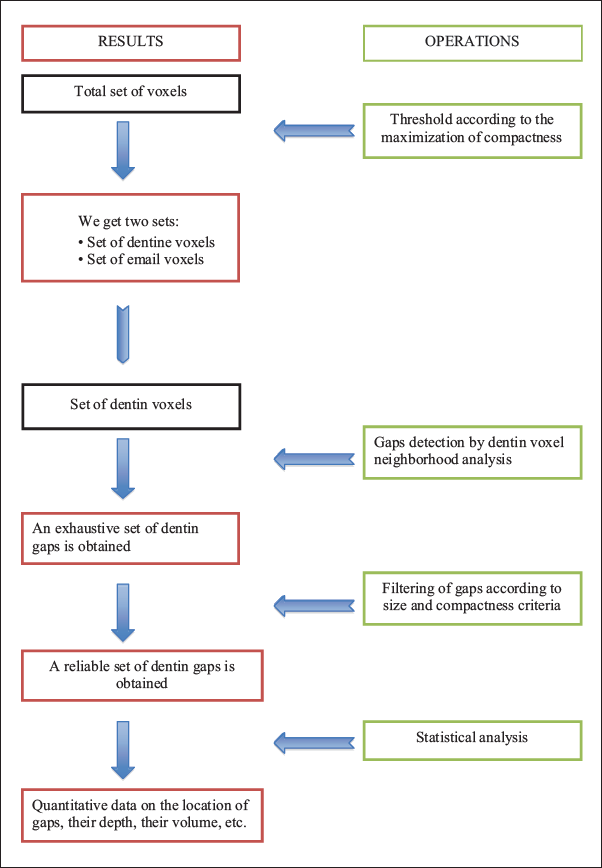
Annex 1
Summary of the Operations of an Algorithm
Annex 2
Calculation of the largest diameter of the lacunae:
Let voxel n1 (x1, y1, z1) and voxel n2 (x2, y2, z2) belong to the lacunae. y, the distance separating them is equal to:
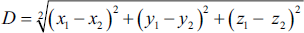
The largest diameter is sought by calculating the distance between each voxel of the lacunae.
Calculation of the greatest depth:
Among the voxels belonging to the gap Ωγ consider the set Ωsurface extérieur which are the voxels in contact with the voxels of Ω exterieur not included in Ωγ.
Thanks to the least squares method we can calculate a plan P equation approaching the set Ωsurface exté:

We deduce the coordinates of the vector normal to the plane
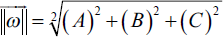
Let voxel n1 (x1, y1, z1) and voxel n2 (x2, y2, z2) belong to the lacunae Υ.
The coordinates of the vector are (x1 – x2, y1 – y 2, Z1 – Z2) with the standard:

The greatest depth is sought by calculating the coordinates of the vectors formed between each voxel of the lacunae.
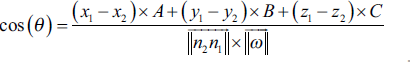
These vectors are then searched for those that are collinear to
The scalar product of these two vectors is equal to:

So:
Any coordinate vector (x1 – x2, y1 – y 2, Z1 – Z2) colinear to
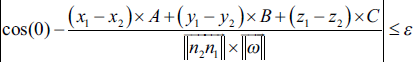
With ε negligible positive value in front of 1.
Among these, we search for the one with the highest standard. This larger standard corresponds to the greater depth of the lacunae.
Calculation of the surface of lacunae:
Consider all voxels not belonging to the gap Ωγ. Let’s call this set Ω𝑒x𝑡𝑒𝑟𝑖𝑒𝑢𝑟 𝑙𝑎𝑐𝑢𝑛𝑒.
Among the voxels belonging to the lacunae Ωγ, consider the whole Ωsurface 𝑙𝑎𝑐𝑢𝑛𝑒 which are the voxels in contact with the voxels of Ω𝑒x𝑡𝑒𝑟𝑖𝑒𝑢𝑟 𝑙𝑎𝑐𝑢𝑛𝑒.
Let s be the area covered by a voxel. The total area St of the gap is equal to the sum of the area of the voxels of Ωsurface 𝑙𝑎𝑐𝑢𝑛𝑒: 𝑆𝑡 = ✓ard(Ω 𝑜𝑢𝑡𝑠𝑖𝑑𝑒 𝑠𝑢𝑟𝑓𝑎𝑐𝑒) × 𝑠.
✓ard (Ω 𝑜𝑢𝑡𝑠𝑖𝑑𝑒 𝑠𝑢𝑟𝑓𝑎𝑐𝑒): Ω 𝑜𝑢𝑡𝑠𝑖𝑑𝑒 𝑠𝑢𝑟𝑓𝑎𝑐𝑒, that is, the number of voxels in the set Ω 𝑜𝑢𝑡𝑠𝑖𝑑𝑒 𝑠𝑢𝑟𝑓𝑎𝑐𝑒.
Footnotes
Acknowledgment
The authors would like to thank the designer of the algorithm used in this study, Mr Franck Maizeroi-Eugene, for his remarkable work and his availability throughout the elaboration of this study.
Authors’ Contributions
TB designed the study, recruited and treated the patients, SL supervised the research, RM performed premolar extractions, LS performed the radiological procedure and the acquisition of digital images on the extracted premolars, AB for having reproduced the diagrams in Figure 3a, b, and c and processing them with the Visio software, AT for carrying out the statistical tests, MTK for manuscript revision.
Availability of Data and Materials
All data analyzed during this study are included in this published article.
Declaration of Conflicting Interests
The authors declared no potential conflicts of interest with respect to the research, authorship, and/or publication of this article.
Ethics Approval
The present study was approved by the Ethics Committee of the Faculty of Medicine of Annaba, where all participants were informed of the purpose of the study and gave their agreement by signing the informed consent document.
Funding
The authors received no financial support for the research, authorship, and/or publication of this article.
Informed Consent
All participants were informed of the purpose of the study and gave their agreement by signing the informed consent document.