
Abstract
Splenic masses are common in dogs and vary dramatically in their clinical behavior. Clinically, and even with histology, it can be challenging to differentiate between benign and malignant splenic masses. Hemangiosarcoma (HSA), the most common malignancy of the spleen, is a very aggressive tumor with a poor prognosis. We hypothesize that microRNAs (miRNAs) in mass tissue and serum can differentiate between HSA and other splenic masses. Fifty-nine miRNAs were investigated by reverse-transcription followed by real-time quantitative polymerase chain reaction (RT-qPCR) in serum and/or tissue from dogs with HSAs (serum n = 24 and tissue n = 17; postsplenectomy serum n = 11), lymphomas (serum n = 8 and tissue n = 11), nonangiomatous nonlymphomatous sarcomas (serum n = 6 and tissue n = 10), histiocytic sarcomas (tissue n = 4), benign splenic masses (myelolipomas, nodular hyperplasia, and hematomas; total serum n = 21 and total tissue n = 35), and normal dogs (serum n = 14 and tissue n = 7). Numerous miRNAs were differentially expressed in serum and tissue of HSA cases compared to those with other splenic masses or normal spleens. In serum, our 5-miRNA model (miR-135a-5p, miR-10a, miR-450b, miR-152-3p, and miR-126-5p) accurately classified 100% (24/24) of dogs with HSA from normal dogs and those with a benign splenic mass (recall = 1 for HSA). The overall accuracy of the model was 86%. In HSA and benign splenic mass tissues, our 3-miRNA model (miR-126-5p, miR-502-3p, and miR-452-5p) accurately classified 96% of the cases. This study demonstrates the utility of miRNA models in serum and tissue for screening and diagnosis of HSA in dogs. Future studies include the evaluation of prospective and prediagnosis serum samples.
Splenic masses are common in dogs and have a large spectrum of clinical behaviors from benign to malignant, such as hemangiosarcoma (HSA).7,9,10,24,25,40 Clinically, these masses are frequently found incidentally on imaging, or result in an emergency due to hemoabdomen.7,9,10,24,25 In both situations, surgical removal of the spleen is common.7,23 However, if there is significant blood loss and possible anemia in cases with a hemoabdomen, surgery poses a greater risk. 23 In cases with hemoabdomen, a point-of-care diagnostic test to accurately identify the type of mass could influence the clinical decision between pursuing surgery or electing euthanasia. 23 Numerous studies have evaluated clinical and imaging parameters that help determine whether a splenic mass is benign or malignant, but histology remains the gold standard, especially for solitary splenic masses.6,9,10,21,24,33
Even with histology, it can be challenging to obtain an accurate diagnosis for a splenic mass. Large masses may be predominantly composed of hemorrhage and hematoma formation, and in HSA, only a small percentage may be actual neoplastic tissue. In rare instances, dogs diagnosed with a benign splenic mass, later developed metastatic disease, demonstrating that an initial histologic diagnosis may not always be accurate.23,26 Based on the Monte Carlo simulations, 1 study found that 5 sections from a splenic mass obtained by a trained trimmer had a 95% chance of diagnosing HSA if it was present. 17 There are several limitations to practically implementing this study’s findings, including that the entire spleen may not be submitted for processing, and both the size of the mass and the experience of the trimmer may vary. 17 Finally, depending on the diagnostic laboratory, the number of sections may increase the cost to the client and/or use laboratory resources unnecessarily. A concurrent diagnostic test to increase the confidence in a diagnosis could improve outcome and treatment protocols.
With a diagnosis of HSA, early stage cases have a better prognosis compared to those with metastatic disease. 40 The median age of dogs presenting with splenic masses, either incidentally or with a hemoabdomen, is at least 10 years.7,10,24,40 The American Animal Hospital Association recommends complete blood cell count and biochemistry be performed every 6 to 12 months for senior dogs. A routine blood screening test for splenic masses that could prompt further investigation would be valuable for early intervention. In all splenic mass cases, early detection could prevent an emergency hemoabdomen, and in the cases of malignancy, allow earlier treatment to hopefully increase the survival time.
MicroRNAs (miRNAs) are small, noncoding molecules of approximately 22 nucleotides in length and are present in all cell types. 15 In both humans and dogs, they can differentiate between multiple tumor types using either tissue or other bodily fluids, such as serum.32,39 Grimes et al 12 investigated the miRNA profile of tissues in a small number of HSAs, nodular hyperplasias, and hematomas (n = 5 per group) in dogs and found that miRNAs could differentiate between them. Grimes et al 13 then quantified miRNAs in serum from normal dogs and those with HSA and hematomas and found 5 miRNAs that could differentiate between those with splenic masses and those without but not between the splenic mass types. A greater number of samples were needed, along with the investigation of other splenic mass types to bolster the utility of miRNAs as a screening and further diagnostic tool in both serum and tissue.
We investigated serum and tissue miRNA expression in dogs, from 2 institutions, with different types of splenic masses and controls (dogs with normal spleens) to determine differential expression. Models were created with multiple miRNAs as a clinically useful diagnostic tool, with a point-of-care and/or screening test in mind.
Materials and Methods
Samples
Samples were acquired from the Ontario Veterinary College Veterinary Biobank and the University of Veterinary Medicine Vienna’s VetCore Facility (VetBiobank). Cases were required to have a splenic mass, which was confirmed by histologic examination and may or may not have had metastatic disease at the time of diagnosis. Information on comorbidities was not consistently available in all cases and so was not considered an exclusion criterion. Patients received care at either the Animal Cancer Center (Ontario Veterinary College, Guelph, Canada) or the University Clinic for Small Animals (University of Veterinary Medicine, Vienna, Austria). For samples obtained from the Ontario Veterinary College Veterinary Biobank, all animal experiments were performed according to the Canadian Council of Animal Care guidelines. This study was approved by the Animal Care Committee of the University of Guelph (AUP#4409), and written consent to collect samples was obtained from owners. For samples from the VetBiobank, material was collected during therapeutic intervention or necropsy with the owners’ written consent. For samples obtained from cases with splenic masses that underwent splenectomy, tissue and/or serum samples were collected either at the time of the surgery or prior to the first administration of chemotherapy (postsplenectomy serum group only). The postsplenectomy serum samples were obtained between 9 and 35 days after splenectomy and were analyzed as an independent subgroup (Table 1). Each diagnosis was by histologic examination of the spleen under routine submission to a diagnostic laboratory supported by board-certified pathologists and/or reviewed by a senior anatomic pathology trainee (LL) to confirm the diagnosis. The number of sections examined and the use of immunohistochemistry were performed at the discretion of the technician, trainee, and/or pathologist responsible for the case and were not standardized. A total of 84 serum samples and 84 tissue samples were analyzed from 8 different mass types and controls (serum from healthy dogs and normal splenic tissue) (Table 1). The HSA-serum group only encompasses cases in which serum was obtained prior to splenectomy surgery. All cases in the nonangiomatous, nonlymphomatous sarcoma group (referred to as sarcoma NOS [not otherwise specified]) were confirmed by histologic appearance and/or immunohistochemistry results incompatible with HSA (eg, CD31 negative). Histology of a piece of tissue adjacent to the sample used was available in 79 of 84 cases (Supplemental Table S1). Normal serum samples were obtained from patients with no history of a splenic mass or any other malignancy at the time of collection. Normal tissue samples of spleen were all collected at postmortem examination and were grossly and histologically free of disease. These animals died or were euthanized due to diseases other than a primary splenic malignancy. All tissue samples were collected within 24 hours of splenectomy or euthanasia and preserved in RNAlater Stabilization Solution (RNAlater; Thermo Fisher Scientific, Waltham, Massachusetts). Tissue and serum samples were stored at −80°C prior to use.
Number of serum and tissue samples per mass type or controls.
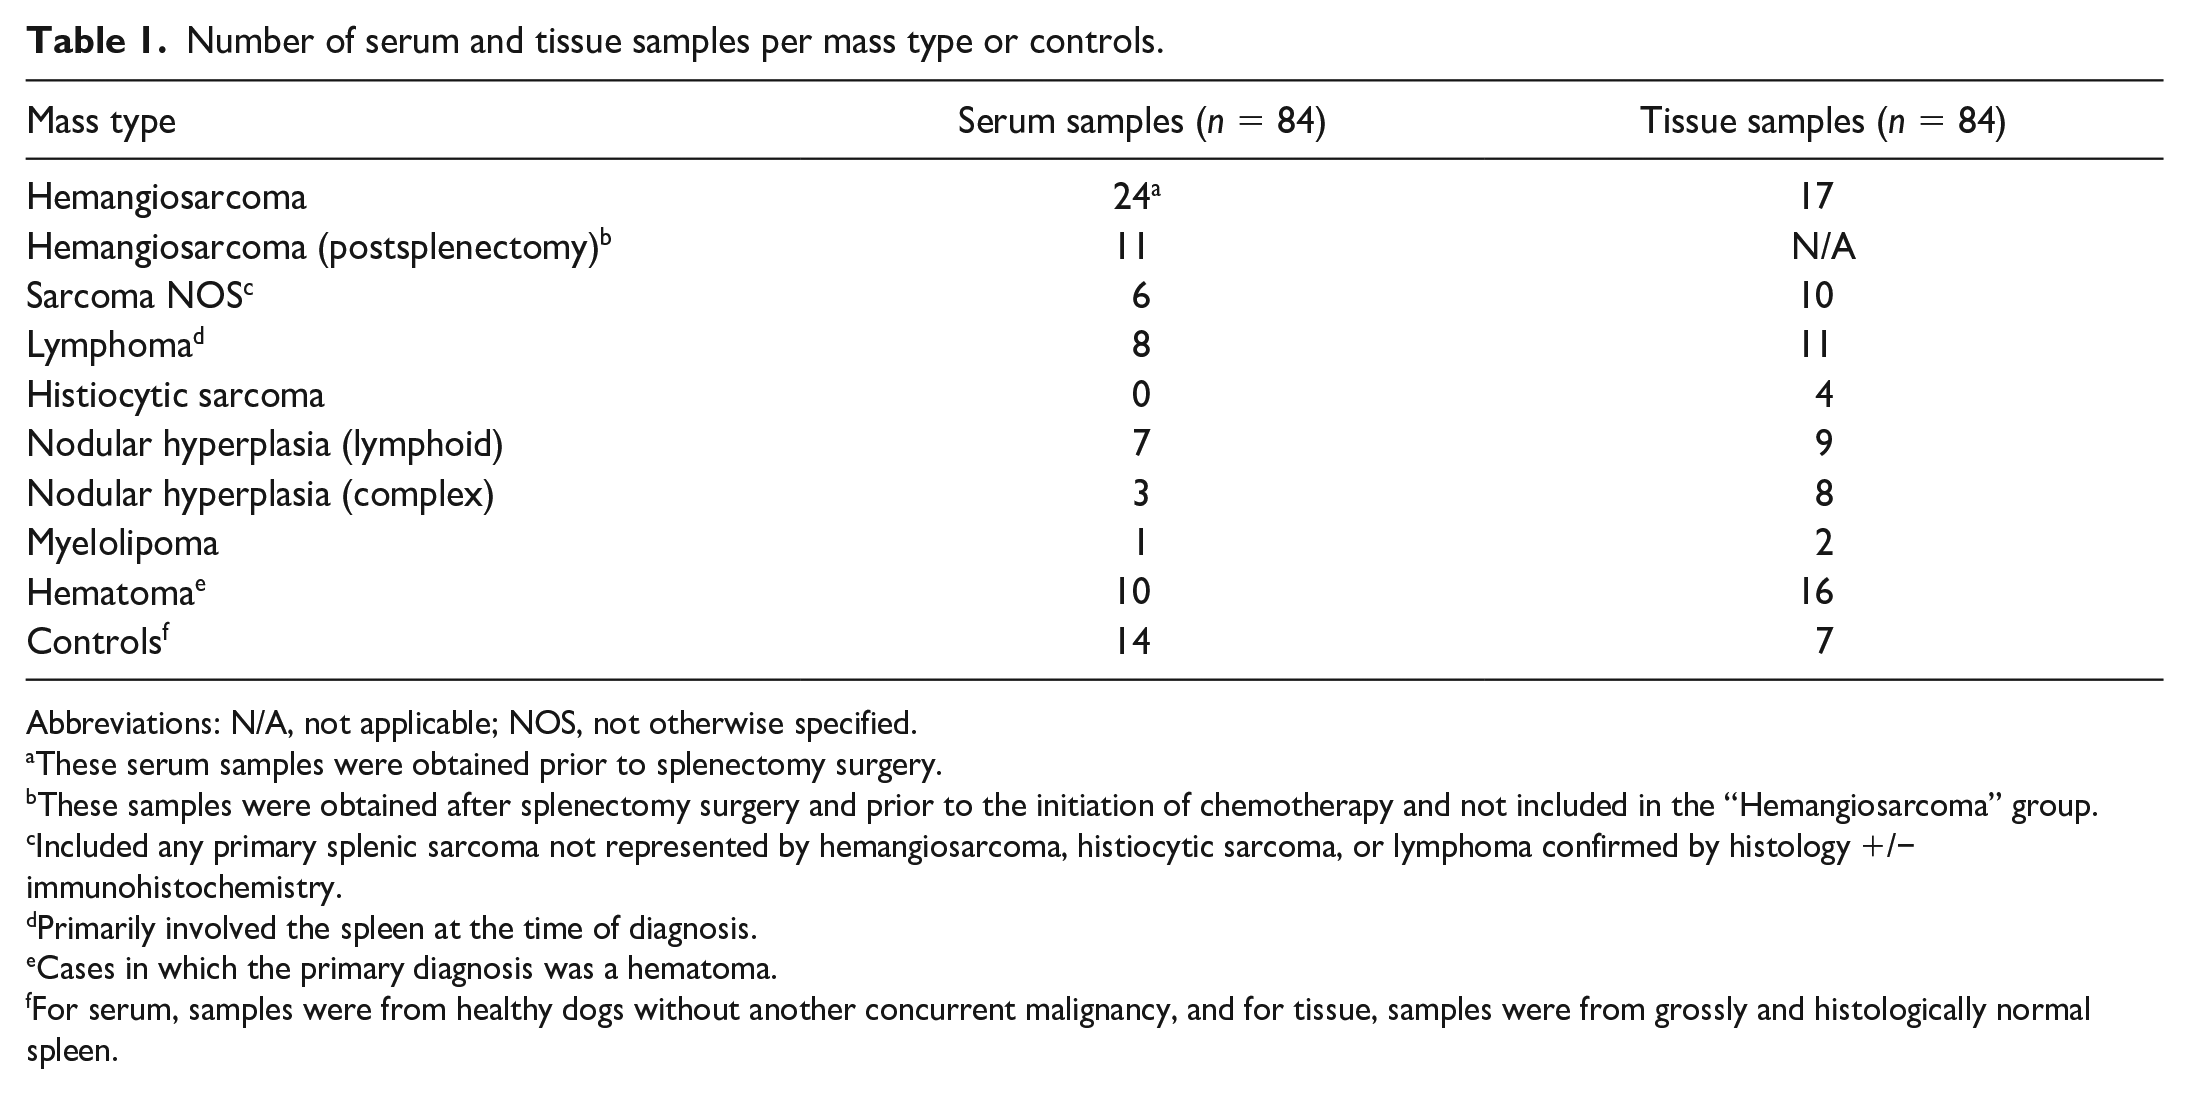
Abbreviations: N/A, not applicable; NOS, not otherwise specified.
These serum samples were obtained prior to splenectomy surgery.
These samples were obtained after splenectomy surgery and prior to the initiation of chemotherapy and not included in the “Hemangiosarcoma” group.
Included any primary splenic sarcoma not represented by hemangiosarcoma, histiocytic sarcoma, or lymphoma confirmed by histology +/− immunohistochemistry.
Primarily involved the spleen at the time of diagnosis.
Cases in which the primary diagnosis was a hematoma.
For serum, samples were from healthy dogs without another concurrent malignancy, and for tissue, samples were from grossly and histologically normal spleen.
MicroRNA Isolation
Small RNAs were isolated from 11.6 to 17.4 mg of RNAlater-preserved tissues using the QIAGEN miRNeasy Tissue/Cell Advanced Mini Kit. A 1:50 working buffer was made by adding 2 M dithiothreitol (0.154 g dithiothreitol in 0.5 ml RNase-free water) to Buffer RLT. Each sample was placed in a tube with 260 µl of the working buffer and a stainless-steel bead and underwent tissue homogenization at 30 Hz for 4 minutes using the TissueLyser II (QIAGEN, Hilden, Germany). The bead was removed, and the lysate was centrifuged for 3 minutes at 14 500 rpm (Eppendorf MiniSpin centrifuge). The supernatant was placed into a new tube without disturbing the pellet. The remaining steps followed the manufacturer’s protocol. Fifty microliters of RNase-free water were spun through the column into a new tube for storage at −80°C. Two microliters of the miRNA isolate were used to quantify the RNA concentration and assess purity (260 nm/280 nm and 260 nm/230 nm ratios) using the NanoDrop 2000 (Thermo Scientific, Supplemental Table S1). The 260 nm/280 nm ratio was >1.85 in 81 of 84 samples, and the 260 nm/230 nm ratios were variable across samples (0.04 to 2.07). Twenty-eight samples had a 260 nm/230 nm ratio <1.5, with the HSA and hematoma groups having the most samples below this threshold. As there is no established cut-off in the literature, all samples were considered to have passed quality assessment for downstream experiments. The Qubit microRNA Assay Kit with the Qubit 2.0 Fluorometer (Invitrogen, Waltham, Massachusetts) was also used to quantify the miRNA concentration; however, many samples were above the detection threshold, and as such, the NanoDrop 2000 concentration values (Supplemental Table S1) were used for the reverse-transcription input.
For the serum samples, a standard input of 200 µl of the sample was used to isolate small RNA species with the QIAGEN miRNeasy Serum/Plasma Advanced Kit. All steps were performed at room temperature. Specifically, 60 µl of Buffer RPL was added to the sample and vortexed before letting stand for 3 minutes. The miRNeasy Spike-in Control (cel-miR-39) working solution (1.6 × 10⁸ copies/µl; 3.5 µl) was added to each sample, followed by 20 µl of Buffer RPP prior to vortexing for at least 20 seconds and incubated for 3 minutes. The remainder of the steps followed the manufacturer’s protocol. At the final step, 15 µl of RNase-free water was added to the center of the spin column, followed by a 1-minute incubation before centrifugation (Eppendorf MiniSpin) at 14 500 rpm for 1 minute in the storage tube. Following isolation, 2 µl was used to quantify the miRNA concentration with the Qubit microRNA Assay Kit with the Qubit 2.0 Fluorometer (Invitrogen) (Supplemental Table S2). As the 260 nm/280 nm and 260 nm/230 nm ratios are not reliable at low concentrations, the samples were not assessed with the NanoDrop 2000. All isolates were stored at −80°C prior to use.
Hemolysis Assessment in Serum Samples
Prior to isolation, each serum sample was analyzed for hemolysis using the NanoDrop 2000 to assess the UV absorbance at 414 nm (Supplemental Table S2). Lipemic samples were corrected by measuring the absorbance at 385 nm and generating a hemolysis score as previously described. 3 To further assess the possible impact of hemolysis on individual miRNA expression, 2 statistical analyses were performed. First, the cycle threshold (Ct) values of individual miRNAs were plotted for each sample against their 414 nm absorbance. The relationship between a hemolysis-affected miRNA and their Ct values is typically linear; therefore, a linear trendline was estimated, and an R2 value was calculated. 19 To account for samples potentially affected by lipemia, the Ct values for each miRNA were also plotted against their hemolysis score, described above, and an R2 value was calculated. 3
Reverse-Transcription Polymerase Chain Reaction
For the tissue samples, each miRNA isolate was diluted to 5 ng/µl in nuclease-free water using 2 µl of the miRNA isolate stock based on the NanoDrop 2000 concentrations, and 10 ng of template RNA (2 µl of the 5 ng/µl dilution) was used for reverse-transcription polymerase chain reaction (PCR). For the serum samples, a standard input of 0.6 µl was used for reverse-transcription PCR. The QIAGEN miRCURY LNA RT kit was used for all samples following the manufacturer’s protocol to obtain 10 µl of complementary DNA (cDNA). In the C1000 Bio-Rad Thermo Cycler, samples were incubated at 42°C for 60 minutes, 95°C for 5 minutes, and 4°C for at least 5 minutes prior to storage at −20°C overnight. A no-template control was included for each run (6 samples), replacing the sample volume with water.
Target MicroRNA Selection
A pilot study of 5 pooled serum samples was performed using the canine miScript miRNome miRNA arrays (QIAGEN) as described by Craig et al. 8 The pilot study identified miRNAs differentially expressed between HSA and control serum groups and those with robust expression. Three groups of 5 HSA-serum samples (2 non-hemolyzed and 1 hemolyzed) and 3 groups of 5 control serum samples (2 non-hemolyzed and 1 hemolyzed) were analyzed. The samples were selected to represent a range of miRNA concentrations and degrees of hemolysis. Forty microliters of each serum sample were mixed to a final volume of 200 µL prior to miRNA isolation. The miRNA isolates were converted into cDNA by reverse-transcription PCR with the miScript II RT Kit (QIAGEN) using the manufacturer’s protocol. For each group, 1.5 µl of template RNA (miRNA isolate) was added to the reverse-transcription mix. The cDNA solution (20 µl) was diluted with 90 µl of nuclease-free water and stored at −20°C until it was used for real-time quantitative polymerase chain reaction (RT-qPCR). The corresponding miScript SYBR Green kit was used per the manufacturer’s protocol to create a master mix. A Roche LC480 LightCycler set to QIAGEN’s recommended settings was used for RT-qPCR. Ct values were calculated, using the second derivative maximum method, in the LC480 software (release 1.5.1.62 SP3). Based on these results, a total of 59 target miRNAs, with the largest fold-changes between groups, alongside miRNAs previously reported in the literature and controls, were added to the custom miRCURY PCR array design (QIAGEN) (Supplemental Table S3) to be used for the individual samples described above. The same arrays were used for the tissue samples to allow direct comparison between sample types.
Real-Time Quantitative Polymerase Chain Reaction
QIAGEN’s miRCURY SYBR Green kit was used to create a master mix for RT-qPCR. The serum cDNA was diluted to 1:40, and the tissue cDNA was diluted to 1:80 prior to creating the master mix. Each sample’s master mix contained 360 µl of SYBR Green, 288 µl of the diluted cDNA sample, and 72 µl of nuclease-free water. Each plate well (miRCURY LNA miRNA custom PCR array 384-well plate [QIAGEN]) received 10 µl of master mix for its corresponding sample. The Roche LC480 LightCycler was used and set to a reaction volume of 10 µl and SYBR Green I/HRM Dye detection setting. Each PCR array was incubated at 95°C for 2 minutes (ramp rate of 4.8°C/s) followed by 45 cycles of 10 seconds at 95°C (ramp rate of 4.8°C/s) and 60 seconds at 56°C (ramp rate of 2.5°C/s) with a single acquisition at the end of each cycle. Following these 45 cycles, a melting curve analysis was performed from 55 to 95°C (ramp rate of 0.11°C/s) with 5 acquisitions/s. Finally, the array was cooled to 37°C before completion of the protocol. The LC480 software (release 1.5.1.62 SP3) calculated Ct values using the second derivative maximum method.
Quality Assessment of Real-Time Quantitative Polymerase Chain Reaction Results
As per QIAGEN’s recommendations, the UniSp3 inter-plate calibrator was used to correct for potential run differences between PCR arrays. The difference between the average UniSp3 of the no-template control (up to 6 replicates per plate) for each PCR array and the overall average was determined. Each Ct value was subtracted by this difference to get an interplate calibrator-corrected Ct value.
A Ct value cut-off of 35 was employed for all miRNAs and controls. The amplification and melting curves were manually assessed to ensure appropriate Ct determination by the LC480 software. All undetectable Ct values (Ct = 0), those > 35, and those with visually inappropriate amplification curves were changed to equal 35 to provide a conservative Ct determination. All further analyses utilized the interplate calibrator-corrected, conservative Ct values, from now on simply referred to as Ct values. All cel-miR-39-3p and UniSp6 values of samples included in the study were within the average of all samples +/− 2 standard deviations to ensure adequate miRNA isolation and reverse-transcript efficiency. Each sample and miRNA was evaluated for overall expression levels. All samples included in the study had an overall expression of miRNAs within the average of all samples isolated minus 2 standard deviations. MiRNAs that were not expressed in at least 95% of the samples were removed from further analyses. This included 6 miRNAs in the serum group originally included on the custom panels (cbr-miR-124, rno-miR-135a-3p, hsa-miR-193b-5p, cfa-miR-210, hsa-miR-758-3p, and cfa-miR-1837) and 7 miRNAs in the tissue group (rno-miR-135a-3p, hsa-miR-205-5p, hsa-miR-206, cfa-miR-210, gga-miR-216a, cfa-miR-1837, and cfa-miR-1844) originally included on the custom panels.
Statistical Analysis
All statistical analyses utilized the R Statistical Software, v4.2.3 (R Core Team, 2023). 29 The NormFinder R script was used to identify stably expressed miRNAs as endogenous controls for the serum and tissue samples independently. 2 The different mass types and controls were assigned to groups in the NormFinder analysis. MiRNAs included in NormFinder analysis were expressed in all samples (Ct < 35), and those deemed to be associated with hemolysis based on the above analysis were not considered for the serum samples as candidate endogenous controls. As recommended by Vandesompele et al, 38 a minimum of 3 controls were selected, and additional miRNAs were only used if they provided a significant reduction in variability. MiRNAs miR-193a-5p, miR-23b, and miR-502-3p were selected for the serum samples, and miR-140, miR-186-5p, miR-197-3p, and miR-16-5p were selected for tissue samples as endogenous controls based on their stability. Tissue samples used 4 miRNAs as endogenous controls, as the fourth miRNA fulfilled the criteria of a significant reduction in variability previously described. 38 Normalization was performed using the comparative Ct method, in which the Ct values for a miRNA of interest were subtracted from the average Ct values of the endogenous controls. 34 The geometric average was utilized, instead of the arithmetic average, as it is less susceptible to outliers. 38 Normalization was completed on all data simultaneously.
We were unable to assume normality due to a small sample size for each group. A Shapiro-Wilk test confirmed non-normal distribution of 20% of serum miRNAs and 27% of tissue miRNAs, as such nonparametric tests were used. With normalized Ct values (∆Ct), the Wilcoxon rank-sum exact test was performed, and a P-value of <.05 was considered statistically significant. This test was repeated for each miRNA, comparing each group (as defined in Table 2) independently to one another. In addition, the Benjamini–Hochberg procedure was used to correct for multiple comparisons and determine a false discovery rate-adjusted P-value, which was considered statistically significant if <.05. 5 Fold-changes were calculated using 2-∆∆Ct, where ∆∆Ct is the median ∆Ct for an miRNA of interest in 1 group subtracted from the ∆Ct of the second group, and the median was used for each miRNA. Fold-difference values were equivalent to fold-change values if ≥1, whereas negative fold-differences equal the negative inverse of the reported fold-change (values <1).
Number of statistically significant differentially expressed miRNAs in serum (presplenectomy) and tissue from dogs with hemangiosarcoma (HSA) compared to the other groups. a
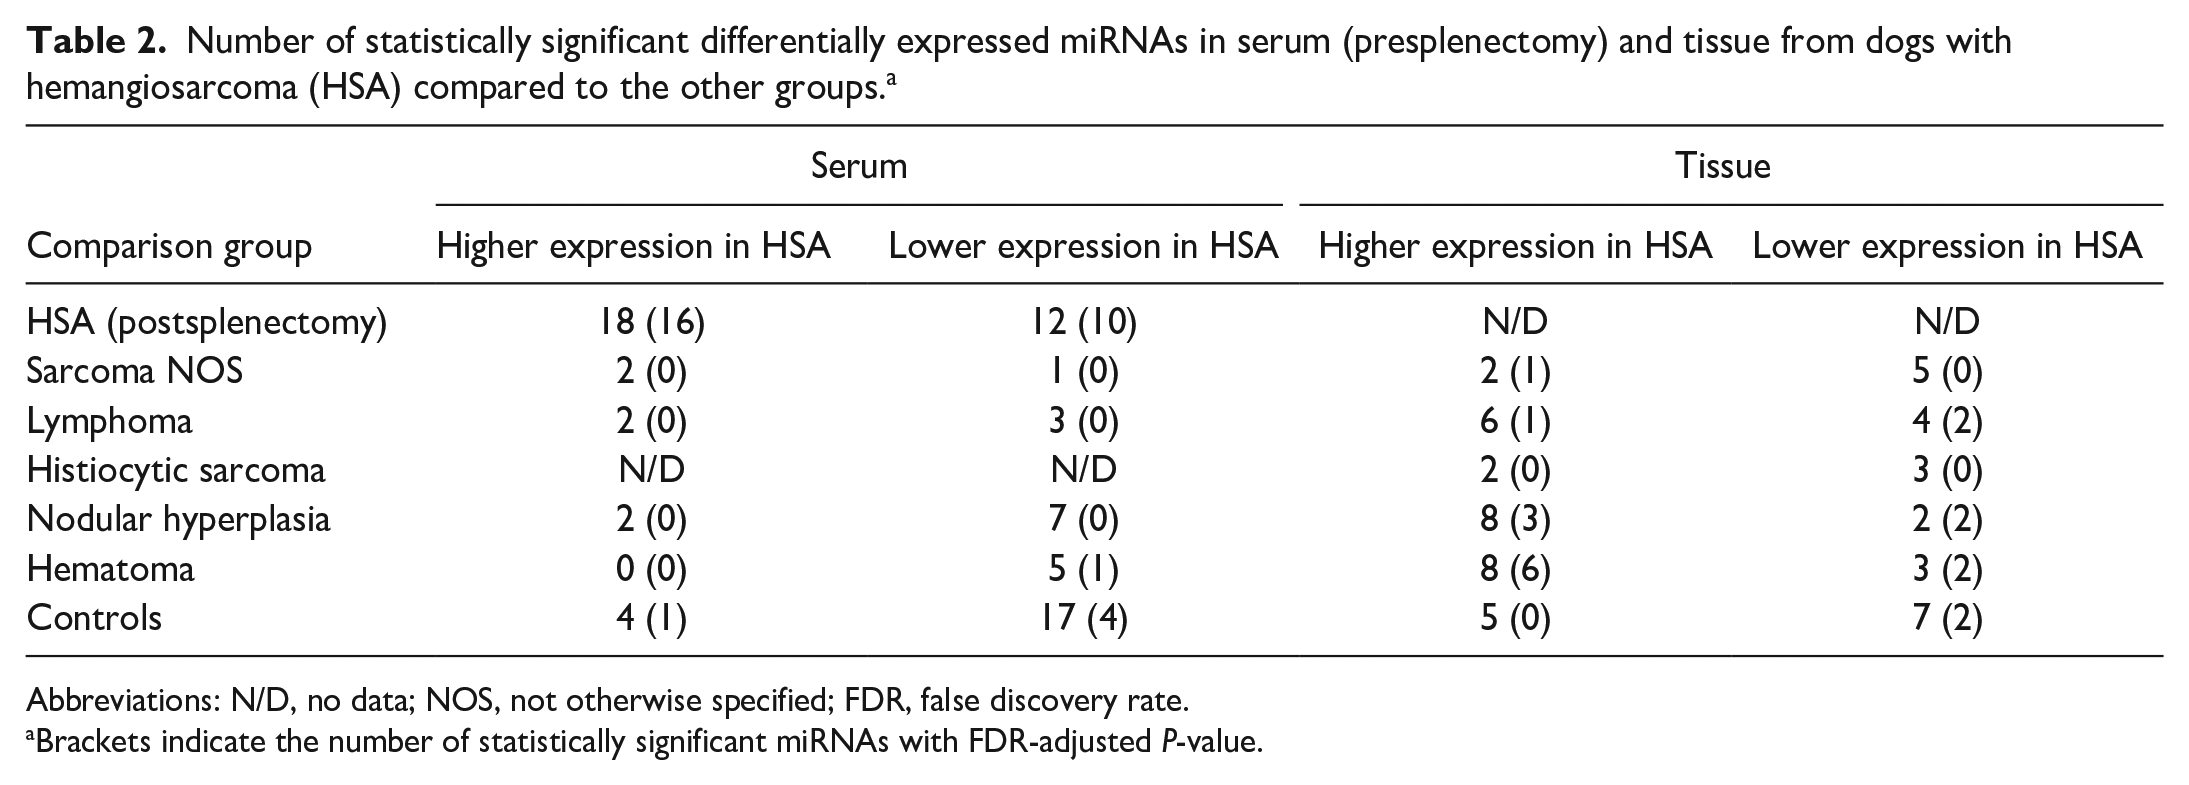
Abbreviations: N/D, no data; NOS, not otherwise specified; FDR, false discovery rate.
Brackets indicate the number of statistically significant miRNAs with FDR-adjusted P-value.
For both serum and tissue samples independently, decision trees were created to classify samples into specific groups to differentiate them from HSA samples (“positive class”) and assess the diagnostic potential of an miRNA signature. In our models, cases diagnosed as nodular hyperplasia (complex and lymphoid), hematoma, and myelolipoma were grouped as “benign splenic masses.” MiRNAs determined to likely be associated with hemolysis were not included in the models for serum samples. Using the rpart package, decisions trees were grown unrestricted, allowing all miRNAs to be considered as variables. 36 A cost matrix was applied, making a misclassification of an HSA sample as 3× as “costly” compared to any other misclassification. Therefore, correct classification of HSA samples was favored while growing the initial trees. To avoid overfitting within this population, the trees were pruned by selecting the complexity parameter that corresponds to the smallest tree within 1 standard error of the minimum cross-validation error rate. The pROC package was used to create receiver operating characteristic (ROC) curves, and accuracy, precision, and recall metrics were calculated with HSA considered to be the “positive class.” 31
Results
The full demographic information for dogs from which the serum and tissue samples were collected, including breed, age, and sex, is available in Supplemental Tables S4 and S5. Mixed-breed dogs were the most common in all categories except for histiocytic sarcoma and myelolipoma tissue samples, which were composed of single cases in the breeds represented. For the serum samples, Portuguese water dogs, German shepherds, golden retrievers, beagles, and Labrador retrievers were represented by more than 1 dog in at least one of the groups. For the tissue samples, German shepherds, golden retrievers, and Labrador retrievers were represented by more than 1 dog in at least one of the groups. The average age per group in the serum samples ranged from 8.3- to 10.5-years-old at diagnosis, with the controls representing the youngest group and lymphoma representing the oldest group. A single dog, which was 14-years-old at the time of diagnosis, represented the myelolipoma group. The average age per group in the tissue samples ranged from 8.6- to 12-years-old at diagnosis, with the normal dogs representing the youngest group, and myelolipoma representing the oldest group; however, this group was only composed of 2 dogs. Male castrated, followed by female spayed, dogs were the most commonly represented in all but the serum lymphoma group, tissue hematoma group, and the serum and tissue myelolipoma groups.
Within the grouped benign splenic masses, 16 of 21 of the serum cases and 27 of 35 of the tissue cases had at least 6 months of clinical follow-up in which they did not develop a metastasis related to a splenic malignancy. The remaining 5 serum cases had clinical follow-up of less than 3 weeks, none of which were known to have another malignancy at the time of sample collection. The remaining 8 tissue cases also had clinical follow-up of less than 3 weeks, one of which was euthanized related to ascites within a week after surgical removal of the spleen. Eleven of 14 normal cases had at least 1 year of clinical follow-up, 1 case was euthanized within 2 months of collection due to myelodysplastic syndrome, 1 patient was lost to follow-up after 9 months, and 1 patient was lost to follow-up after 1 month. Eleven of 14 normal cases had a known cause of death unrelated to a malignant neoplasm.
MiR-16-5p and miR-451a are known to be present in abundance in erythrocytes and are associated with hemolysis.20,28 Their relationship (R2 value) with 414 nm UV-absorbance and hemolysis scores were utilized as baseline measures to compare the potential relationship of other miRNAs with hemolysis in this study (Supplemental Table S6). Their R2 values for Ct values and 414 nm UV-absorbance were 0.49 for miR-451a and 0.42 for miR-16-5p, and both were statistically significant (P < .05; Supplemental Fig. S1a, b). Their R2 values for Ct values and hemolysis scores were 0.47 for miR-451a and 0.42 for miR-16-5p, which were also statistically significant. Those with an R2 value equal to or higher than that of miR-16-5p (0.42) were confidently deemed to be associated with hemolysis. These included miR-15b, miR-25-3p, miR-190b (Supplemental Fig. S1c), miR-197-3p, and miR-505-5p (Supplemental Table S6). In addition, miR-19a-3p, miR-30e-3p, miR-140, miR-152-3p, miR-186-5p, miR-191, miR-301b, and miR-320a had R2 values greater than 0.35, and so their expression is highly suspected to also have a linear relationship with hemolysis (Supplemental Table S6). MiR-21-5p is not associated with hemolysis in the literature.1,19 This miRNA had an R2 value of 0.26 and 0.29 for the Ct value comparison to the 414 nm UV-absorbance and hemolysis score, respectively. Thus, any miRNAs with an R2 value less than 0.26 were considered unlikely to be associated with hemolysis. Twenty-six miRNAs investigated had R2 values for both evaluations equal to or less than 0.26, which supports that these miRNAs are unlikely to have a linear relationship with hemolysis (Supplemental Table S6). Some of these were due to low expression across most samples, whereas others such as miR-133-3p had variable expression across samples unrelated to hemolysis (Supplemental Fig. 1d and Supplemental Table S6).
In both serum and tissue samples, each comparison group had differentially expressed miRNAs when compared to serum or tissue from dogs within the HSA group (range: 3 to 30 total differentially expressed miRNAs per group; Table 2). For the serum samples, the postsplenectomy HSA group (30 miRNAs), followed by the control group (21 miRNAs) had the greatest number of differentially expressed miRNAs compared to the presplenectomy HSA group. In the tissue samples, the control group (12 miRNAs) had the greatest number of differentially expressed miRNAs compared to the HSA group. In postsplenectomy HSA serum, sarcoma NOS serum, lymphoma tissue, nodular hyperplasia tissue, and hematoma tissue groups, most miRNAs had lower expression compared with the HSA group. When the multiple comparisons test was applied, some of these miRNAs were no longer considered statistically significant (Table 2).
In HSA serum, 4 miRNAs had increased expression and 17 miRNAs had decreased expression compared to controls (Table 2). Seven miRNAs had a median fold-difference > 2 or < −2 (Table 3). MiR-135a-5p (Fig. 1; Table 3) had lower expression in HSA samples compared to all other groups (median fold-difference range = −3.20 to −9.13) except for the sarcoma NOS group. Serum samples from all benign masses together (nodular hyperplasia, hematomas, and myelolipoma; n = 21) were compared to HSA-serum samples (data not shown). One miRNA (miR-130a-5p) had increased expression and 7 miRNAs (miR-135a-3p, miR-191, miR-19a-3p, miR-197-3p, miR-15b, miR-26a-5p, and miR-181a) had decreased expression in HSA-serum samples compared to the benign mass serum samples (P < .05). Only miR-135a-5p and miR-130a-3p had a median fold-difference > 2 or < −2 between these 2 groups. Both presplenectomy (n = 24) and postsplenectomy (n = 11; non-matched) HSA-serum samples were available. Eighteen miRNAs had increased expression, and 12 miRNAs had decreased expression in the presplenectomy compared to the postsplenectomy HSA-serum groups (Table 2). Twenty of these 30 dysregulated miRNAs had a median fold-difference > 2 or < −2. MiR-135a-5p had the greatest median fold-difference of 9.13 and was upregulated in the postsplenectomy HSA group compared to the presplenectomy HSA group. With the application of the multiple comparisons test, some of these miRNAs lost statistical significance (Table 3).
Fold-change of significantly different miRNAs in serum from dogs with hemangiosarcoma (HSA) (presplenectomy) compared to the other groups with a median fold-difference > 2 or < −2. a
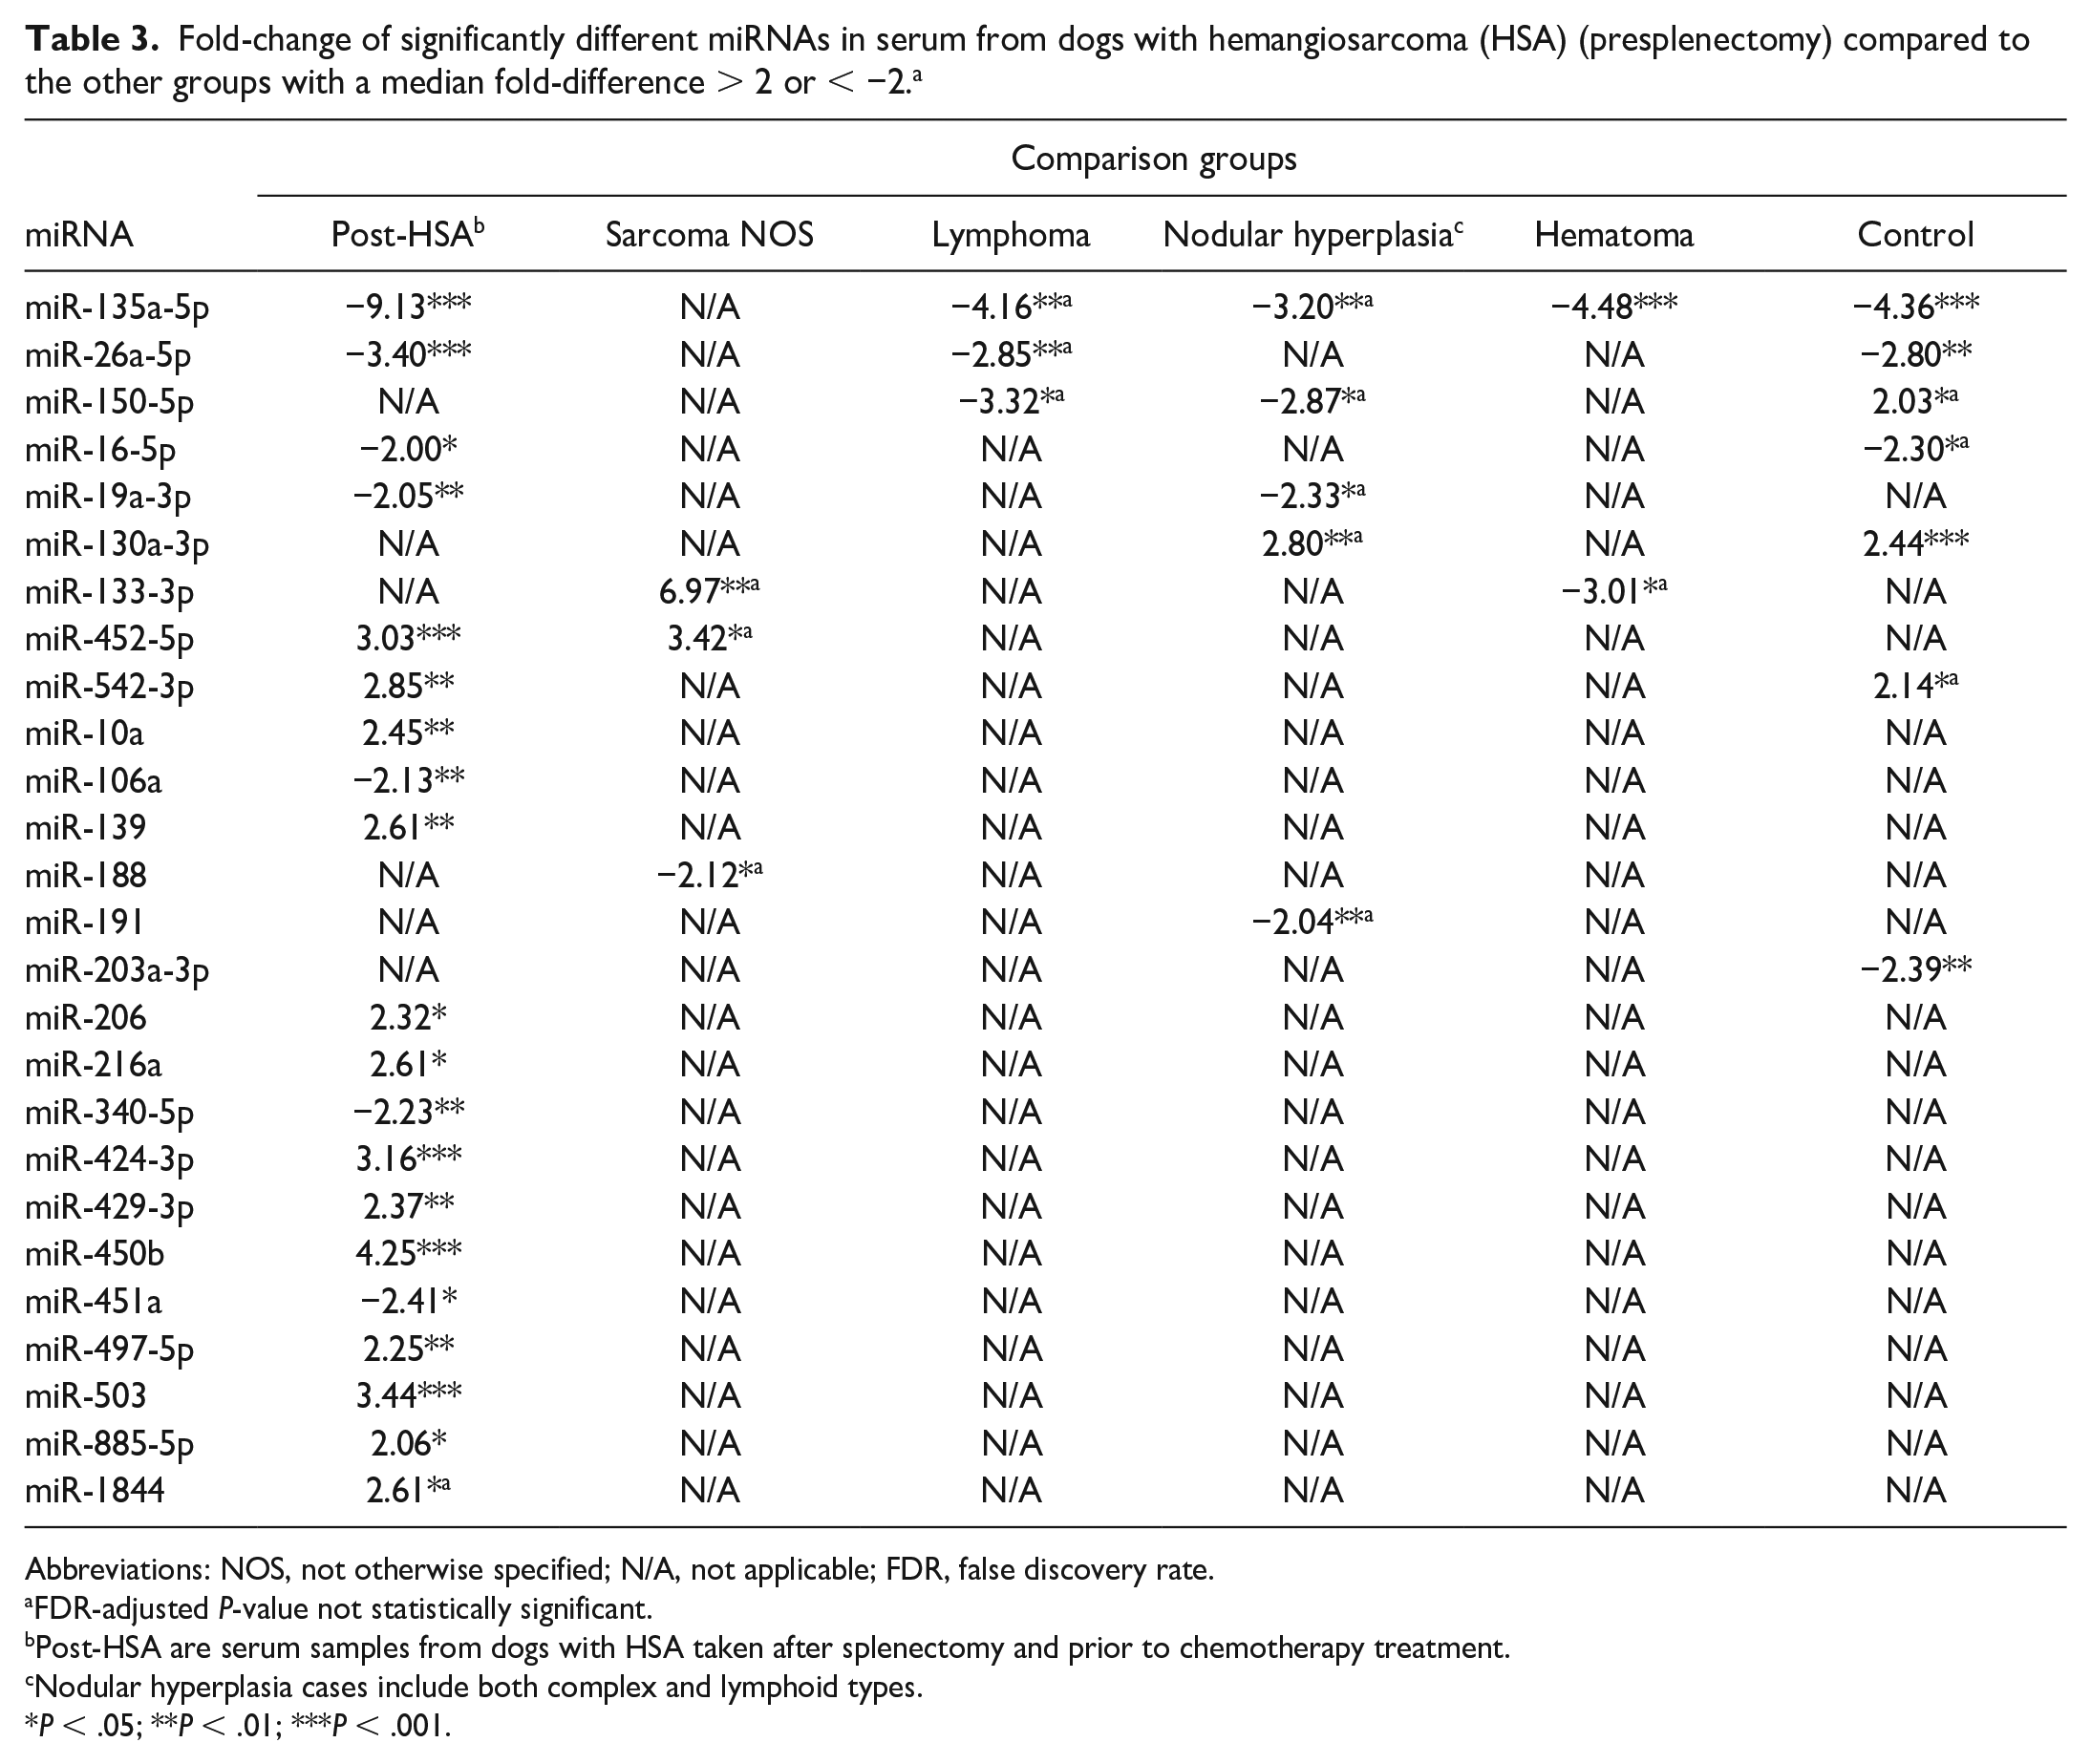
Abbreviations: NOS, not otherwise specified; N/A, not applicable; FDR, false discovery rate.
FDR-adjusted P-value not statistically significant.
Post-HSA are serum samples from dogs with HSA taken after splenectomy and prior to chemotherapy treatment.
Nodular hyperplasia cases include both complex and lymphoid types.
P < .05; **P < .01; ***P < .001.
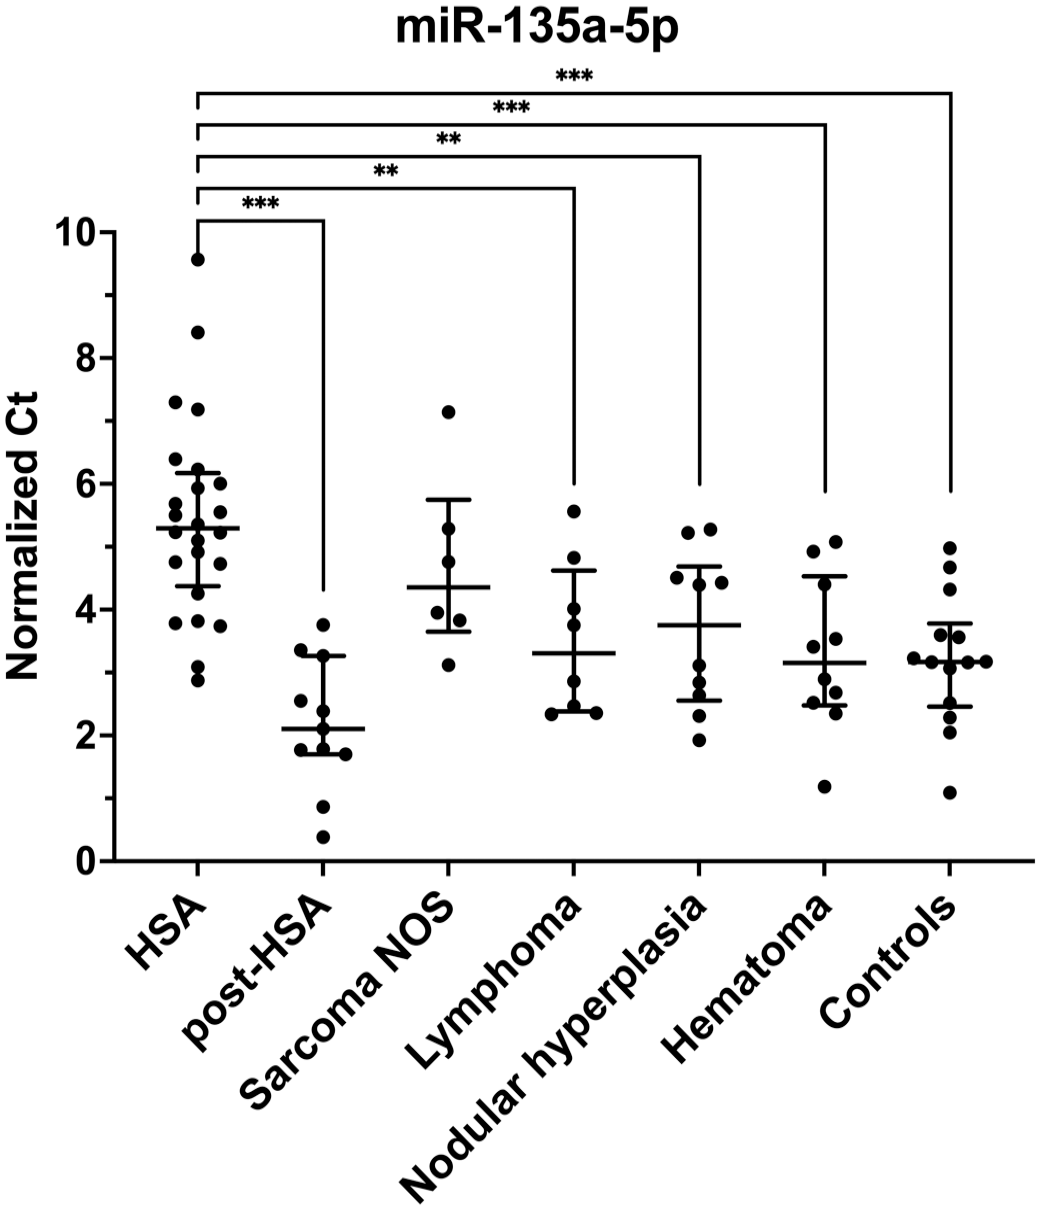
MiR-135a-5p has higher expression (lower Ct) in the serum of all groups except the sarcoma NOS group compared to hemangiosarcoma (HSA) serum. Normalized Ct values for each sample within its respective group. Bar and lines represent the median with interquartile range. Non-adjusted P-values; **P < .01; ***P < .001. NOS, not otherwise specified.
In HSA tissue, 5 miRNAs had increased expression and 7 miRNAs had decreased expression compared to normal splenic tissue (Tables 2 and 4). Lymphoma, nodular hyperplasia, hematomas, and normal spleens all had higher expression of miR-150-5p compared to the HSA tissue (Fig. 2a and Table 4). MiR-126-5p had increased expression in HSA compared to other sarcomas, lymphoma, nodular hyperplasia, and hematoma groups (fold-difference range = 2.95-5.72; Fig. 2b and Table 4). MiR-451a (fold-difference = 31.33) and miR-126-5p (fold-difference = 5.72) had higher expression in HSA tissues compared to other sarcoma tissues (Table 4). MiR-451a also had the highest fold-difference when comparing the HSA group to the histiocytic sarcoma (fold-difference = 34.38) and lymphoma groups (fold-difference = 8.50). The benign mass tissue group (n = 35), including nodular hyperplasia, hematoma, and myelolipoma, was compared to HSA tissue samples (data not shown). Nine miRNAs had increased expression (miR-542-3p, miR-126-5p, miR-503, miR-23a, miR-450a, miR-320a, miR-450b, miR-365a-3p, miR-23b) and 2 miRNAs had decreased expression (miR-150-5p, miR-191) in HSA tissue samples compared to the benign mass tissue samples (P < .05). MiR-150-5p, miR-542-3p, miR-126-5p, miR-503, miR-23a, and miR-450a had a median fold-difference > 2 or < −2. With the application of the multiple comparisons test, some of these miRNAs lost statistical significance (Table 4).
Fold-change of statistically significant miRNAs in tissue from dogs with hemangiosarcoma (HSA) compared to the other groups with a median fold-difference of > 2 or < −2. a
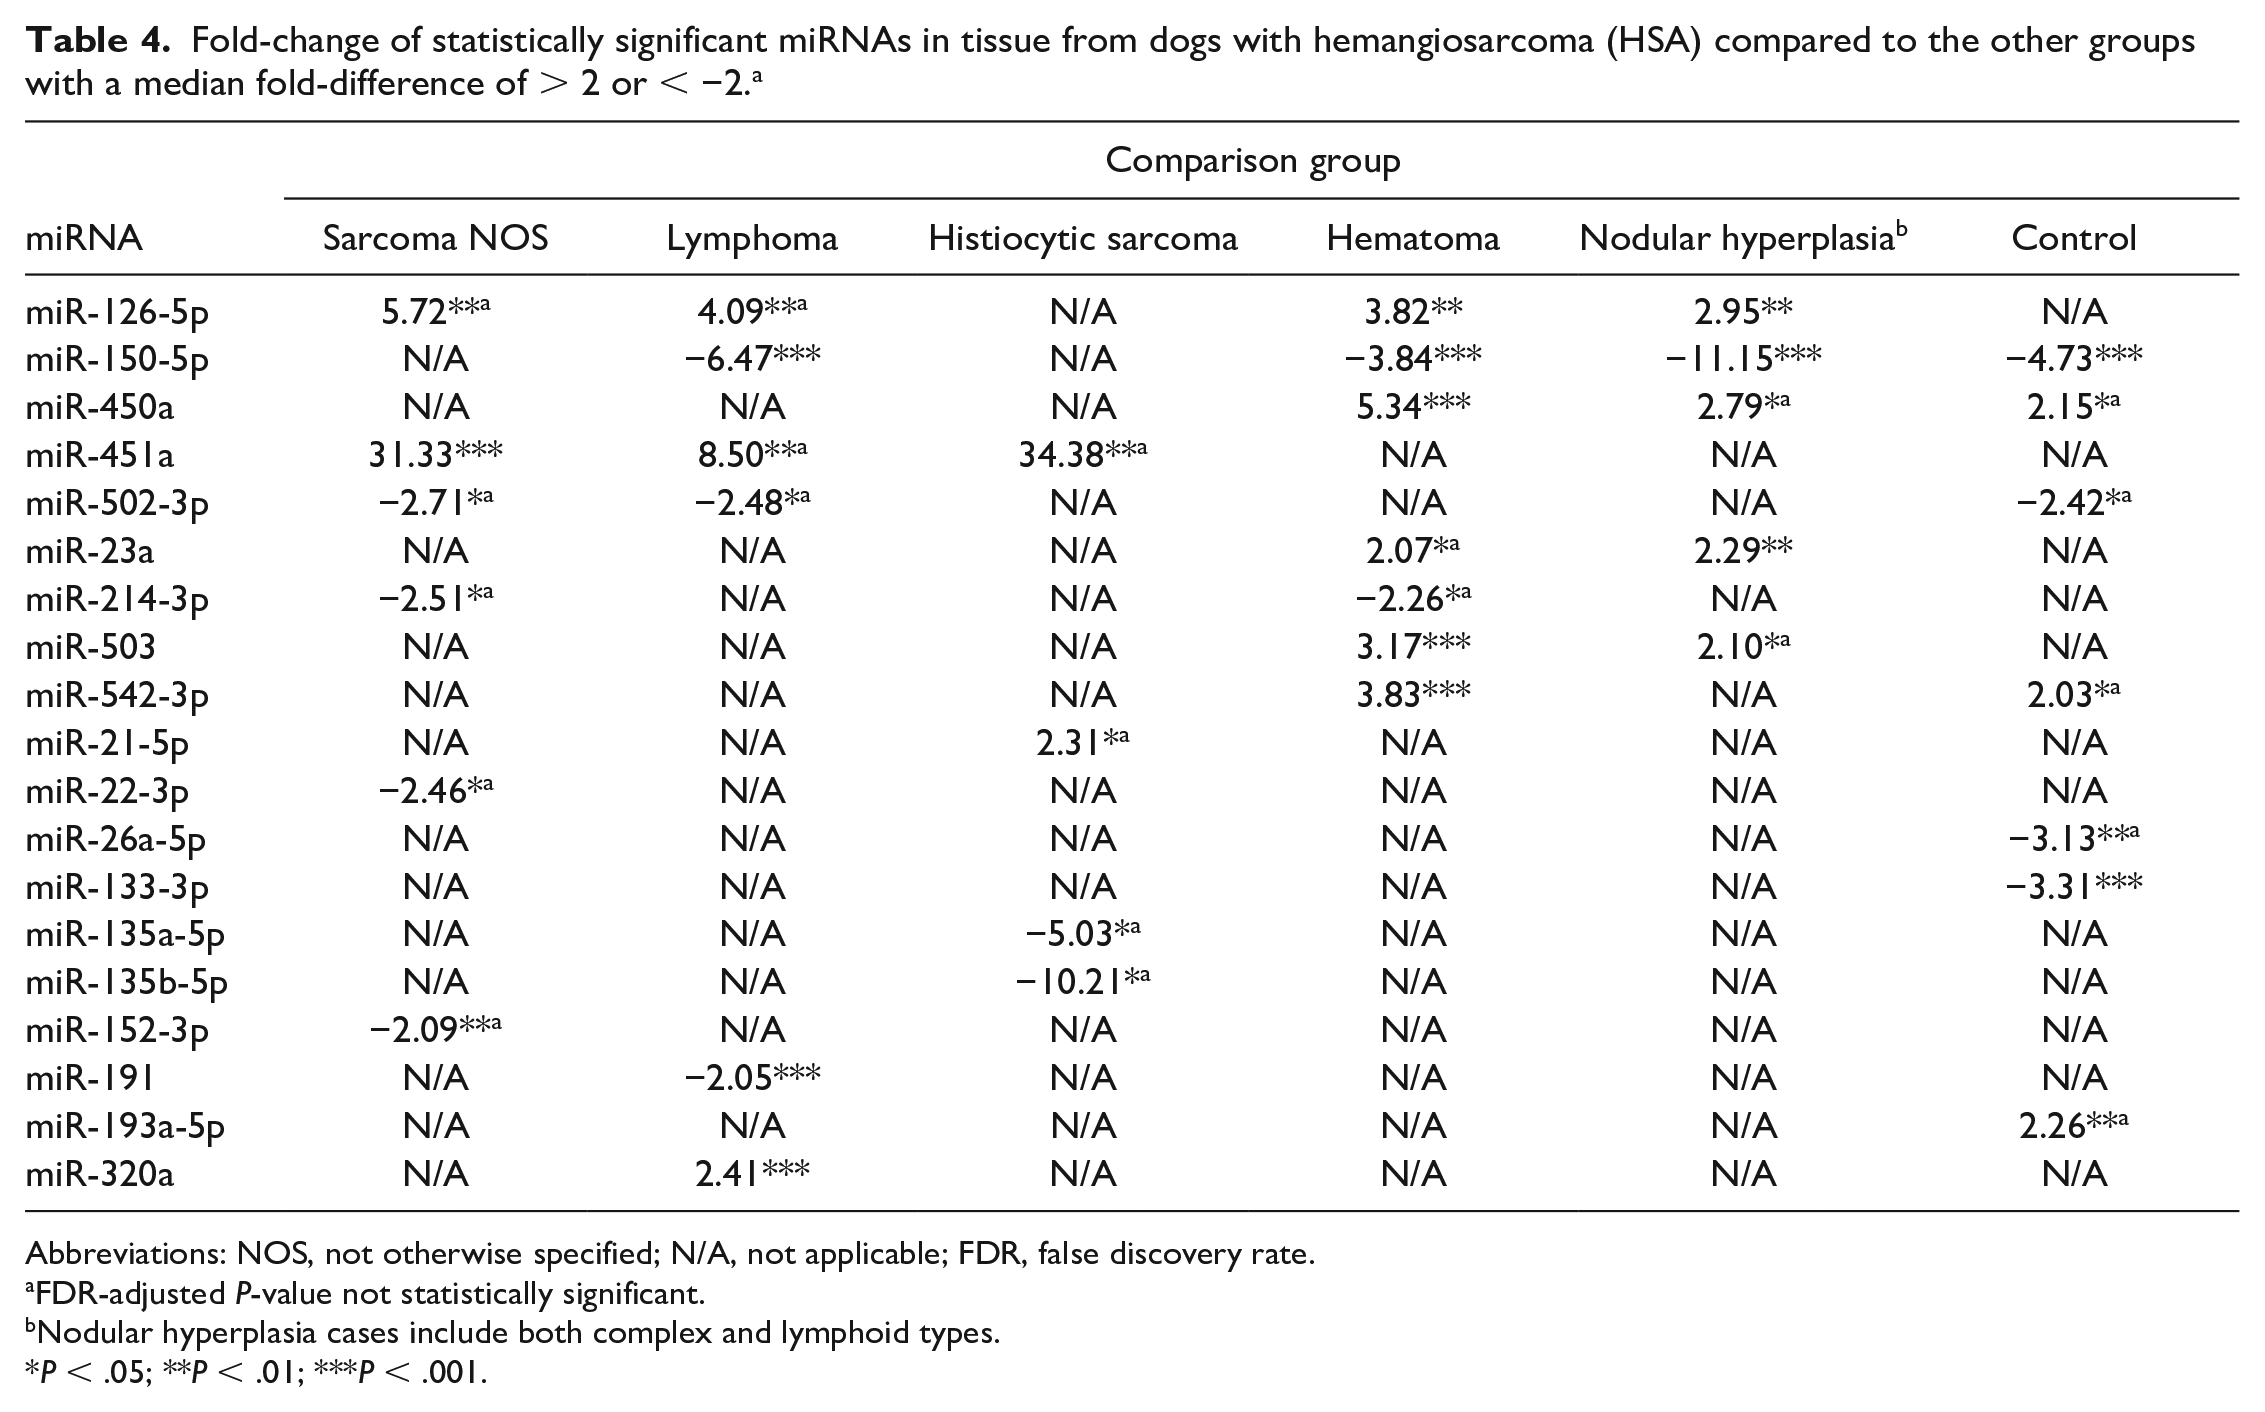
Abbreviations: NOS, not otherwise specified; N/A, not applicable; FDR, false discovery rate.
FDR-adjusted P-value not statistically significant.
Nodular hyperplasia cases include both complex and lymphoid types.
P < .05; **P < .01; ***P < .001.
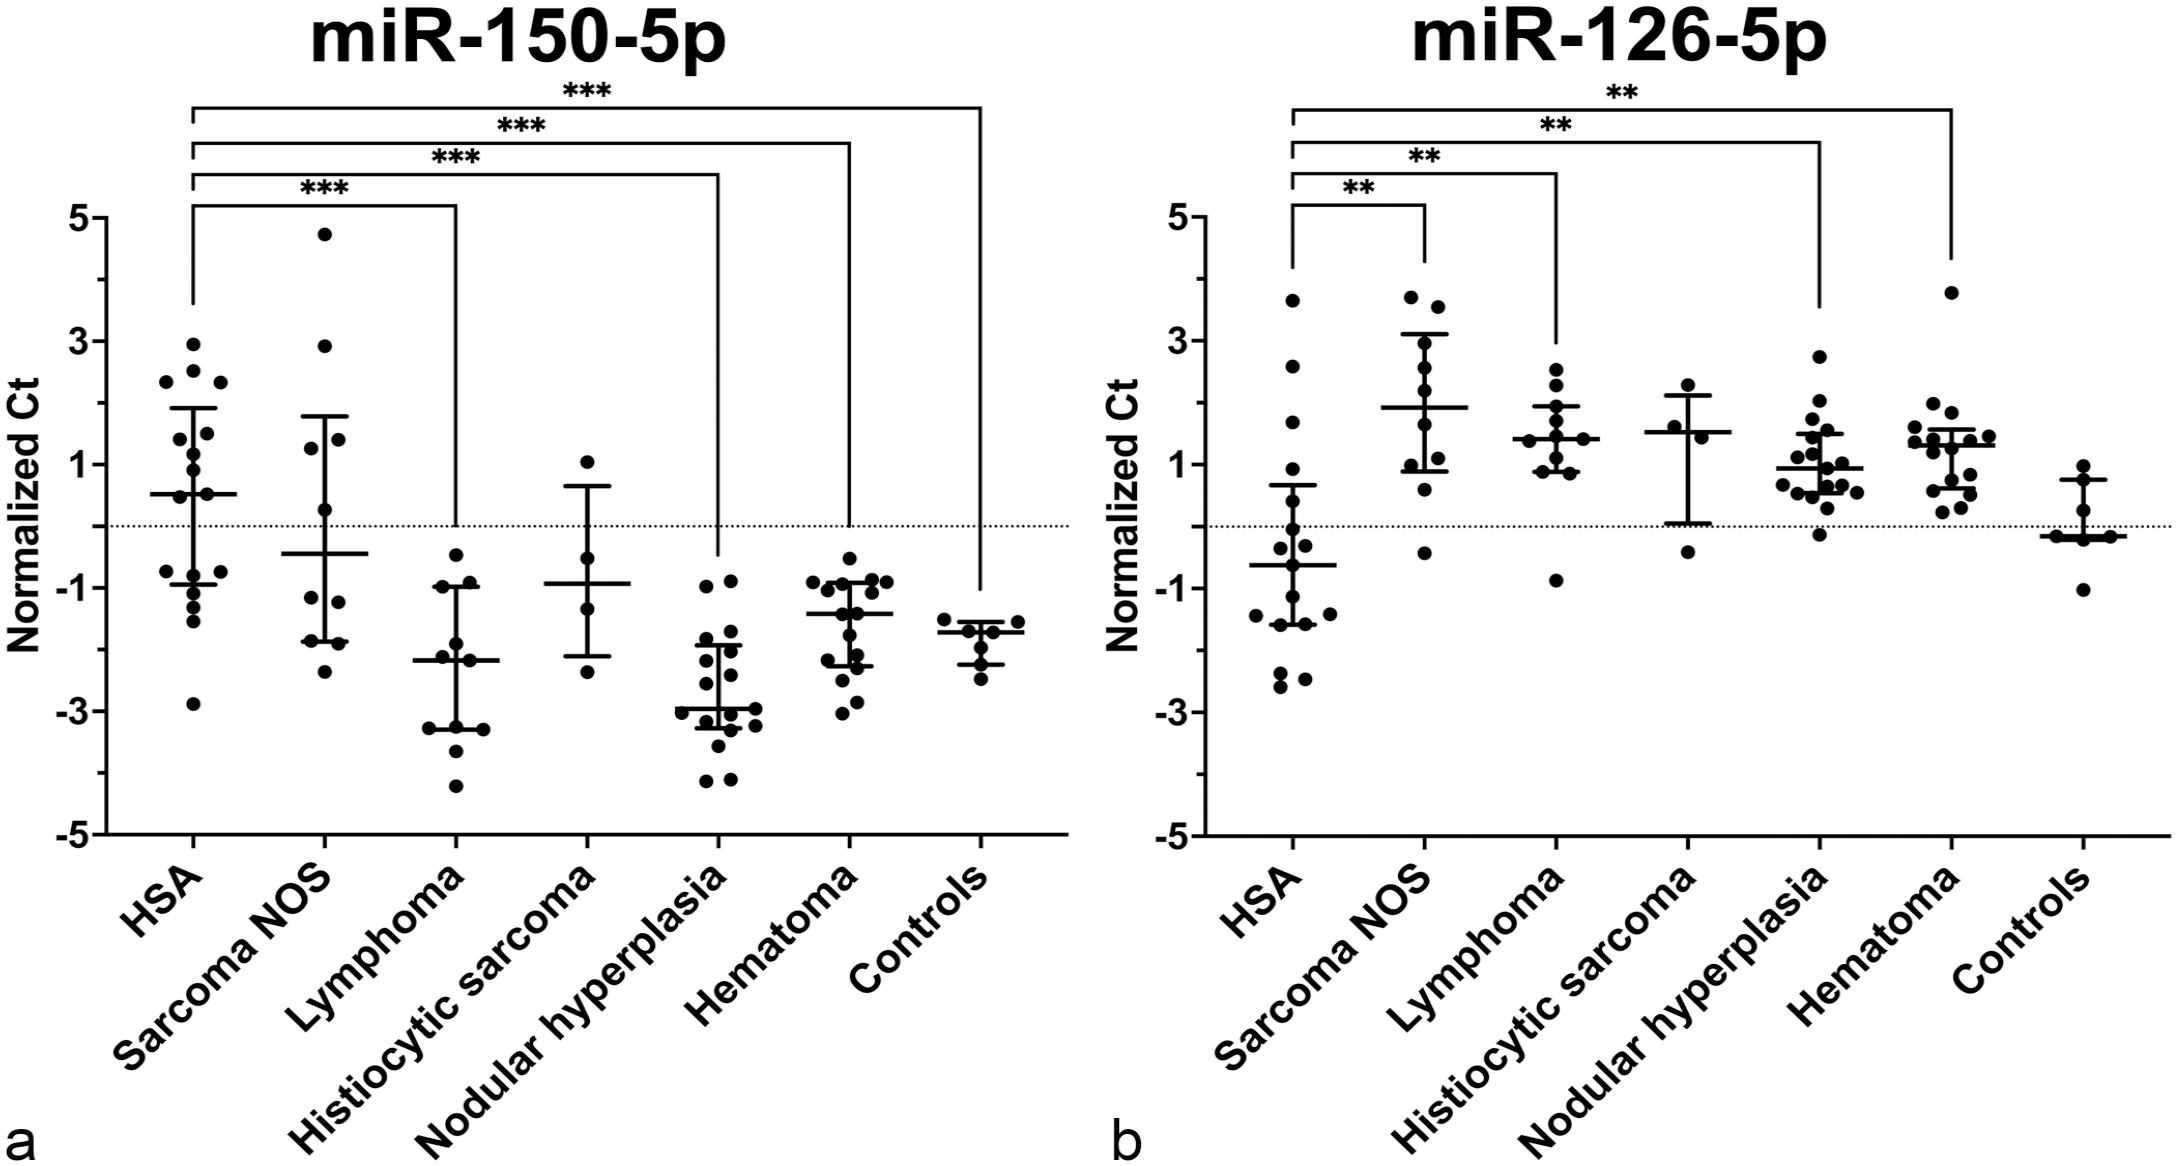
MiRNAs differentially expressed in tissues between each group compared to hemangiosarcoma (HSA). Normalized Ct value for each sample within its respective group. Bar and lines represent median and interquartile range. Dotted line is a value of zero. Non-adjusted P-values; **P < .01; ***P < .001. (a) MiR-150-5p had decreased expression (higher Ct) in HSA tissue compared to lymphoma, nodular hyperplasia, hematoma, and control tissues. (b) MiR-126-5p had increased expression (lower Ct) in HSA tissue compared to sarcoma NOS, lymphoma, nodular hyperplasia, and hematoma tissues. NOS, not otherwise specified.
Multiple miRNA models were investigated for both serum and tissue to differentiate between patients with HSA and other benign splenic masses, as well as controls without splenic masses. The model using serum miRNAs to differentiate between those without a splenic mass (controls), those with a benign splenic mass, and those with HSA, provided an overall accuracy of 0.86 (Fig. 3). Five miRNAs were used in this model: miR-135a-5p, miR-10a, miR-450b, miR-152-3p, and miR-126-5p (Fig. 3a). All HSA samples were captured by the model (recall = 1); however, 6 cases (10%, 6 of 59 total cases) were defined as HSA cases that either did not have a splenic mass (21%, 3/14) or had a benign splenic mass (14%, 3/21). All cases classified as controls were actual controls (precision = 1), but an additional 2 cases without a splenic mass were classified as having a benign splenic mass (recall = 0.64). Overall, the model was best able to separate benign splenic masses from both controls and HSA samples using serum miRNAs (area under the curve [AUC] = 0.811 for controls and 0.929 for HSA samples). When the model decided between only patients with a splenic mass (either a benign splenic mass or HSA), the accuracy was 0.93 with an AUC of 0.929 (Fig. 4). All HSA cases were classified as such (recall = 1), and 3 benign splenic masses were classified as HSA (14%, 3/21) when using miR-135a-5p, miR-10a, miR-152-3p, and miR-19a-3p (Fig. 4a). In both models, miR-135a-5p and miR-10a were the first and second steps (ie, splits in the decision tree), respectively (Figs. 3a and 4a). The tissue model only compared miRNAs in the benign splenic mass group and HSA group (Fig. 5). MiR-126-5p, miR-502-3p, and miR-452-5p used in combination produced an accuracy of 0.96 and AUC of 0.97 (Fig. 5). All HSA tissues were correctly classified (recall = 1), and only 2 benign masses were incorrectly classified (6%, 2/35). This tissue model was superior to the corresponding serum model.
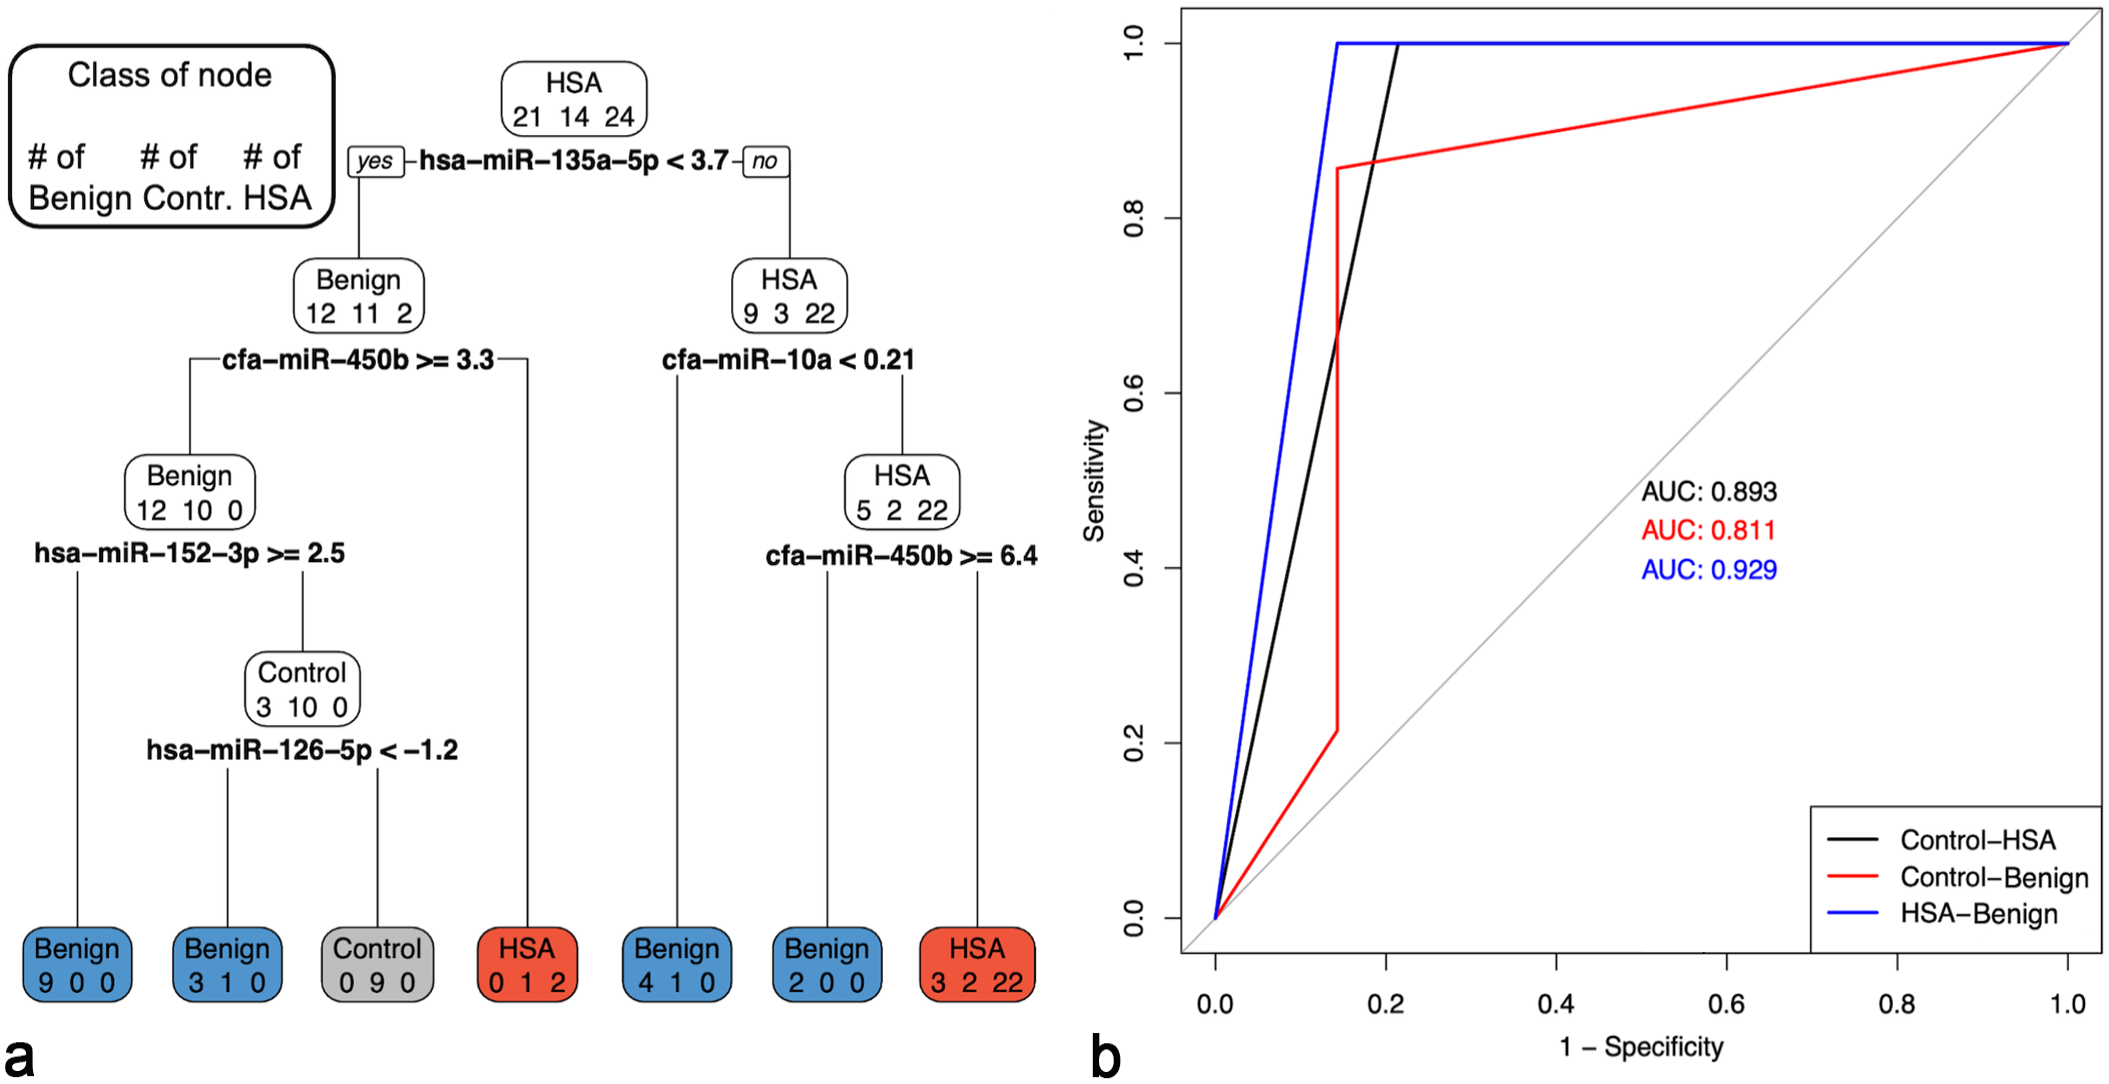
Pruned multiple miRNA serum model to discriminate between hemangiosarcoma (HSA), benign splenic masses, and controls (no splenic masses). The accuracy of the model was 0.8644. (a) Pruned decision tree classifying serum samples based on miR-135a-5p, miR-10a, miR-152-3p, miR-450b, and miR-126-5p. Note that decision values are normalized Ct. A “yes” determination is always to the left. For the benign splenic masses (n = 21), precision = 0.9, recall = 0.8571, and F1 = 0.8781; 18 samples were correctly classified (blue boxes). For the controls (n = 14), precision = 1, recall = 0.6429, F1 = 0.7826; 9 samples were correctly classified (gray box). For the HSAs (n = 24), precision = 0.8, recall = 1, and F1 = 0.8889; 24 samples were correctly classified (red boxes). (b) One-vs-One ROC curves and areas under the curve (AUC) for the corresponding pruned decision tree.
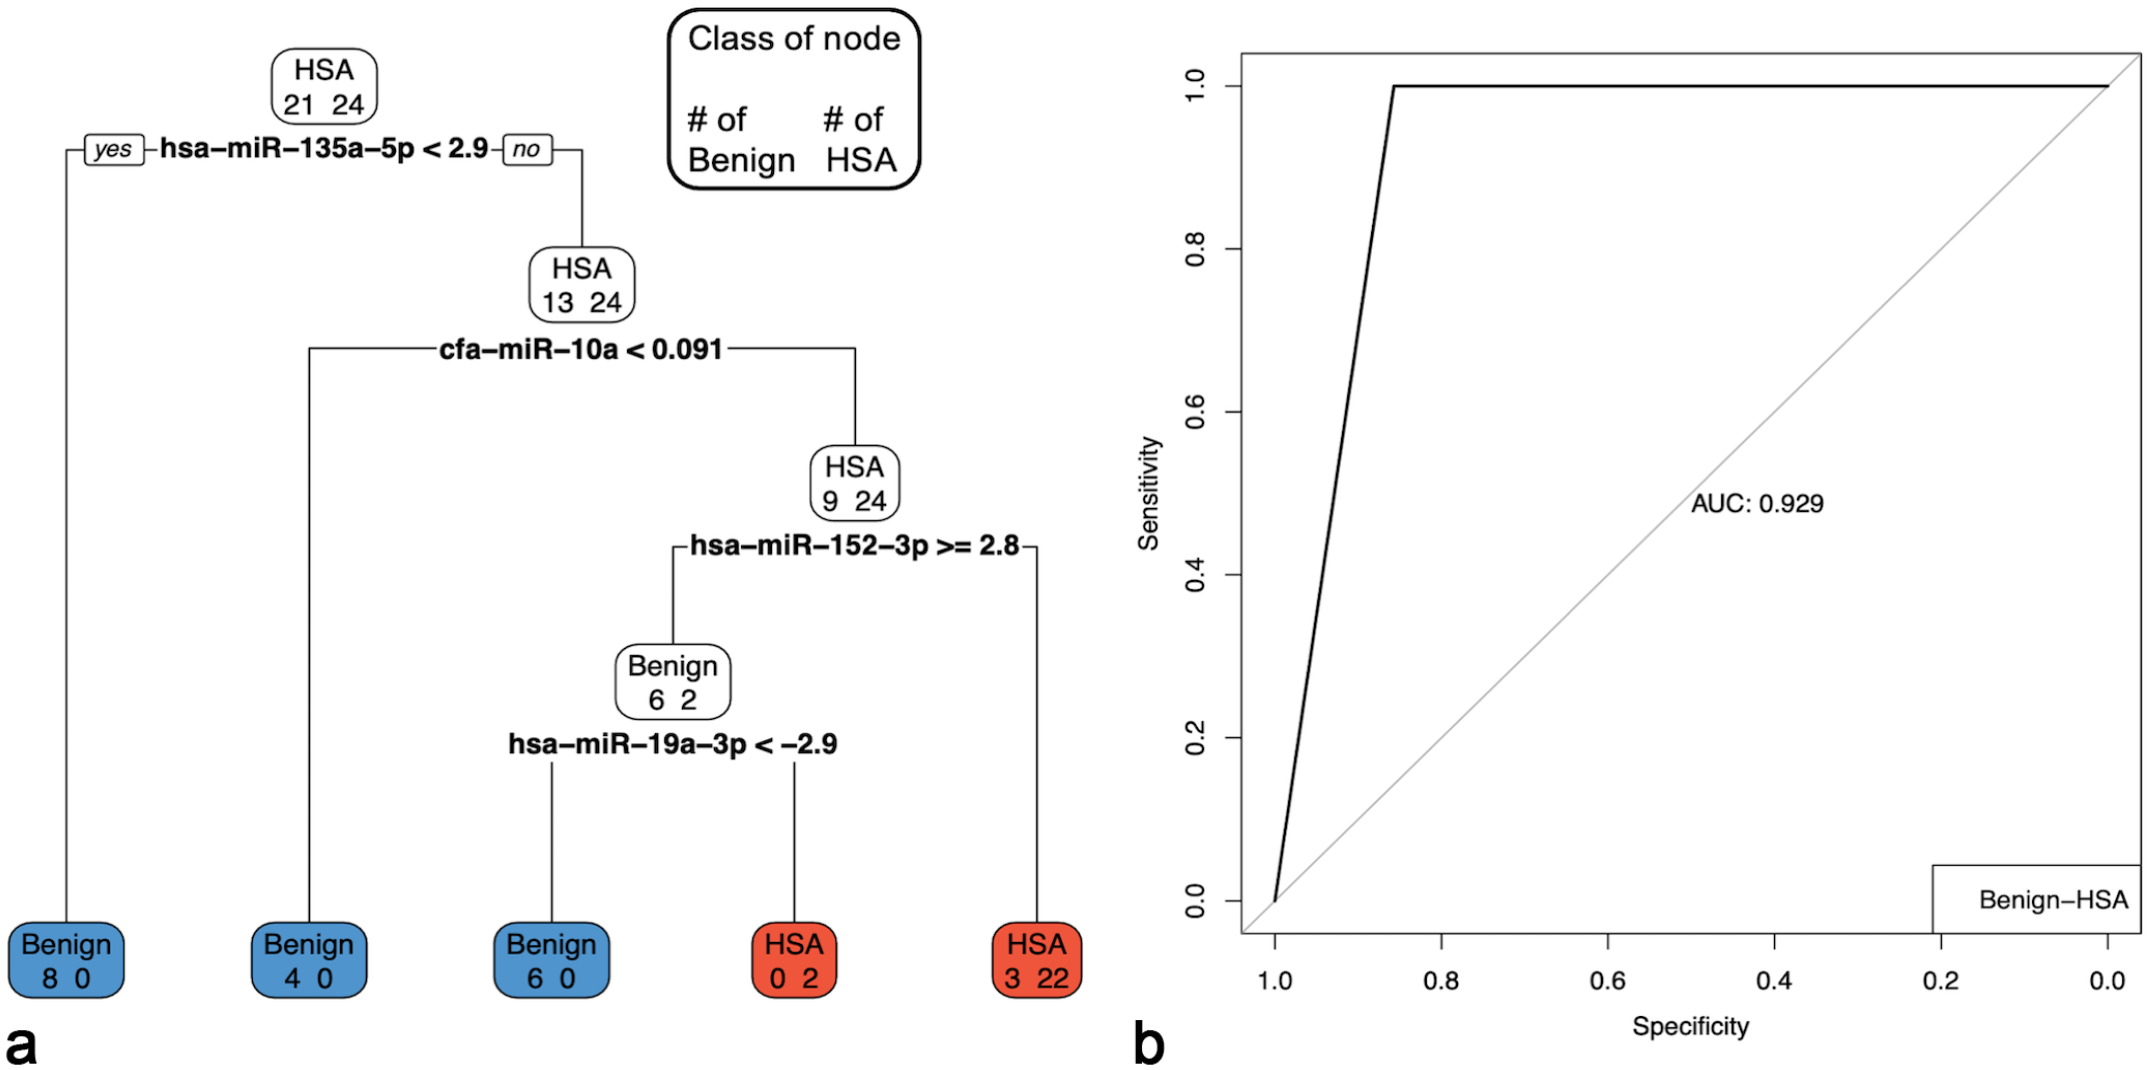
Pruned multiple miRNA serum model to discriminate between hemangiosarcoma (HSA) and benign splenic masses. The accuracy of the model was 0.9333. For the HSAs, precision = 0.8889, recall = 1, and F = 0.9412. For the benign splenic masses, precision = 1, recall = 0.8571, and F1 = 0.92301. (a) Pruned decision tree classifying serum samples based on miR-135a-3p, miR-10a, miR-152-3p, and miR-19a-3p. Note that decision values are normalized Ct. A “yes” determination is always to the left. For the HSAs (n = 24), precision = 0.8889, recall = 1, and F1 = 0.9412; 24 samples were correctly classified (red boxes). For the benign splenic masses (n = 21), precision = 1, recall = 0.8571, and F1 = 0.9230; 18 samples were correctly classified (blue boxes). (b) ROC curve and area under the curve (AUC) for the corresponding pruned decision tree.
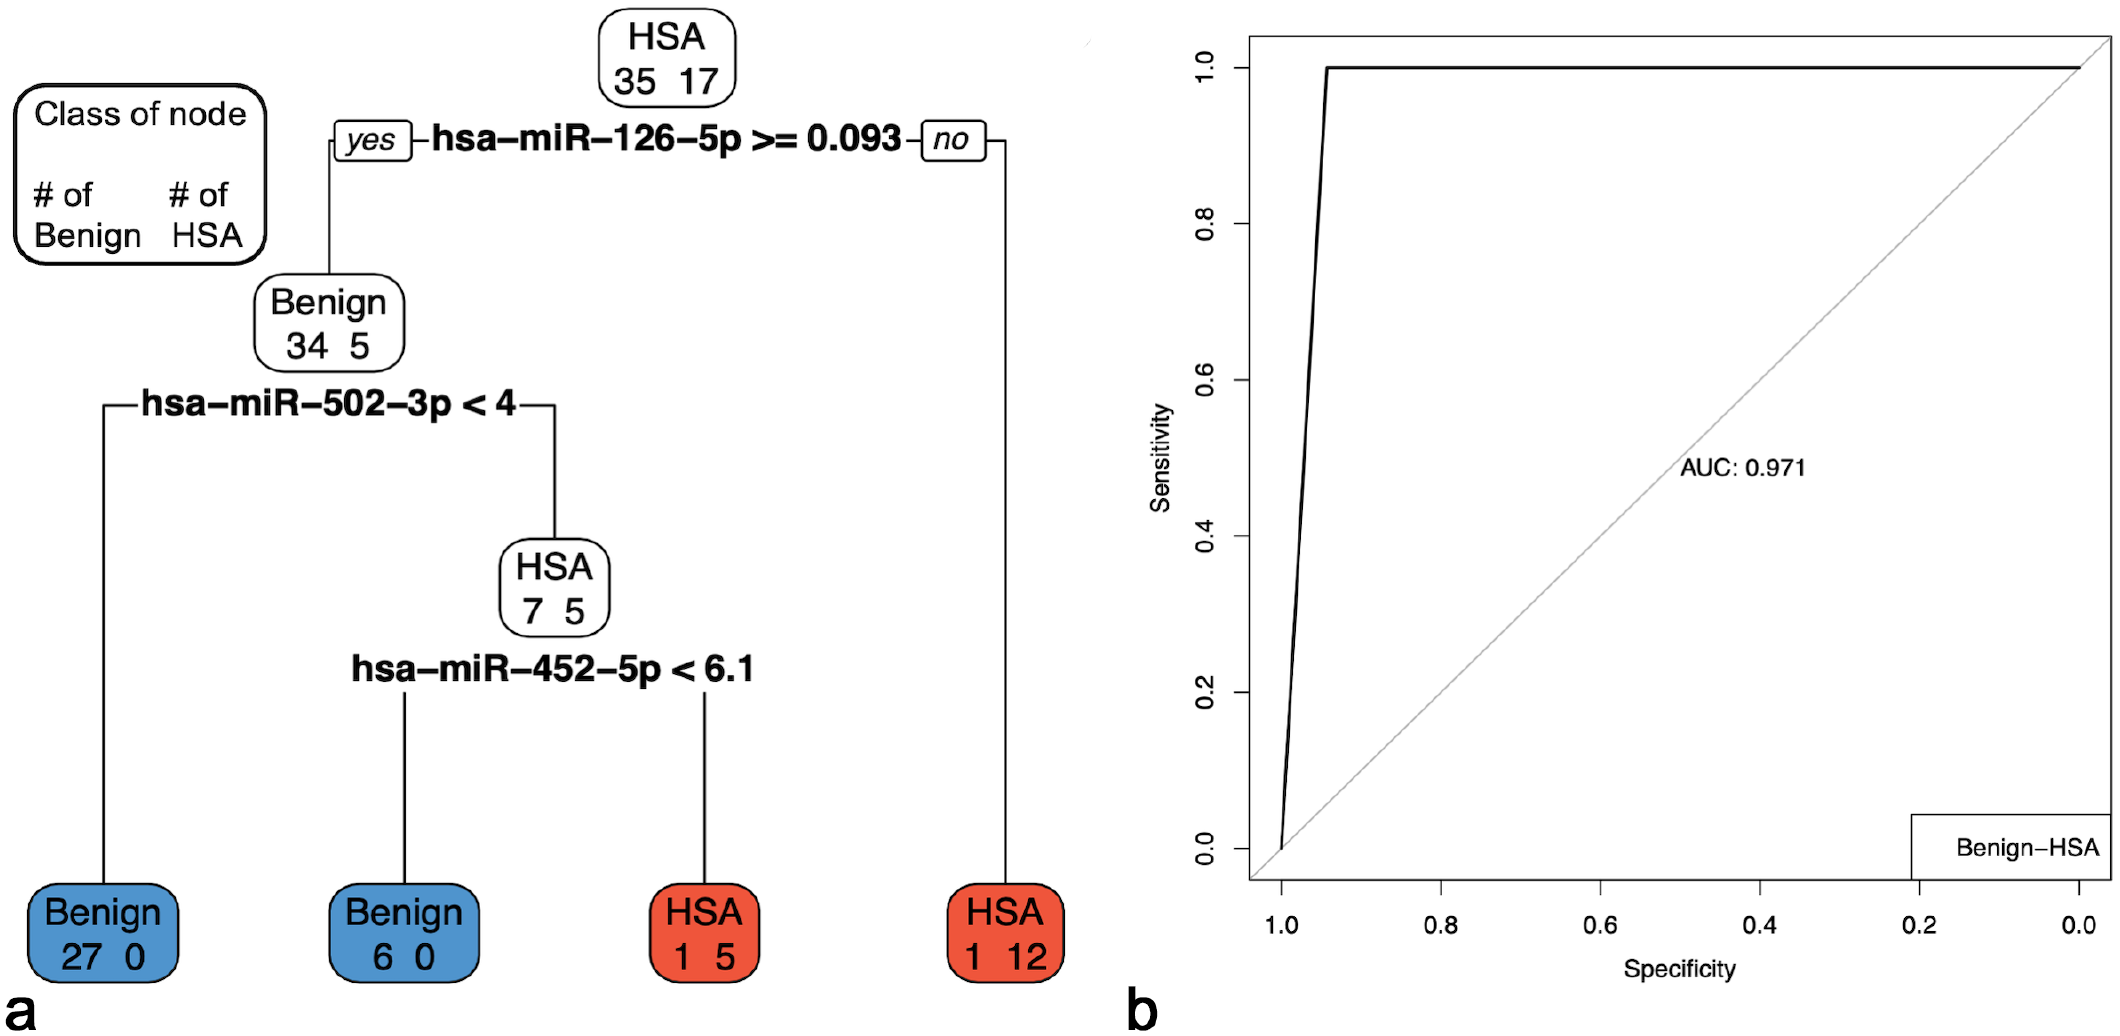
Pruned multiple miRNA tissue models to discriminate between hemangiosarcoma (HSA) and benign splenic masses. The accuracy of the model was 0.9615. (a) Pruned decision tree classifying serum samples based on miR-126-5p, miR-502-3p, and miR-452-5p. Note that decision values are normalized Ct. A “yes” determination is always to the left. For the HSA (n = 17), precision = 0.8947, recall = 1, and F1 = 0.9444; 17 samples were correctly classified (red boxes). For the benign splenic masses (n = 35), precision = 1, recall = 0.9429, and F1 = 0.9706; 33 samples were correctly classified (blue boxes). (b) ROC curve and area under the curve (AUC) for the corresponding pruned decision tree.
Discussion
Splenic masses in dogs are common and have extremely variable prognoses.7,9,10,24,25,40 Differentiating a hematoma from an extremely malignant HSA impacts both an owner’s decision to pursue treatment and the course of treatment. This study found at least 3 miRNAs to be differentially expressed between HSA and all other splenic masses and controls (Table 2), and between controls and all other splenic masses in serum or tissue samples. MiR-26a-5p, miR-193a-5p, miR-542-3p, miR-450b, and miR-450a were differentially expressed between normal splenic tissue and HSA tissue. Grimes et al 12 had similar findings. They compared tissues from HSA and nodular hyperplasia, and in both studies, miR-126-5p had greater expression in HSA and miR-150-5p had lower expression in HSA compared to nodular hyperplasia. 12 In a later study, Grimes et al 13 investigated the serum miRNA profiles of dogs with HSA compared to those with hematomas or without a splenic mass (controls). They found miR-214-3p, miR-452, miR-494-3p, miR-497-5p, and miR-543 to be significantly different between controls, dogs with hematomas, and dogs with HSA. 13 MiR-494-3p and miR-543 were not included in our investigation, and we did not find the remaining miRNAs to be differentially expressed between serum samples from dogs with HSA and controls or cases of nodular hyperplasia. The differences in results here could reflect differences in methods and/or the selection of different endogenous controls.12,13 In the study by Grimes et al (2021) and the results reported here, miR-126-5p and miR-450b were differentially expressed in the serum from dogs with HSA compared to controls or cases of nodular hyperplasia using different techniques, and this supports their utility across multiple populations and should be the focus of further investigation. Finally, both studies found that miRNAs in serum and tissues are different between splenic masses and controls, providing the opportunity to utilize them as a diagnostic tool.12,13
Splenic hematomas, nodular hyperplasia, and HSA are the majority of splenic masses in dogs.7,10,24 Histology remains the gold standard for diagnosis with a recommendation to examine at least 5 sections. 17 However, an accurate diagnosis can still be challenging, as demonstrated by 1 study that found 4 of 35 cases originally diagnosed with a splenic hematoma, later developed clinically detectable metastases, although only one of these cases was confirmed as metastatic HSA histologically. 26 An additional 2022 study had similar results, putting into question how these splenic masses are currently diagnosed.23,26 The pruned decision tree model in tissue developed here allows differentiation of benign splenic masses from HSA. MiR-126-5p, miR-502-3p, and miR-452-5p, as branches in the decision tree model, were able to accurately classify 96% of benign splenic masses and HSAs (Fig. 5). Precision, recall, and F1 values were all greater than 0.89, and the AUC was 0.971. All HSA cases were appropriately classified with this model, and only 2 benign masses were misclassified (6%, 2/35). Minimizing false negatives for HSA in this example is crucial as the goal is to strengthen the confidence in the histologic diagnosis. A low number of false positives are acceptable as further histology can be performed to support or refute the diagnosis.
HSAs can be obscured by large areas of hemorrhage. In this study, we used whole tissue samples, which varied in the amount of tissue composed of actual neoplastic cells (Supplemental Table S1). We were still able to appropriately classify these HSA samples with this model despite this variation, which shows the potential of this technique when applied in a real-world scenario.
The presence of miRNAs in blood and other bodily fluids makes them an attractive target as a diagnostic biomarker that is non-invasive and could easily be included in routine bloodwork.11,16,22 Frequently, splenic masses present as an incidental finding on imaging, and when these masses are diagnosed as HSA, they have a better prognosis than HSA cases diagnosed after clinical signs, such as hemoabdomen. 7 In addition, many cases of splenic masses present as a life-threatening hemoabdomen, which could be averted if the mass is detected prior to rupture. Most cases of HSA occur in elderly dogs for which routine bloodwork is already a recommendation.4,7,40 Including miRNAs as a part of routine bloodwork, as a screening test, may capture these clinically silent splenic masses prior to rupture, potentially improving the prognosis of those diagnosed with HSA. This would extend quality of life by avoiding major hemorrhage. All cases of HSA were accurately identified by this serum model using miR-135a-5p, miR-152-3p, miR-126-5p, miR-10a, and miR-450b to classify normal dogs, those with benign splenic masses, and those with HSA (Fig. 3). Five known normal dogs were misclassified (36%, 5/14) as either having a benign splenic mass (2 cases) or HSA (3 cases) based on this model. As a screening test, a low number of false positives are acceptable because additional imaging can be performed to confirm a splenic mass. Confirmation of the capability of this model to screen for splenic disease would require samples obtained before diagnosis of confirmed cases. In this model, only benign splenic masses and HSA were included, as they are the most common splenic masses.7,10,24 A model including all mass types was not investigated, as these additional tumor types (ie, lymphoma, histiocytic sarcoma, and other sarcomas NOS) were shown to have sufficiently different single miRNA profiles and different clinical behaviors to be grouped. In addition, these individual groups did not have a sufficient number of samples to provide accurate information without overfitting.
Dogs with splenic masses may present as an emergency due to unexpected weakness and collapse following mass rupture and hemoabdomen. 25 Abdominocentesis can confirm hemoabdomen, and abdominal ultrasound can confirm the splenic location of a ruptured mass. Owners then decide between surgery and euthanasia. For hematomas, surgery is usually curative, whereas with HSA, concomitant metastatic disease is common. 25 Currently, imaging and other clinical parameters cannot accurately differentiate between a benign or malignant disease when only a solitary splenic mass is present.6,9,10,18,21,24,33,37 This final pruned decision tree model investigated the use of serum miRNAs to differentiate between benign masses and HSA. All HSA cases were appropriately classified using miR-135a-5p, miR-10a, miR-152-3p, and miR-19a-3p. Three cases of benign splenic masses were misclassified as HSA, and the AUC was 0.929 and overall accuracy was 93%. Multivariable models previously developed to predict a splenic malignancy only had an AUC of 0.85.6,33 Based on these results, serum miRNAs along with other current clinical parameters and imaging features could help make an accurate point-of-care diagnosis to inform rapid owner decision-making. Future research should investigate the utility of augmenting current clinical parameters with serum miRNAs to screen for splenic malignancy.
Thirty miRNAs were differentially expressed between presplenectomy and postsplenectomy HSA-serum samples from nonmatched patients. Changes in these profiles, particularly those with decreased expression in the post-splenectomy samples, could be related to the removal of the splenic tumor with loss of the source of tumor cell–associated miRNA release. MiR-450b and miR-542-3p have increased expression in HSA tissue samples compared to the normal spleens, and these 2 miRNAs were similarly increased in the samples investigated by Grimes et al. 12 Both miRNAs have decreased expression in the postsplenectomy samples compared to the presplenectomy samples (Table 3). The presence of anemia at the time of diagnosis may also influence the miRNA profile, although this has not been investigated, and resolution of the anemia a few weeks later at the post-splenectomy sampling time might resolve any changes in potential anemia-associated miRNAs.
Hemolysis is one of the largest challenges in the analysis and utilization of miRNAs present in blood samples. 19 Erythrocytes contain miRNAs, and the degree of hemolysis can change the profile of serum and plasma.19,20,27,28 Exclusion of hemolyzed samples is not practical, as anemia and dehydration can influence the quality of blood sampling and, as such, the degree of hemolysis. Anemia and dehydration are common in dogs presenting with a hemoabdomen. 25 In addition, in vivo hemolysis has been demonstrated in patients with HSA due to disseminated intravascular coagulation or microangiopathic hemolytic anemia.14,30 There is currently no formula or standard to correct for hemolysis in these sample types, thus using miRNAs that are unlikely to be related to hemolysis is appealing. UV-absorbance can be used to objectively detect the amount of oxyhemoglobin in a sample, but its sensitivity is lower than the detection of miRNAs. 35 Certain miRNAs are already known to be enriched in erythrocytes, including miR-451a and miR-16-5p. 28 We found several with a linear relationship (R2 value) greater than miR-451a and miR-16-5p suggesting a strong link with hemolysis (Supplemental Table 7). To conservatively approach these models, miRNAs with a strong link to hemolysis were removed from consideration. Several miRNAs had an R2 value less than those of miR-16-5p or miR-451a but above the values for miR-21, which is not elevated with hemolysis. In the models, miR-19a-3p is one such miRNA. It was included when evaluating serum across samples with benign splenic masses and HSA. Interestingly, miR-19a-3p specifically helped to classify 2 cases of HSA and may reflect the degree of illness and difficulty in blood sampling leading to greater hemolysis in those samples. These 2 samples were hemolyzed, whereas the 6 benign splenic masses from which they were separated were not. Utilizing hemolysis-associated miRNAs in serum samples in models should be interpreted with caution and an understanding of their potential link to variation in the degree of hemolysis across groups. Further investigation using erythrocyte dilution studies in these questionable miRNAs is required to better understand their potential relationship to hemolysis.
Histology was used as the standard for positive classification of cases. Although there are limitations in using histology, over 75% of both the serum and tissue samples diagnosed as benign splenic masses had at least 6 months of clinical follow-up to support the lack of progressive disease and to support their benign classification. All samples were retrospective in nature and stored over varying periods of time. Evidence supports the stability of miRNAs in stored samples; however, this has not been investigated for all miRNAs. Defining a Ct value cut-off of 35 provides a conservative estimation of expression and highlights biologically relevant changes. We acknowledge that the use of actual values may result in slight changes to fold-changes but consider these to be minimally biologically relevant. Future studies should investigate prospectively collected samples. The control group represented the youngest group, although not tested for statistical significance, and so future studies should more closely match the age distribution of the case samples, as age-related differences in miRNA expression patterns are unknown. In addition, as some of the cohorts had a small number of samples, when a multiple comparisons correction was applied, many of the miRNA comparisons lost statistical significance. Future studies should include samples from different institutions and using additional miRNA detection methods to validate these findings prior to clinical implementation.
Conclusions
This study provided further evidence that miRNAs can differentiate between different splenic masses, including HSA, and healthy controls in both serum and tissue. MiRNA models can be utilized as a potential screening test for disease, assist with diagnostic accuracy, and assist in guiding point-of-care decision-making. Further validation in additional populations is required, but this study provides a basic profile of miRNA expression in HSA compared to normal dogs and dogs with other splenic masses and to evaluate the early diagnostic potential of miRNAs.
Supplemental Material
sj-pdf-1-vet-10.1177_03009858251317466 – Supplemental material for MicroRNAs in serum and tissue can differentiate splenic hemangiosarcoma from other splenic masses in dogs
Supplemental material, sj-pdf-1-vet-10.1177_03009858251317466 for MicroRNAs in serum and tissue can differentiate splenic hemangiosarcoma from other splenic masses in dogs by Latasha Ludwig, Heather Treleaven, Arlene Khachadoorian, Brigitte Degasperi, Ingrid Walter, Deirdre Stuart, Robert A. Foster, Robert Darren Wood, R. Ayesha Ali and Geoffrey A. Wood in Veterinary Pathology
Footnotes
Acknowledgements
This research was supported using resources of the VetCore Facility (VetBioBank) of the University of Veterinary Medicine Vienna. We thank the Ontario Veterinary College Veterinary Biobank for serum and tissue samples, along with all those involved in collection of samples at both biobanks, including Dr Christof A. Bertram for assistance in sample acquisition.
Author contributions
LL, HT, BD, IG, DS, RAF, RDW, and GAW contributed to the experimental design and sample acquisition and inclusion; LL and AK performed the experimental protocols; HT, LL, RAA, and GAW guided and performed the statistical analyses; the manuscript was written by LL, HT, and GAW with contributions from the other authors.
Authors’ notes
Current affiliations are Department of Population Medicine and Diagnostic Sciences, College of Veterinary Medicine, Cornell University (LL).
Declaration of Conflicting Interests
The author(s) declared no potential conflicts of interest with respect to the research, authorship, and/or publication of this article.
Funding
The author(s) disclosed receipt of the following financial support for the research, authorship, and/or publication of this article: This research was supported by a Vanier Canada Graduate Scholarship (NSERC) and OVC Fellowship to LL, funding from Pet Trust (055849) and NSERC (RGPIN-2020-06472) to GAW.
Supplemental Material for this article is available online.
References
Supplementary Material
Please find the following supplemental material available below.
For Open Access articles published under a Creative Commons License, all supplemental material carries the same license as the article it is associated with.
For non-Open Access articles published, all supplemental material carries a non-exclusive license, and permission requests for re-use of supplemental material or any part of supplemental material shall be sent directly to the copyright owner as specified in the copyright notice associated with the article.