
Abstract
Equine spinal neurodegenerative conditions are frequently encountered in sport and racing horses and may be career-ending diagnoses. To further define the spatial transcriptomic landscape of equine dorsal root ganglia (DRG) in healthy adult horses, we investigated gene expression differences in distinct DRG regions using the GeoMx Digital Spatial Profiling from NanoString. Four human cell markers demonstrated high fidelity for equine cells; microtubule-associated protein 2 (MAP2), myelin basic protein (MBP), allograft inflammatory 104 factor 1/ionized calcium-binding adaptor molecule 1 (IBA1/AIF1), and Syto83 nuclear marker. Geometric regions of interest were then selected as MBP-rich, IBA1-high, and IBA1-low, and gene expression was compared. Experimental validation was achieved, with genes involved in myelination enriched in MBP-rich regions, and the identification of glia-specific genes enriched in IBA1-high regions. Thus, spatial transcriptomics with human cell markers was successful in equine DRG and can now be applied to determine cell-specific transcriptional changes during disease states.
Equine neurodegenerative conditions are frequently encountered in sport and racing horses. In many cases, spinal neurodegeneration in horses is a career-ending diagnosis. The top noninfectious causes of spinal cord disease in the horse include cervical vertebral compressive myelopathy (CVCM or Wobbler syndrome) and equine neuroaxonal dystrophy/equine degenerative myeloencephalopathy (eNAD/EDM).6,14 Infectious etiologies, including equine protozoal myeloencephalitis, viral myeloencephalitis, and equine herpes myeloencephalopathy can also present as spinal ataxias; however, accurate antemortem diagnostics tests are readily available to distinguish these infectious diseases. Histologic lesions consistent with CVCM and eNAD/EDM can be identified in the spinal cord, with the dorsal root ganglia (DRG) identified as the “hub” of the neural tracts affected in eNAD/EDM. 5
The physical size of the horse precludes sensitive imaging techniques, such as magnetic resonance imaging, with the mainstay of diagnosis relying on radiography, myelography, and computed tomography and clinical exclusion. These imaging techniques are primarily used to exclude CVCM; however, the poor sensitivity and presence of nonsignificant background lesions can limit their utility. 18 In addition, there is no definitive diagnostic test for the second most common etiology of spinal ataxia, eNAD/EDM.6,13,14 With the difficulty in establishing a definitive antemortem diagnosis, a gold standard diagnostic remains a full neurologic postmortem examination. However, even with necropsy, 17.7% of horses with spinal ataxia have an unclassified etiology. 6 Thus, diagnostics that extend beyond histology and immunohistochemistry are required.
Warmblood horses are at increased odds of undergoing necropsy for spinal ataxia than other nonneurologic conditions (odds ratio [OR] = 2.70, [1.88–3.46]). 6 The frequency of diagnosis of eNAD/EDM in warmbloods at necropsy has increased,1,6 likely due to increased awareness of the histopathologic lesions associated with eNAD/EDM and the growth of the warmblood population in the United States. Recently, 3 warmbloods were diagnosed with both CVCM and concurrent “possible” eNAD/EDM at necropsy (unpublished data, University of California, Davis). While it is conceivable that these horses may, in fact, suffer from both diseases, this complicates further research into underlying disease etiology of eNAD/EDM for the scientist and insurance claims for the owner. If molecular signatures of CVCM and eNAD/EDM could be identified, these ancillary diagnostics could aid in the classification of these cases and advance the ability to study and better understand these diseases. To date, all RNA sequencing that has been performed for eNAD/EDM has been restricted to bulk RNA-seq. 4
Spatial transcriptomics, named method of the year in 2021 by Nature, 12 provides spatial resolution of gene expression profiles in tissue samples. While the pinnacle of gene expression is single-cell resolution through single-cell RNA sequencing, the 3-dimensional and spatial interactions of these cells cannot be resolved. In addition, single-cell RNA sequencing requires rapid collection of cells at necropsy, which can be difficult with equine neural tissue. Spatial transcriptomics can be applied on histologic samples, where they are fixed, stained, placed on microarrays, and then permeabilized, so that molecules can diffuse and released mRNA can bind to spatially barcoded probes. The first spatial transcriptomics study in the horse profiled cerebellar tissue in horses with Shivers and demonstrated axonal degeneration as a defining feature of this movement disorder. 17
Spatial transcriptomics studies require cell marker selection. Adult DRG neurons are supported by 2 types of glia. First, satellite glial cells surround neuronal bodies in the DRG and regulate neuronal activity. 7 Satellite glial cells exhibit similarities with central nervous system astrocytes and oligodendrocytes. 8 Like astrocytes, satellite glial cells express glutamine synthase, S100, and vimentin. 7 Glial fibrillary acidic protein (GFAP), which labels astrocytes, is expressed at lower levels in resting satellite glial cells. 10 The second type of glial cell in the DRG is the Schwann cells that support axons along the peripheral nerves. Myelin is maintained by continuous communication between axons and Schwann cells in DRG. Macrophages, which express allograft inflammatory factor 1/ionized calcium-binding adaptor molecule 1 (IBA1/AIF1), are present in DRG and may be associated with neuropathic pain following injury. 20 Thus, selection of markers for DRG spatial transcriptomics studies should be aimed at profiling neurons and associated glia.
To conduct a proof-of-concept study to validate the use of spatial transcriptomics in equine DRG, we performed spatial transcriptomics on DRG tissue from unstained slides of 2 healthy Thoroughbred horses as part of the Functional Annotation of Animal Genomes initiative. 15 We hypothesized that using human morphology markers established through the GeoMx Human Whole Transcriptome Atlas Assay (NanoString), we would be able to successfully differentiate gene expression profiles between myelin-rich vs myelin-poor regions and macrophage-rich vs macrophage-poor regions in equine DRG.
Materials and Methods
Horses
Two formalin-fixed paraffin-embedded sections of DRG from 2 healthy Thoroughbred stallions (aged 3 and 4 years), collected as part of the Functional Annotation of Animal Genome initiative, were used. Both horses were considered neurologically normal based on a full clinical neurologic evaluation and complete gross and histology necropsy, as previously described. 3
Antibody Markers and Regions of Interest
Spatial profiling of equine thoracic spinal cord and DRG samples, at the level of thoracic vertebrae 7 to 8 (T7–T8), was performed using the NanoString Technologies GeoMx Digital Spatial Profiler through the NanoString Technologies Technology Access Program (TAP) in Seattle, WA. The GeoMx Human Whole Transcriptome Atlas Panel was applied to paraffin-embedded sections of equine DRG. Two, 5 µm sections were baked overnight at 37°C followed by 2 hours at 65°C in a standard baking oven. The slides were processed on a Leica automation platform with a protocol that includes 3 major steps: (1) slide baking and deparaffinization, (2) antigen retrieval for 20 minutes at 100°C, and (3) 0.1 μg/mL proteinase K treatment for 15 minutes.
The Human Whole Transcriptome Atlas transcript probes were applied and allowed to hybridize for 16 hours in a standard hybridization oven protected from light at 37°C. Immunofluorescent labeling of microtubule-associated protein 2 (MAP2, 1 mg/mL, Novus Biologicals, Centennial, Colorado; Cat. No. NBP2-25156), myelin basic protein (MBP, 10 µg/mL, Novus Biologicals; Cat. No. NBP2-22121AF647), IBA1/AIF1 (5 µg/mL, Millipore Sigma, Burlington, Massachusetts; Cat. No. MABN92-AF647), and the nuclear marker Syto83 (Thermo Fisher Scientific, Waltham, Massachusetts; Cat. No. S11364) was performed upon removal of the transcript probes. The following dilutions were used for MAP2, MBP, and IBA1/AIF1, respectively, 1:1000, 1:100, and 1:200. Regions of interest (ROIs) were identified using the immunofluorescent MAP2, IBA1/AIF1, and MBP labeling. A total of 12 areas of illumination were selected per tissue section.
Once successful immunofluorescence was obtained, 3 ROIs were selected to perform gene expression comparisons: (1) MBP-rich areas, denoting oligodendrocytes (“MBP”), (2) regions with high IBA1 content, denoting a higher level of macrophages (“IBA1-high”), and (3) regions with lesser IBA1 content, denoting a lower level of macrophages (“IBA1-low”). Within the 3 ROIs, we selected 4 representative areas for each horse (areas of interest), thereby providing a total of 24 areas of interest for evaluation (2 horses × 3 ROIs × 4 areas).
Sequencing and Bioinformatic Analysis
Next-generation sequencing library preparation was performed according to the NanoString Technologies’ published protocol (GeoMx DSP NGS Readout User Manual [nanostring.com]). The prepared library was purified using AMPure XP beads (Beckman Coulter, San Jose, California), and library quality was assessed using a Bioanalyzer (Agilent Technologies, Santa Clara, California). The required sequencing depth was determined by calculating the sum of all areas of illumination (in square micrometers) and multiplying the total area (in square micrometers) by 100 (GeoMx DSP Library and Sequencing Guide [nanostring.com]). Sequencing was performed using an Illumina NovaSeq6000, with at least 27 × 27 paired end reads. FASTQ files generated upon sequencing were converted to digital count conversion files using the NanoString Technologies publicly available pipeline (v2.0.21) (GeoMx NGS Pipeline [illumina.com]). Through the pipeline, individual probe alignment was performed using identification of readout tag sequences, and duplicate counts of probes generated during the library preparation polymerase chain reaction were removed through evaluation of the probe unique molecular identifier sequences.
Digital Count Conversion files were analyzed using the NanoString Technologies GeoMx Digital Spatial Profiler Data Analysis (DSPDA) software (v2.4). The number of raw reads, the percentage of aligned reads, and the sequencing saturation of each area of illumination were evaluated to determine the quality of the library preparation. Areas of illumination were included in the analysis if they had more than 1000 raw reads, if over 80% of the reads aligned correctly, and if the sequencing saturation was above 50%. A control sample with no target probes added, termed a “no template control,” was included in the library preparation process and sequenced to estimate library preparation contamination. Negative control probes, designed using external RNA controls consortium sequences, are included in each GeoMx RNA assay to estimate background noise and the limit of quantitation. For this work, the limit of quantitation was defined as the negative probe geomean plus the geometric standard deviations of the negative probes. Target probes were filtered according to their frequency in each area of illumination. Targets were kept in the analysis if they were detected above the limit of quantitation in > 10% of areas of illumination. Targets were normalized using Q3 normalization, where individual targets were normalized to the 25% most highly counted of all targets. Unbiased hierarchical cluster analysis was performed using all normalized targets. Dimensional reduction plots were created using principal component analysis and t-distributed stochastic neighbor embedding (tSNE). All statistical analyses and data visualizations were performed in R (R Core Team 2021) or using the DSPDA software v2.3. Differential expression was performed using a linear mixed effect model with slide and DSP instrument as random effect variables, and P values were corrected for multiple hypothesis testing using a false discovery rate (FDR) of P < .01. Gene set enrichment analysis was performed using the GSVA R package. 9 Cell abundances were estimated using the SpatialDecon R library, which performs mixed deconvolution using constrained log-normal regression. The 0.85 quantile-scaled data were used as input. 2
Results
The 4 human morphologic markers (MBP, MAP2, AIF1, and Syto83) successfully labeled equine DRG cell types (Fig. 1).
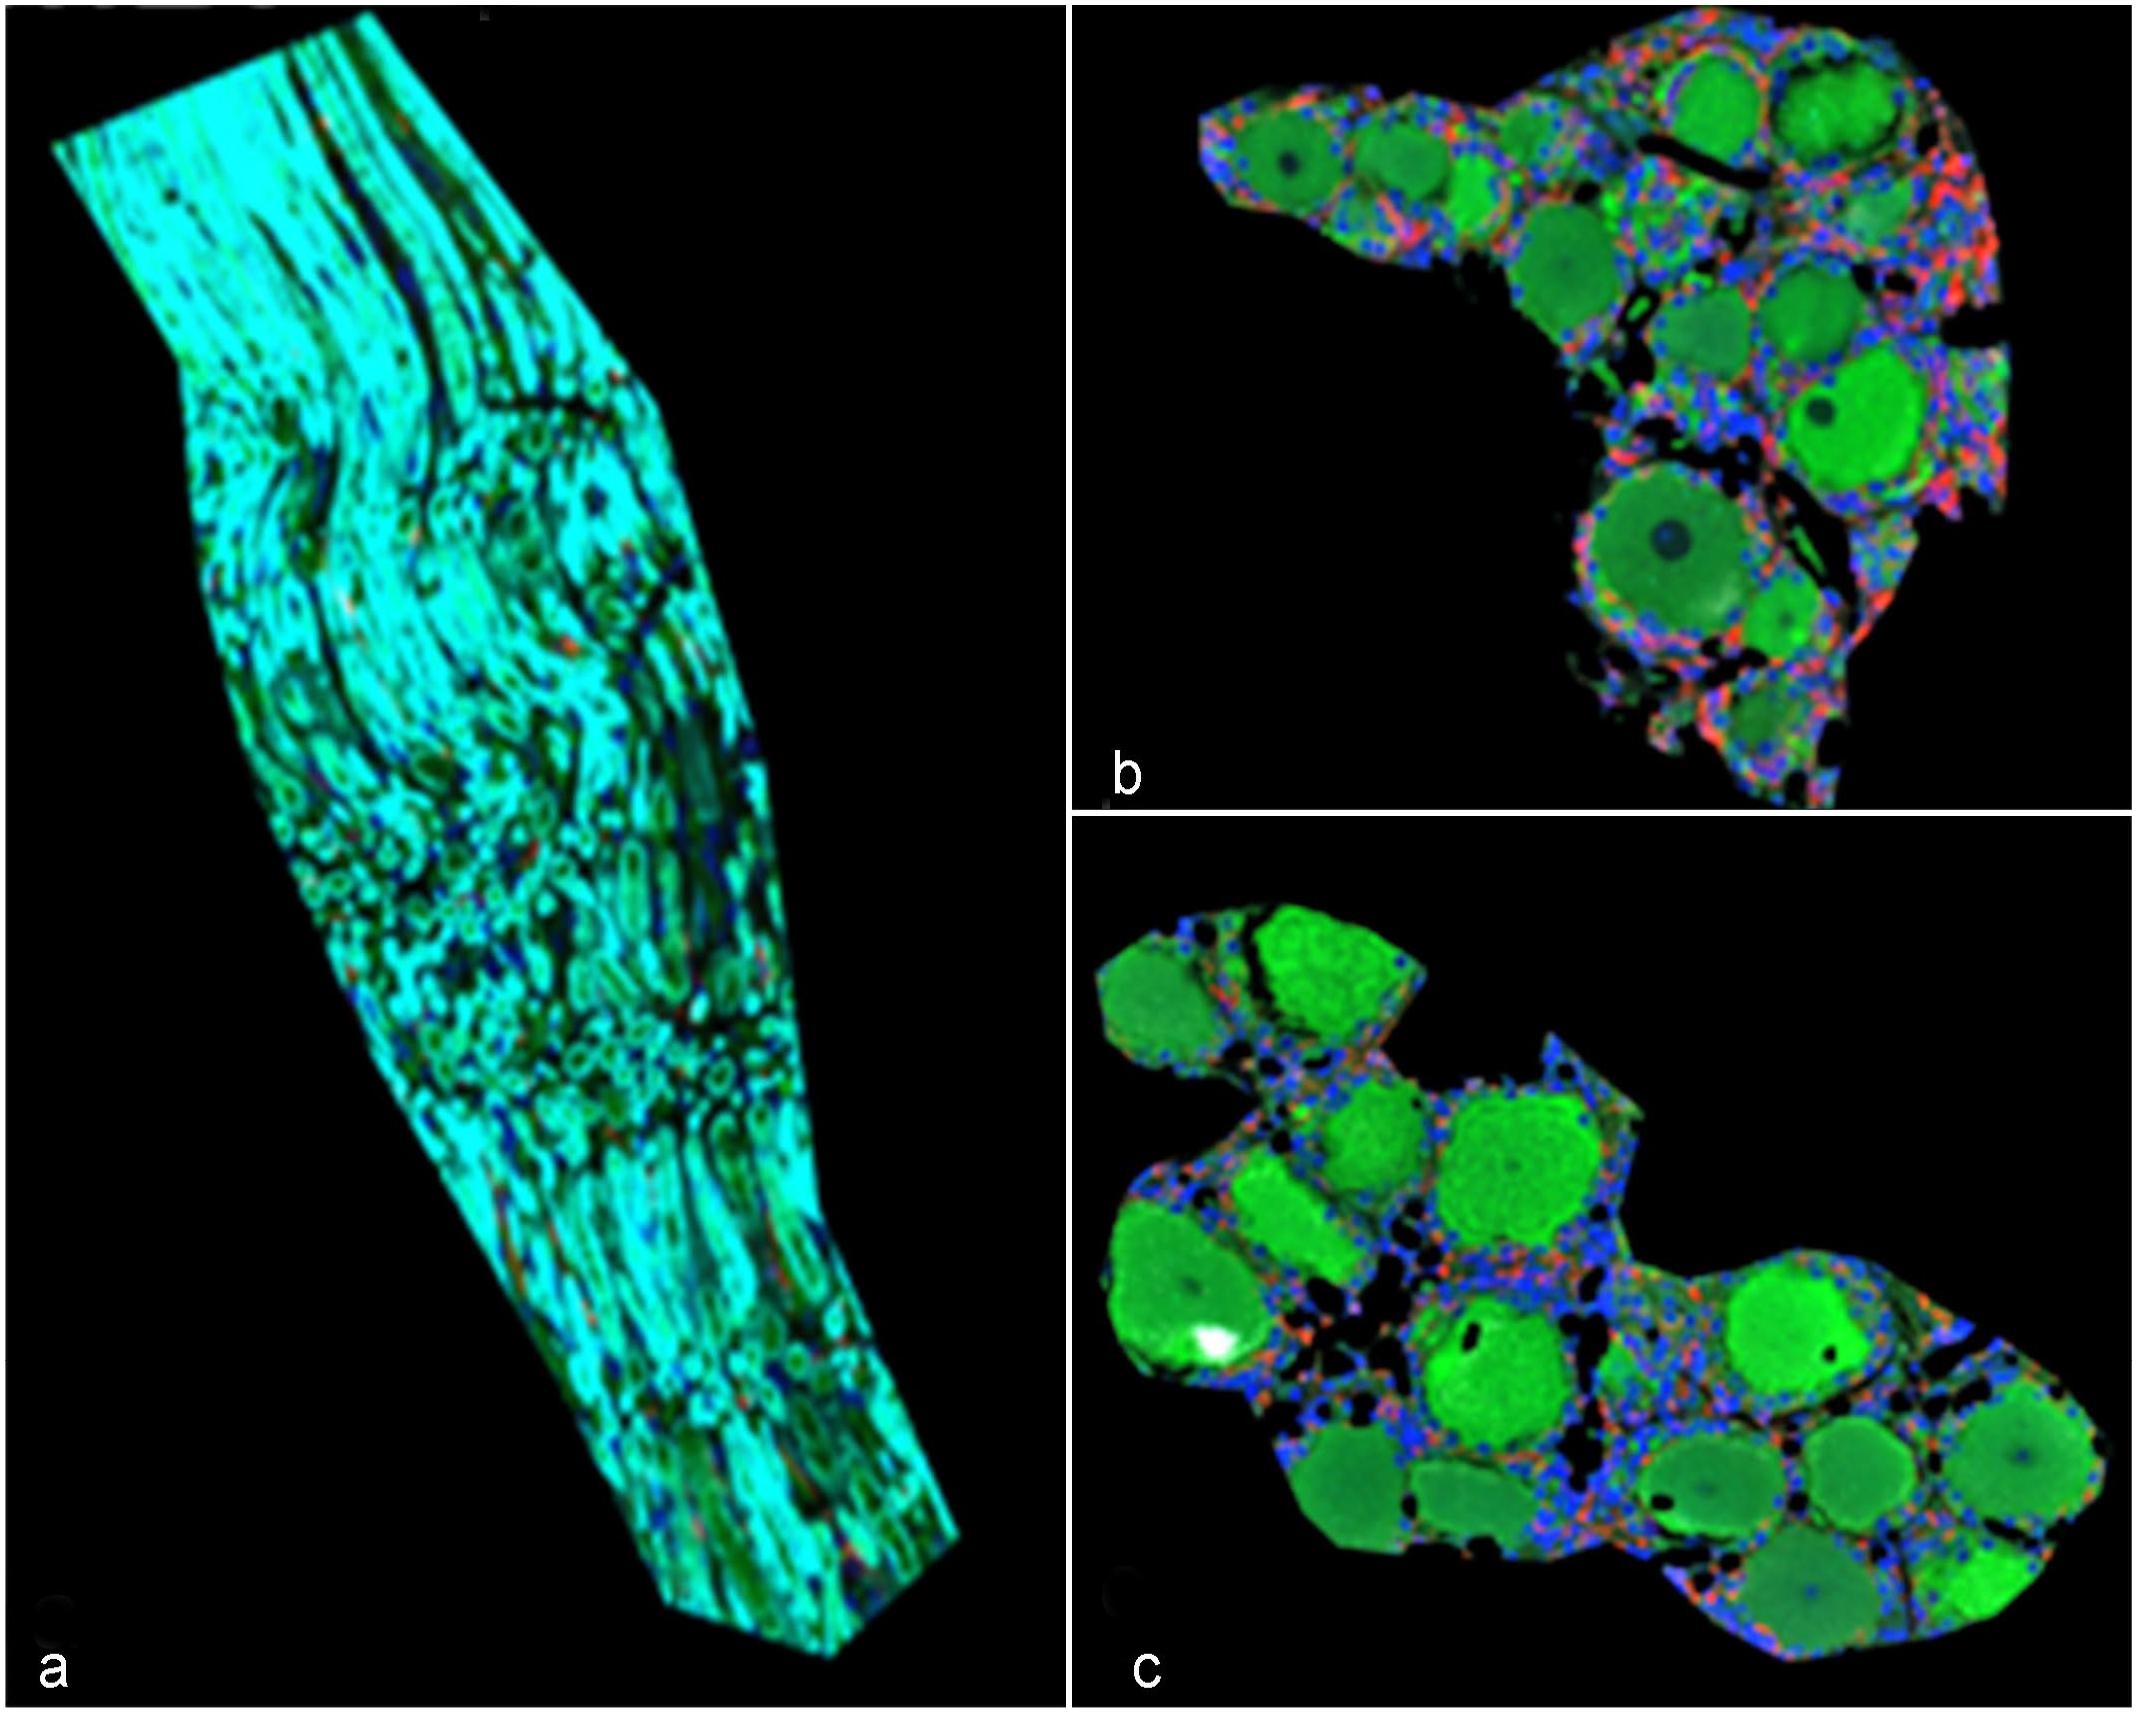
Successful labeling of equine dorsal root ganglia (DRG) cells using human morphologic markers microtubule-associated protein 2 (MAP2, green) as a pan-neuronal marker, myelin basic protein (MBP, turquoise) as an oligodendrocyte marker, allograft inflammatory factor 1/ionized calcium-binding adaptor molecule 1 (AIF1/IBA1, red) as a marker of macrophages, and Syto83 (blue) as a DNA marker. (a) MBP-rich region, (b) IBA1-high region, and (c) IBA1-low region selected for downstream analyses.
Assay Sensitivity
Across the 24 areas of interest, 18,676 genes were probed. When normalized by the third quartile, 5752 genes (~31%) were expressed above the limit of quantification in at least 1% of areas of interest. The number of genes passing this threshold decreased as expected with increased numbers of segments (Supplemental Fig. S1).
Dimensional Reduction Plots
Principal component and tSNE plots identified strong clustering of MBP ROIs, with less distinction between IBA1-high and IBA1-low ROIs, which are separated from the MBP samples on principal component 1 (Fig. 2).
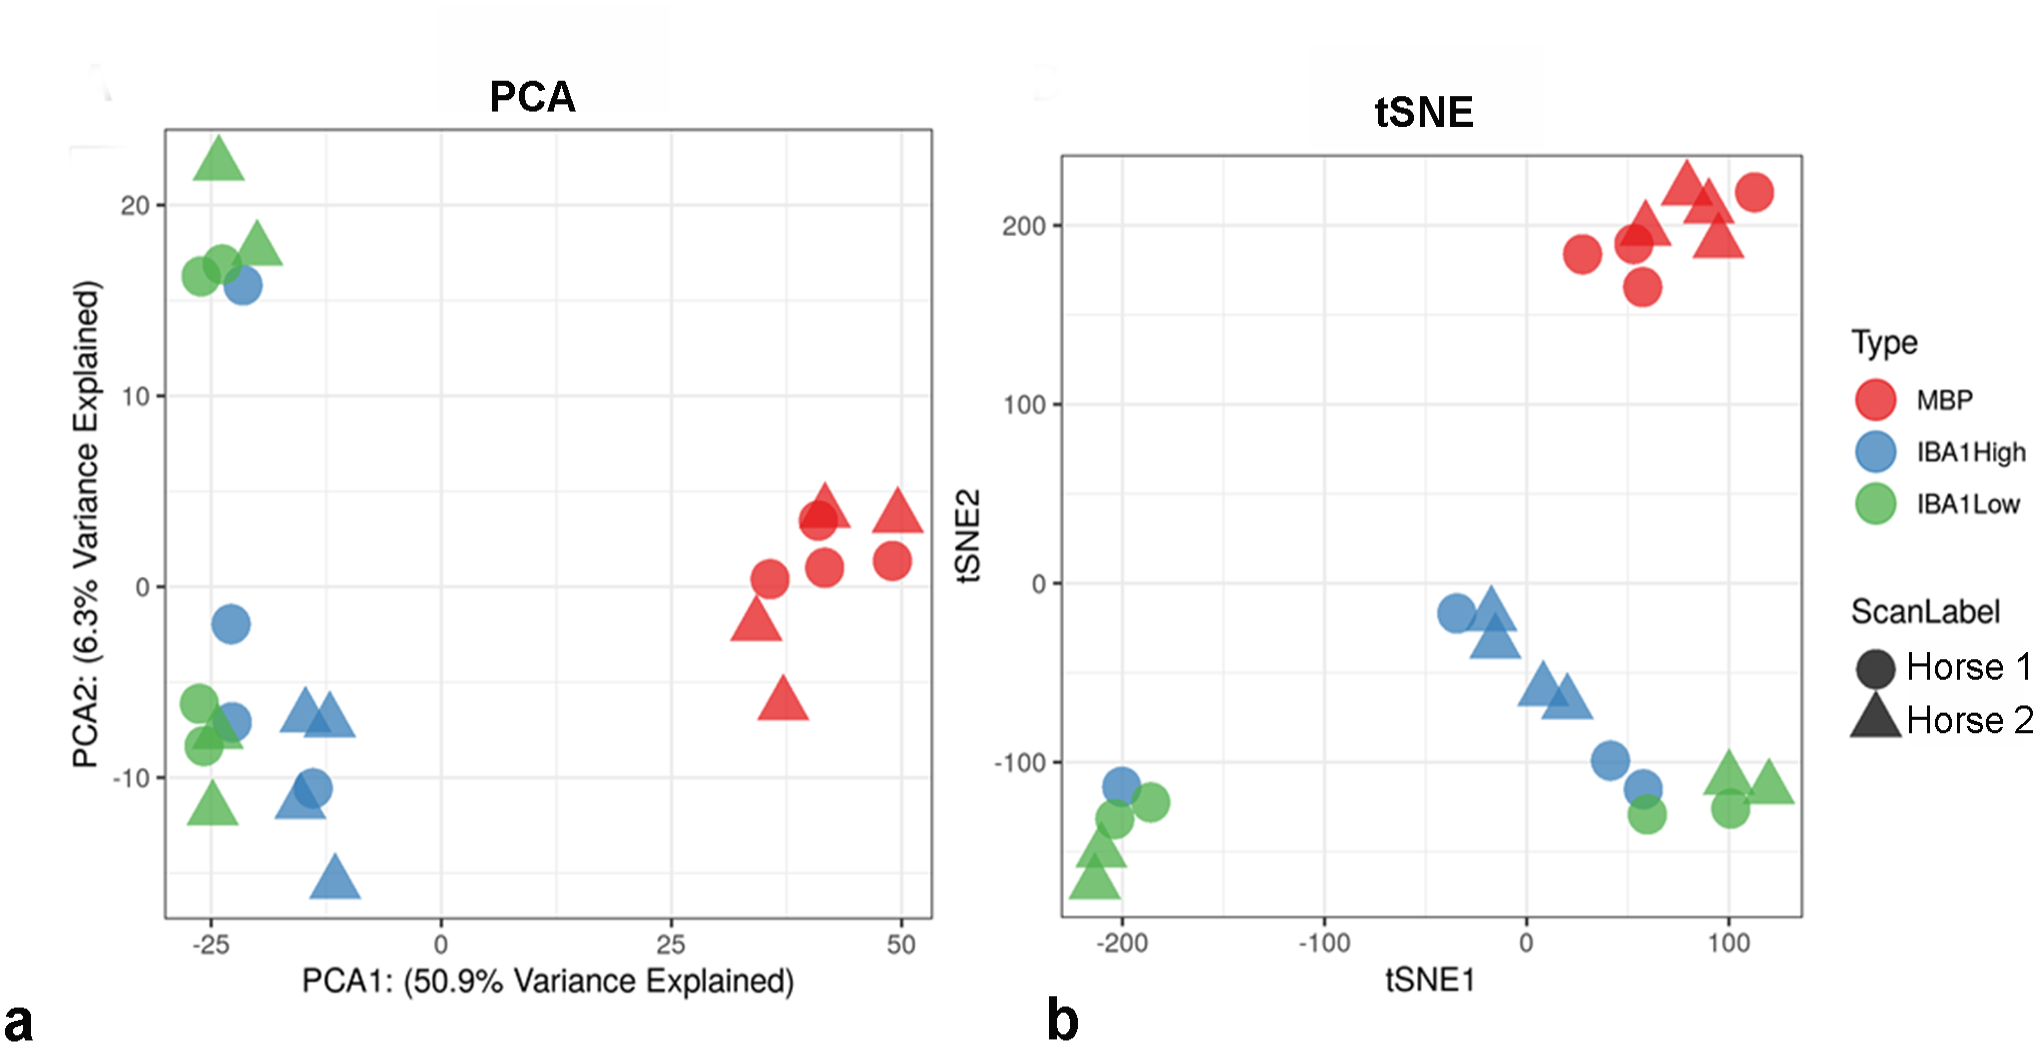
(a) Principal component analysis (PCA) and (b) t-distributed stochastic neighbor embedding (tSNE) dimensional reduction plots for the 24 areas of interest. The ScanLabel shape indicates the horse ID and the color indicates the selected area of interest. Plots demonstrated that areas of interest segregated primarily by cell populations vs individual horses.
Differential Expression Analyses
When comparing MBP vs IBA1-low ROIs, 1585 differentially expressed genes were identified (PFDR < .05), including 934 downregulated and 651 upregulated (Supplemental Table S1). Top differentially expressed genes included MBP itself (log2 fold change (FC) = –4.40, PFDR = .008) and myelin protein zero (MPZ) (log2FC = –4.25, PFDR = 2.25 × 10⁻⁸), which were greater in the MBP region (Fig. 3). Gene set enrichment analysis identified 134 pathways significantly associated with MBP vs IBA1-low ROIs, with top hits involving the immune system, membrane trafficking, and vesicle-mediated transport (Supplemental Table S2). Similar results were obtained when comparing MBP vs IBA1-high, with 229 differentially expressed genes identified, including 54 downregulated and 175 upregulated (Supplemental Table S1). Top differentially expressed genes again included MBP itself (log2FC = –3.38, PFDR = 4.24 × 10⁻¹⁰) and MPZ (log2FC = –4.04, PFDR = 4.49 × 10⁻¹²), which were greater in the MBP region (Fig. 4). Gene set enrichment analysis identified 155 pathways that were significantly associated with MBP vs IBA1-high ROIs, including the same top pathways involved in the immune system, membrane trafficking, and vesicle-mediated transport (Supplemental Table S2).
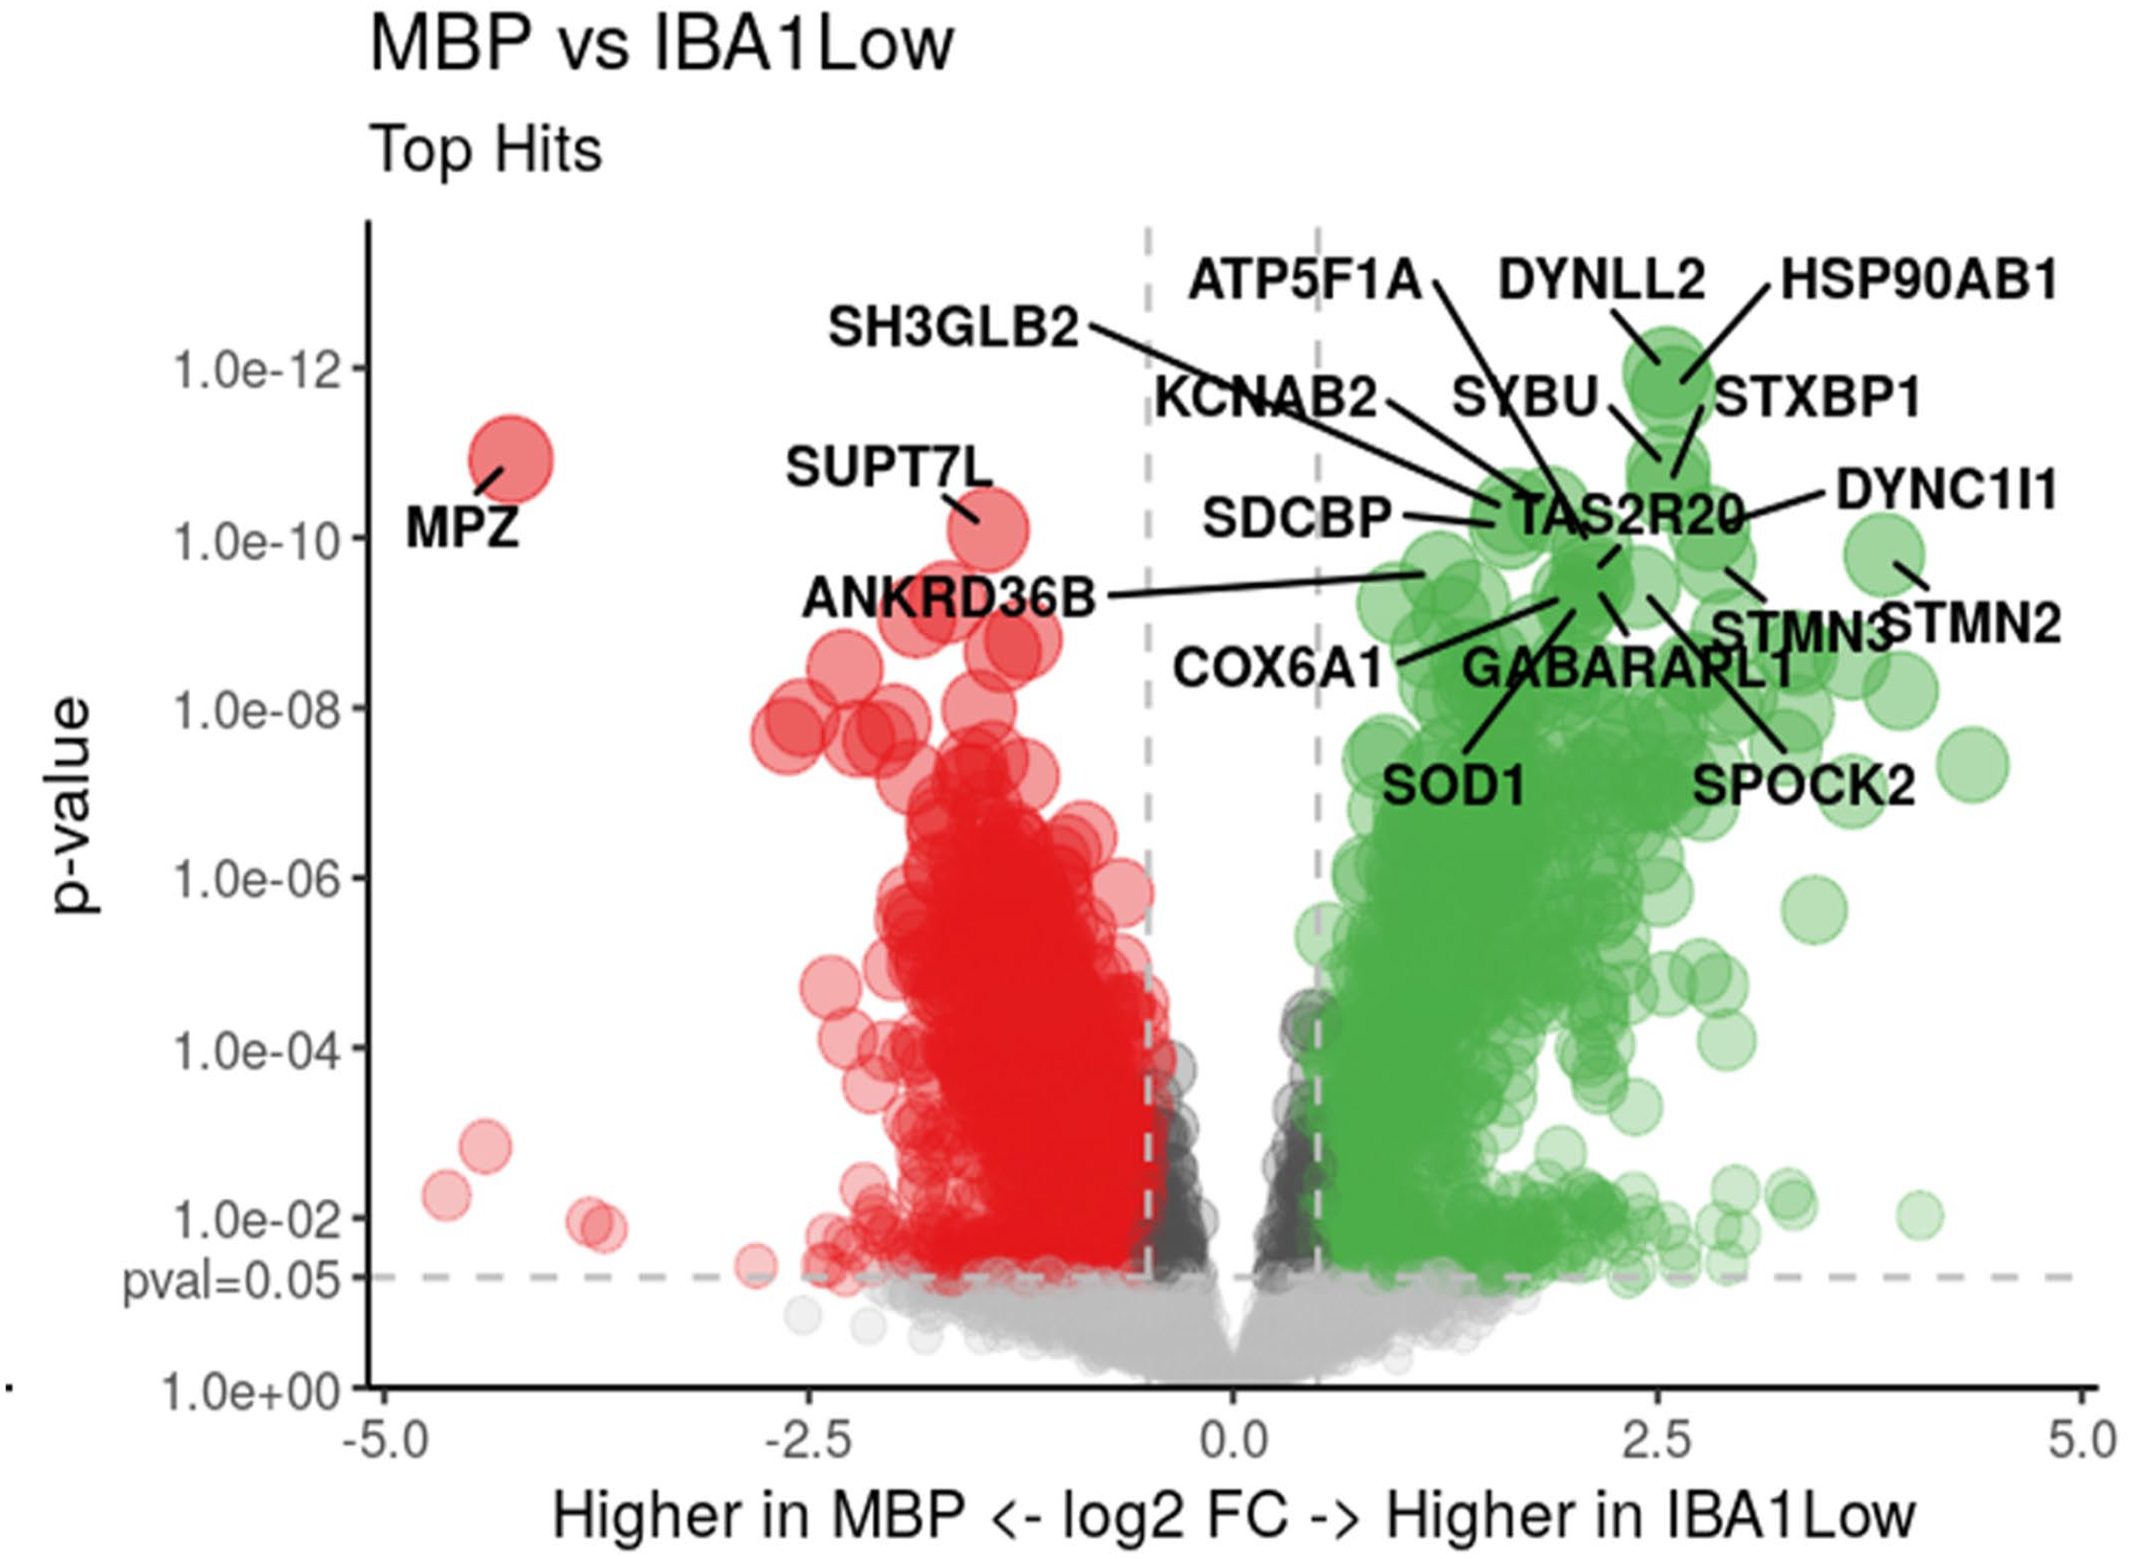
Volcano plot demonstrating significantly differentially expressed genes between myelin basic protein-rich (MBP) regions vs ionized calcium-binding adaptor molecule 1-low (IBA1-low) regions of interest in 2 healthy horse dorsal root ganglion samples. Genes in red were significantly upregulated in MBP regions and genes in green were significantly upregulated in IBA1-low regions. Genes in gray were not significantly differentially expressed at PFDR < .05. The y-axis corresponds to the PFDR value, with the dashed line denoting PFDR < .05. The x-axis is the log2 fold-change value, with the cut-off (dashed line) at –1 and +1.
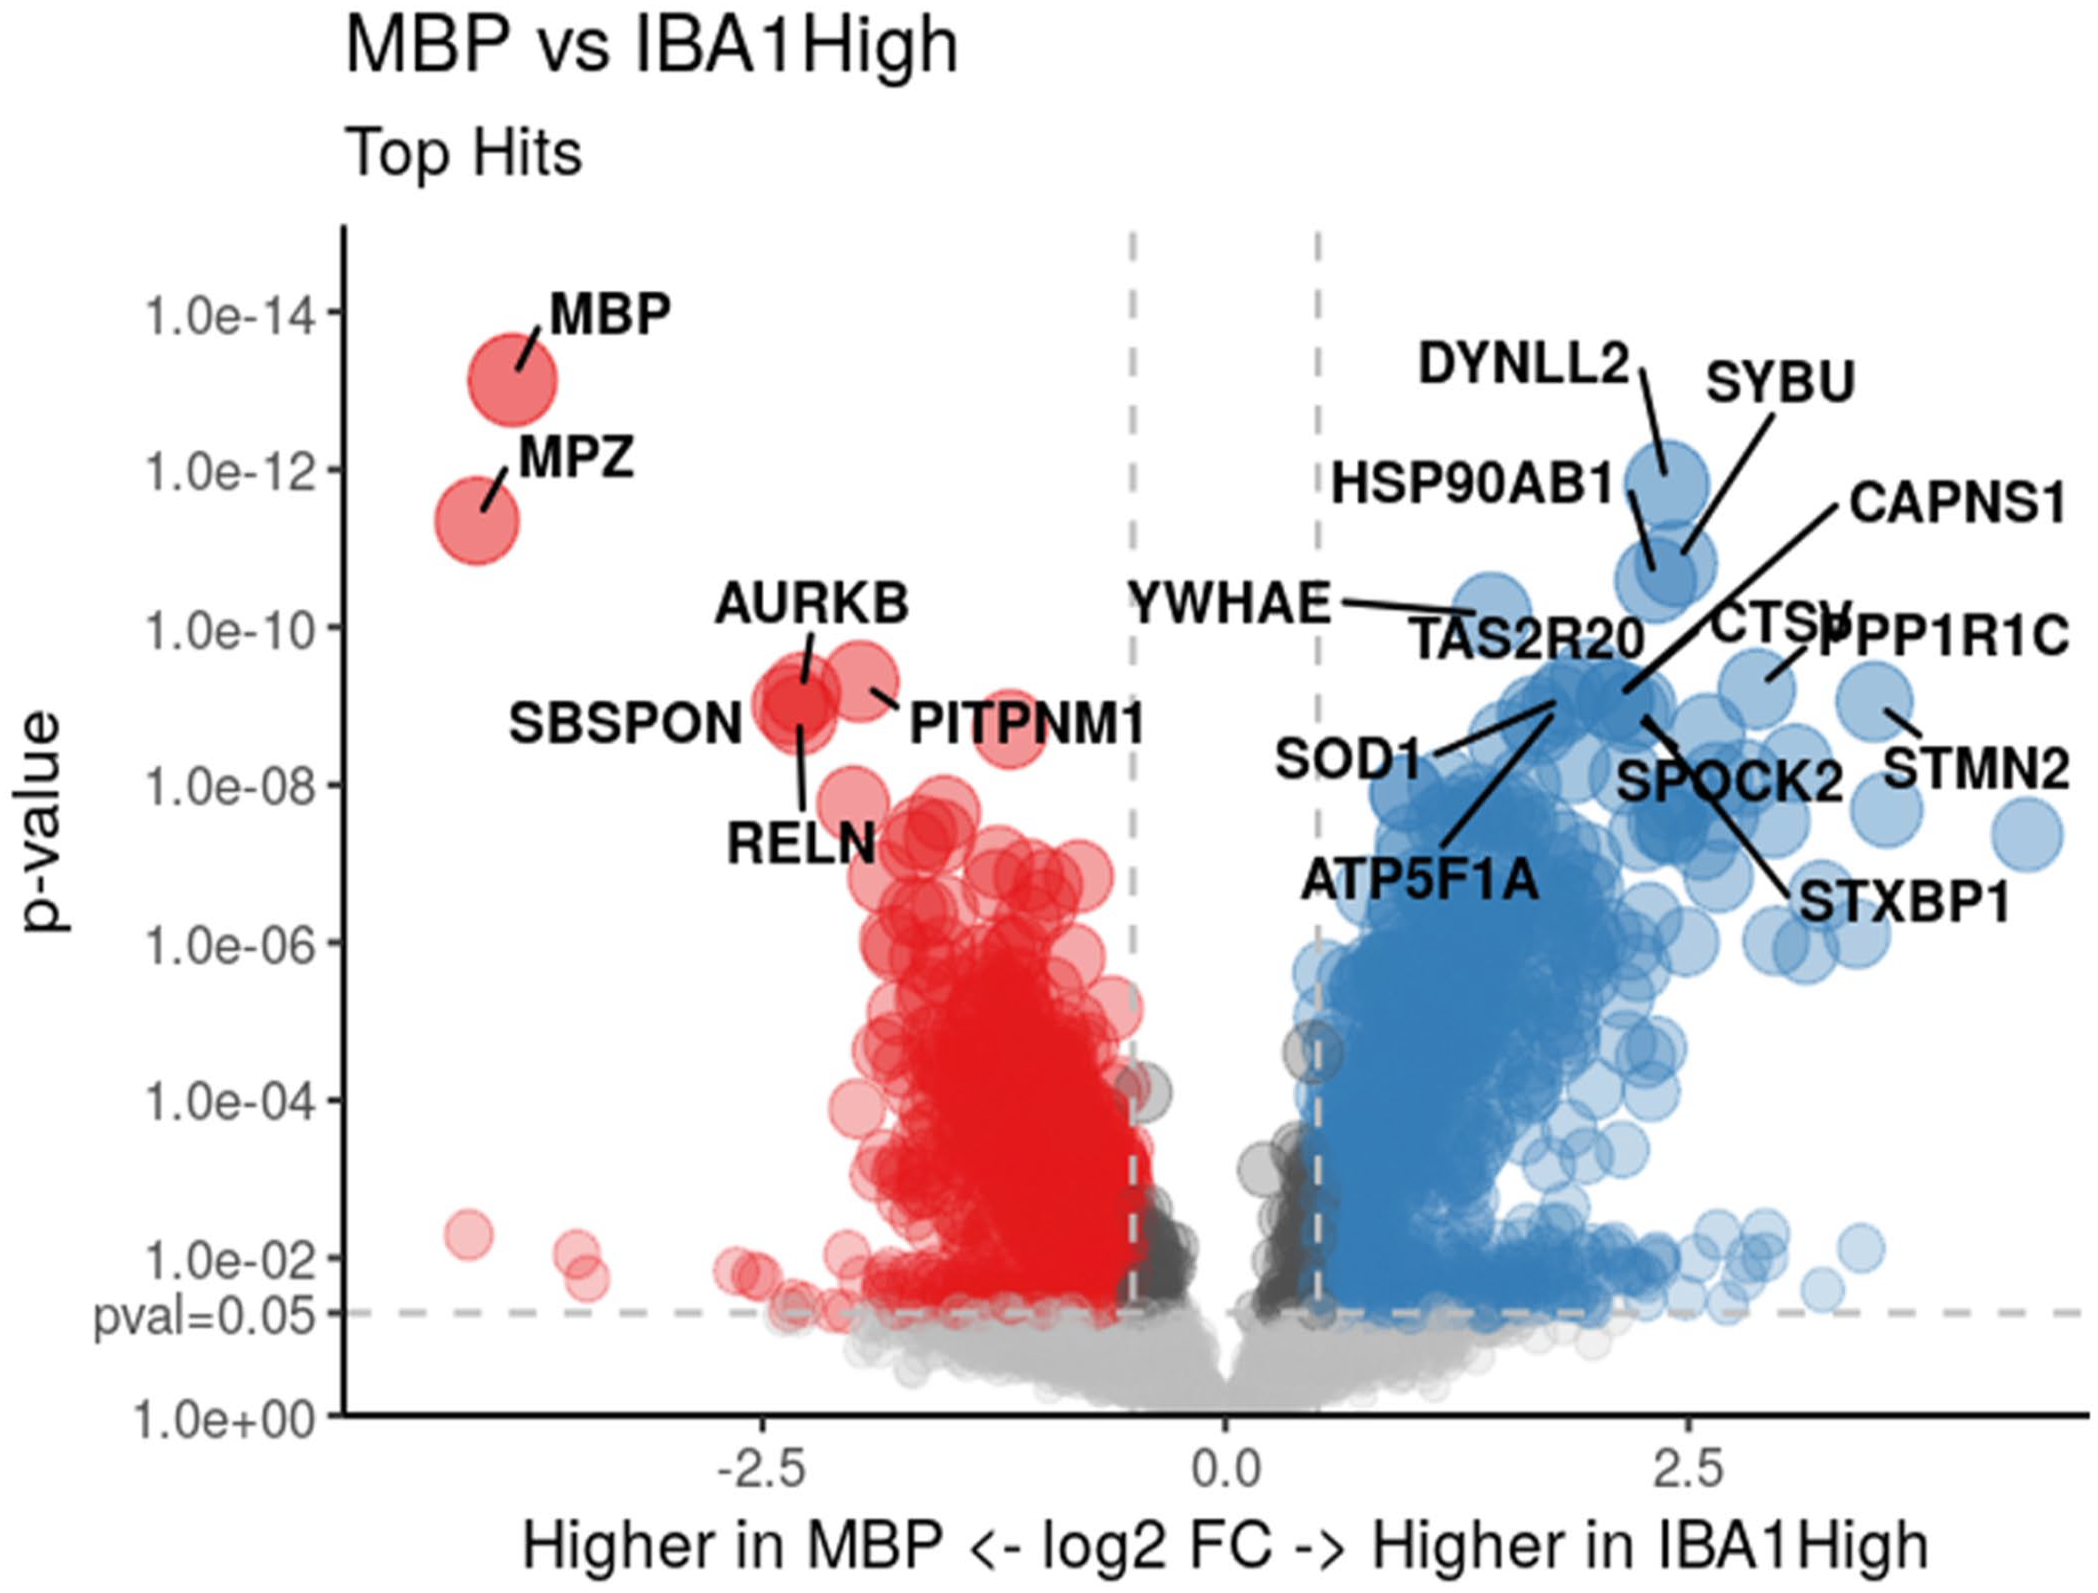
Volcano plot demonstrating significantly differentially expressed genes between myelin basic protein-rich (MBP) regions vs ionized calcium-binding adaptor molecule 1-high (IBA1-high) regions of interest in 2 healthy horse dorsal root ganglion samples. Genes in red were significantly upregulated in MBP regions and genes in blue were significantly upregulated in IBA1-high regions. Genes in gray were not significantly differentially expressed at PFDR < .05. The y-axis corresponds to the PFDR value, with the dashed line denoting PFDR < .05. The x-axis is the log2 fold-change value, with the cut-off (dashed line) at –1 and +1.
A comparison of IBA1-high vs IBA1-low ROIs failed to identify differentially expressed genes following multiple correction (Supplemental Table S1). At an uncorrected P value of < .05, top genes upregulated in IBA1-high regions included either known macrophage-specific genes (ARL17B, IRF1,and PTMA) or genes that have been associated with astrocytes and microglia (PHLDB1, DHRS3, and F3; Supplemental Fig. S2). Gene set enrichment analysis identified 74 pathways that were significantly associated with IBA1-high vs IBA1-low ROIs, including the citric acid cycle and eukaryotic translation (Supplemental Table S2).
Cell Deconvolution
The 5752 normalized genes that passed quality control were used to perform cell deconvolution using a training matrix of single-cell sequencing data and the estimated proportions of different cell types inferred for each area of interest. Cell deconvolution was successful at identifying an increased proportion of neurons in the IBA1-high and IBA1-low areas of interest vs the MBP regions (Fig. 5), with more oligodendrocytes and vascular cells identified in the MBP region and a greater proportion of classified “astrocytes” in the IBA1-high region (Fig. 6).
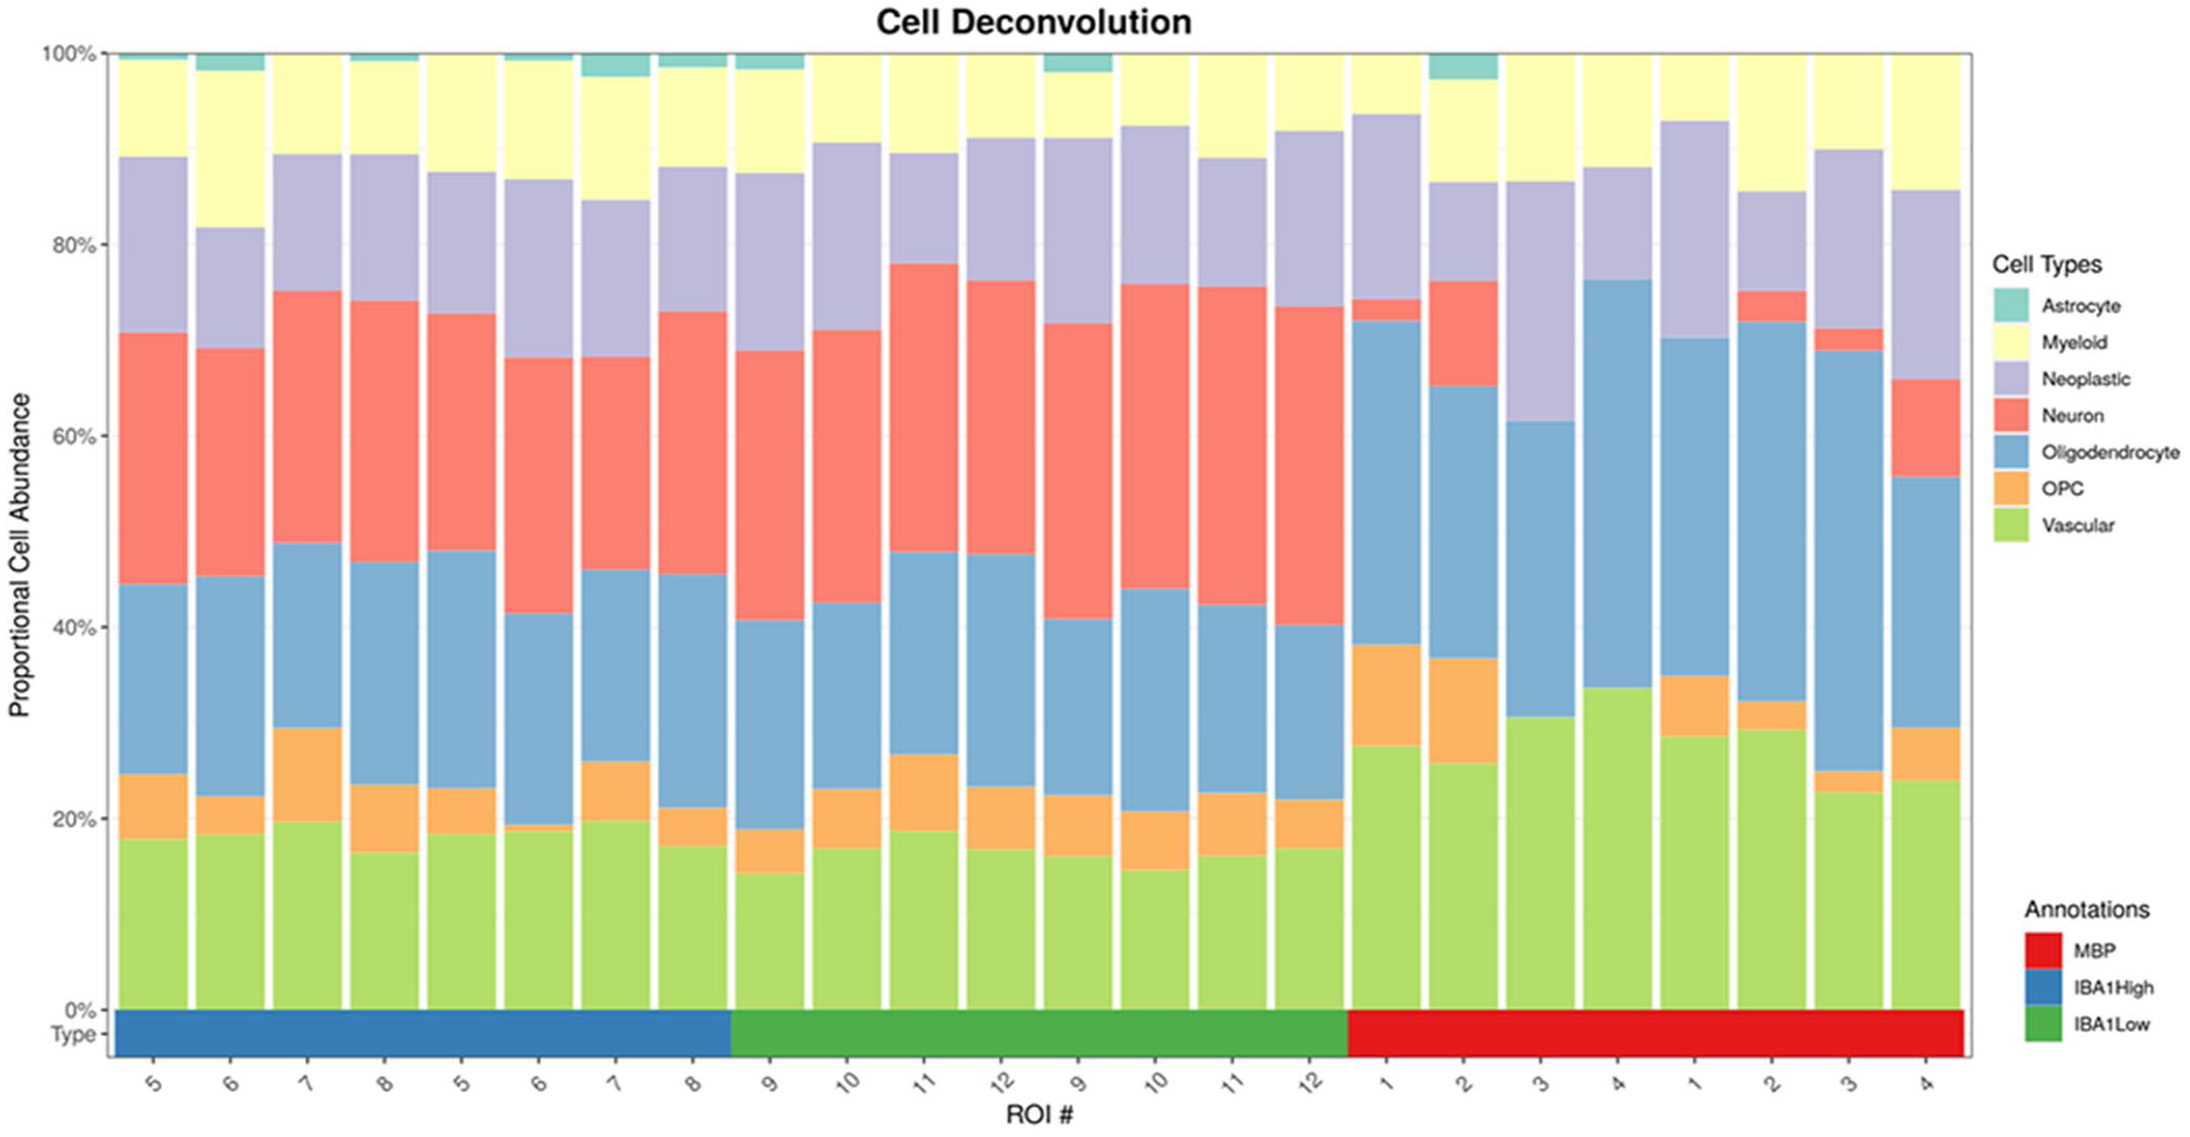
Cell deconvolution identified the estimated proportional cell abundance within each region of interest (ROIs). Regions 5 through 8 (blue) correspond to IBA1-high regions. Regions 9-12 (green) correspond with IBA1-low regions. Regions 1-4 (red) correspond with MPB regions.
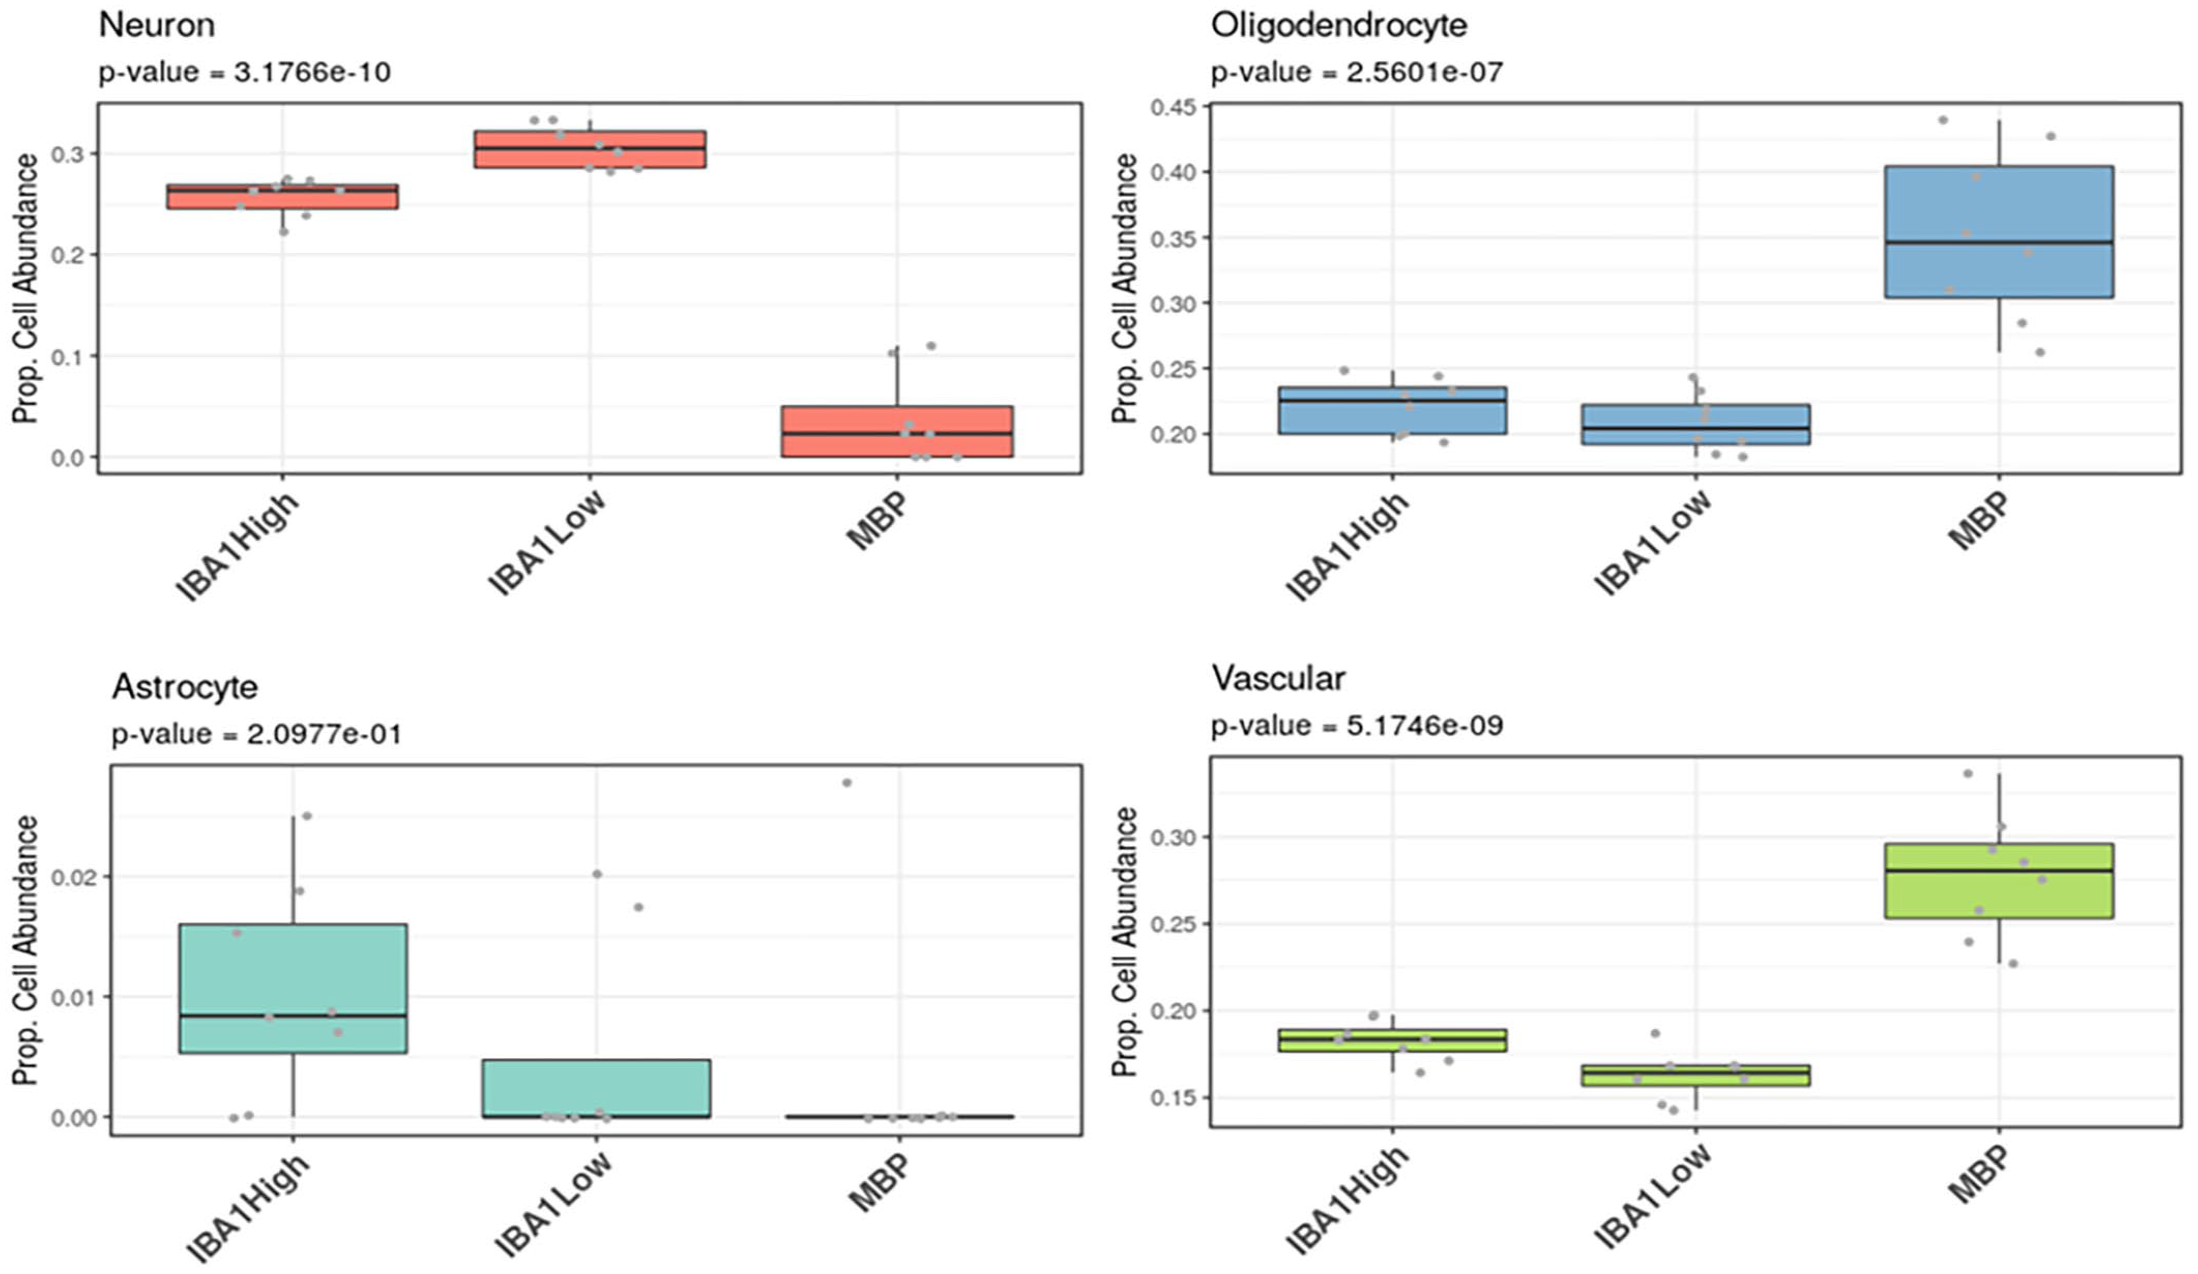
Box plots demonstrated the estimated proportional cell abundance of neurons (pink), oligodendrocytes (blue), astrocytes (teal) and vascular cells (green) across IBA1-high, IBA1-low, and myelin basic protein-rich regions in healthy equine dorsal root ganglia.
Discussion
In this proof-of-concept study, we successfully used spatial transcriptomics in equine DRG. Human morphology markers labeled and validated differential gene expression profiles between myelin-rich vs myelin-poor regions and macrophage-rich vs macrophage-poor regions in equine DRG. The successful validation enables future investigation of disease-specific transcriptomic signatures in equine neurodegenerative diseases, such as eNAD/EDM and CVCM using these same markers.
Currently, the selection of morphologic probes is required for most spatial transcriptomics assays. These probes have been validated as markers in human and/or mouse but have not been investigated across species. We selected morphologic markers that were validated in human spatial transcriptomics studies and were specific to the nervous system. Our selection of the microglial-marker, IBA1, was based on the availability of this probe from human studies within the central nervous system. Future equine DRG studies should aim to validate morphologic probes specific to satellite glial cells to assess these unique cell subtypes. In the spatial transcriptomics study that profiled cerebellar tissue in horses with Shivers, the 3 immunofluorescent markers used (calbindin EP3478/525 nm, calbindin D-4/594 nm, and parvalbumin/647nm) failed to specifically identify Purkinje cells, which were instead identified based upon their distinctive morphology. 17 Thus, morphologic probe selection and optimization should be an essential first step when conducting spatial transcriptomics studies in the horse if the goal is to clearly delineate between specific tissue regions.
Despite our success in validating these human morphologic markers, there was a substantial deficit of genes that passed the 3rd quartile normalization in 1% of areas of interest as compared with human studies. In our equine study, only 31% of genes passed quality control for subsequent differential gene expression and cell deconvolution analyses. In the cerebellar spatial transcriptomics study, a less stringent cut-off of 5% of ROIs was used and ~50% of genes met this threshold. 17 In human spatial transcriptomics studies in neural tissue, approximately 60% to 65% of genes are retained for analysis (personal communication, NanoString). Despite high conserved synteny between EquCab2.0 19 and the human genome, and a large number of orthologs identified in EquCab3.0, 11 this cross-species limitation is important to consider for future equine studies and highlights the need for species-specific gene probes to fully interrogate the spatial transcriptome in these equine studies. Additional considerations for future equine spatial transcriptomic studies are the bias that can be introduced into these types of studies based on spatial location selection. Selecting the ROIs to compare, based on fluorescent marker labeling, introduces a degree of subjective selection into spatial transcriptomic analyses. In addition, in the DRG, there are important species differences that affect transcript identification of neuronal subpopulations, especially in nociceptor molecular phenotypes. 16
While we were clearly able to demonstrate expected gene profile differences between myelin-rich regions (MBP) and neuronal regions (IBA1-high and IBA1-low), the differences that we obtained between macrophage-rich (IBA1-high) vs macrophage-poor (IBA1-low) regions were less pronounced. This is likely because these DRG samples were from healthy horses with minimal macrophage activation in these sections. In fact, the selection of IBA1-high regions was particularly challenging due to this consideration. Despite this challenge, we were still able to successfully predict an increase in what was classified as an “astrocytic” cell proportions in the IBA1-high region, as compared with the other regions using cell deconvolution.
Study limitations include the analysis of only male DRG samples with a small sample size (n = 2). Since this particular study was part of a larger Functional Annotation of Animal Genomes initiative, 15 sample collection protocols and postmortem interval timing were standardized as much as possible. Samples of DRG clustered primarily by cell type (Fig. 2) vs individual horse, demonstrating molecular similarities in cell types between horses. With the small sample size, we were unable to determine differences between the 2 healthy horses. However, we recognize the need to develop a larger set of DRG transcriptional profiles to define neurologically healthy transcriptomes across ages and sexes. Of note, there have been minimal sex differences in DRG expression identified in humans. 16 One final consideration is our profiling of thoracic spinal cord and DRG in the horse. While most pathology associated with spinal ataxia in the horse is located in the cervical spinal cord, 13 our proposed methods and findings in the thoracic cord should be applicable to all regions.
In conclusion, we have demonstrated that spatial transcriptomics can define the cell-specific RNA landscape of equine DRG using human morphologic markers. This study provides the framework to interrogate spatial gene expression profiles in equine spinal cord and DRG from horses with equine neurodegenerative diseases. The identification of these molecular signatures of CVCM and eNAD/EDM could then be used as ancillary diagnostics aiding in the correct classification of these challenging cases to advance our knowledge on these diseases.
Supplemental Material
sj-pdf-3-vet-10.1177_03009858241312623 – Supplemental material for Spatial transcriptomics defines the cell-specific RNA landscape of equine dorsal root ganglia
Supplemental material, sj-pdf-3-vet-10.1177_03009858241312623 for Spatial transcriptomics defines the cell-specific RNA landscape of equine dorsal root ganglia by Carrie J. Finno, Stefan-Laural Rogers, Callum G. Donnelly, Verena K. Affolter, Kevin Woolard, Andrew D. Miller, Rebecca R. Bellone and Jessica L. Petersen in Veterinary Pathology
Supplemental Material
sj-xlsx-1-vet-10.1177_03009858241312623 – Supplemental material for Spatial transcriptomics defines the cell-specific RNA landscape of equine dorsal root ganglia
Supplemental material, sj-xlsx-1-vet-10.1177_03009858241312623 for Spatial transcriptomics defines the cell-specific RNA landscape of equine dorsal root ganglia by Carrie J. Finno, Stefan-Laural Rogers, Callum G. Donnelly, Verena K. Affolter, Kevin Woolard, Andrew D. Miller, Rebecca R. Bellone and Jessica L. Petersen in Veterinary Pathology
Supplemental Material
sj-xlsx-2-vet-10.1177_03009858241312623 – Supplemental material for Spatial transcriptomics defines the cell-specific RNA landscape of equine dorsal root ganglia
Supplemental material, sj-xlsx-2-vet-10.1177_03009858241312623 for Spatial transcriptomics defines the cell-specific RNA landscape of equine dorsal root ganglia by Carrie J. Finno, Stefan-Laural Rogers, Callum G. Donnelly, Verena K. Affolter, Kevin Woolard, Andrew D. Miller, Rebecca R. Bellone and Jessica L. Petersen in Veterinary Pathology
Footnotes
Author Contributions
CJF, SR, and CGD contributed to conception and design of the study. CJF, CGD, RRB, JLP, VKA, and KW performed sample collections. KW, VKA, and ADM completed the histologic evaluation. SR performed the statistical analysis. CJF wrote the first draft of the manuscript. All authors contributed to manuscript revision, read and approved the final submitted version.
Declaration of Conflicting Interests
The author(s) declared the following potential conflicts of interest with respect to the research, authorship, and/or publication of this article: SR was employed by NanoString Technologies. Other authors have no competing interests to disclose.
Funding
The author(s) disclosed receipt of the following financial support for the research, authorship, and/or publication of this article: This project was supported by the Grayson-Jockey Club Research Foundation (CJF, JLP, and RRB), USDA National Institute of Food and Agriculture Animal Breeding and Functional Annotation of Animal Genomes (A1201) Grant 2019-67015-29340 (JLP, CJF, and RRB) as well as NRSP-8 Species Coordinator Funds from the USDA, National Institute of Food and Agriculture (CJF, JLP, and RRB), and the UC Davis Center for Equine Health with funds provided by the State of California pari-mutuel fund and contributions by private donors (CJF, JLP, and RRB). Additional support for CJF was provided by NIH NCATS L40 TR001136. The funders had no role in study design, data collection and analysis, decision to publish, or preparation of the manuscript.
Data Availability
Spatial transcriptomics data sets for this study can be obtained by request to the corresponding author.
Supplemental material for this article is available online.
References
Supplementary Material
Please find the following supplemental material available below.
For Open Access articles published under a Creative Commons License, all supplemental material carries the same license as the article it is associated with.
For non-Open Access articles published, all supplemental material carries a non-exclusive license, and permission requests for re-use of supplemental material or any part of supplemental material shall be sent directly to the copyright owner as specified in the copyright notice associated with the article.