
Abstract
High-grade oligodendroglioma (HGOG) is the most common type of glioma in dogs and expresses platelet-derived growth factor receptor-α (PDGFR-α). Microvascular proliferation is often observed in HGOG. Therefore, the present study investigated the functional relationships between PDGFR-α, microvascular proliferation, and tumor cell proliferation in canine HGOG. The expression of PDGFR-α and PDGF-subunit A (PDGF-A) in tumor cells, as well as endothelial cells and pericytes of tumor-associated microvascular proliferations, in 45 canine HGOGs were examined immunohistochemically. Microvascular proliferation was observed in 24/45 cases (53%). PDGFR-α expression in tumor cells and microvascular proliferations was observed in 45/45 (100%) and 2/24 cases (8%), respectively. Furthermore, PDGF-A expression in tumor cells and microvascular proliferations was detected in 13/45 (29%) and 24/24 cases (100%), respectively. In vitro, stimulation of the canine HGOG cell line AOFB-01 with PDGF-A showed that the doubling time of AOFB-01 cells was significantly shorter with PDGF-A than without PDGF-A. Crenolanib (a PDGFR inhibitor) inhibited AOFB-01 cell proliferation. In vivo, the AOFB-01 xenograft mouse model was treated with crenolanib. Tumor xenografts were smaller in crenolanib-treated mice than in untreated control mice. PDGFR-α expression in tumor cells and PDGF-A expression in microvascular proliferations and tumor cells suggest autocrine and paracrine effects of PDGF-A in canine HGOG. The results of in vitro assays indicate that canine HGOG expresses functional PDGFR-α, which responds to PDGF-A. Therefore, PDGF-A produced by microvascular proliferations and tumor cells may promote the proliferation of PDGFR-α-expressing tumor cells in canine HGOG. PDGFR-α signaling has potential as a therapeutic target.
Keywords
More than 50% of canine gliomas are high-grade oligodendrogliomas (HGOGs).21,23 Canine oligodendrogliomas express oligodendrocyte precursor cell (OPC) markers, such as platelet-derived growth factor receptor-α (PDGFR-α).22,55 PDGFR-α plays a role in cell proliferation and the migration of OPCs in the developing mouse brain.11,19,57 PDGFR-α has also been associated with human gliomagenesis, and the amplification and mutation of the PDGFRA gene have been reported in human and canine gliomas.3,9,39,40 Human PDGFRA mutations are oncogenic in mouse astrocytes and are associated with an oligodendroglioma-like appearance in human glioblastoma.39,40 In mice, oligodendroglioma-like lesions are induced by the overexpression of, or long-term exposure to, PDGF-subunit A (PDGF-A), a ligand for PDGFR-α.20,35 However, the role of PDGFR-α in canine oligodendrogliomas is unclear.
Microvascular proliferation, a key feature of histological malignancy, is often observed in canine and human high-grade gliomas.22,23,53 Microvascular proliferation in human gliomas involves endothelial cells and pericytes,42,48 which express PDGF-A, PDGF-subunit B (PDGF-B), and platelet-derived growth factor receptor-β (PDGFR-β).5,16,17 In addition, tumor cells in human gliomas variably express PDGF-A, PDGF-B, and PDGFR-α.5,16,17,30,34,37 Some human glioma tissues and cell lines also express PDGFR-β.27,48 Therefore, autocrine and paracrine systems are considered to be involved in tumor proliferation.34,37 PDGFR and PDGF expression has been examined in various canine tumors. 13 While PDGFR-α expression of oligodendroglioma tumor cells has been characterized in dogs,7,18,22 PDGF-A expression in oligodendroglioma tumor tissue and the relationship between PDGFR-α and PDGF-A have not yet been investigated in dogs.
Therefore, the present study investigated whether PDGFR-α is functionally associated with tumor proliferation in canine HGOG and evaluated its potential as a therapeutic target. The expression of PDGFR-α and PDGF-A in tumor cells and cells involved in microvascular proliferation was immunohistochemically analyzed in tumor tissues collected from canine HGOGs. We also examined the function of PDGFR-α in a canine HGOG-derived cell line (AOFB-01) 22 by stimulating PDGFR-α and comparing the cell-doubling time in vitro. To assess the effects of crenolanib, a PDGFR-α inhibitor, on tumor growth, the 50% inhibitory concentration (IC50) and PDGFR-α expression levels under different conditions were assessed in vitro, and a xenograft mouse model was assessed. Taken together, we tested the hypothesis that PDGFR-α expression in oligodendroglioma cells and microvascular proliferation are associated with tumor cell proliferation.
Materials and Methods
Tissue Sample Collection and Histopathology
Forty-five canine HGOGs (7 necropsy and 38 biopsy cases) were collected from the archives of the Department of Veterinary Pathology, Graduate School of Agricultural and Life Sciences, University of Tokyo between 2013 and 2022 through electronic database searches using the term “oligodendroglioma.” Some cases with small tissue samples and poor fixation quality were omitted. Samples were fixed in 10% phosphate-buffered formalin, embedded in paraffin, sectioned at a thickness of 4 μm, and stained with hematoxylin and eosin. The histological classification and grading of tumors were based on the criteria of the National Cancer Institute-led multidisciplinary Comparative Brain Tumor Consortium. 23 HGOG was diagnosed when the following findings were observed: tumor cells with scant to moderate eosinophilic or lost cytoplasm and round nuclei and necrosis, microvascular proliferation, mitoses (assessed in ten 400× fields [2.37 mm2]), and/or atypia. 23 All cases were diagnosed by consensus among KY (DVM), JKC (DVM, JCVP, PhD), and KU (DVM, JCVP, PhD). Microvascular proliferation was scored as + or –. If at least 1 microvascular proliferation was observed, the case was scored as +. Microvascular proliferation was defined as follows, based on the same criteria used for histologic classification: 23 convoluted, glomeruloid vasculature; multilayered, hypertrophied endothelial cells; or arcades of vasculature.
Immunohistochemical Analysis
Forty-five canine HGOG samples were subjected to immunohistochemistry (IHC). Deparaffinized tissue sections were incubated with 3% hydrogen peroxide in methanol at room temperature for 5 minutes to prevent endogenous reactions. After antigen retrieval, sections were incubated in 4% skim milk in Tris-buffered saline (pH = 7.6) at 37°C for 45 minutes to prevent nonspecific reactions. Antigen retrieval conditions are summarized in Supplemental Table S1. Sections were incubated with the primary antibody at 4°C overnight. Primary antibodies were PDGFR-α (Cell Signaling Technology, Danvers, Massachusetts, USA, #3136) and PDGF-A (Santa Cruz, Dallas, Texas, USA, sc-9974) (Supplemental Table S1). An anti-mouse immunoglobulin G (IgG) or anti-rabbit IgG polymer labeled with horseradish peroxidase (Envision+, Agilent Technology) was applied at 37°C for 45 minutes. The antigen-antibody complex was visualized with 0.05% 3-3′-diaminobenzidine and 0.03% hydrogen peroxide in Tris-hydrochloric acid buffer. Mayer’s hematoxylin was used as a counterstain. The IHC results of tumor cells for PDGFR-α and PDGF-A were graded as follows: 0, no immunolabeled cells; 1, < 25% immunolabeled cells; 2, 25%–75% immunolabeled cells; and 3, > 75% immunolabeled cells. In cases that had microvascular proliferation, the expression of PDGFR-α and PDGF-A in endothelial cells and/or pericytes involved in the microvascular proliferation was evaluated as + or –. As a negative control, the primary antibody was replaced with an isotype-matched irrelevant antibody. A known case of PDGFR-α-expressing oligodendroglioma was used as a positive control for PDGFR-α.22,55 Meningeal cells were used as a positive control for PDGF-A. 44
To assess the proliferative activity between tumor cells around microvascular proliferations and tumor cells without microvascular proliferations, Ki-67 IHC was performed, as described above, in 10 canine HGOG cases (cases 1, 2, 6, 7, 9, 11, 13, 16, 30, and 34) that had sufficient tumor tissue with and without microvascular proliferation. Necropsy cases without immunolabeling for Ki-67, possibly due to altered fixation, were excluded. Primary antibody was Ki-67 (Dako, Glostrup, Denmark, N1633) (Supplemental Table S1). Three images of tumor cells without and around microvascular proliferations were captured using 40× objectives (0.237 mm2). The images were analyzed using the positive cell detection algorithm of QuPath image analysis (version 0.4.4, Edinburgh, Scotland, UK). The ratio of Ki-67 immunolabeled cells to counted cells was calculated as the Ki-67 labeling index. Then, the ratio of Ki-67 labeling index of tumor cells around microvascular proliferations to that without microvascular proliferations was calculated.
Dual Immunofluorescence for Tumor Tissues
To verify the composition of cells in microvascular proliferations, 5 canine HGOG cases (cases 6, 13, 23, 33, and 41) were selected based on sufficient available tumor tissue and subjected to dual immunofluorescence. Dual immunofluorescence was performed using the following combinations: cluster of differentiation 31 (CD31) (Novus Biological, Centennial, Colorado, USA, NBP1-35530)/PDGF-A, PDGF-A/α-smooth muscle actin (SMA) (Cell Signaling Technology, #19245), PDGFR-β (Santa Cruz, sc-374573)/SMA, and PDGFR-β/PDGFR-α. Detailed primary antibody information is summarized in Supplemental Table S2. After antigen retrieval, sections were incubated in 4% skim milk in Tris-buffered saline at 37°C for 45 minutes to prevent nonspecific reactions. Antigen retrieval conditions are summarized in Supplemental Table S2. Sections were incubated with a primary antibody cocktail at 4°C overnight. They were then incubated with Alexa Fluor 594-labeled donkey anti-rabbit IgG, Alexa Fluor 594-labeled goat anti-mouse IgG, Alexa Fluor 488-labeled goat anti-rabbit IgG, or Alexa Fluor 488-labeled goat anti-mouse IgG (Thermo Fisher Scientific) at 37°C for 1 hour. The secondary antibody was diluted 1:400. As a counterstain, 4′,6-diamidino-2-phenylindole (Vectashield; Vector Laboratory) was used. Sections were observed under a laser scanning confocal microscope (LSM700, Zeiss). All images were captured in a single region of interest with 60× objectives. As a negative control, the primary antibody was replaced with an isotype-matched irrelevant antibody. A known case of PDGFR-α-expressing oligodendroglioma was used as a positive control for PDGFR-α.22,55 Vasculature was used as an internal positive control for CD31 and SMA expression. A case of PDGFR-β-expressing meningioma was used as a positive control for PDGFR-β. 44
IHC of the AOFB-01 Cell Line
IHC was conducted using the primary antibodies for oligodendrocyte transcription factor 2 (OLIG2) (Merck, Rahway, New Jersey, USA, MABN50), glial fibrillary acidic protein (GFAP) (Santa Cruz, sc-33673), 2′,3′-cyclic-nucleotide 3′-phosphodiesterase (CNPase) (Merck, MAB326), PDGFR-α, PDGF-A, β3-tubulin (Promega, Fitchburg, Massachusetts, USA, G712A), neuronal nuclear (NeuN) (Abcam, Cambridge, UK, ab177487), synaptophysin (Dako, M7315), nestin (IBL, Gunma, Japan, #18741), and sex-determining region Y-box transcription factor 2 (SOX2) (Abcam, ab92494). Detailed primary antibody information is summarized in Supplemental Table S1. In IHC, AOFB-01 cells were cultured in Matrigel (Corning) on a 24-well plate, as previously described. 55 AOFB-01 cell colonies were fixed with 4% paraformaldehyde, embedded in paraffin, and sectioned at a thickness of 4 μm. IHC procedures were the same as those described in the “Immunohistochemical Analysis” section.
In Vitro Assay of PDGF-A Effects on AOFB-01 Cells
AOFB-01 cells were cultured at 1 × 10³ cells in 24-well plates at 37°C in a humidified incubator at 5% CO2 and were maintained in Dulbecco’s Modified Eagle Medium: Nutrient Mixture F-12 (Gibco) with 10% fetal bovine serum (Cytiva) and 1% antibiotics (penicillin-streptomycin, Fujifilm). The wells were separated into 2 groups. One group was treated with human PDGF-A (Gibco) solubilized in distilled water, and the final concentration of PDGF-A in medium was 20 ng/mL. Only distilled water equal to the volume of PDGF-A solution was added to the other group. Media were exchanged every 2 days to add fresh growth factor. The number of cells was counted manually using a hemocytometer at 2, 4, 6, 8, 10, 12, and 14 days after the initiation of cell cultures. This experiment was conducted in triplicate. A growth curve was constructed, and the cell population doubling time in the exponential growth phase was calculated using the least squares method. The average cell-doubling time with or without PDGF-A was examined using Student’s t-test. The significance of differences was set at P < .05. Data are presented as the mean ± standard deviation (SD).
AOFB-01 cells were also cultured at 100 cells per well in 96-well plates as described above and separated into 2 groups with 20 ng/mL PDGF-A or distilled water only. Each group consisted of 9 wells. Media were exchanged every 2 days to add fresh growth factor. On day 8, the CCK-8 solution (Cell Counting Kit-8, DOJINDO) was added to each well and allowed to stand for 2 hours to color. Absorbance was measured using an iMark microplate reader (Bio-Rad Laboratories). Negative control wells were prepared without tumor cells. Average absorbance with or without PDGF-A was tested using Student’s t-test. The significance of differences was set at P < .05. Data are shown as the mean ± SD.
In Vitro PDGFR-α Inhibition of AOFB-01 Cells
AOFB-01 cells were cultured at 5000 cells per well in 96-well plates, as described above. After a 4-hour preincubation, cells were treated for 48 hours with different concentrations of crenolanib, a selective inhibitor of PDGFR (Abcam or ChemScene) (0–20 μM), or lomustine, a nitrosourea anticancer drug (FUJIFILM Wako Pure Chemical) (0–150 μM). A stock solution of lomustine was dissolved in dimethyl sulfoxide (DMSO; Nacalai Tesque) at 200 mM and crenolanib at 25 mM. After cultivation, cell viability was measured using Cell Counting Kit-8, and absorbance was measured using an iMark microplate reader. This experiment was performed in triplicate and repeated 3 times. Negative control wells were prepared without tumor cells. Average absorbance was calculated by subtracting the absorbance of the negative controls. The dose-response curve and IC50 were calculated using R version 4.2.0 (The R Foundation for Statistical Computing). Data are shown as the mean ± standard error.
AOFB-01 cells were cultured at a density of 2.5 × 10⁵ cells in 60-mm dishes as described above. After a 4-hour preincubation, cells were treated with 10 μM crenolanib in 0.1% DMSO or vehicle (0.1% DMSO) for 48 hours. Whole-cell lysates were extracted using a radioimmunoprecipitation lysis buffer system and subjected to a Western blot analysis.
Western Blotting
Crenolanib-treated and DMSO-treated AOFB-01 cell lysates (10 μg protein) were analyzed in triplicate. Lysates were boiled at 95°C for 5 minutes, separated using a 5%–20% gradient polyacrylamide gel (e-PAGEL, Atto Corporation), and transferred to a polyvinylidene fluoride membrane (Immobilon-P transfer membrane, Millipore). Membranes were stained with Ponceau S and washed in Tris-buffered saline containing 0.05% Tween 20. To prevent nonspecific reactions, membranes were incubated in Tris-buffered saline containing 0.05% Tween 20 with 1% skim milk at room temperature for 1 hour. Primary antibodies were applied twice using Restore Western Blot Stripping Buffer (Thermo Scientific) at room temperature for 20 minutes. Primary antibodies for PDGFR-α and β-actin (Cell Signaling Technology, #12262) were used. Other information on primary antibodies and immunoblotting conditions are summarized in Supplemental Tables S1 and S3. PDGFR-α expression levels were calculated based on band intensities using the following equation: PDGFR-α expression level = PDGFR-α/β-actin. Band intensities were analyzed using Image Lab Software (Bio-Rad). PDGFR-α expression levels were tested using Student’s t-test. The significance of differences was set at P < .05. Data are shown as the mean ± SD.
Western blotting of AOFB-01 cells was performed as described above using the primary antibodies for OLIG2, GFAP, CNPase, PDGFR-α, PDGF-A, β3-tubulin, NeuN, synaptophysin, nestin, and SOX2. Detailed primary antibody information is summarized in Supplemental Table S1.
Mouse Xenograft Model Analysis
Nine, 6-week-old, female immunodeficient mice (NOD/Shi-scid, IL-2Rγ KO Jic [NOG mouse]; CLEA Japan) were used. AOFB-01 cells (1 × 10⁶) were diluted with 200 μL Hanks’ balanced salt solution and subcutaneously injected into the lower back of NOD/Shi-scid, IL-2Rγ KO (NOG) mice. When the major axis of the mass was 5–6 mm, mice were divided into a crenolanib-treated group (n = 3), lomustine-treated group (n = 3), and control group (n = 3). Crenolanib in DMSO was diluted in physiological saline, and mice were intraperitoneally injected with the drug (10% DMSO, 15 μg/g/day, every day for 4 weeks). Lomustine in DMSO was diluted in physiological saline, and mice were intraperitoneally injected with the drug (10% DMSO, 20 μg/g/day, once a week for 4 weeks). Mice in the control group were intraperitoneally injected with physiological saline with 10% DMSO (every day for 4 weeks). A drug treatment plan was decided based on the results of in vitro experiments and previous findings.51,54,56 Tumor volumes were measured once a week using a digital caliper, and the following equation was used: tumor volume (mm3) = (length × width2)/2. Body weights were evaluated once a week using an electronic scale. All mice were euthanized with isoflurane the day after the last injection. Tumor masses and major organs were collected. Tumor volumes on day 29 in each group were compared using a one-way analysis of variance and Dunnett’s test using R version 4.2.0. The significance of differences was set at P < .05. Collected organs and masses were fixed in 10% phosphate-buffered formalin, embedded in paraffin, sectioned at a thickness of 4 μm, and stained with hematoxylin and eosin. Histologic features, such as tumor cellular and nuclear morphology, and atypia were evaluated. Xenografts were also subjected to IHC as described above. Primary antibodies for OLIG2, GFAP, CNPase, PDGFR-α, PDGF-A, β3-tubulin, NeuN, synaptophysin, nestin, and SOX2 were used. Animal experiments were approved by the Institutional Committee of Animal Experiments (approval number P20-083m02).
Validation of Primary Antibodies Used
The specificities of the antibodies used for OLIG2, CNPase, PDGFR-α, PDGFR-β, β3-tubulin, NeuN, synaptophysin, and nestin were validated by Western blotting in previous studies.44,55 The anti-GFAP (clone 2E1) antibody was validated by Western blotting using a normal canine brain tissue (13 years–9 months old, neutered female, toy poodle) stored at –80°C as described above (Supplemental Fig. S1). Anti-PDGF-A and SOX2 antibodies were validated by Western blotting results using AOFB-01 cells (Supplemental Fig. S4). Anti-CD31 and SMA antibodies were immunohistochemically validated by evaluating the vasculature in tissue as an internal positive control because these antigens are well-known in the veterinary literature.
Results
Histopathology of Tumor Tissues
Tumors showed high cellularity and a solid growth pattern. Tumor cells were round to polygonal with minimal eosinophilic cytoplasm. Nuclei were round or cleaved with dense and coarse chromatin. Marked anisocytosis and anisokaryosis were observed. The average mitotic count was 3.0 (range: 0–17) in ten 400× fields (2.37 mm2). Microvascular proliferation was observed in 24/45 cases (53%). Necrosis was observed in 15/45 cases (33%).
Immunohistochemical results for tumor tissues are summarized in Supplemental Table S4. The membrane and cytoplasm of tumor cells immunolabeled for PDGFR-α in 45/45 cases (100%) (average score: 2.6), whereas the membrane and cytoplasm of endothelial cells and/or pericytes involved in microvascular proliferations immunolabeled for PDGFR-α in 2/24 cases (8%) (Fig. 1a, Tables 1 and 2). The cytoplasm of tumor cells immunolabeled for PDGF-A in 13/45 cases (29%) (average score: 0.4), whereas the cytoplasm of endothelial cells and/or pericytes involved in microvascular proliferations immunolabeled for PDGF-A in 24/24 cases (100%) (Fig. 1b, Tables 1 and 2). In 4/45 cases, tumor cells showed marked immunolabeling for PDGF-A above score 1 (Fig. 1c, Table 1). The PDGFR-α immunolabeling patterns were not different in biopsy cases. However, in 4/5 (80%) necropsy cases with microvascular proliferations, tumor cells around microvascular proliferations showed higher intensity of PDGFR-α immunolabeling than tumor cells without microvascular proliferations (Supplemental Fig. 2a, b). No obvious differences in PDGF-A immunolabeling patterns were observed.
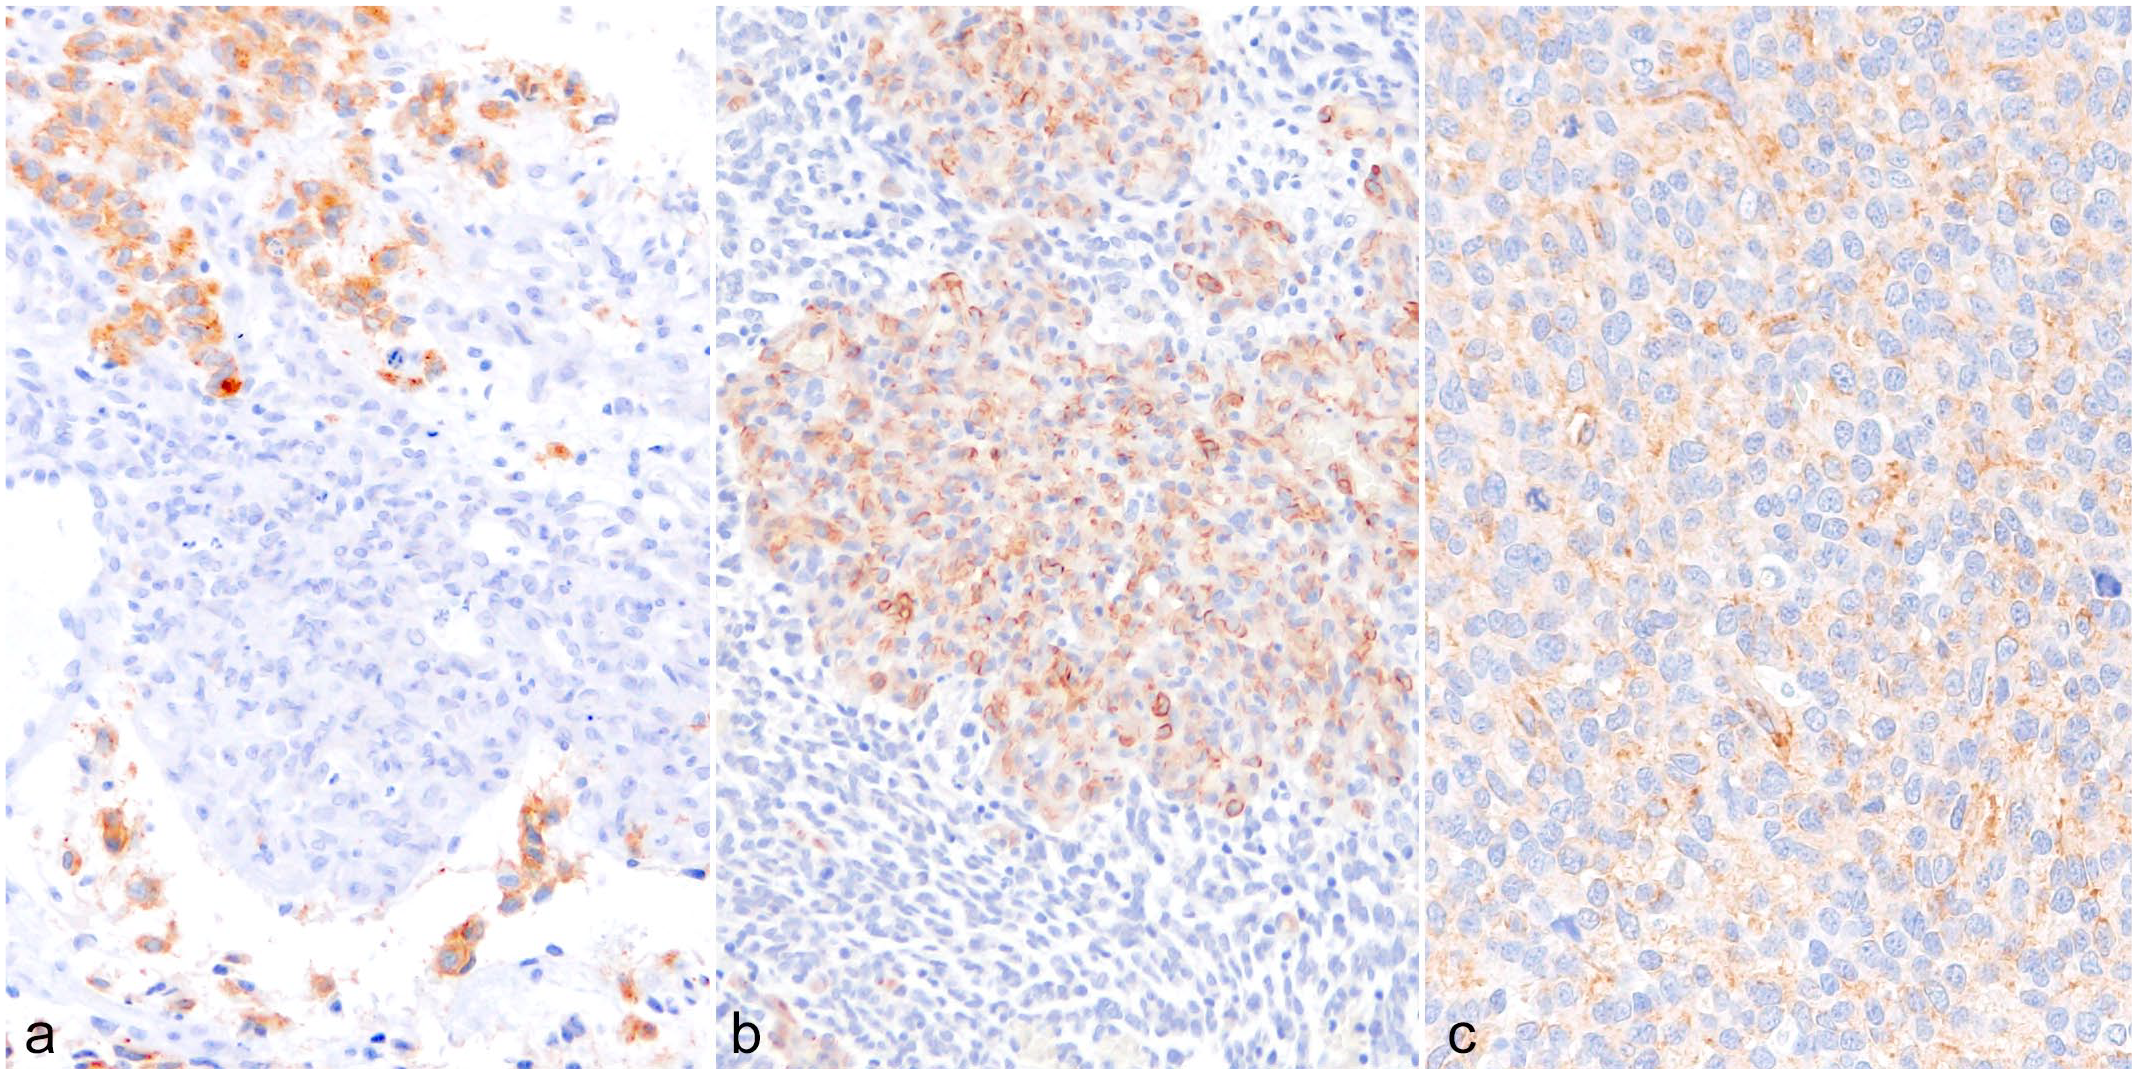
High-grade oligodendroglioma, brain, dog. Immunohistochemistry. (a) The membrane and cytoplasm of tumor cells are immunolabeled for platelet-derived growth factor receptor-α (PDGFR-α), whereas cells of the microvascular proliferation are not. Case 23. (b) The cytoplasm of cells of the microvascular proliferation is immunolabeled for platelet-derived growth factor-subunit A (PDGF-A), whereas tumor cells are not. Case 6. (c) The cytoplasm of tumor cells shows strong immunolabeling for PDGF-A (score 3). Case 5.
Summary of immunohistochemical scoring for tumor cells.
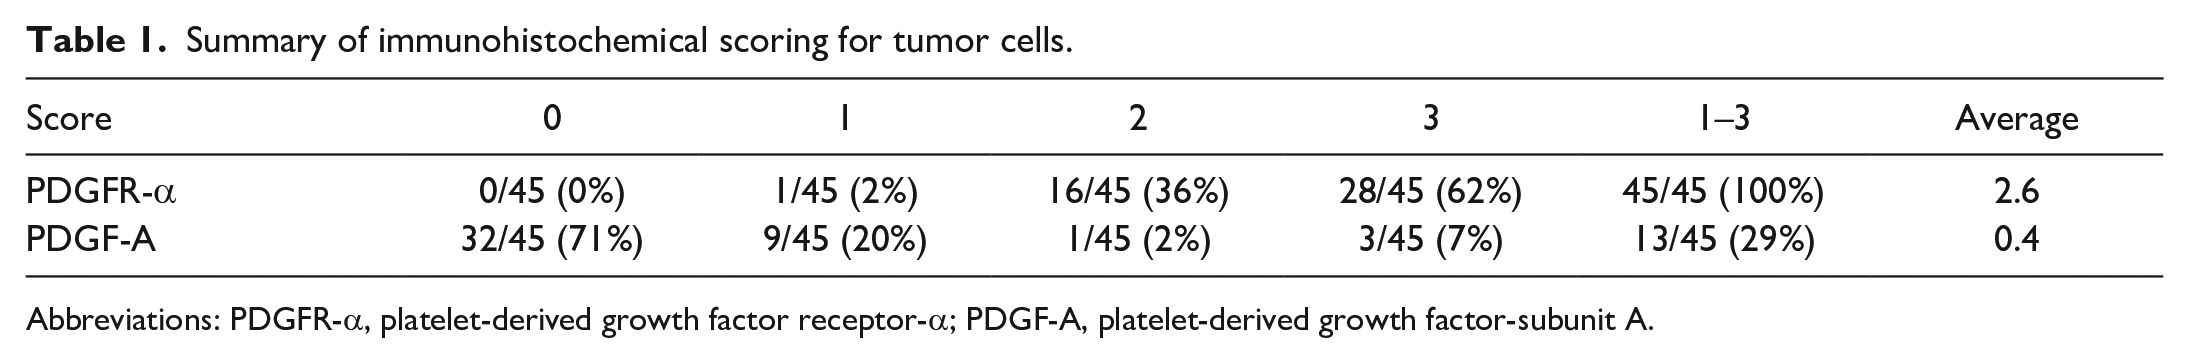
Abbreviations: PDGFR-α, platelet-derived growth factor receptor-α; PDGF-A, platelet-derived growth factor-subunit A.
Summary of histopathology and immunohistochemistry results for microvascular proliferation.
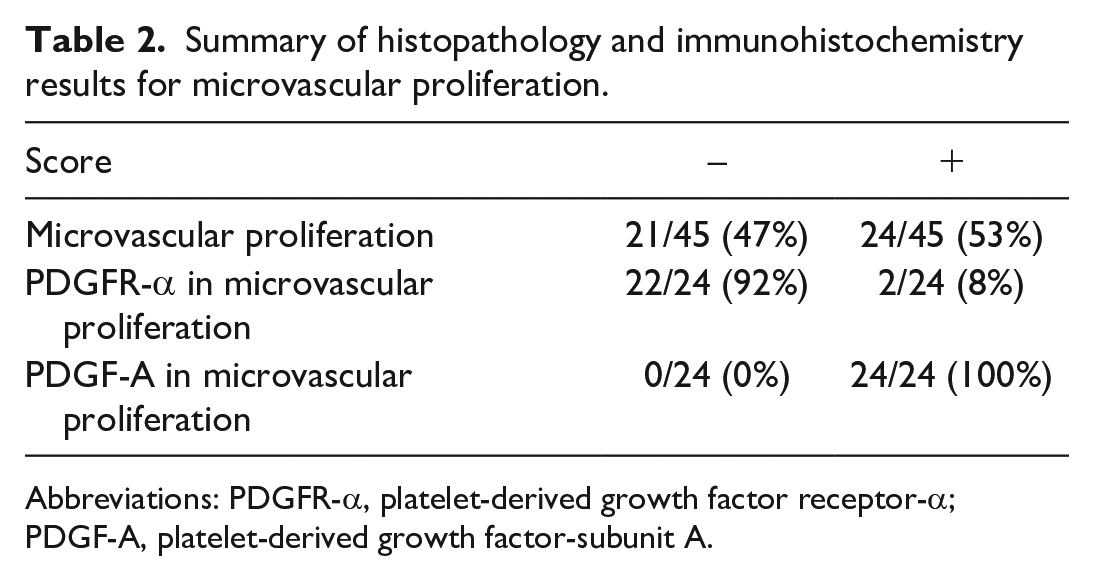
Abbreviations: PDGFR-α, platelet-derived growth factor receptor-α; PDGF-A, platelet-derived growth factor-subunit A.
Results of Ki-67 labeling index are shown in Supplemental Table S5. The average Ki-67 labeling index of tumor cells without microvascular proliferations was 11.91% (0.35%–51.95%). The average Ki-67 labeling index of tumor cells around microvascular proliferations was 11.15% (0.91%–52.46%). The average ratio of the latter to the former was 1.05 (0.64–2.60).
Dual Immunofluorescence for Microvascular Proliferation in Tumor Tissues
Microvascular proliferations included endothelial cells and pericytes. Endothelial cells immunolabeled for CD31. In contrast, pericytes immunolabeled for PDGF-A (Fig. 2a). PDGFA-immunolabeled pericytes also immunolabeled for SMA and PDGFR-β (Fig. 2b, c). PDGFR-β-immunolabeled pericytes were not positive for PDGFR-α, whereas tumor cells were positive for PDGFR-α (Fig. 2d).
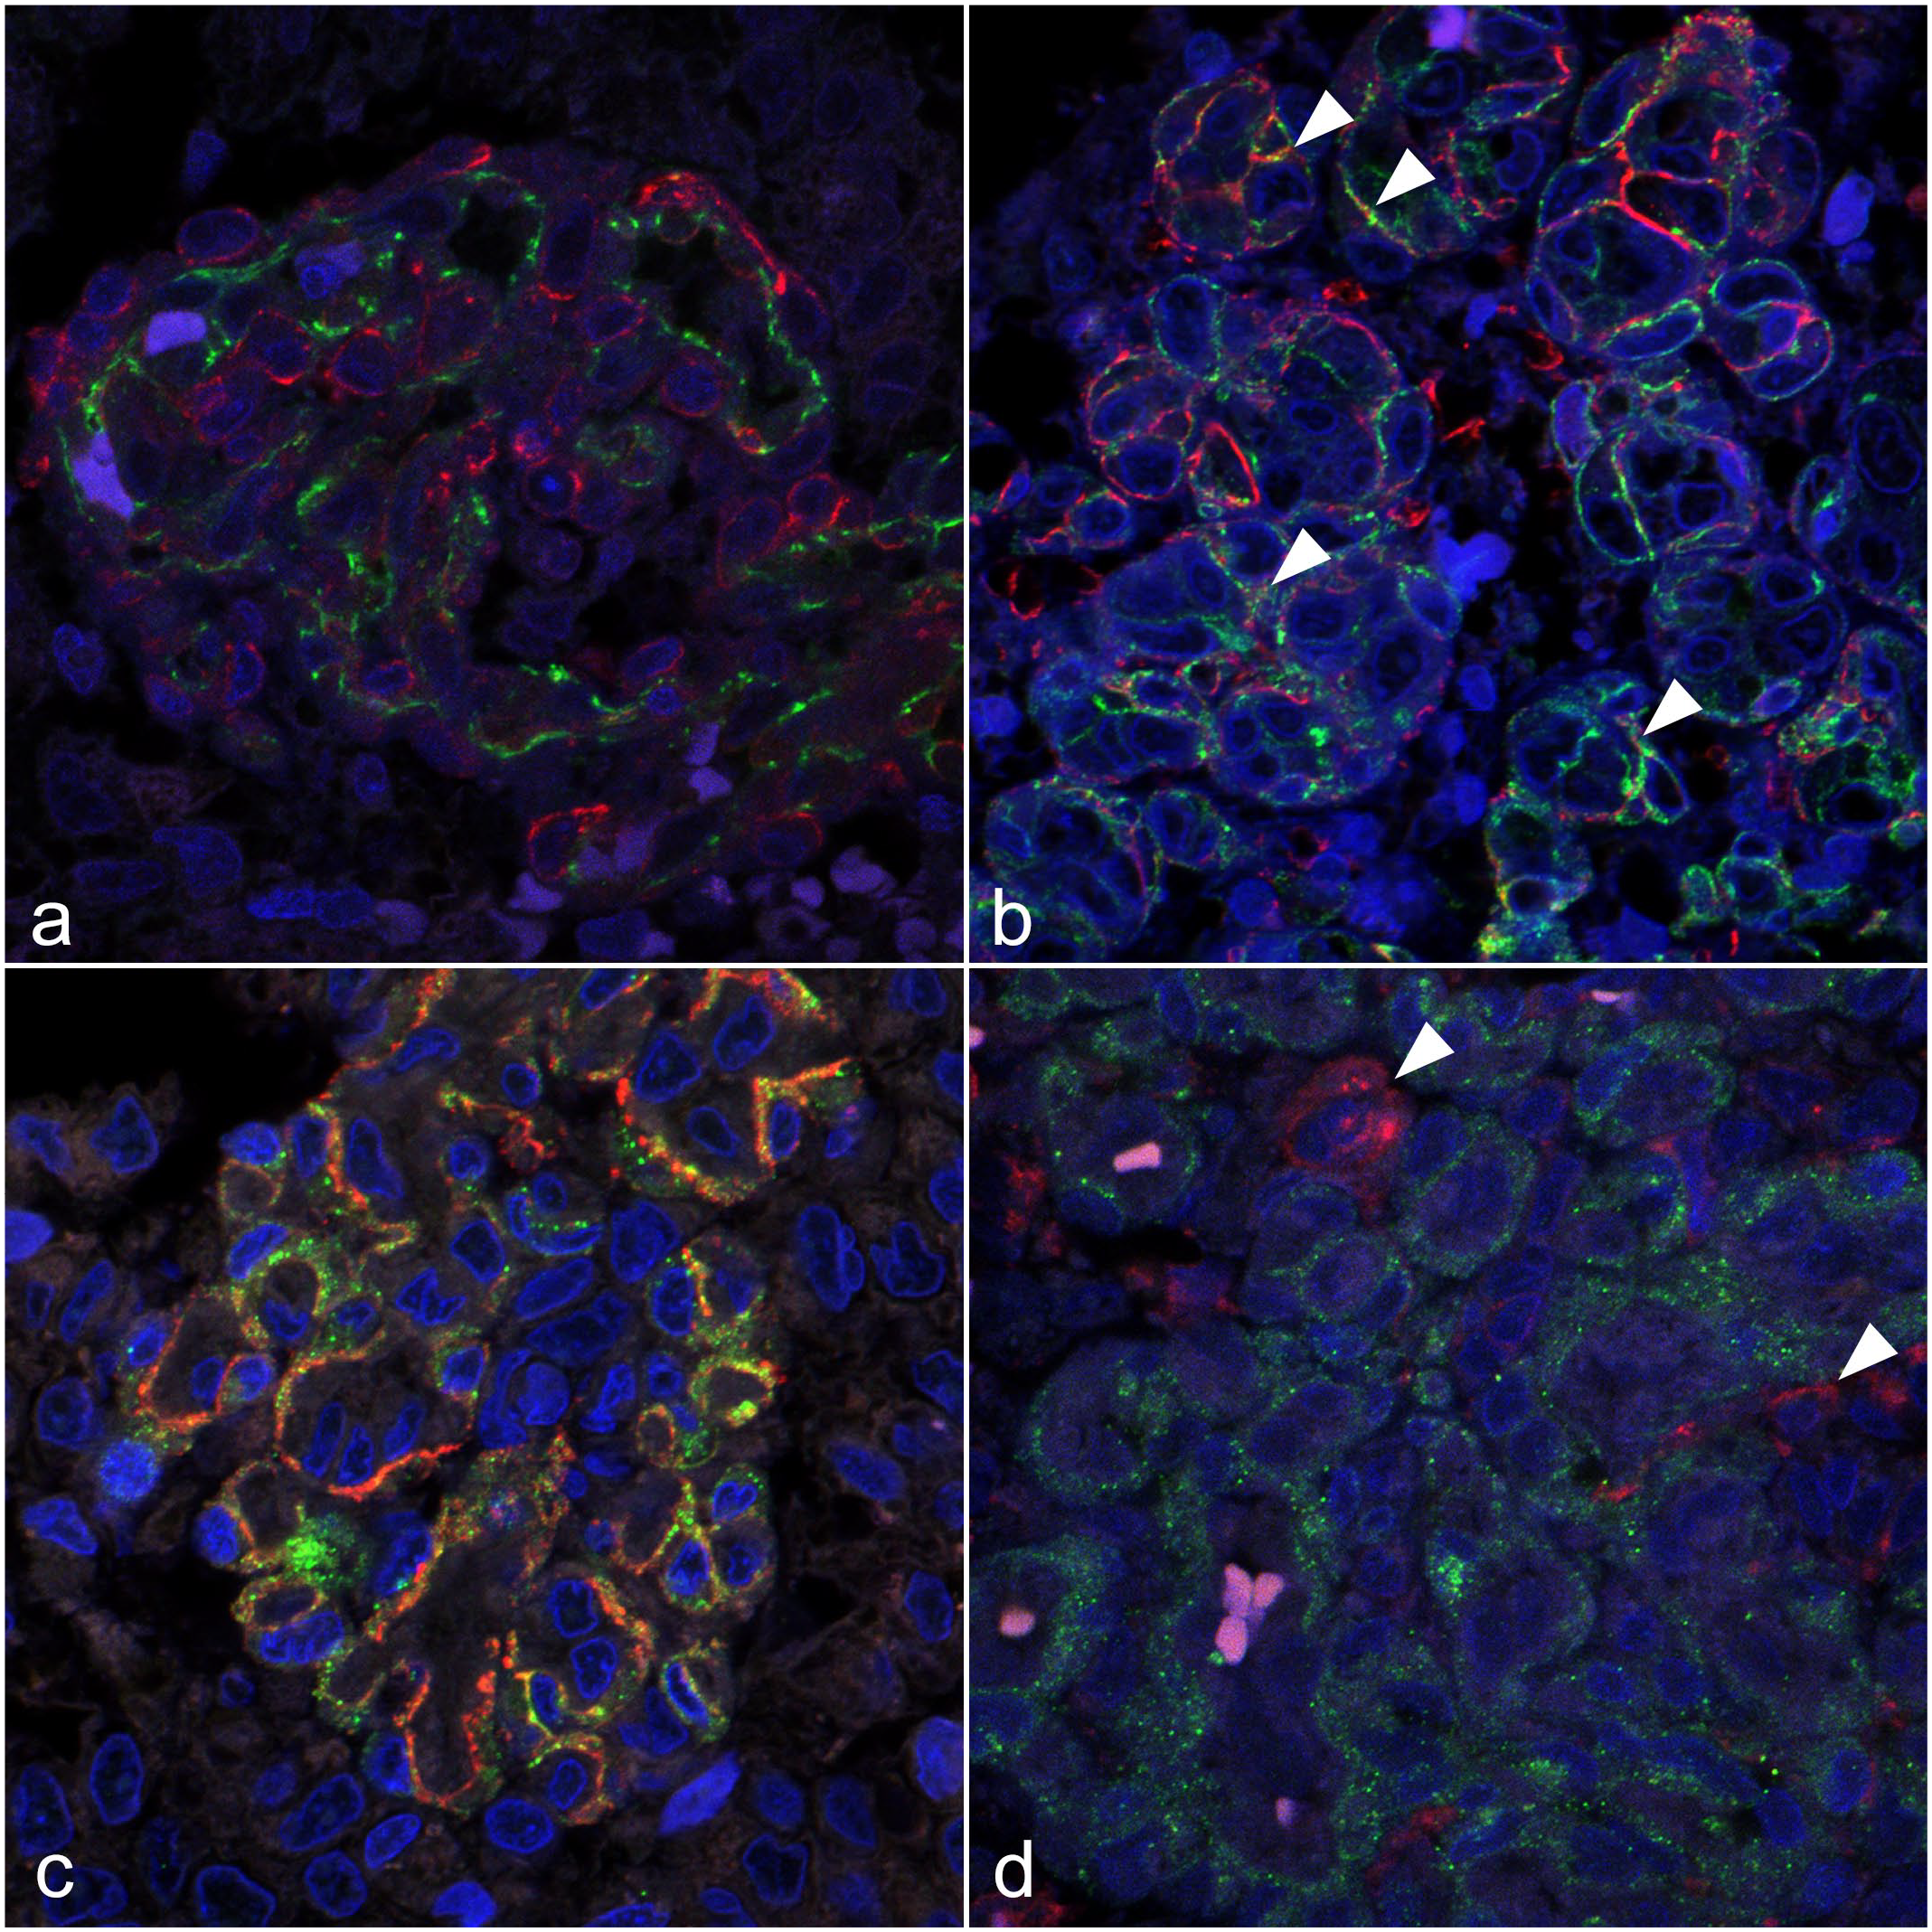
High-grade oligodendroglioma, brain, dog. Dual immunofluorescence. (a) Endothelial cells are immunolabeled for CD31 (green) and pericytes for platelet-derived growth factor-subunit A (PDGF-A, red). Case 23. (b) α-smooth muscle actin (SMA, red)-immunolabeled pericytes are also immunolabeled for platelet-derived growth factor-subunit A (PDGF-A, green) (arrowheads). Case 13. (c) SMA (red)-immunolabeled pericytes are also immunolabeled for platelet-derived growth factor receptor-β (PDGFR-β, green). Case 13. (d) Pericytes are immunolabeled for PDGFR-β (green). Tumor cells are immunolabeled for PDGFR-α (red) (arrowheads). Case 6.
IHC and Western Blotting of the AOFB-01 Cell Line
AOFB-01 cells immunolabeled for CNPase, PDGFR-α, PDGF-A, β3-tubulin, NeuN, nestin, and SOX2 (Supplemental Fig. S3a–g). Western blotting revealed bands specific for CNPase, PDGFR-α, PDGF-A, β3-tubulin, NeuN, nestin, and SOX2 (Supplemental Fig. S4).
In Vitro Assay of PDGF-A Effects on AOFB-01 Cells
The average number of AOFB-01 cells with PDGF-A was higher than that without PDGF-A after 10 days (Fig. 3a). The growth curve of AOFB-01 cells with or without PDGF-A showed exponential growth phase from day 2 through day 10. The average doubling time of AOFB-01 cells with PDGF-A (18.4 hours) was significantly shorter than that without PDGF-A (22.7 hours) (P = .0047) (Fig. 3b). The average absorbance of AOFB-01 with PDGF-A on day 8 was significantly higher than that without PDGF-A (P = .0012) (Fig. 3c).
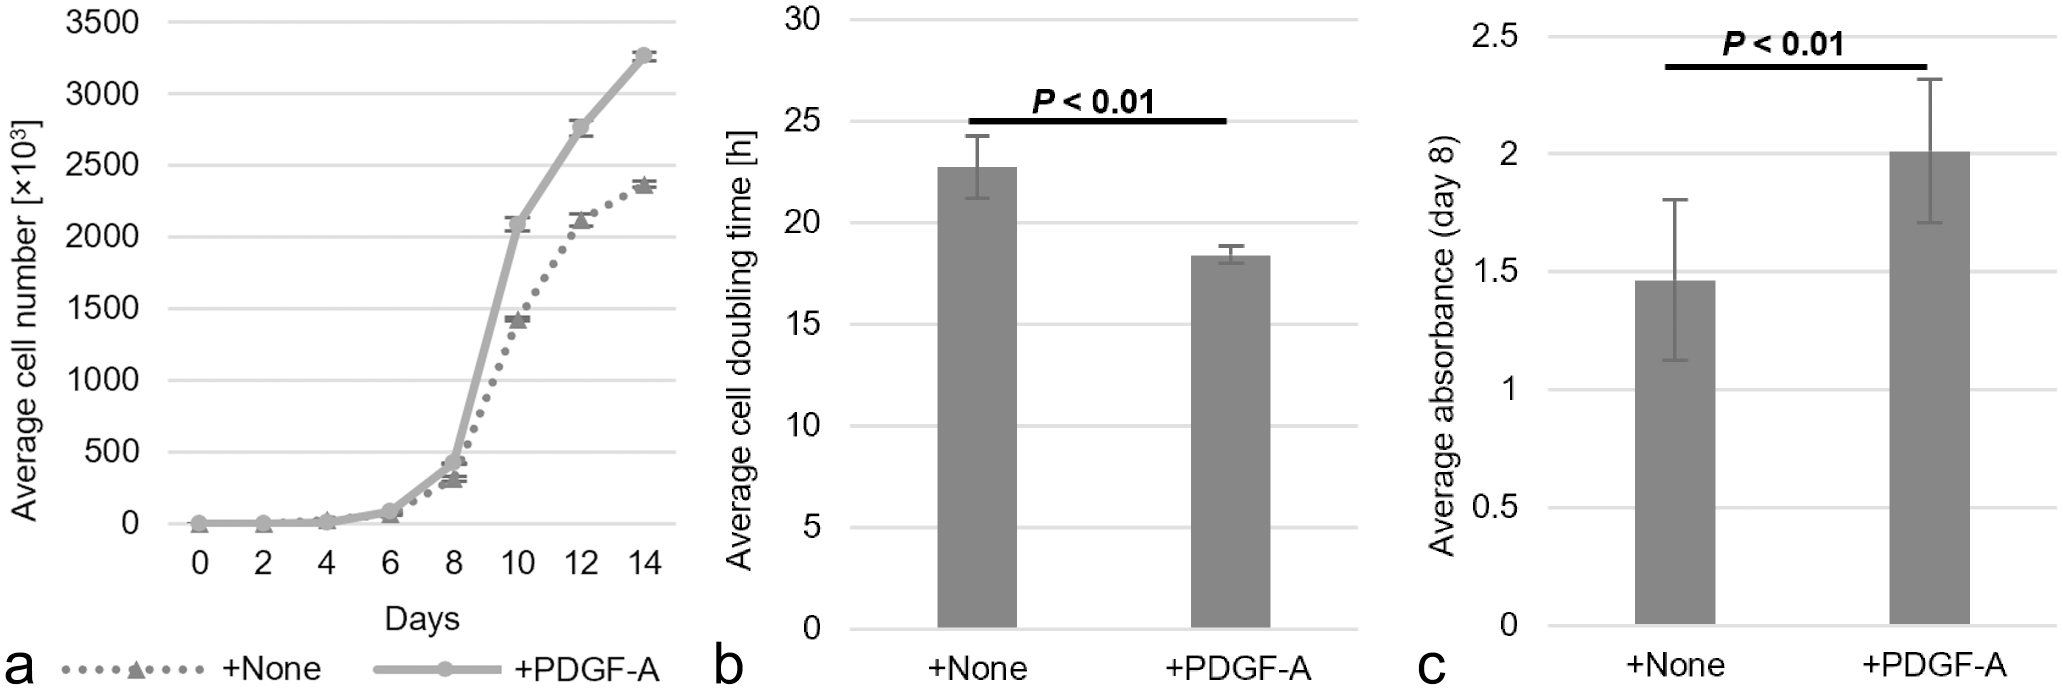
Results of an analysis using the AOFB-01 cell line in vitro. (a) Plot of the average cell number. The average cell number of AOFB-01 cells after 10 days is higher with platelet-derived growth factor-subunit A (PDGF-A) than without PDGF-A. (b) The average cell-doubling time of AOFB-01 is significantly shorter with PDGF-A (18.4 hours) than without PDGF-A (22.7 hours) (P < .01). (c) The average absorbance of AOFB-01 on day 8 is significantly higher with PDGF-A than without PDGF-A (P < .01).
In Vitro PDGFR-α Inhibition of AOFB-01 Cells
The IC50 of AOFB-01 with crenolanib (6.8 μM) was lower than that of lomustine (45.6 μM) (Fig. 4). The PDGFR-α inhibition of AOFB-01 cells with 10 μM crenolanib showed that PDGFR-α expression levels were significantly lower in crenolanib-treated AOFB-01 cells than in untreated control AOFB-01 cells (P = .02) (Fig. 5).
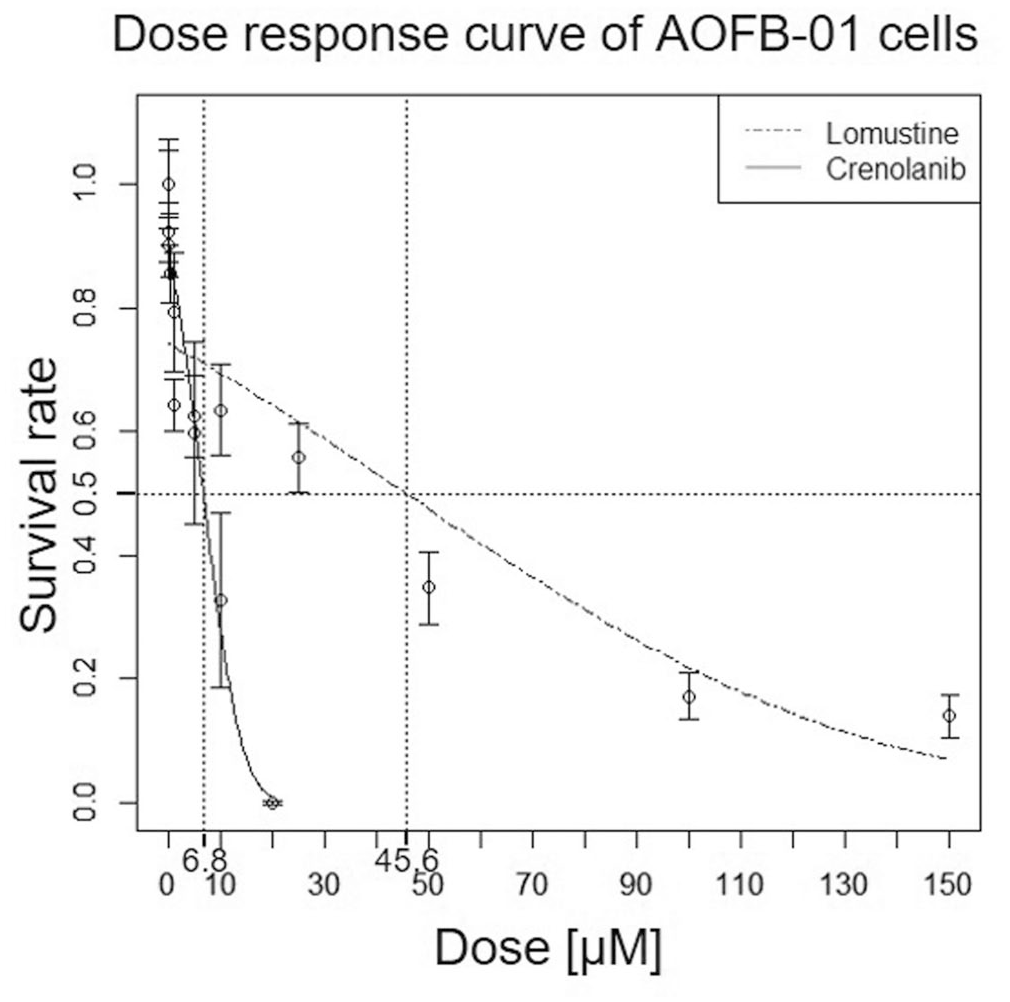
Dose response curve of AOFB-01 cells. The 50% inhibitory concentration (IC50) of AOFB-01 is lower with crenolanib (6.8 μM) than with lomustine (45.6 μM).
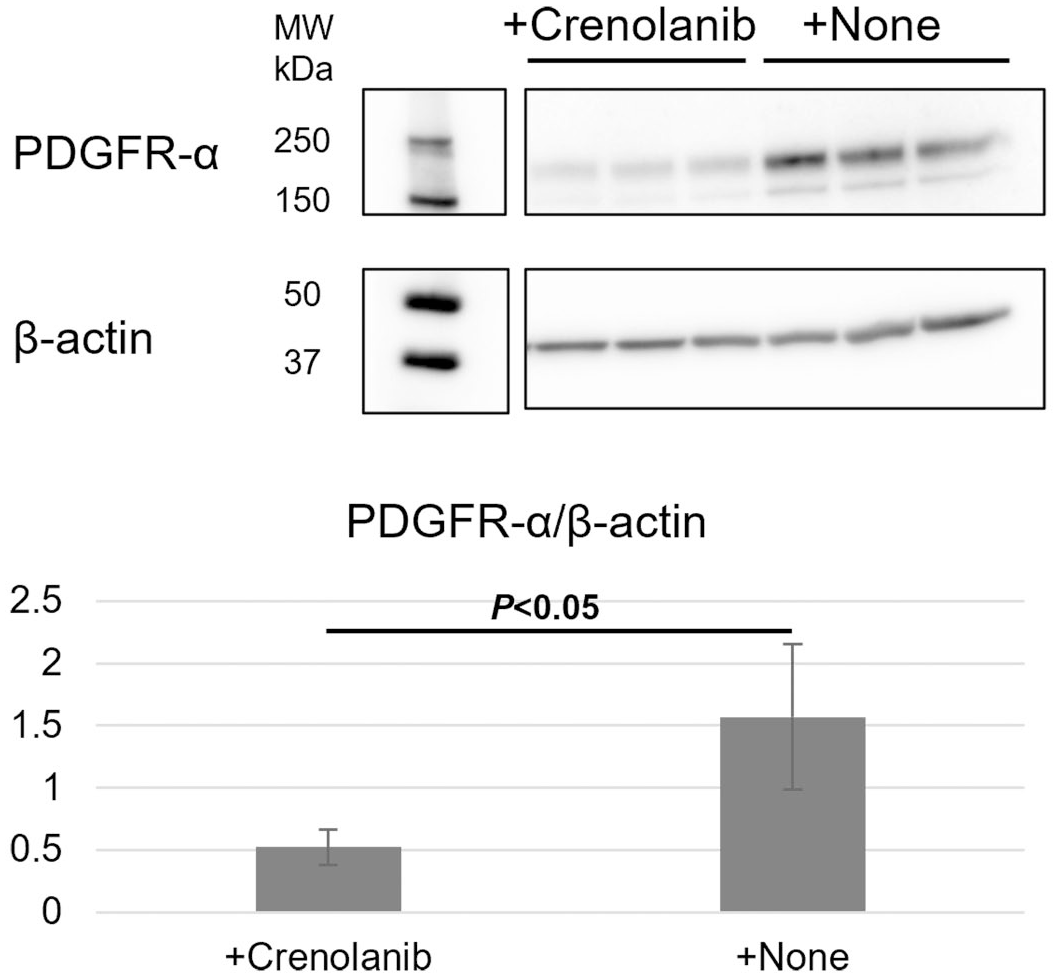
Western blotting results on platelet-derived growth factor receptor-α (PDGFR-α) inhibition in AOFB-01 cells. PDGFR-α inhibition of AOFB-01 cells by 10 μM crenolanib shows that PDGFR-α expression levels are significantly downregulated in crenolanib-treated AOFB-01 cells compared with control AOFB-01 cells (P < .05). The expression levels of the loading control (β-actin) are not different between crenolanib-treated and control cells. MW, molecular weight.
Mouse Xenograft Model Analysis
Xenograft masses of AOFB-01 cells formed in all experimental groups (Fig. 6a). Changes in tumor volumes in each group are shown in Fig. 6b. Tumor volumes were smaller in the crenolanib-treated group than in the other groups, but the difference in tumor size was not statistically significant (P = .16). No significant differences in histology were observed on hematoxylin and eosin slides of the different groups (Supplemental Fig. S5a, b). Tumors exhibited high cellularity and invasive growth. Tumor cells were polygonal to spindle-shaped and had eosinophilic cytoplasm. Tumor nuclei were round to oval and hyperchromatic. Anisokaryosis was obvious. Focal to geographical necrosis was observed. Tumor cells immunolabeled for CNPase, PDGFR-α, PDGF-A, β3-tubulin, nestin, and SOX2 (Supplemental Fig. S5c–h).
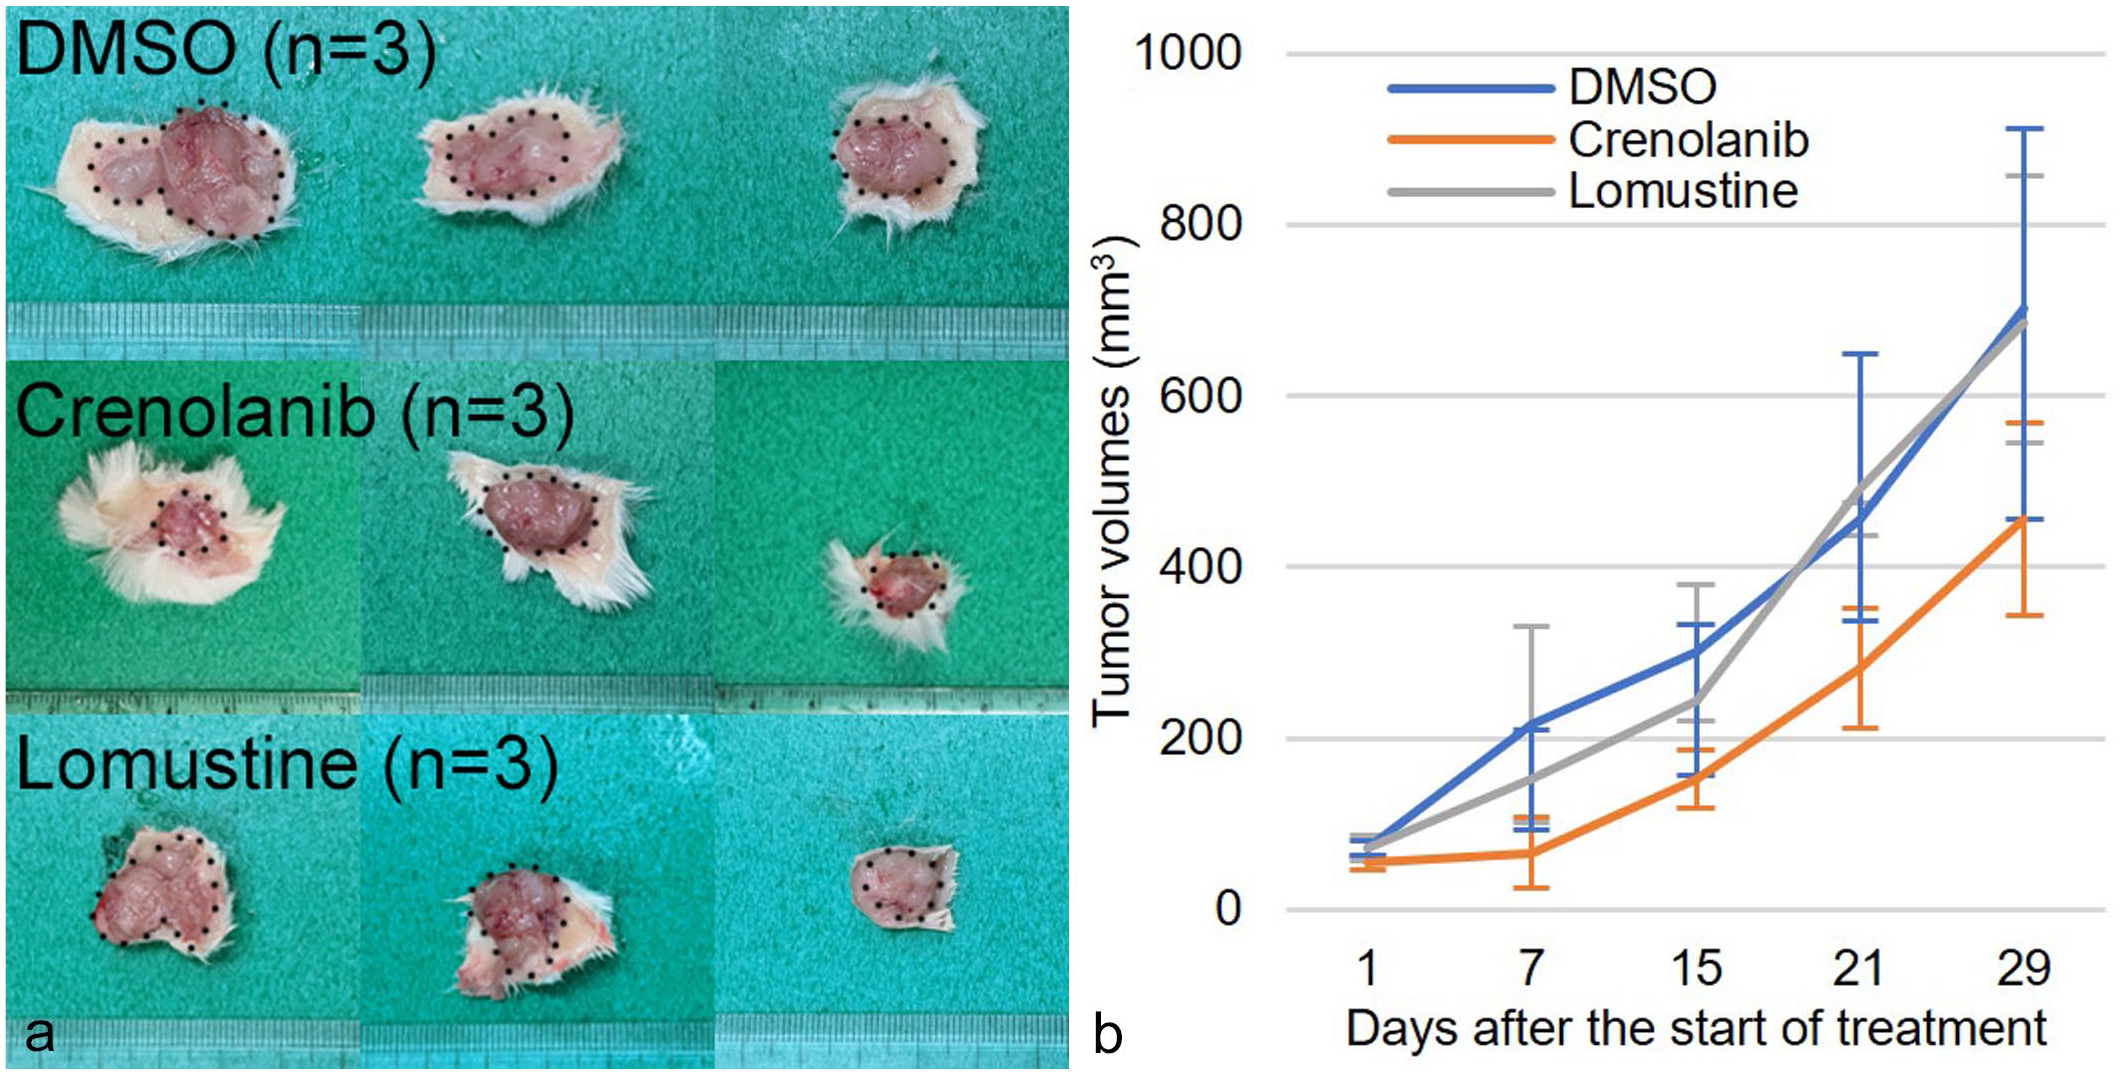
Results of an immunodeficient mouse xenograft model using AOFB-01 cells. (a) Macroscopic images of xenografts. Masses formed in all groups. (b) Plot of tumor volume changes in the mouse xenograft model. Tumor volume in crenolanib-treated group is smaller than other groups, but it is not statistically significant in one-way analysis of variance and Dunnett’s test on day 29 (P > .05).
Discussion
Tumor cells in canine HGOG tissues expressed PDGFR-α, which is consistent with previous findings.18,22,55 On the other hand, PDGF-A was expressed in cells involved in microvascular proliferation, while a few cases showed strong immunolabeling for PDGF-A in tumor cells. In human gliomas, tumor cells express PDGFR-α and proliferated vascular cells express PDGFR-β, while PDGF-A and PDGF-B are variably expressed in both tumor cells and proliferated vascular cells.5,16,17 The human literature suggests that tumor cells and proliferated vascular cells are involved in the autocrine and paracrine signaling of PDGFR-PDGF.5,16,17 This consideration may be the same in canine HGOG based on our results. The higher intensity of PDGFR-α immunolabeling of tumor cells around microvascular proliferations compared with those without microvascular proliferation in necropsy cases may also support that PDGFR-PDGF signaling is associated with microvascular proliferation. However, PDGFR-α immunolabeling patterns did not differ in biopsy cases, which may be due to the area of tissue available for evaluation. PDGFR-PDGF autocrine and paracrine signaling in tumor cells and cells involved in microvascular proliferation may explain why microvascular proliferation is associated with high-grade gliomas and poor survival times in dogs. 31 However, Ki-67 labeling index did not differ between tumor cells around and without microvascular proliferation. This observation may indicate that the influence of microvascular proliferation on tumor cell proliferation in vivo is limited, and that factors, such as necrosis and immune cell infiltration may affect tumor cell proliferation. A limitation of this study is that the analysis of the relationship between microvascular proliferation and tumor cell proliferation was conducted in 2 dimensions (ie, histological slides), and there is a possibility that the region of tumor cells without microvascular proliferation may actually have microvascular proliferation along the z-axis.
Microvascular proliferation involves endothelial cells and pericytes in human gliomas.42,48 Endothelial cells are characterized by CD31 expression, 41 and pericytes by PDGFR-β and SMA expression.42,47,48,52 The present results also indicate that microvascular proliferation involved CD31-immunolabeled endothelial cells and PDGFR-β-/SMA-immunolabeled pericytes. Pericytes expressed PDGF-A, suggesting their contribution to the proliferation of canine HGOG. In addition, the expression of PDGFR-β in pericytes may suggest that PDGF-B is associated with microvascular proliferation.1,17,48 PDGF-B and vascular endothelial growth factor (VEGF) are associated with angiogenesis in a mouse xenograft model of a human glioblastoma cell line, 12 and the role of VEGF in angiogenesis is well known in human glioma.1,50 Moreover, it is believed that VEGF is involved in microvascular proliferation of human glioma. 4 In dogs, high-level mRNA expression of VEGF and VEGF receptor has been reported in high-grade glioma.7,8 Using an enzyme-linked immunosorbent assay, VEGF can be detected not only in tumor tissue but also in plasma and cerebrospinal fluid of dogs with glioma.29,43 However, why microvascular proliferation occurs in canine HGOG is unknown.
The AOFB-01 cell line was established from a canine HGOG. 22 We previously reported that AOFB-01 cells expressed PDGFR-α.22,55 This finding was verified by Western blotting and IHC in the present study. PDGF-A expression was also observed in AOFB-01 cells. Similarly, some human glioblastoma cell lines and the rat C6 glioma cell line express PDGFR-α and PDGF-A.6,27,37 Human PDGF-A activated AOFB-01 cell proliferation and shortened the cell-doubling time of AOFB-01 cells in vitro. Furthermore, the exposure of human glioma cell lines to PDGF-A has been shown to promote cell proliferation and migration in vitro.10,24,46 PDGFR-α has been implicated in PDGF-A-induced cell proliferation and migration in human glioma cell lines,10,24,46 which suggests that PDGF-A-induced AOFB-01 cell proliferation is also associated with PDGFR-α. Crenolanib is an inhibitor of PDGFR-α, PDGFR-β, and feline McDonough sarcoma like tyrosine kinase 3 (FLT3). 15 Crenolanib also inhibits KIT and colony-stimulating factor 1 receptor (CSF1R) with lower affinity than PDGFR-α, PDGFR-β, and FLT3. 15 Crenolanib can reduce cell viability and colony formation and downregulate PDGFR-α expression in human glioblastoma cells.6,25 In the present study, the proliferation of AOFB-01 cells was inhibited by exposure to crenolanib. In addition, crenolanib downregulated PDGFR-α expression in AOFB-01 cells, which may be involved in the growth inhibition of AOFB-01 cells. Collectively, the results obtained from the stimulation by PDGF-A and inhibition by crenolanib indicate that PDGFR-α is functional in AOFB-01 cells and promotes cell proliferation in vitro.
In an orthotopic mouse model of human glioma, lomustine was found to prolong survival times in mice. 54 Lomustine also extended survival times in dogs with glioma and has been used to treat humans with glioma.14,26,32,33 Furthermore, crenolanib prolonged survival times in an orthotropic mouse model of human glioma. 25 In contrast, lomustine failed to reduce tumor sizes in AOFB-01 xenograft mice. In addition, crenolanib reduced tumor size in AOFB-01 xenograft mice; however, the differences in tumor size between crenolanib-treated mice and the other groups were not statistically significant. Similar difficulties with the application of chemotherapy have been reported in a phase 1 study of crenolanib in human pediatric gliomas, which showed that crenolanib did not affect the survival outcomes in human patients with PDGFRA-amplified glioma. 51 Note that PDGFRA amplification status was determined only in a subset of patients in this phase 1 study. The inconsistent treatment outcomes may be related to the heterogeneous status of PDGFRA amplification in each glioma cell. In addition, most human malignant gliomas can recur after initial treatment, and a clinical trial failure has been reported with bevacizumab, a VEGF inhibitor used in combination with other regimens or therapies in human recurrent glioblastoma. 1 The resistance to chemotherapy of the AOFB-01 xenograft model may be caused by cancer stem cells. Tumor tissues in the AOFB-01 xenograft model consistently expressed nestin, a cancer stem cell marker. 36 In addition, AOFB-01 cells and xenograft tissues expressed high levels of SOX2, which is also a cancer stem cell marker. 28 Cancer stem cells exhibited resistance to chemotherapy in association with the microenvironment.38,45,49 Moreover, as receptor tyrosine kinase inhibitors have been reported to induce upregulation of other nontarget receptor tyrosine kinases,2,6 crenolanib treatment may upregulate receptor tyrosine kinases other than PDGFR-α. This possibility may be associated with the survival of xenograft tumor cells.
In conclusion, PDGFR-α is functional in the AOFB-01 cell line in vitro, suggesting that canine HGOG has functional PDGFR-α. Pericytes of microvascular proliferation in canine HGOG express PDGF-A, which may promote the proliferation of PDGFR-α-expressing tumor cells. In some HGOG cases, tumor cells also expressed PDGF-A, which may also induce cell proliferation in an autocrine manner (Fig. 7). PDGFR-α signaling is associated with the proliferation of canine HGOG and, thus, has potential as a therapeutic target. However, it is possible that the effects of microvascular proliferation on tumor proliferation are limited. Further analyses with additional cell lines and mouse orthotopic models are needed to verify PDGFR-α signaling mechanisms in canine HGOG.
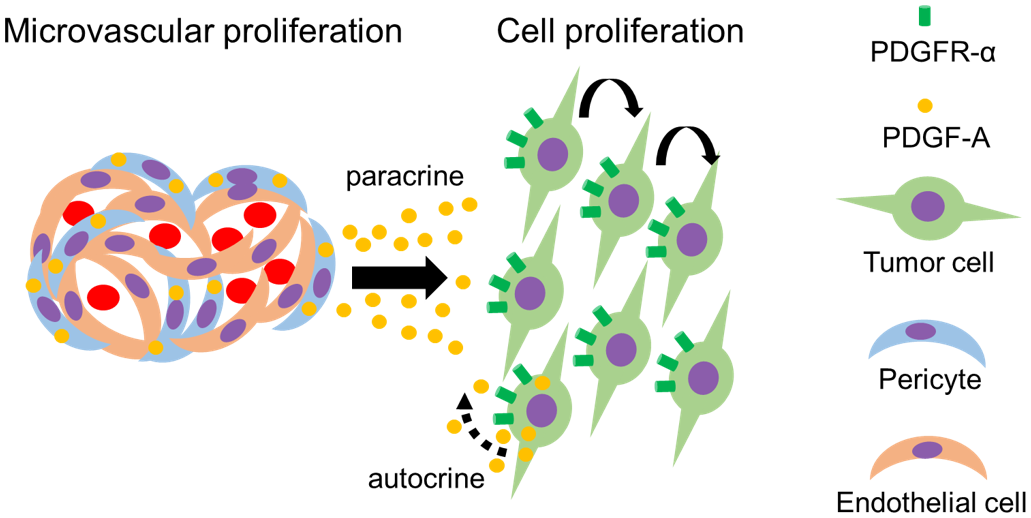
Schematic of platelet-derived growth factor receptor-α (PDGFR-α) and platelet-derived growth factor-subunit A (PDGF-A) in tumor cells and cells involved in microvascular proliferations in canine high-grade oligodendroglioma. Pericytes in microvascular proliferations release PDGF-A. PDGFR-α-expressing oligodendroglioma cells then proliferate through PDGF-A. In some cases, oligodendroglioma cells release PDGF-A, which may induce cell proliferation in an autocrine manner.
Supplemental Material
sj-pdf-1-vet-10.1177_03009858241241793 – Supplemental material for The relationships of platelet-derived growth factor, microvascular proliferation, and tumor cell proliferation in canine high-grade oligodendrogliomas: Immunohistochemistry of 45 tumors and an AFOB-01 xenograft mouse model
Supplemental material, sj-pdf-1-vet-10.1177_03009858241241793 for The relationships of platelet-derived growth factor, microvascular proliferation, and tumor cell proliferation in canine high-grade oligodendrogliomas: Immunohistochemistry of 45 tumors and an AFOB-01 xenograft mouse model by Kio Yoshida, James K. Chambers and Kazuyuki Uchida in Veterinary Pathology
Footnotes
Declaration of Conflicting Interests
The author(s) declared no potential conflicts of interest with respect to the research, authorship, and/or publication of this article.
Funding
The author(s) received no financial support for the research, authorship, and/or publication of this article.
Supplemental Material for this article is available online.
References
Supplementary Material
Please find the following supplemental material available below.
For Open Access articles published under a Creative Commons License, all supplemental material carries the same license as the article it is associated with.
For non-Open Access articles published, all supplemental material carries a non-exclusive license, and permission requests for re-use of supplemental material or any part of supplemental material shall be sent directly to the copyright owner as specified in the copyright notice associated with the article.