
Abstract
The liver is an early systemic target of Ebola virus (EBOV), but characterization beyond routine histopathology and viral antigen distribution is limited. We hypothesized Ebola virus disease (EVD) systemic proinflammatory responses would be reflected in temporally altered liver myeloid phenotypes. We utilized multiplex fluorescent immunohistochemistry (mfIHC), multispectral whole slide imaging, and image analysis to quantify molecular phenotypes of myeloid cells in the liver of rhesus macaques (Macaca mulatta; n = 21) infected with EBOV Kikwit. Liver samples included uninfected controls (n = 3), 3 days postinoculation (DPI; n = 3), 4 DPI (n = 3), 5 DPI (n = 3), 6 DPI (n = 3), and terminal disease (6–8 DPI; n = 6). Alterations in hepatic macrophages occurred at ≥ 5 DPI characterized by a 1.4-fold increase in CD68+ immunoreactivity and a transition from primarily CD14−CD16+ to CD14+CD16− macrophages, with a 2.1-fold decrease in CD163 expression in terminal animals compared with uninfected controls. An increase in the neutrophil chemoattractant and alarmin S100A9 occurred within hepatic myeloid cells at 5 DPI, followed by rapid neutrophil influx at ≥ 6 DPI. An acute rise in the antiviral myxovirus resistance protein 1 (MxA) occurred at ≥ 4 DPI, with a predilection for enhanced expression in uninfected cells. Distinctive expression of major histocompatibility complex (MHC) class II was observed in hepatocytes during terminal disease. Results illustrate that EBOV causes macrophage phenotype alterations as well as neutrophil influx and prominent activation of interferon host responses in the liver. Results offer insight into potential therapeutic strategies to prevent and/or modulate the host proinflammatory response to normalize hepatic myeloid functionality.
Keywords
Ebola virus disease (EVD) is a rare and often fatal viral infection that causes outbreaks in people and nonhuman primates (NHPs) across several sub-Saharan African countries. The viruses that cause EVD belong to the family Filoviridae, genus Ebolavirus. There are six identified EBOV species, four of which are known to cause disease in humans: Ebola virus (Zaire ebolavirus—EBOV), Sudan virus (Sudan ebolavirus—SUDV), Taï Forest virus (Taï Forest ebolavirus—TAFV, formerly Côte d’Ivoire ebolavirus), and Bundibugyo virus (Bundibugyo ebolavirus—BDBV). The two remaining EBOVs, Reston virus (Reston ebolavirus—RESTV) and Bombali virus (Bombali ebolavirus—BOMV), are not currently known to cause disease in humans.7,26
The two largest outbreaks to date were both caused by EBOV and occurred in Guinea, Liberia, and Sierra Leone (West African outbreak) in 2014 with a case fatality rate of 39% (28,610 cases, 11,308 mortalities) and in the Democratic Republic of Congo (DRC) in 2018 with a case fatality rate of 66% (3470 cases, 2287 mortalities).2,27 Currently, there are two Food and Drug Administration (FDA)-approved antibody therapies for EBOV: Ebanga (ansuvimab), a human monoclonal antibody, and Inmazeb (atoltivimab, maftivimab, and odesivimab), a mixture of three human monoclonal antibodies; all of which target EBOV glycoprotein (GP) epitopes.3,30 There is also a single FDA-approved vaccine for EBOV: Ervebo (V920, rVSVΔG-ZEBOV-GP, or rVSV-ZEBOV), which is a modified live recombinant vesicular stomatitis virus (rVSV) vaccine containing the EBOV glycoprotein gene (Makona strain from 2013 to 2016 West African epidemic) in place of the native VSV GP. 34
Mononuclear phagocytes including macrophages are well established as early targets in EBOV infection, with the liver serving as a major center for viral replication and amplification.26,37,44 Albeit a multifaceted systemic disease, this investigation focuses on the liver acknowledging much of EVD clinical progression can be directly attributable to macrophage activation and hepatocyte injury. Resident hepatic macrophages account for ~20%–25% of hepatic non parenchymal cells, with the majority composed of Kupffer cells (KCs) in health. 14 KCs play a significant role in homeostatic immunologic tolerance and anti-inflammatory responses, analogous in many aspects to alveolar macrophages in health. 1 In disease, blood monocyte-derived macrophages (MoMϕs) are often recruited to the liver as a means to contribute to the replenishment of KCs during injury and/or depletion; however, KCs have also been show to display extensive plasticity including transition to proinflammatory phenotypes in response to certain environmental cues. 47
Previously, we have shown that EVD progression in the liver of rhesus monkeys is affiliated with sinus leukocytosis attributed to increased macrophages and neutrophils that sporadically form aggregates admixed with fibrin by 5 days postinoculation (DPI) that persists through terminal disease (6–8 DPI). 22 Furthermore, increased sinusoidal macrophages were affiliated with altered morphology characterized by an increase in size and cytoplasmic vacuolation, in contrast to delicate to indiscernible cytoplasmic processes of resident KCs in uninfected and 3–4 DPI monkeys (Fig. 1). The focus of this study was to temporally characterize molecular hepatic myeloid phenotypes and host interferon responses and to correlate our findings with previously published virological and clinical parameters derived from the same cohort of monkeys. 6 The specific rationale for the molecular markers utilized in this study is outlined in Table 1 and is derived from our existing knowledge of EVD pathogenesis. Our underlying hypothesis was that the systemic proinflammatory response affiliated with EVD would result in disruption of normal KCs homeostatic mechanisms due to either recruitment of proinflammatory MoMϕs and/or reprogramming of resident KCs toward a proinflammatory phenotype representing a critical tipping point in disease progression. Our findings support hepatic myeloid polarization as a key feature of EVD progression that may represent an opportunity for potential future therapeutic intervention strategies.
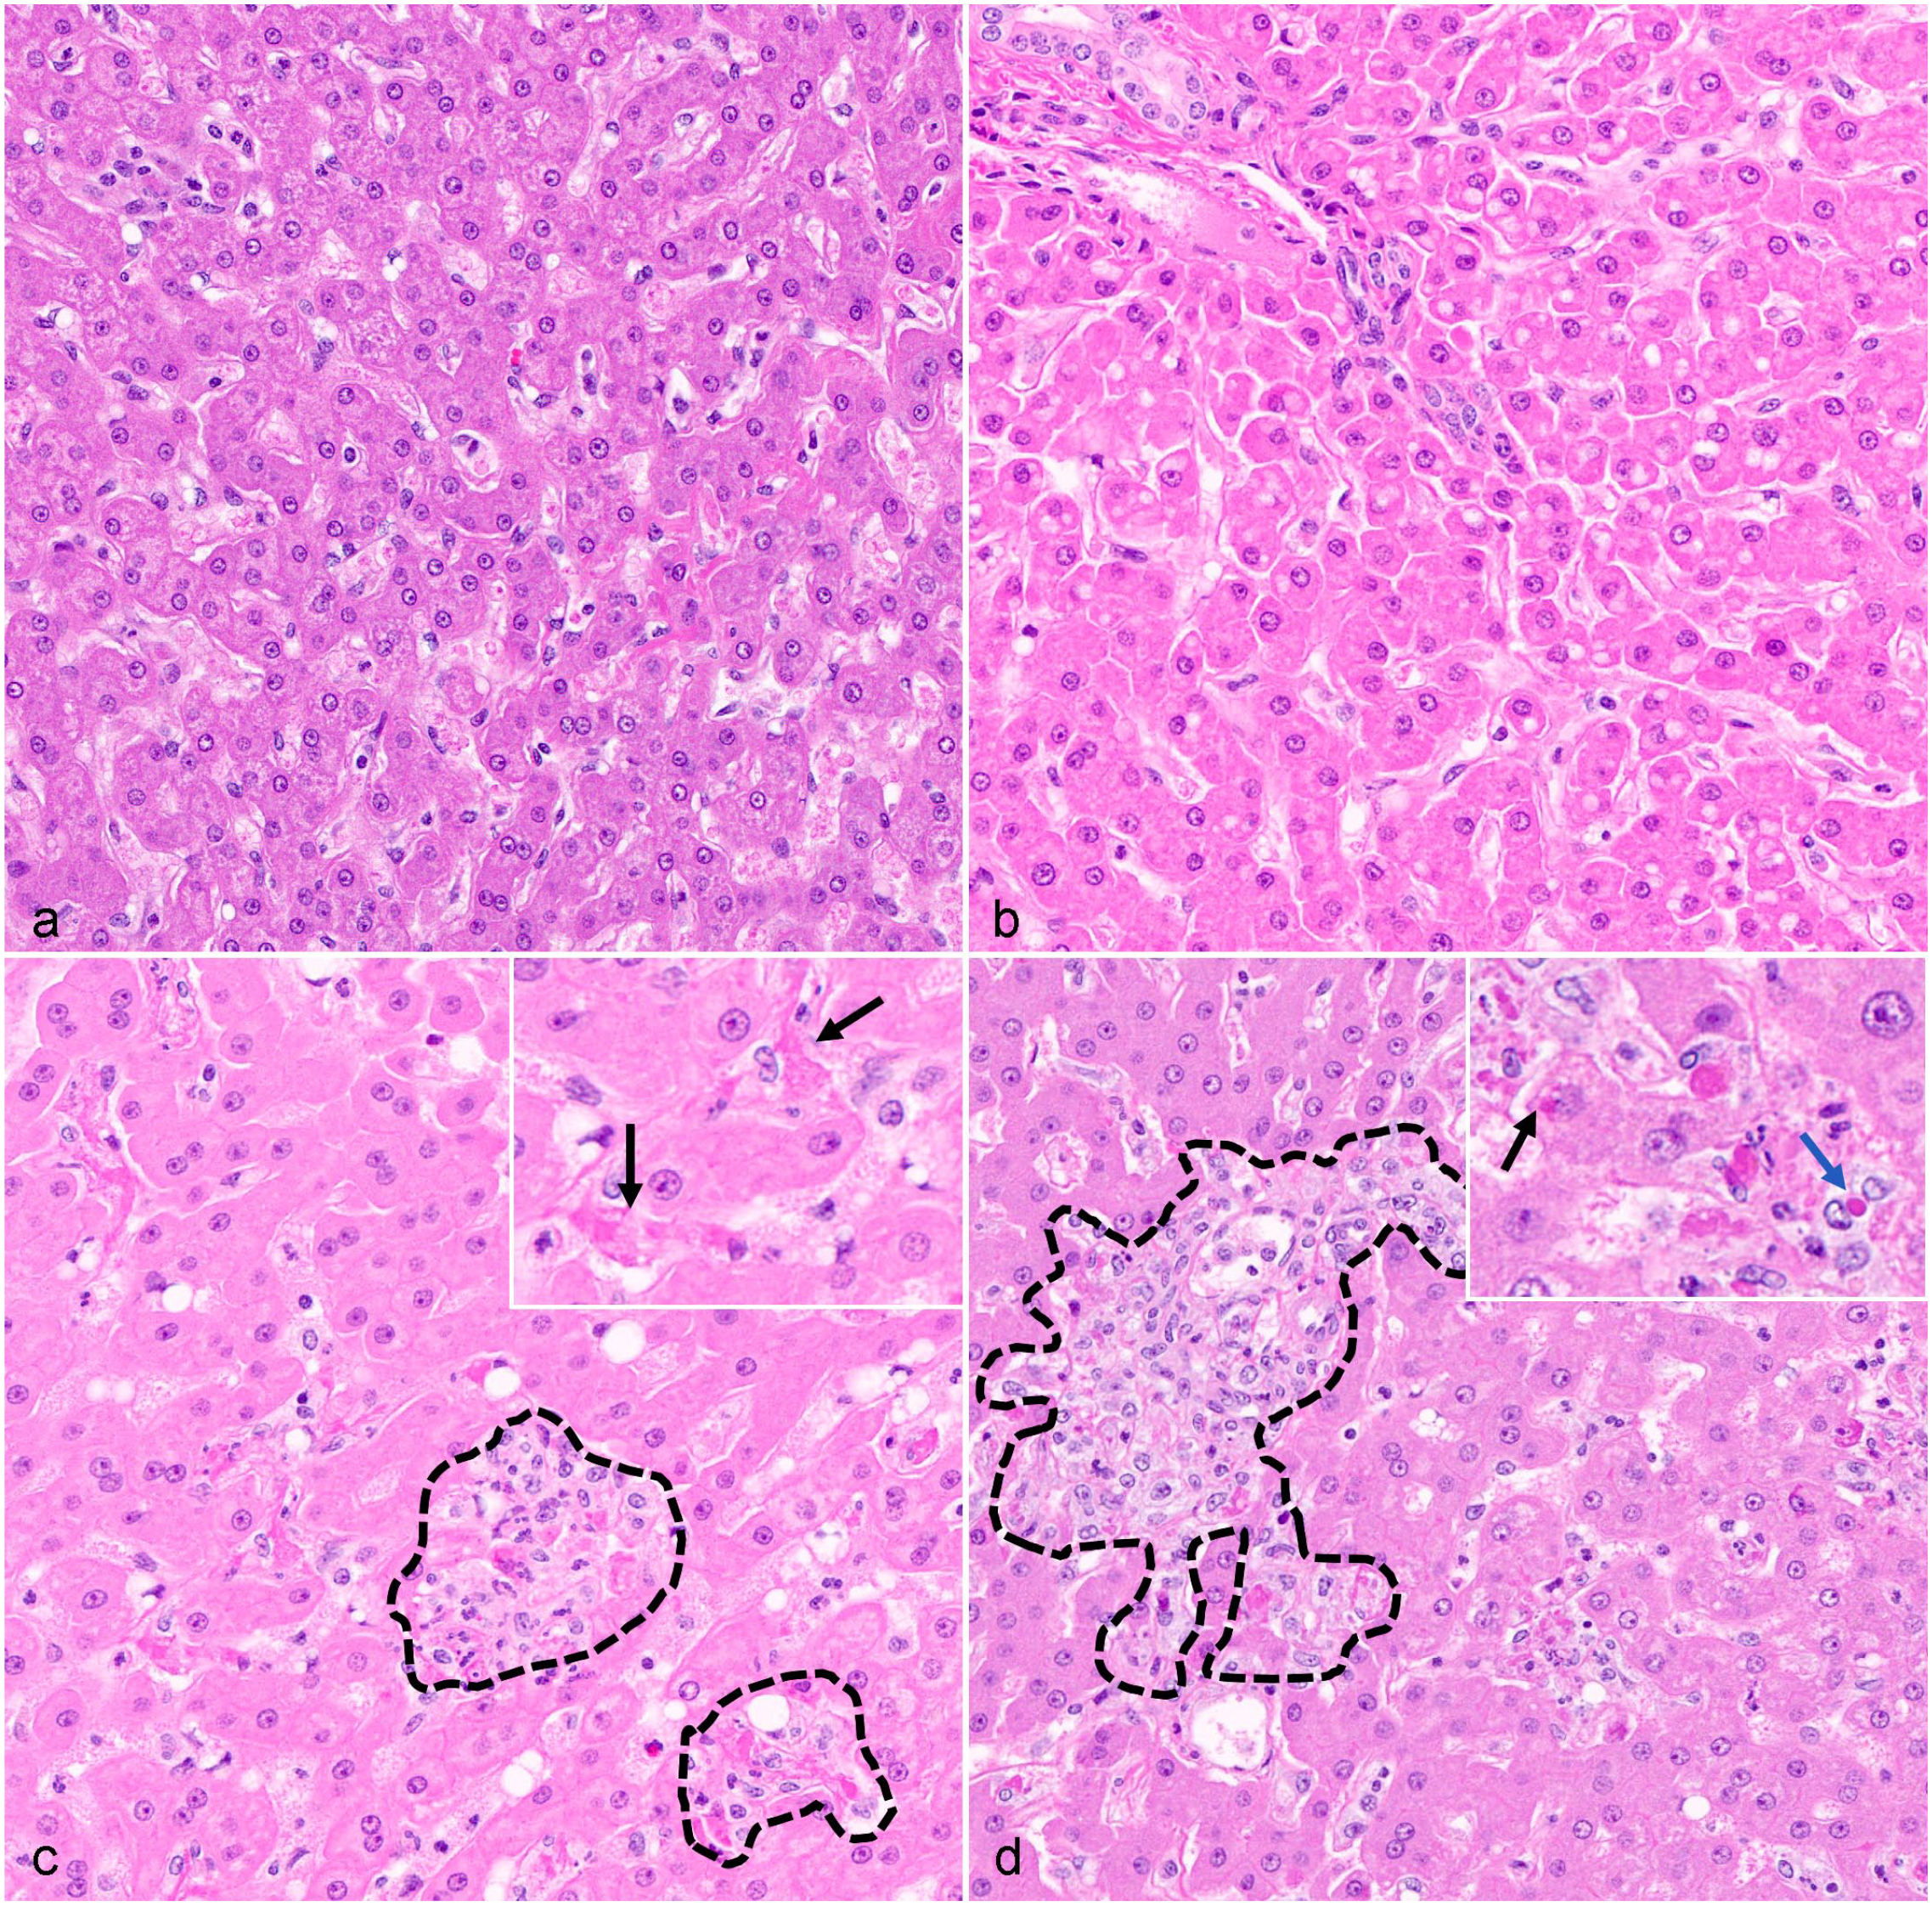
Temporal histopathology findings, liver, rhesus monkeys infected with Ebola virus (EBOV) Kikwit. (a) Uninfected control, within normal limits. (b) 3 days postinoculation (DPI), minimal vacuolar change of hepatocytes; otherwise within normal limits. (c) 5 DPI, sinusoidal leukocytosis with aggregates composed of macrophages and neutrophils (black hashes) admixed with fibrin (inset-black arrows). (d) Terminal disease (6–8 DPI), persistence of sinusoidal leukocytosis and aggregation of macrophages and neutrophils admixed with fibrin (black hashes). Routine detection of eosinophilic cytoplasmic inclusion bodies in hepatocytes (inset—black arrow) and sinusoidal macrophages (inset—blue arrow). Hematoxylin and eosin.
Immunohistochemistry (IHC) targets and their biological functions.
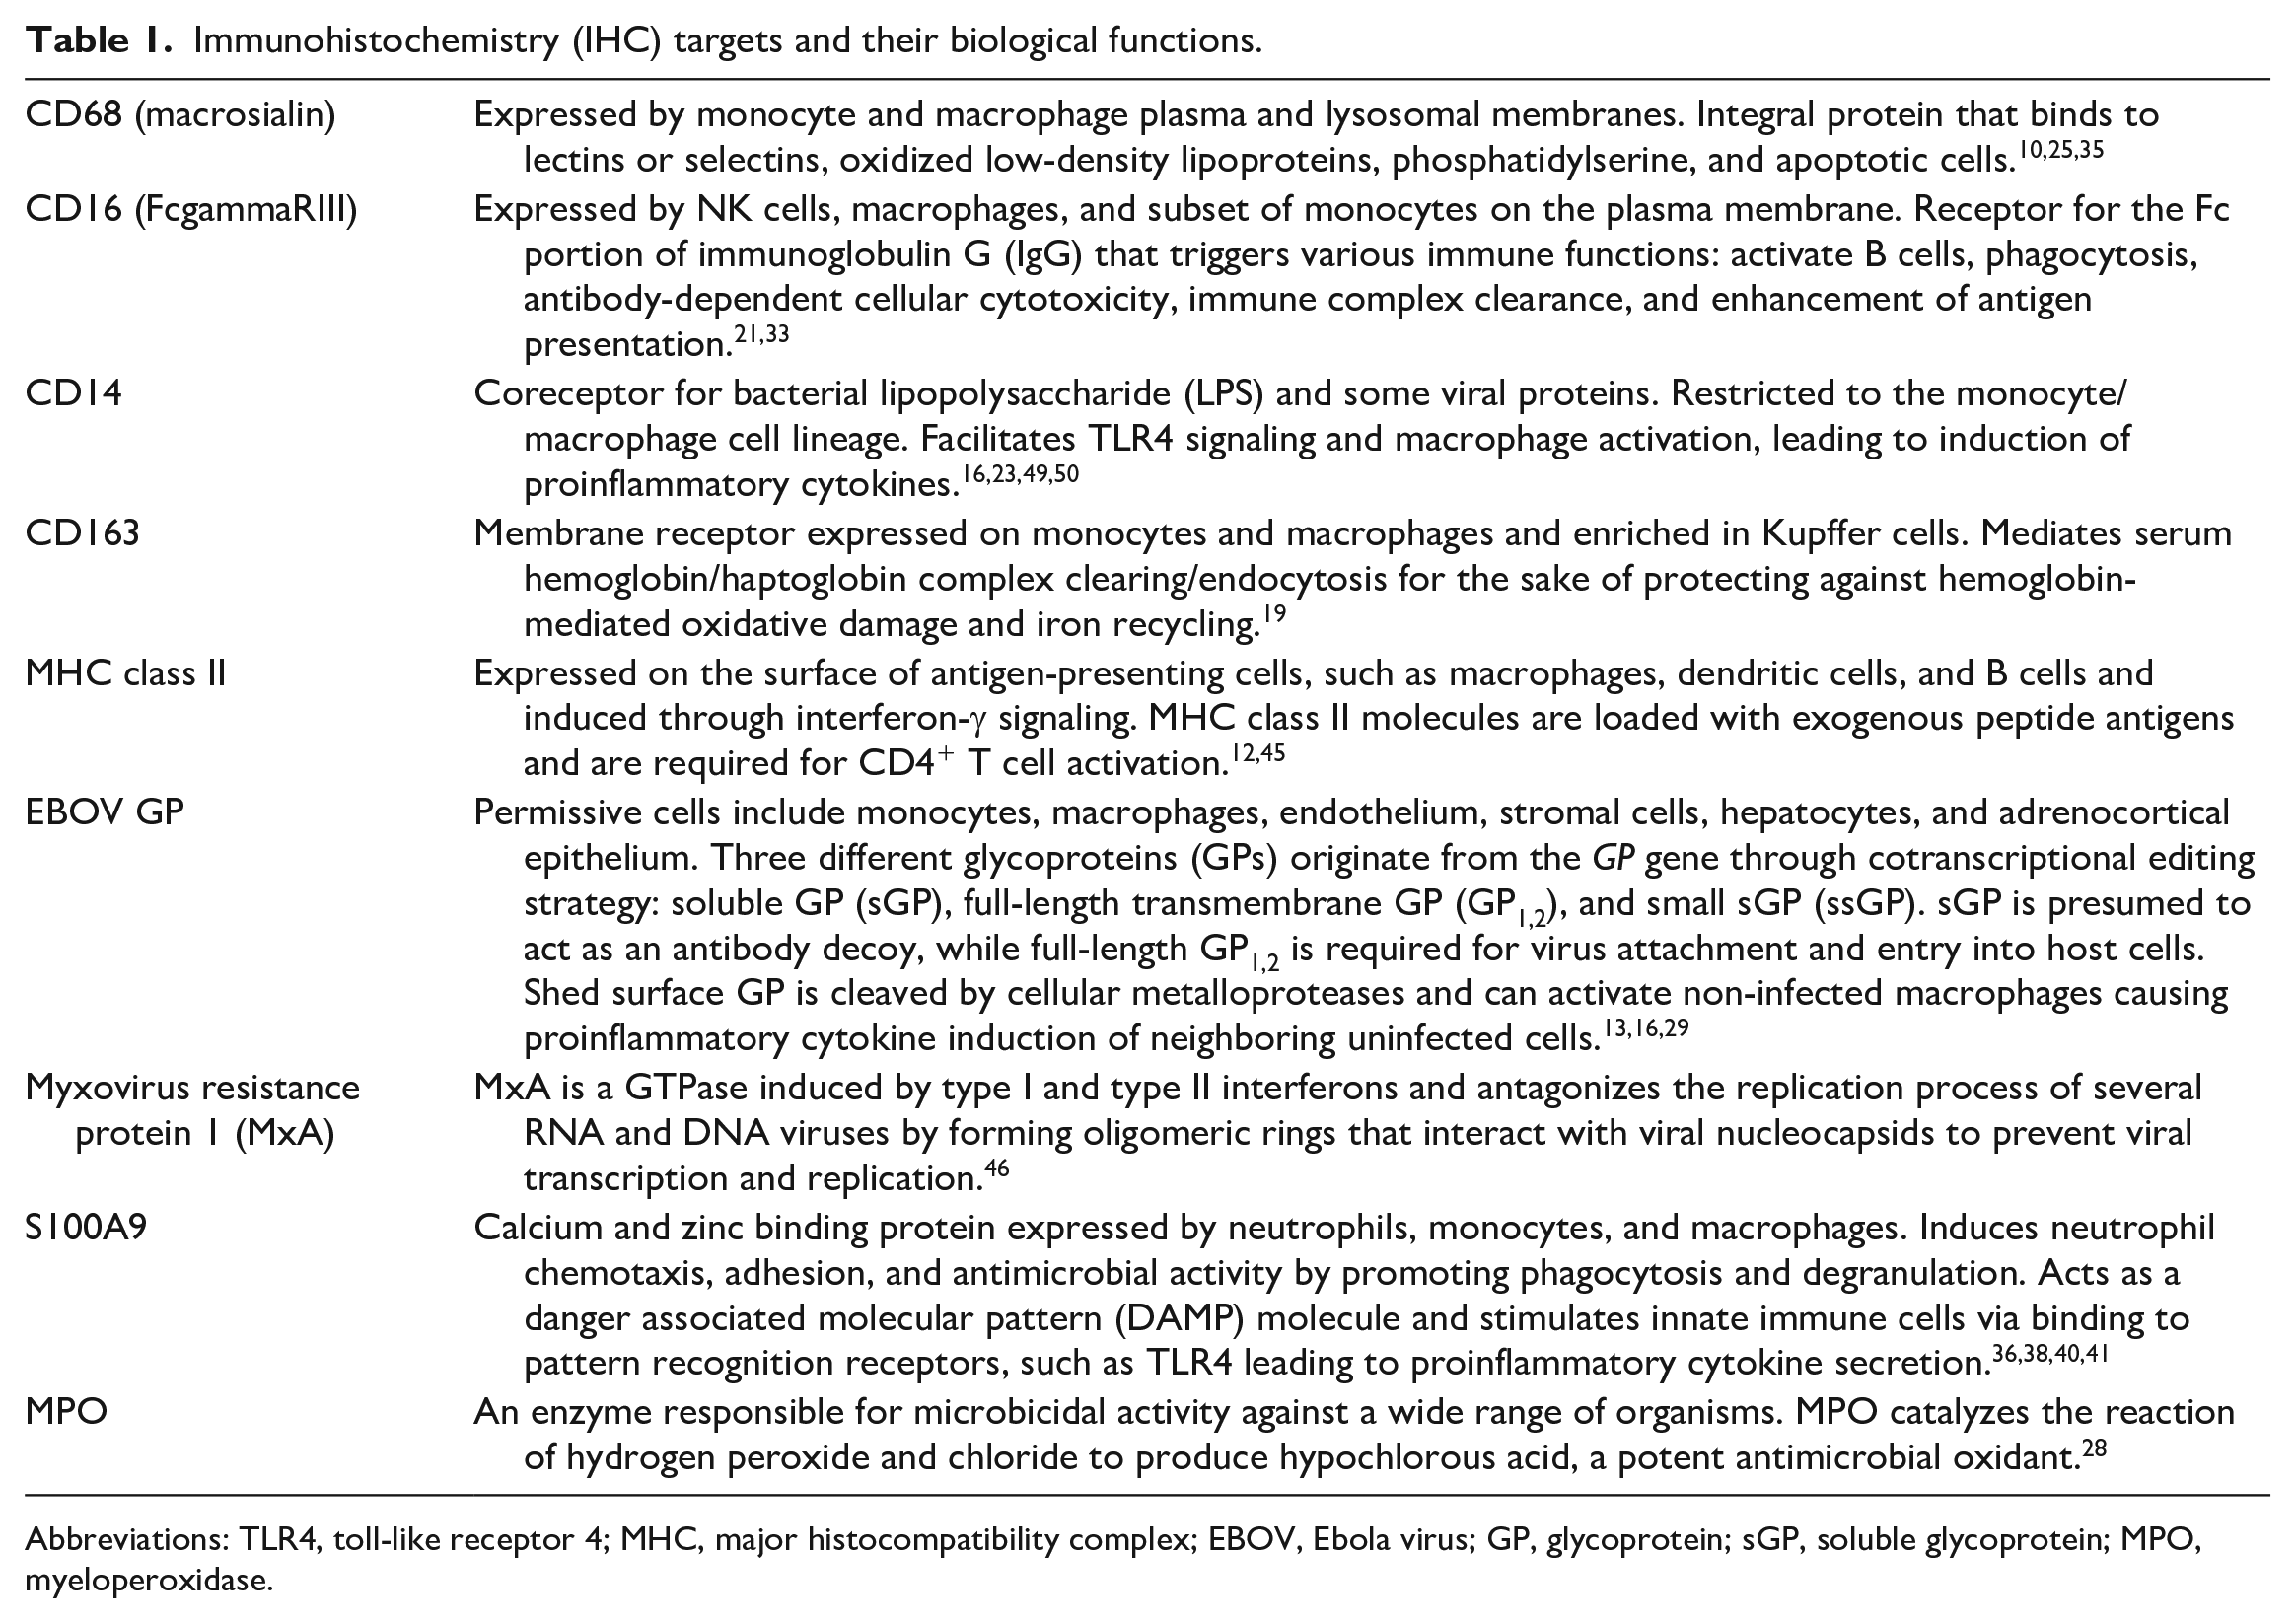
Abbreviations: TLR4, toll-like receptor 4; MHC, major histocompatibility complex; EBOV, Ebola virus; GP, glycoprotein; sGP, soluble glycoprotein; MPO, myeloperoxidase.
Materials and Methods
Virus, Animals, Method of Infection, Tissue Inactivation, and Histopathology Processing
Detailed methodology for this study was previously reported. 6 In brief, EBOV strain Kikwit (full designation: Zaire Ebolavirus, H.sapiens-tc/COD/1995/Kikwit-9510621, abbreviated name: EBOV/Kik [ https://www.ncbi.nlm.nih.gov/nuccore , accession number MG572235.1]) was obtained from BEI Resources, NIAID, NIH (catalog number NR-50306). 21, 6- to 7-year-old, Chinese origin (4.72–10.98 kg) rhesus macaques (8 males and 13 females) were enrolled in this study. Eighteen (n = 18) were inoculated with 1000 plaque-forming units EBOV/Kik in 1 mL of medium/animal via intramuscular injection in the left triceps muscle. Among them, three animals at each time point were humanely euthanized and necropsied at 3–6 DPI. Six additional animals were assigned as terminal disease controls, with 1 animal being found dead at 8 DPI and the remaining 5 monkeys euthanized between 6 and 8 DPI after meeting predetermined clinical endpoint criteria that was previously described in detail. 6 Three animals served as uninfected controls and were euthanized at 0 DPI. All in life components of the study were conducted in a biosafety level 4 (BSL-4) laboratory. Liver samples were trimmed to fit into standard histology tissue cassettes and immersed in 10% neutral buffered formalin at a ratio of 20 parts of fixative to 1 part tissue for 72–120 hours before being removed from biocontainment and processed routinely as formalin-fixed paraffin-embedded (FFPE) blocks; 5 μm serial sections were generated from each individual FFPE block for all downstream immunohistochemistry (IHC) and in situ hybridization (ISH) analysis. This study was executed in strict adherence to the Guide for the Care and Use of Laboratory Animals of the National Institute of Health, the Office of Animal Welfare, and the US Department of Agriculture. All work was approved by the National Institute of Allergy and Infectious Diseases (NIAID) Division of Clinical Research Animal Care and Use Committee and performed at the NIAID Research Facilities.
Multiplex Fluorescent Immunohistochemistry
A Ventana Discovery Ultra (Roche, Basel, Switzerland) tissue autostainer was used for multiplex fluorescent immunohistochemistry (mfIHC). Species-specific secondary antibodies conjugated to horseradish peroxidase (HRP) were utilized to covalently bind fluorophores to tissues. Multiplexing was achieved using tyramide signaling amplification (TSA) whereby antigens were developed in an iterative approach to covalently bind Opal fluorophores (Akoya Bioscience, Marlborough, MA) to tyrosine residues in tissue sections, with subsequent heat stripping of primary-secondary antibody complexes until all antibodies were developed. Before mfIHC was performed, each antibody was individually optimized using a single-plex IHC assay using an appropriate positive control tissue known to possess the antigen under investigation. Negative controls included both uninfected animal tissues and isotype controls known not to react with NHP tissues (ie, exclusive rodent specificity). Optimization experiments were performed to determine ideal primary antibody dilution, sequential order of antibody development, assignment of each primary antibody to an Opal fluorophore, and fluorophore titration. All Opal TSA-conjugated fluorophore reactions took place for 20 minutes. Fluorescent slides were counterstained with spectral 4’,6-diamidino-2-phenylindole (DAPI) (Akoya Biosciences) for 16 minutes before being mounted with ProLong gold antifade (ThermoFischer, Waltham, MA). Antibodies utilized in 5-plex, 6-color (DAPI counterstained) analysis included: (panel 1) EBOV GP, CD14, CD16, S100A9, and major histocompatibility complex (MHC) class II or (panel 2) myeloperoxidase (MPO), EBOV GP, CD163, CD68, and myxovirus resistance protein 1 (MxA). Primary antibodies were developed with a secondary goat anti-rabbit or anti-mouse HRP polymer antibody (Vector Laboratories, Burlingame, CA) for 20 minutes at 37°C. Biologically relevant details about protein targets are provided in Table 1 with detailed optimization parameters outlined in Supplemental Table S1 that can be found on the online version of the article.
Chromogenic in situ Hybridization
For RNAscope ISH, an anti-sense probe (1164768-C1) targeting nucleotides 2-1,094 (20ZZ pairs) of the GP gene of EBOV Zaire isolate Ebola virus/H. sapiens-tc/COD/1995/Kikwit-9510621 (nt 6,039-8,068; GenBank Accession KU182905.1) was designed (Advanced Cell Diagnostics [ACD], Newark, CA, USA); 5 μm sections of FFPE liver blocks were mounted on positively charged Superfrost Plus slides (VWR, Radnor, PA). The RNAscope ISH assay was performed using the RNAscope 2.5 LS Duplex Reagent Kit (Advanced Cell Diagnostics, Newark, CA) on the automated BOND RXm platform (Leica Biosystems, Buffalo Grove, IL) with modifications for single-plex detection. Tissue sections were subjected to automated baking and deparaffinization followed by heat-induced epitope retrieval (HIER) using a ready-to-use ethylenediaminetetraacetic acid (EDTA)-based solution (pH: 9.0; Leica Biosystems) at 95°C for 15 minutes. Subsequently, tissue sections were treated with a ready-to-use protease (RNAscope® 2.5 LS Protease) for 15 minutes at 40°C followed by a ready-to-use hydrogen peroxide solution for 10 minutes at room temperature. Slides were then incubated with the EBOV GP-specific probe mixture for 2 hours at 40°C. The signal was amplified using amplifiers 1–3 (AMP1–AMP3) followed by AMP8–AMP10, as recommended by the manufacturer. The signal was subsequently detected by incubating with 3,3’-diaminobenzidine (DAB) for 20 minutes and the BOND DAB Enhancer (Leica Biosystems) for an additional 20 minutes at room temperature. Slides were counterstained with a ready-to-use hematoxylin for 5 minutes, followed by a ready-to-use bluing solution for 2 minutes. Slides were finally rinsed in deionized water, dried in a 60°C oven for 30 minutes, and mounted with Ecomount (Biocare, Concord, CA, USA). A negative control probe mixture (DapB) was used as negative control, and a species-specific probe mixture targeting POLR2A mRNA was used as a positive control to confirm RNA integrity of samples. Detailed optimization parameters are outlined in Supplemental Table S2 that can be found on the online version of the article.
Whole Slide Imaging
Fluorescent- and chromogen-labeled slides were imaged using a Vectra Polaris Quantitative Pathology Imaging System (Akoya Biosciences) to generate whole slide images for each animal and assay described in this study. For fluorescently labeled slides, exposures for all Opal dyes were set based upon regions of interest with strong signal intensities to minimize exposure times and maximize the specificity of signal detected. A brightfield acquisition protocol was used for chromogenically labeled slides.
Linear Unmixing and Tile Fusion of Fluorescent Whole Slide Images
Whole slide images were segmented into QPTIFFs using the region of interest (ROI) function in Phenochart (Akoya Biosciences), uploaded into Inform software version 2.4.9 (Akoya Biosciences), unmixed using spectral libraries affiliated with each respective opal fluorophore and endogenous autofluorescence, then fused together as a single whole slide image in HALO (Indica Labs, Inc., Corrales, NM).
Quantitative Analysis of mflIHC
View settings were adjusted to allow for optimal visibility of immunomarkers and to reduce background signal by setting threshold gates to minimum signal intensities. After optimizing view settings, annotations around the entire tissue were created to define the analysis area using the flood tool and artifacts were excluded using the exclusion pen tool. For quantifying mfIHC, an algorithm called the HALO (v3.4.2986.151, Indica Labs, Albuquerque, NM, USA) Area Quantification (AQ) module was created and fine-tuned to quantify the immunoreactivity for all targets. Thresholds were set to define positive immunoreactivity based on a real-time tuning feature. AQ results were reported as the percentage of total area displaying positive immunoreactivity as well as fold change compared with uninfected controls applied across the entire annotated whole slide image. An immunophenotyping module called the HALO (Indica Labs) Highplex module was utilized for quantifying the number of infected hepatocytes expressing MxA. Thresholds for the cytoplasm and membrane were set using the real-time tuning feature. Phenotypes were determined as follows: infected MxA+ hepatocyte (EBOV GP+MxA+CD68−MPO−), infected MxA− hepatocyte (EBOV GP+MxA−CD68−MPO−), uninfected MxA+ hepatocyte (EBOV GP−MxA+CD68−MPO−), and uninfected MxA- hepatocyte (EBOV GP−MxA−CD68−MPO−). Outputs from this algorithm were reported as total number of cells as well as the area analyzed, and from this, cells/mm2 was calculated. All HALO data were exported as an .csv file. An overview of the slide preparation, imaging, and analysis workflow are illustrated in Supplemental Figure S1 that can be found on the online version of the article.
Statistical Analysis
Descriptive statistics and graphics, as well as statistical tests were performed using GraphPad Prism v9.3.1 statistical analysis software (GraphPad, San Diego, CA). Quantitative pathology results were analyzed using a two-way analysis of variance (ANOVA), one-way ANOVA, or a correlation analysis. Tests were performed to determine the presence of statistical significance between unmatched groups: control, 3 DPI, 4 DPI, 5 DPI, 6 DPI, and terminal animals (6–8 DPI). Sidak’s and Tukey’s multiple comparison tests were utilized to determine differences between groups. Error bars for all graphs represent standard deviation. Fold changes were calculated from normalization to uninfected control values for each marker. Pearson’s r values were calculated using the correlation matrix in Prism (GraphPad), and cut-offs for these r value associations were defined as follows: weak— ±0.2–0.4, moderate— ±0.4–0.6, strong— ±0.6–0.8, very strong— ±0.8–1.0. A P value < .05 was defined as statistically significant.
Results
EBOV Causes Macrophage Phenotype Alterations in the Liver of Late-Stage EVD
EBOV GP (protein and RNA) was first observed sporadically and exclusively in sinusoidal macrophages at 3 DPI and increased abruptly by 5 DPI to include hepatocytes in addition to macrophages, with detection in both cell populations persisting through terminal disease (Figs. 2–6). Hepatic macrophages in uninfected controls, and in animals at 3 and 4 DPI displayed primarily CD14−16+68+163+ phenotypes, switching abruptly to primarily CD14+16−68+163− macrophages by ≥ 5 DPI (Figs. 2, 3, 5, 6). Overall, influx of macrophages into the liver was supported by a temporal increases in CD68 percent positive immunoreactivity in terminal animals compared with 3 DPI (P = .0073), and 4 DPI (P = .0090) animals, and was moderately positively correlated with the increase in EBOV GP percent positive immunoreactivity (r = 0.5546, P = .0091). CD68 percent positive immunoreactivity showed a 1.4-fold increase in terminal animals compared with uninfected controls, albeit not statistically significant. CD16 percent positive immunoreactivity precipitously decreased by ≥ 5 DPI, with rare detection of residual CD16+ macrophages in the hepatic parenchyma of terminal animals compared with uninfected controls (P < .0001), 3 DPI (P < .0001), and 4 DPI (P < .0001) animals (Figs. 2, 5, 6). This was further reflected by a 58.8-fold decrease in CD16 immunoreactivity in 6 DPI animals (P = .0256) and a 128.2-fold decrease in terminal animals compared with uninfected controls (P = .0081). CD16 percent positive immunoreactivity was strongly positively correlated with several clinical parameters that are predictive of EVD progression, such as declining albumin (r = 0.828, P < .0001), platelet concentrations (r = 0.735, P = .0001), and monocyte count (r = 0.739, P = .0001). CD16 immunoreactivity was also strongly negatively correlated with increasing liver enzymes activity for AST (r = −0.745, P = .0001), and moderately negatively correlated with alanine transaminase (ALT_ (r = −0.665, P = .001) and gamma-glutamyl transferase (GGT) (r = −0.570, P = .007) (Figs. 7, 8). CD163 percent positive immunoreactivity decreased more gradually, albeit significantly comparing terminal animals with uninfected negative controls (P = .0059), 3 DPI (P = .0014), and 4 DPI (P = .0043) animals (Figs. 3, 5–7) and displayed a strong negative correlation with AST (r = −0.71, P = .0003; Figs. 7, 8). A significant fold change was also observed for CD163 immunoreactivity, with terminal animals displaying a 2.38-fold decrease compared with uninfected controls (P = .0059). CD14 percent positive immunoreactivity displayed the largest temporal fold increase of 142.7 in terminal animals (P = .0154) compared with uninfected controls. Temporally declining percent positive immunoreactivity of CD16 and CD163 were strongly positively correlated (r = 0.7801, P < .0001; Figs. 7, 8). CD14 percent immunoreactivity showed a large fold change of 142.7 in terminal animals compared with uninfected controls (P = .0154), and significant increases were observed between terminal animals and uninfected controls, 3 DPI, and 4 DPI (P = .0154, P = .0154, and P = .0158, respectively). CD14 also displayed a strong positive correlation with AST (r = 0.78, P < .0001; Figs. 7, 8) and strong negative correlation to CD163 (r = −0.77, P < .0001; Figs. 7, 8).
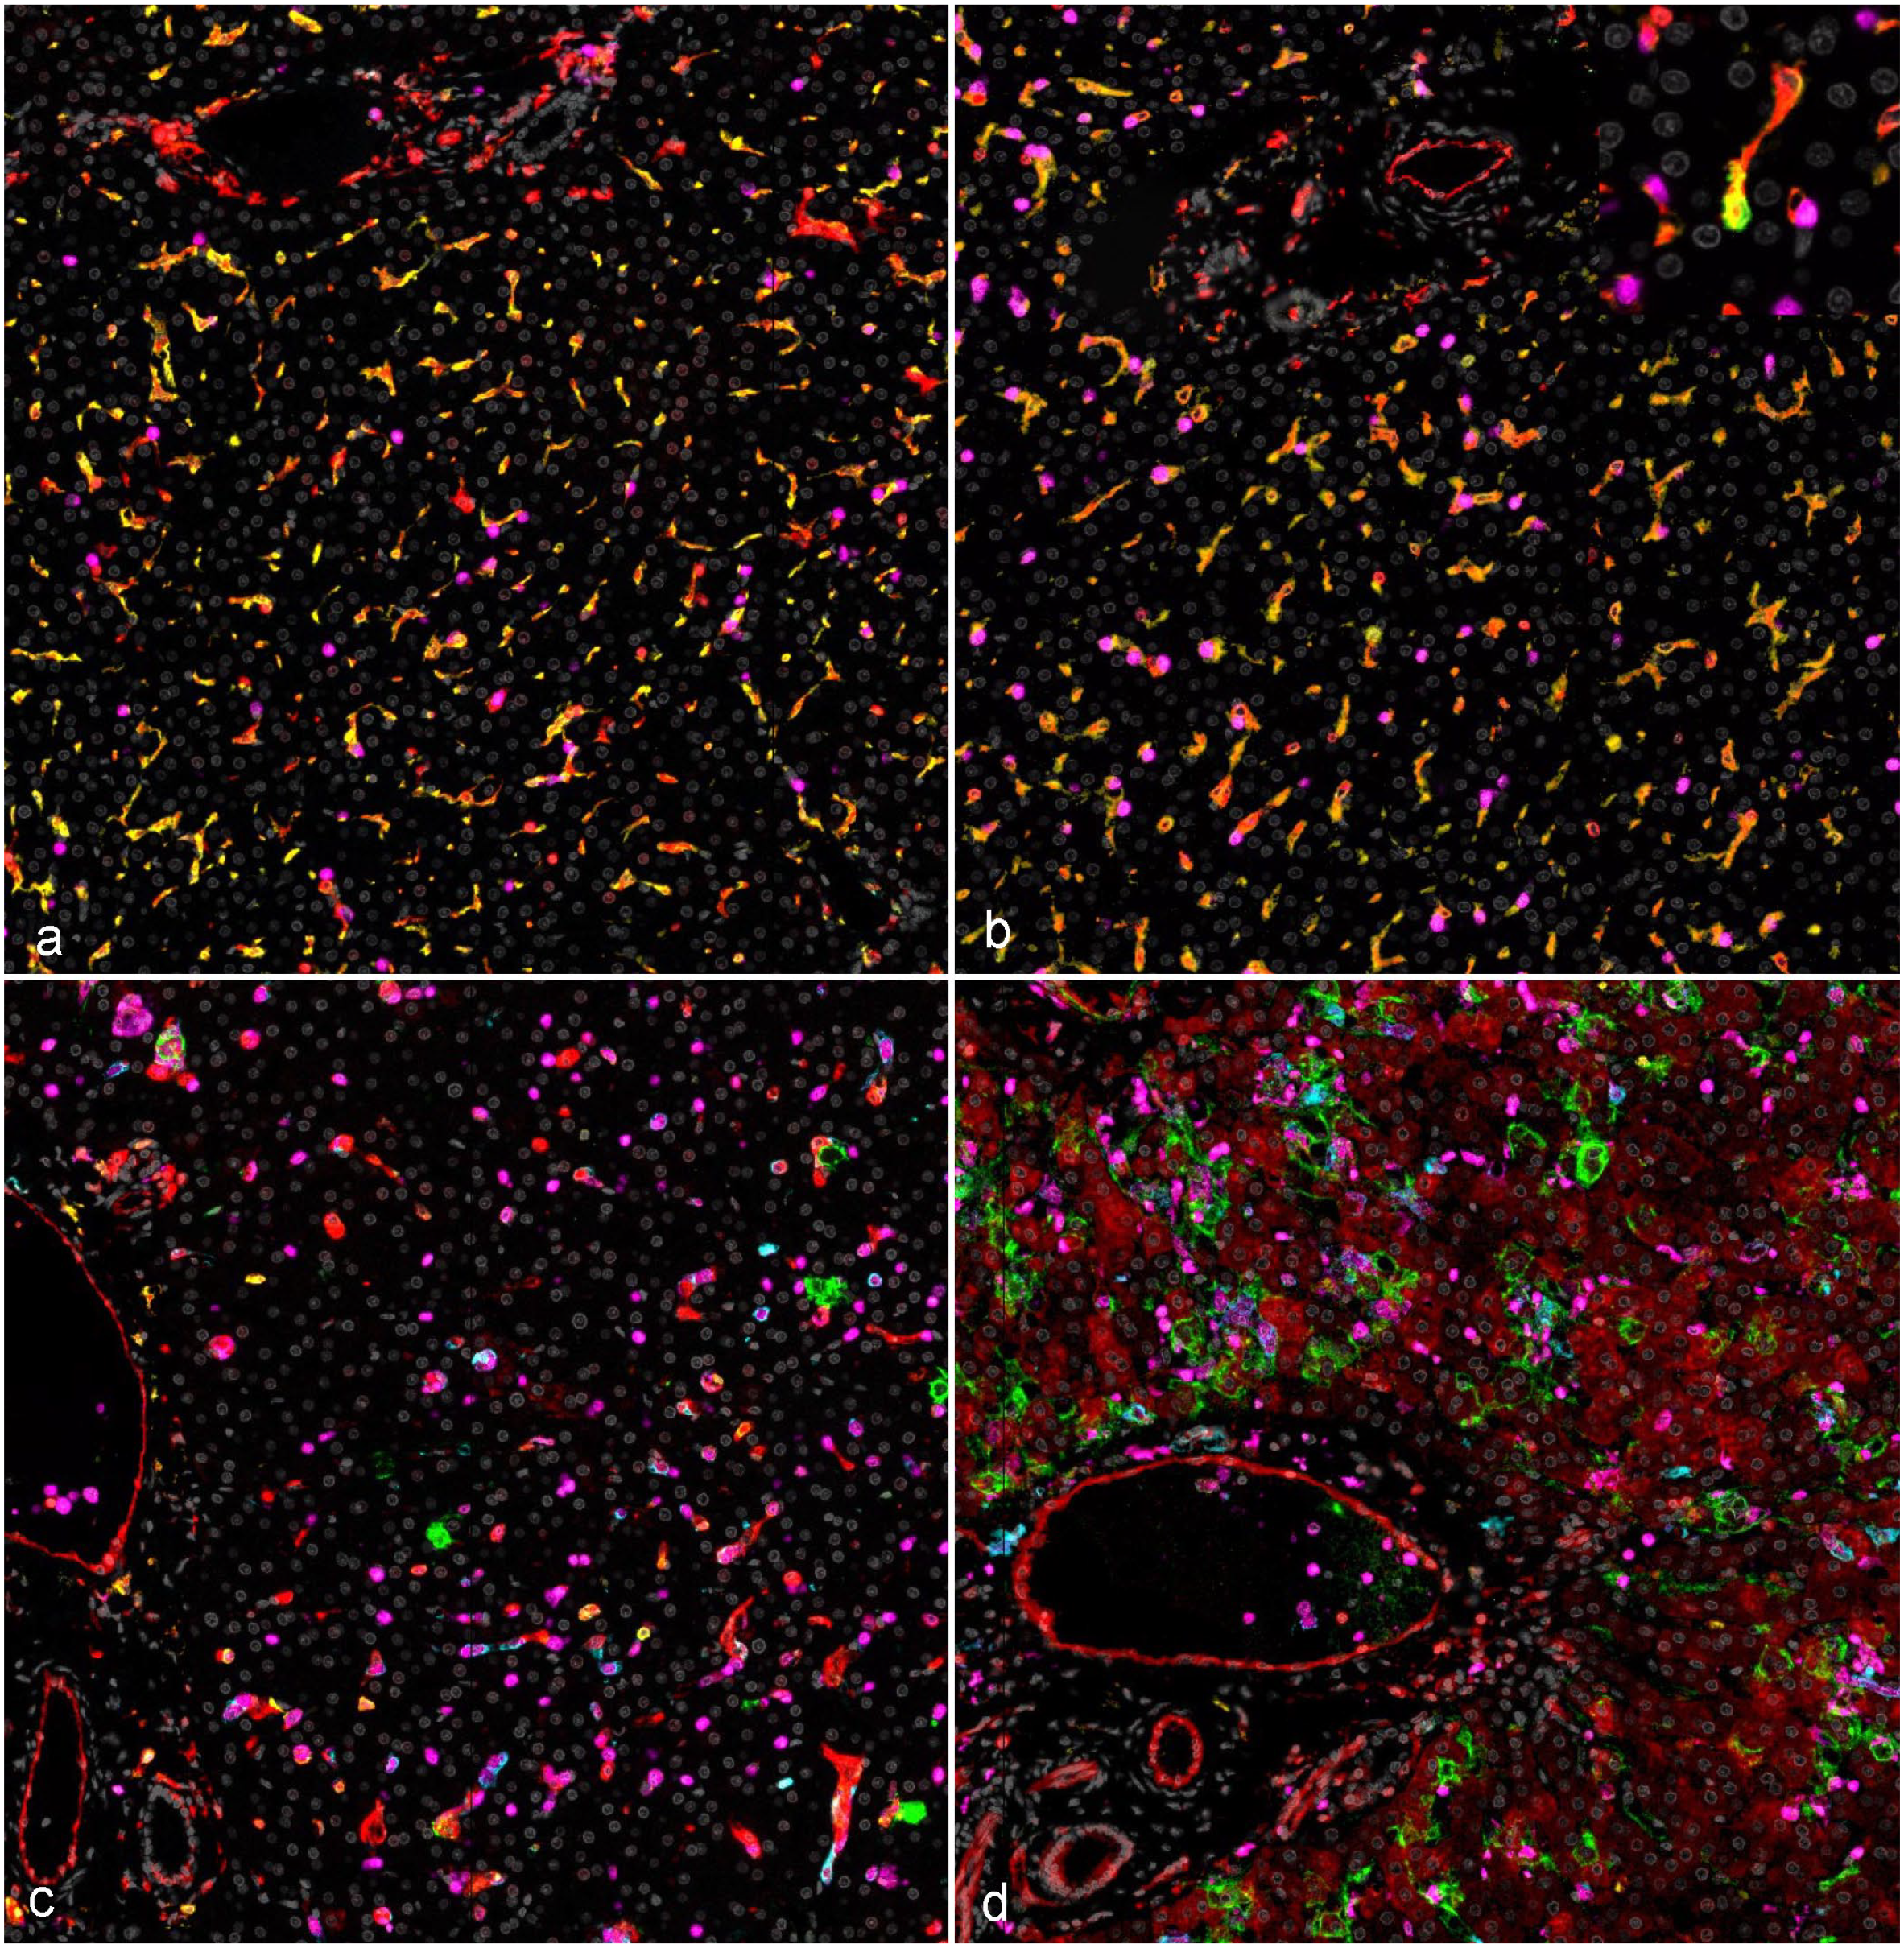
Temporal myeloid phenotype and host response alterations, liver, rhesus monkeys infected with Ebola virus (EBOV) Kikwit (panel 1). (a) Uninfected negative control, abundant CD16 (yellow) and MHC class II (red) immunoreactivity within uninfected Kupffer cells. (b) 3 days postinoculation (DPI), no overt changes from baseline uninfected controls, with rare detection of EBOV GP (green, insert). (c) 5 DPI, sporadic EBOV glycoprotein (GP-green) within the cytoplasm of hepatocytes and macrophages with a concurrent precipitous drop in CD16 immunoreactivity (yellow), increasing expression of S100A9 (magenta), and initial detection of CD14 (teal). (d) Terminal disease (6–8 DPI), peak EBOV GP (green) immunoreactivity, with abundant MHC class II (red) immunoreactivity in hepatocytes, endothelium, and myeloid cells, with peak CD14 (teal) and S100A9 (magenta) immunoreactivity. DAPI (gray); EBOV GP (green); MHC Class II (red); CD14 (teal); CD16 (yellow); S100A9 (magenta). Multiplex fluorescent immunohistochemistry. MHC, major histocompatibility complex; GP, glycoprotein; DAPI, 4’,6-diamidino-2-phenylindole.
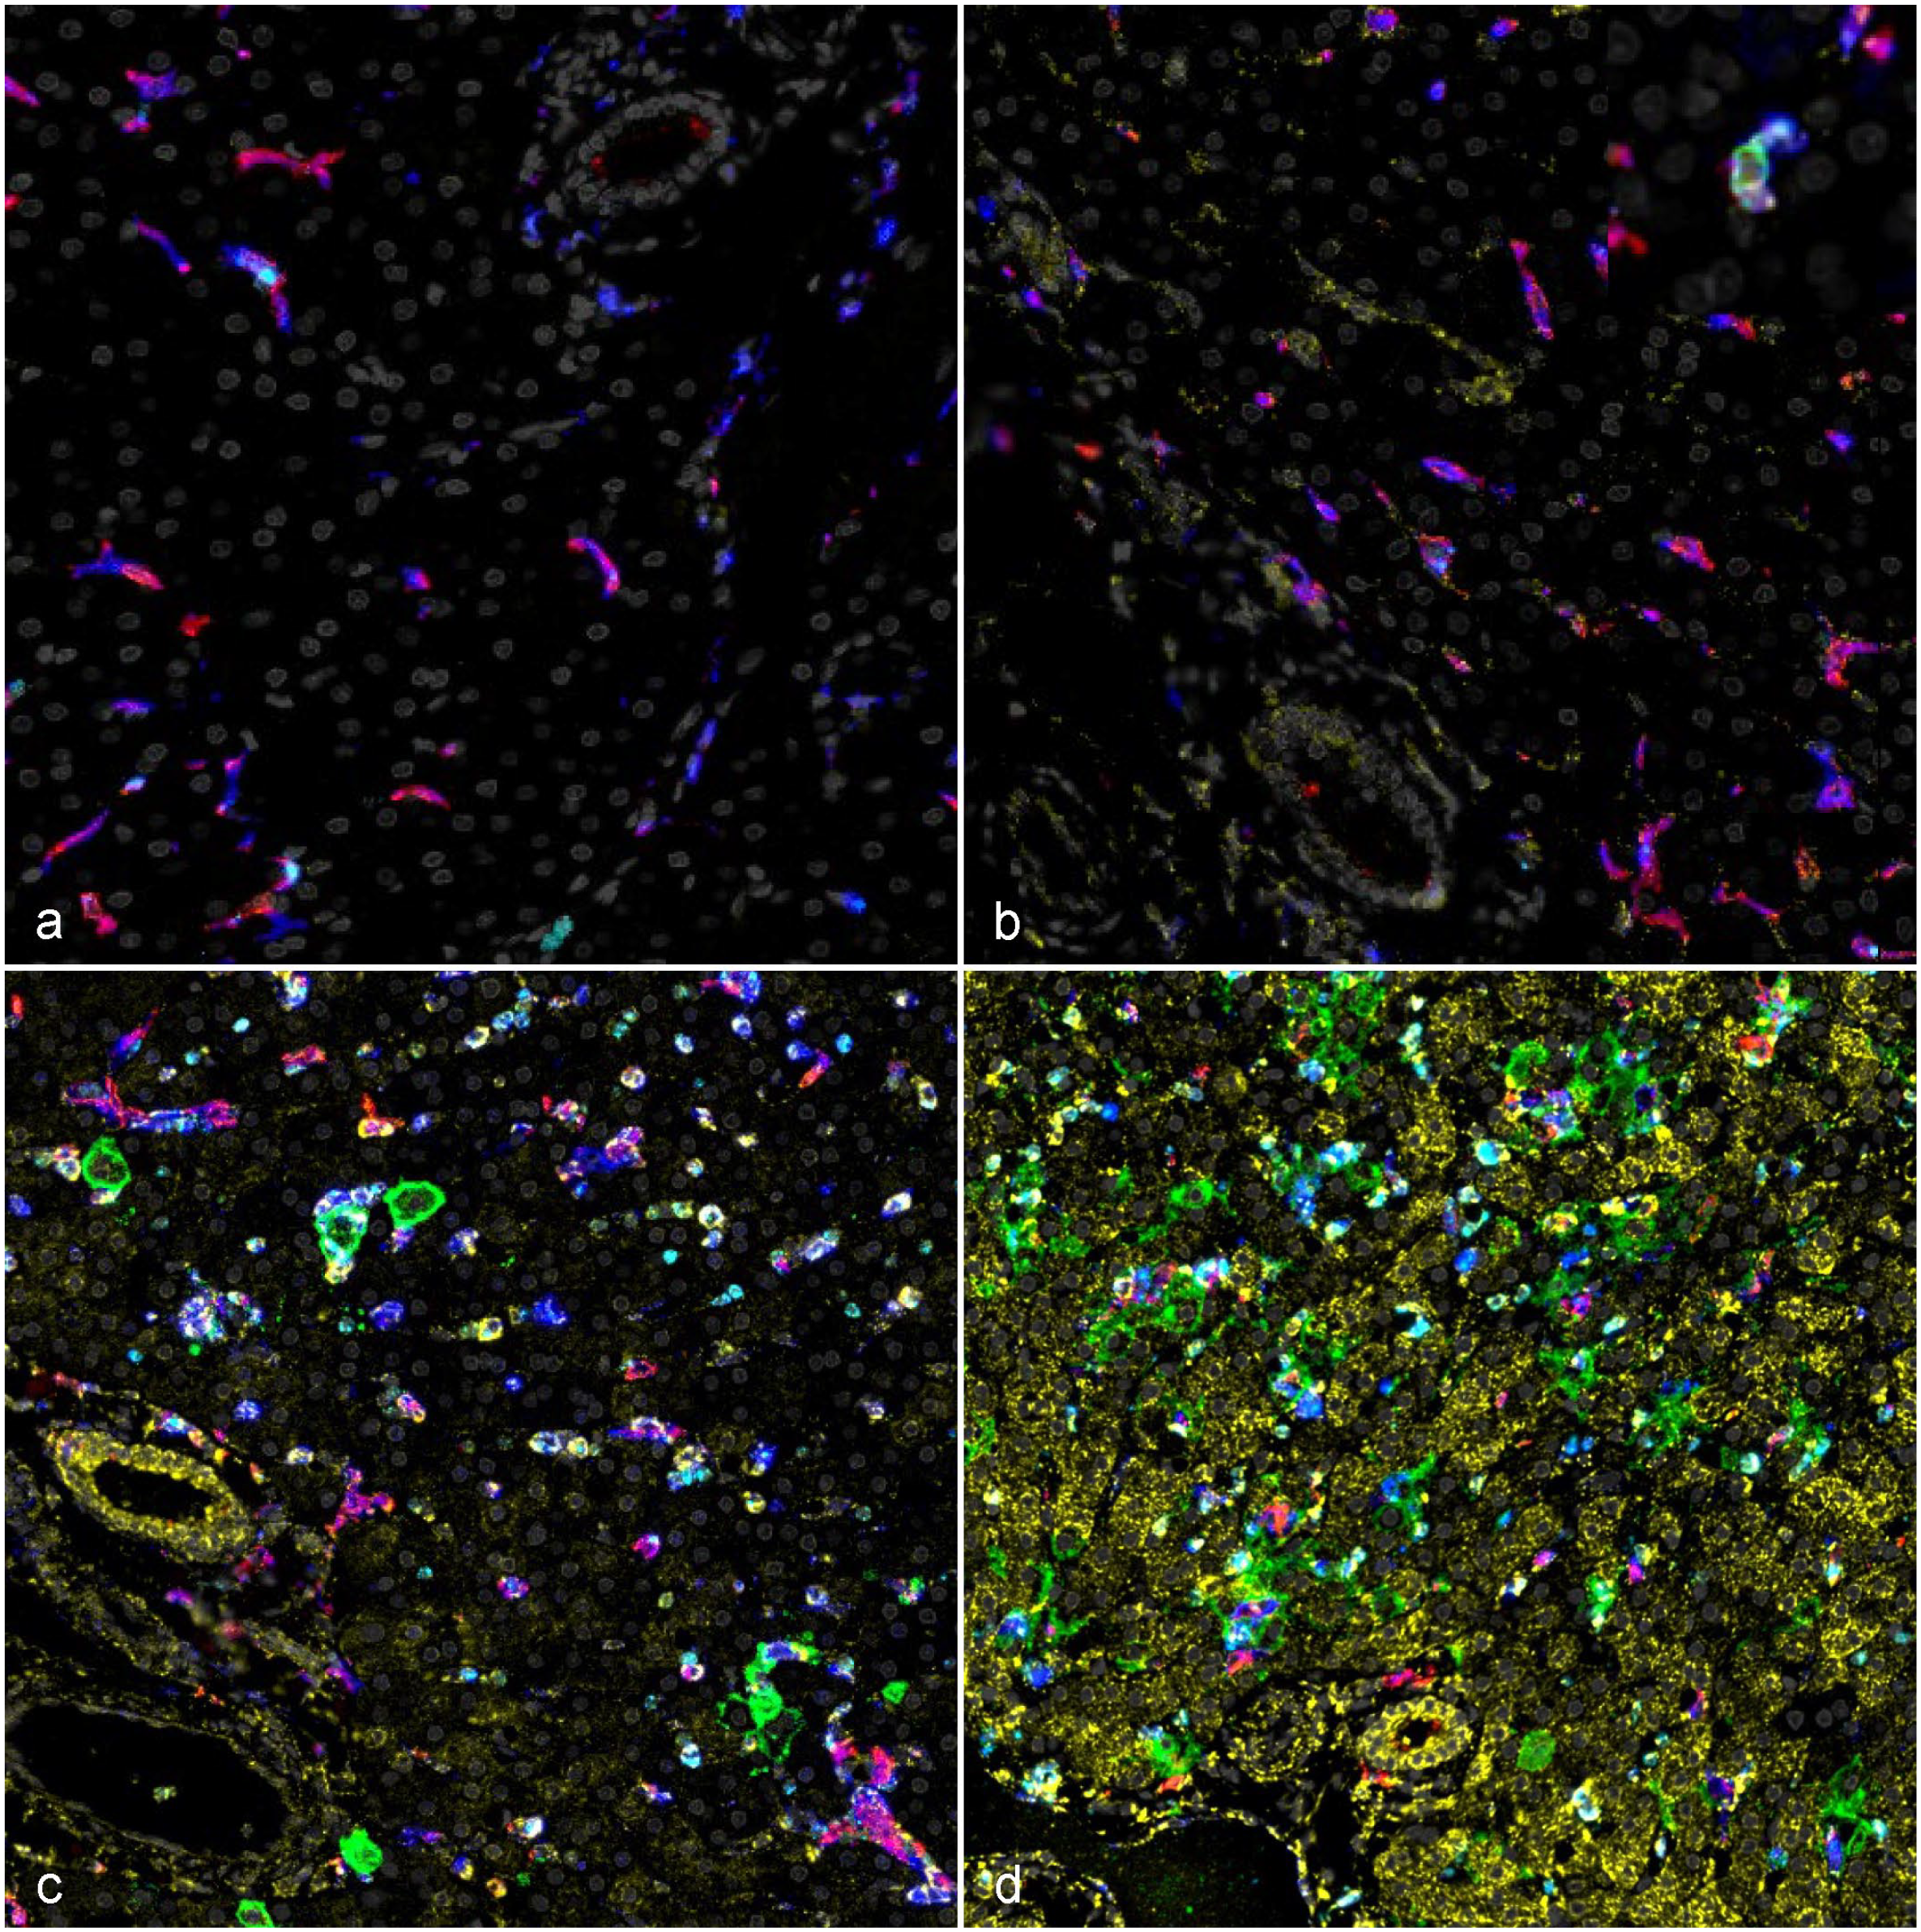
Temporal myeloid phenotype and host response alterations, liver, rhesus monkeys infected with Ebola virus (EBOV) Kikwit (panel 2). (a) Uninfected negative control, abundant CD163 (red) immunoreactivity that routinely colocalizes with CD68 (blue) immunoreactivity in resident uninfected Kupffer cells. (b) 3 days postinoculation (DPI), no appreciable change from baseline uninfected controls except for mild early myxovirus resistance protein 1 (MxA) (yellow) immunoreactivity primarily in sinusoidal mononuclear cells, with rare immunoreactivity of EBOV glycoprotein antigen (EBOV GP, green; insert). (c) 5 DPI, sporadic EBOV GP (green) within the cytoplasm of hepatocytes and macrophages with a decline in CD163 (red) immunoreactivity, sharp influx of neutrophils as evidenced by myeloperoxidase (MPO, teal) and increasing MxA (yellow) immunoreactivity. (d) Terminal disease (6–8 DPI), abundant EBOV GP (green), with peak MxA (yellow) immunoreactivity, a residual decline in CD163 (red), and persistence of elevated MPO (teal). DAPI (gray); EBOV GP (green); CD68 (blue); CD163 (red); MxA (yellow); MPO (teal). Multiplex fluorescent immunohistochemistry. GP, glycoprotein; DAPI, 4’,6-diamidino-2-phenylindole.
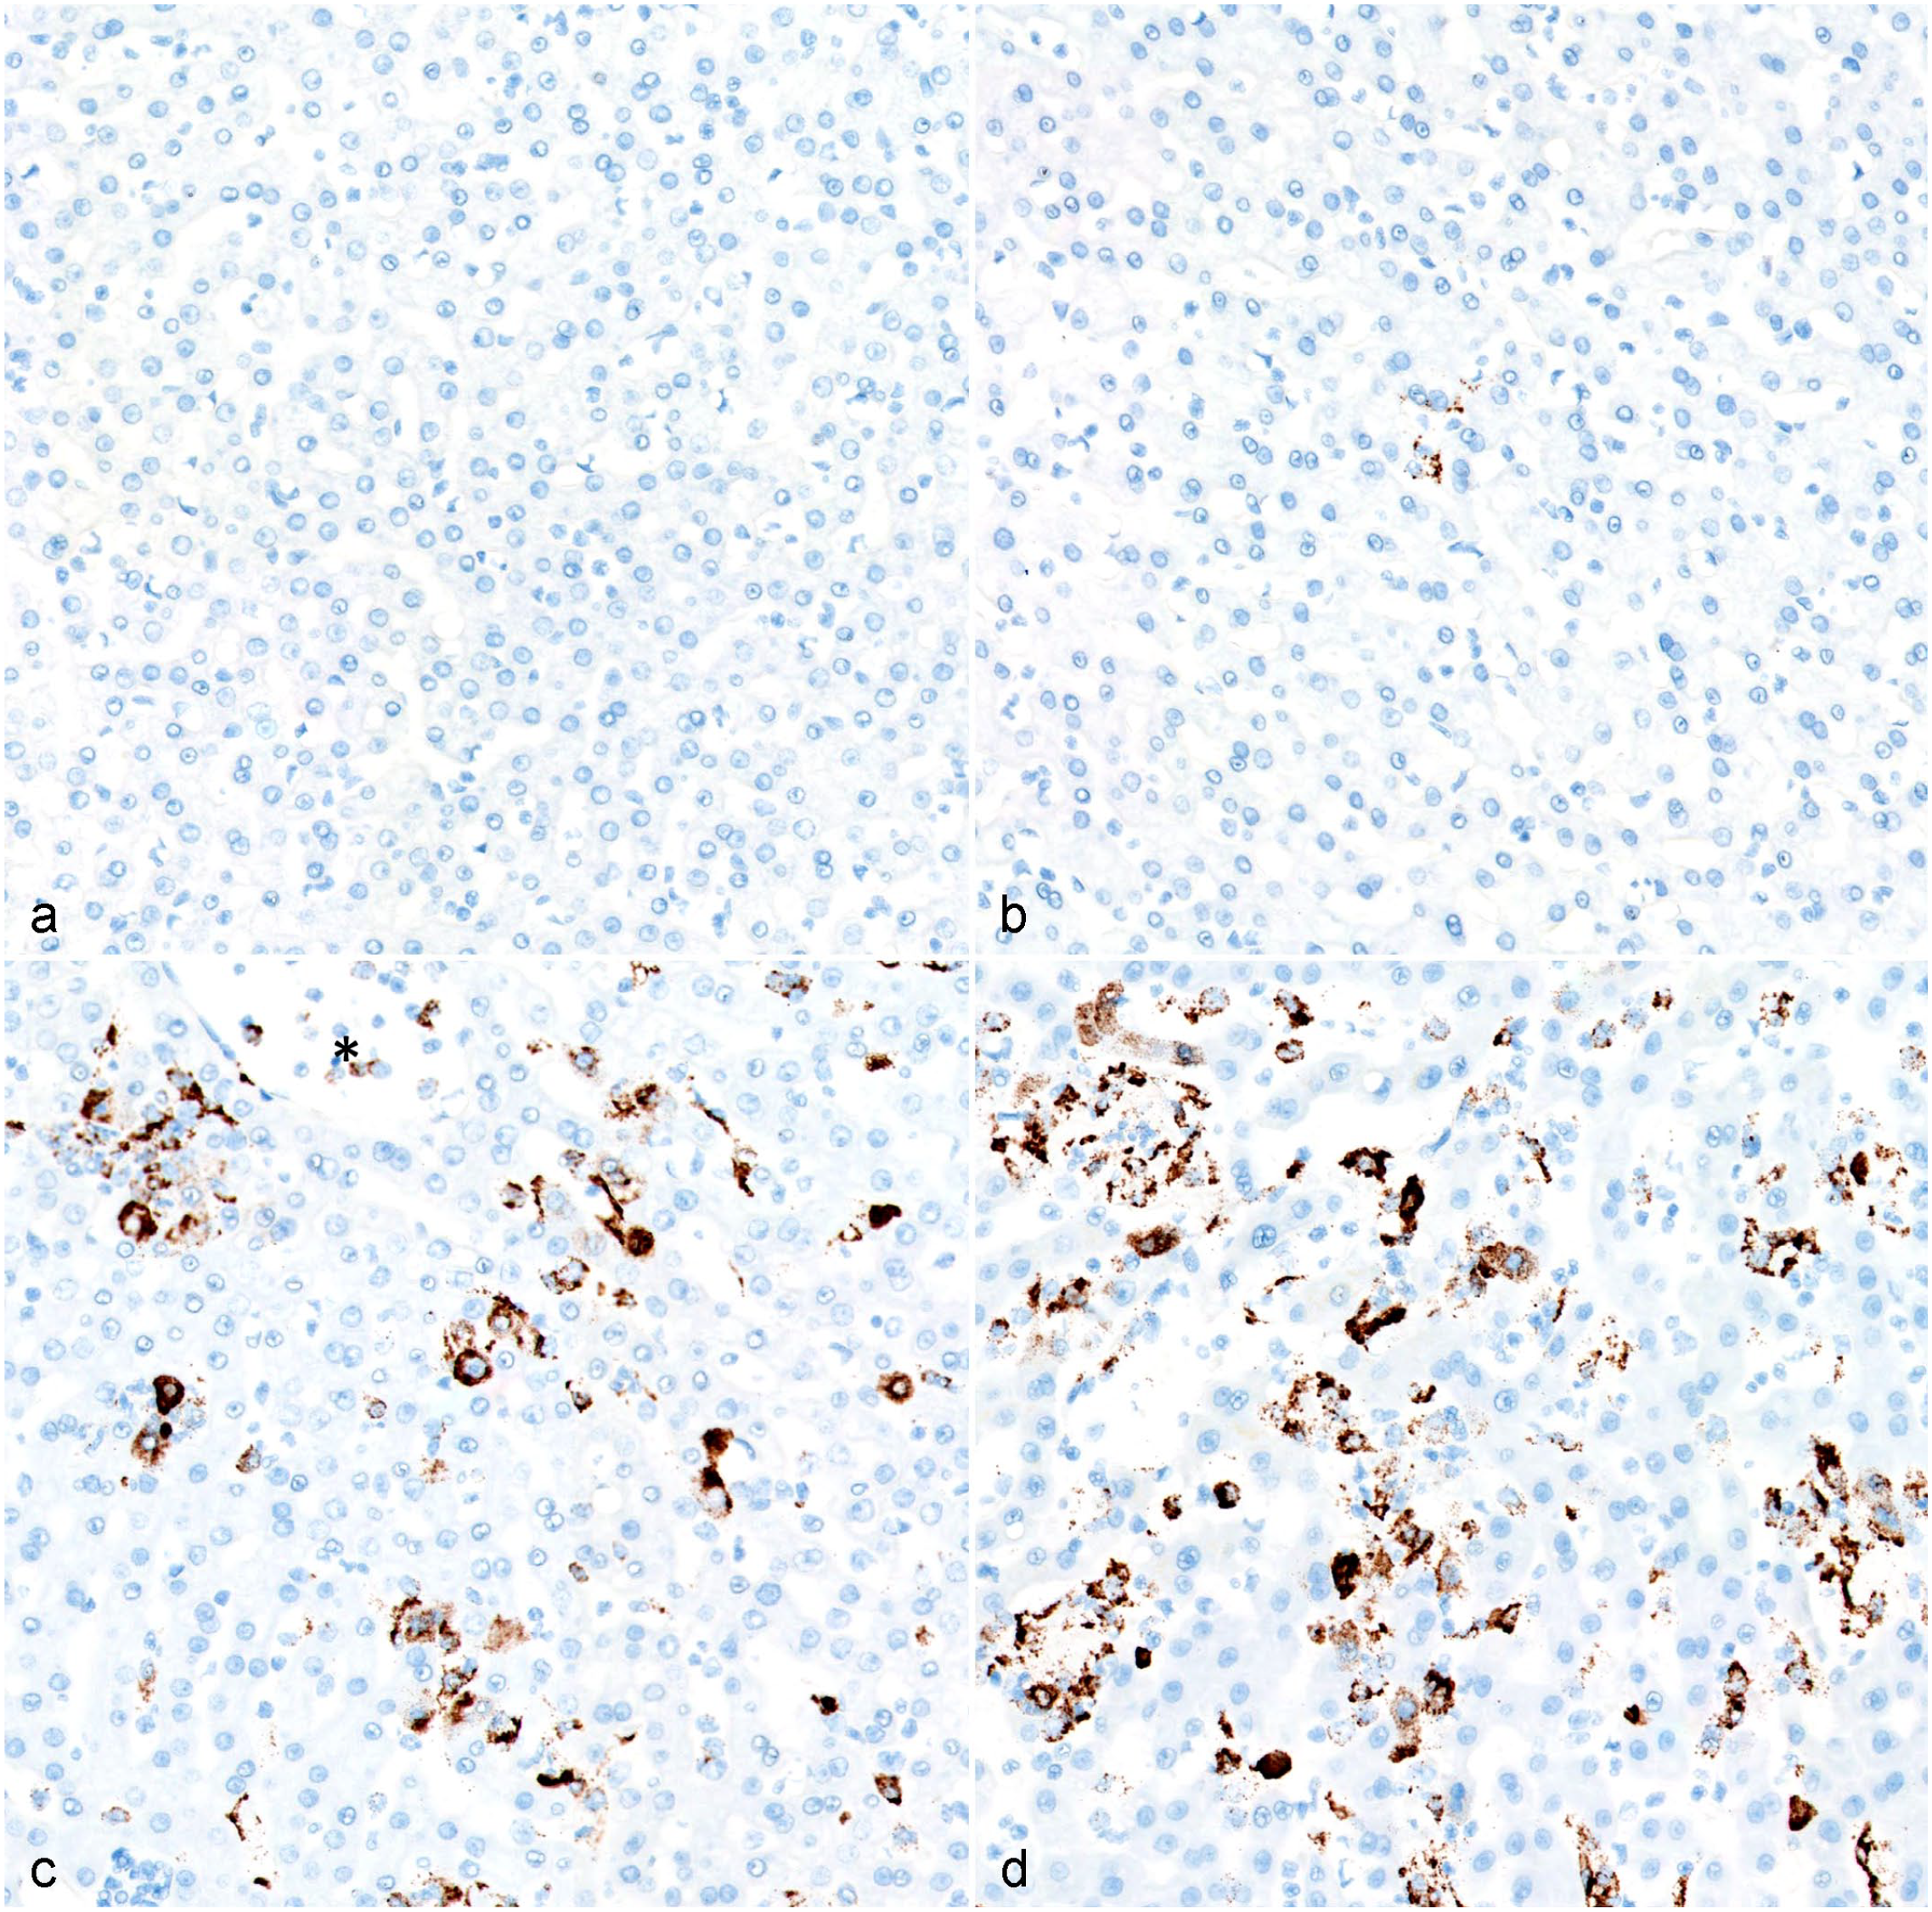
Temporal detection of negative sense genomic Ebola virus (EBOV) glycoprotein (EBOV GP) RNA, liver, rhesus monkeys infected with EBOV Kikwit. (a) Uninfected control, no viral RNA detectable. (b) 3 days postinoculation (DPI), rare sporadic genomic viral RNA hybridization of sinusoidal macrophages. (c) 5 DPI, abundant genomic viral RNA in both sinusoidal macrophages and hepatocytes; detection in circulating monocytes is also evident (*). (d) Terminal (6–8 DPI), persistence of abundant viral genomic RNA in sinusoidal macrophages and hepatocytes. Chromogenic in situ hybridization.
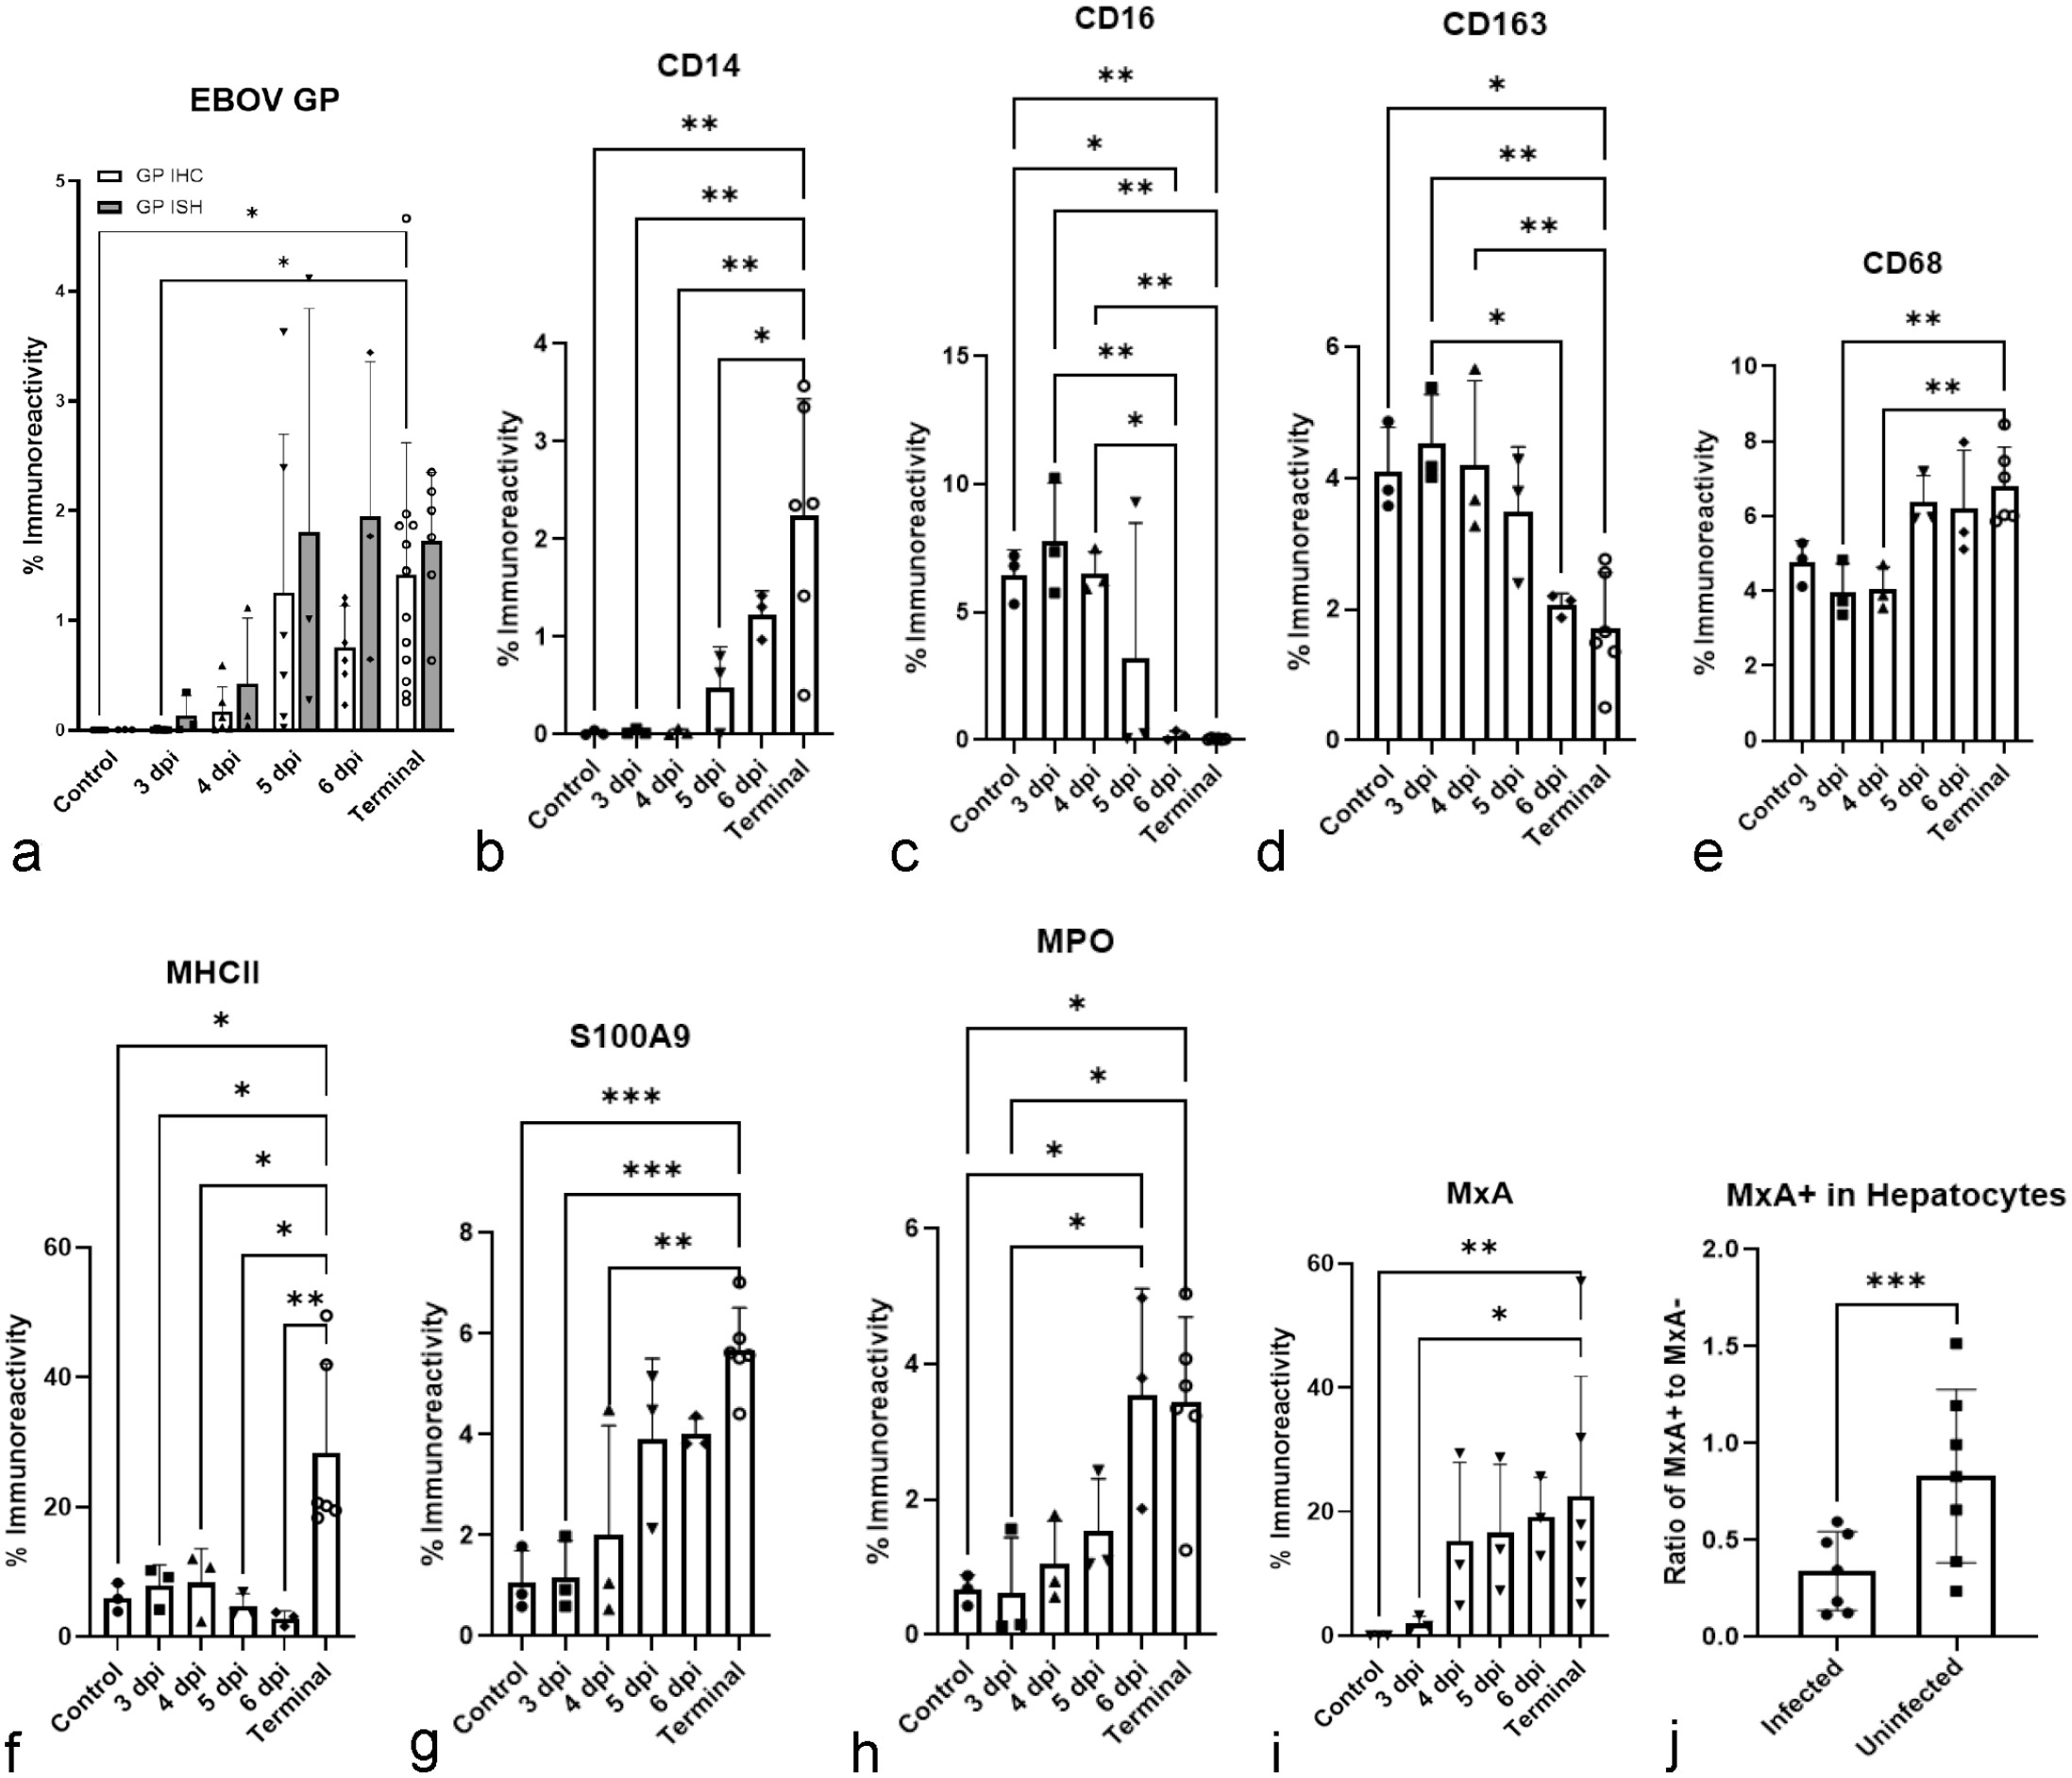
Temporal percent immunoreactivity changes in hepatic myeloid phenotypes and interferon induced host responses (myxovirus resistance protein 1 (MxA) and major histocompatibility complex (MHC) class II expression) in the liver of rhesus monkeys infected with Ebola virus (EBOV) Kikwit. (a) EBOV glycoprotein (GP) percent positive immunoreactivity. (b) CD14 percent positive immunoreactivity. (c) CD16 percent positive immunoreactivity. (d) CD163 percent positive immunoreactivity. (e) CD68 percent positive immunoreactivity. (f) Major MHC class II positive immunoreactivity. (g) S100A9 percent positive immunoreactivity. (h) Myeloperoxidase (MPO) percent positive immunoreactivity. (i) Myxovirus resistance protein A (MxA) percent positive immunoreactivity. (j) Ratio of infected and uninfected cells expressing MxA. Quantitative analysis of each molecular target was performed using either the Halo Area Quantification (AQ) or the fluorescent high plex phenotyping algorithm. *P ≤ .05. **P ≤ .01. ***P ≤ .001. Error bars represent the standard deviation.
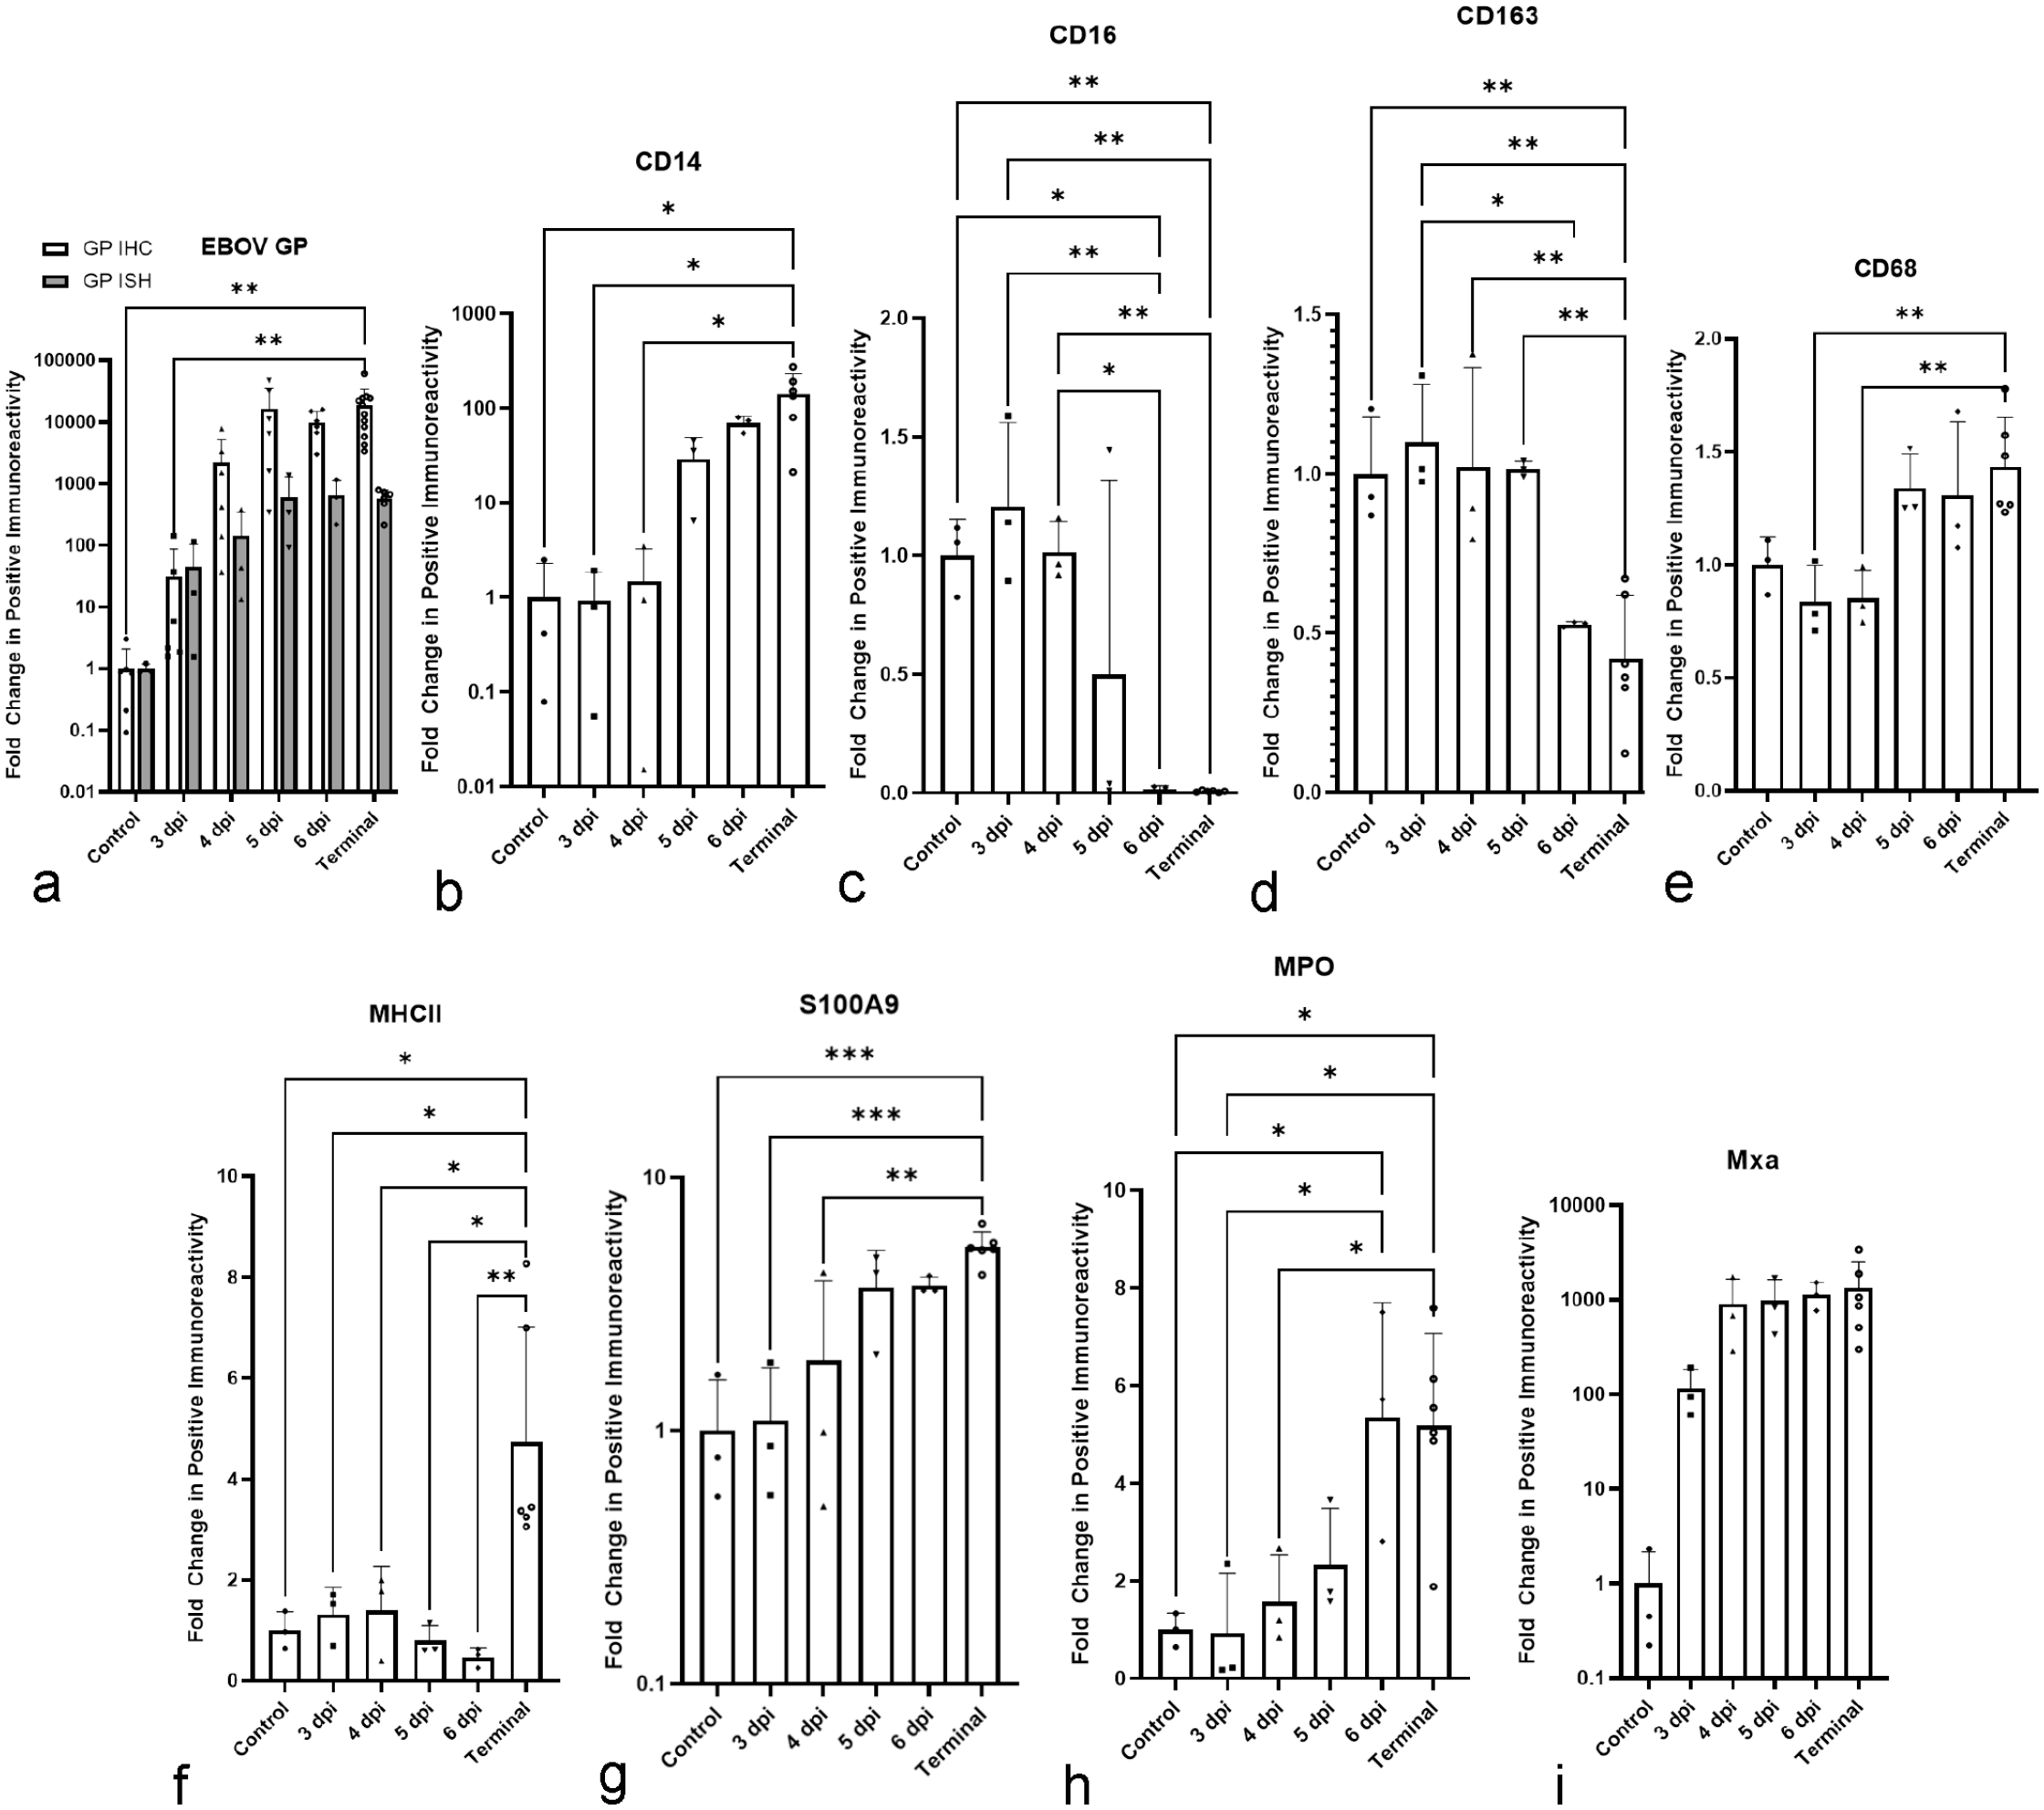
Temporal fold changes of hepatic myeloid phenotypes and interferon induced host responses (myxovirus resistance protein 1 (MxA) and major histocompatibility complex (MHC) class II expression in the liver of rhesus monkeys infected with Ebola virus (EBOV) Kikwit compared with uninfected controls. (a) EBOV glycoprotein (GP) fold change. (b) CD14 fold change. (c) CD16 fold change. (d) CD163 fold change. (e) CD68 fold change. (f) MHC class II fold change. (g) S100A9 fold change. (h) Myeloperoxidase (MPO) fold change. (i) Mxa fold change. Quantitative analysis of each molecular target was performed using the Halo Area Quantification (AQ) algorithm. *P ≤ .05. **P ≤ .01. ***P ≤ .001. Error bars represent the standard deviation.
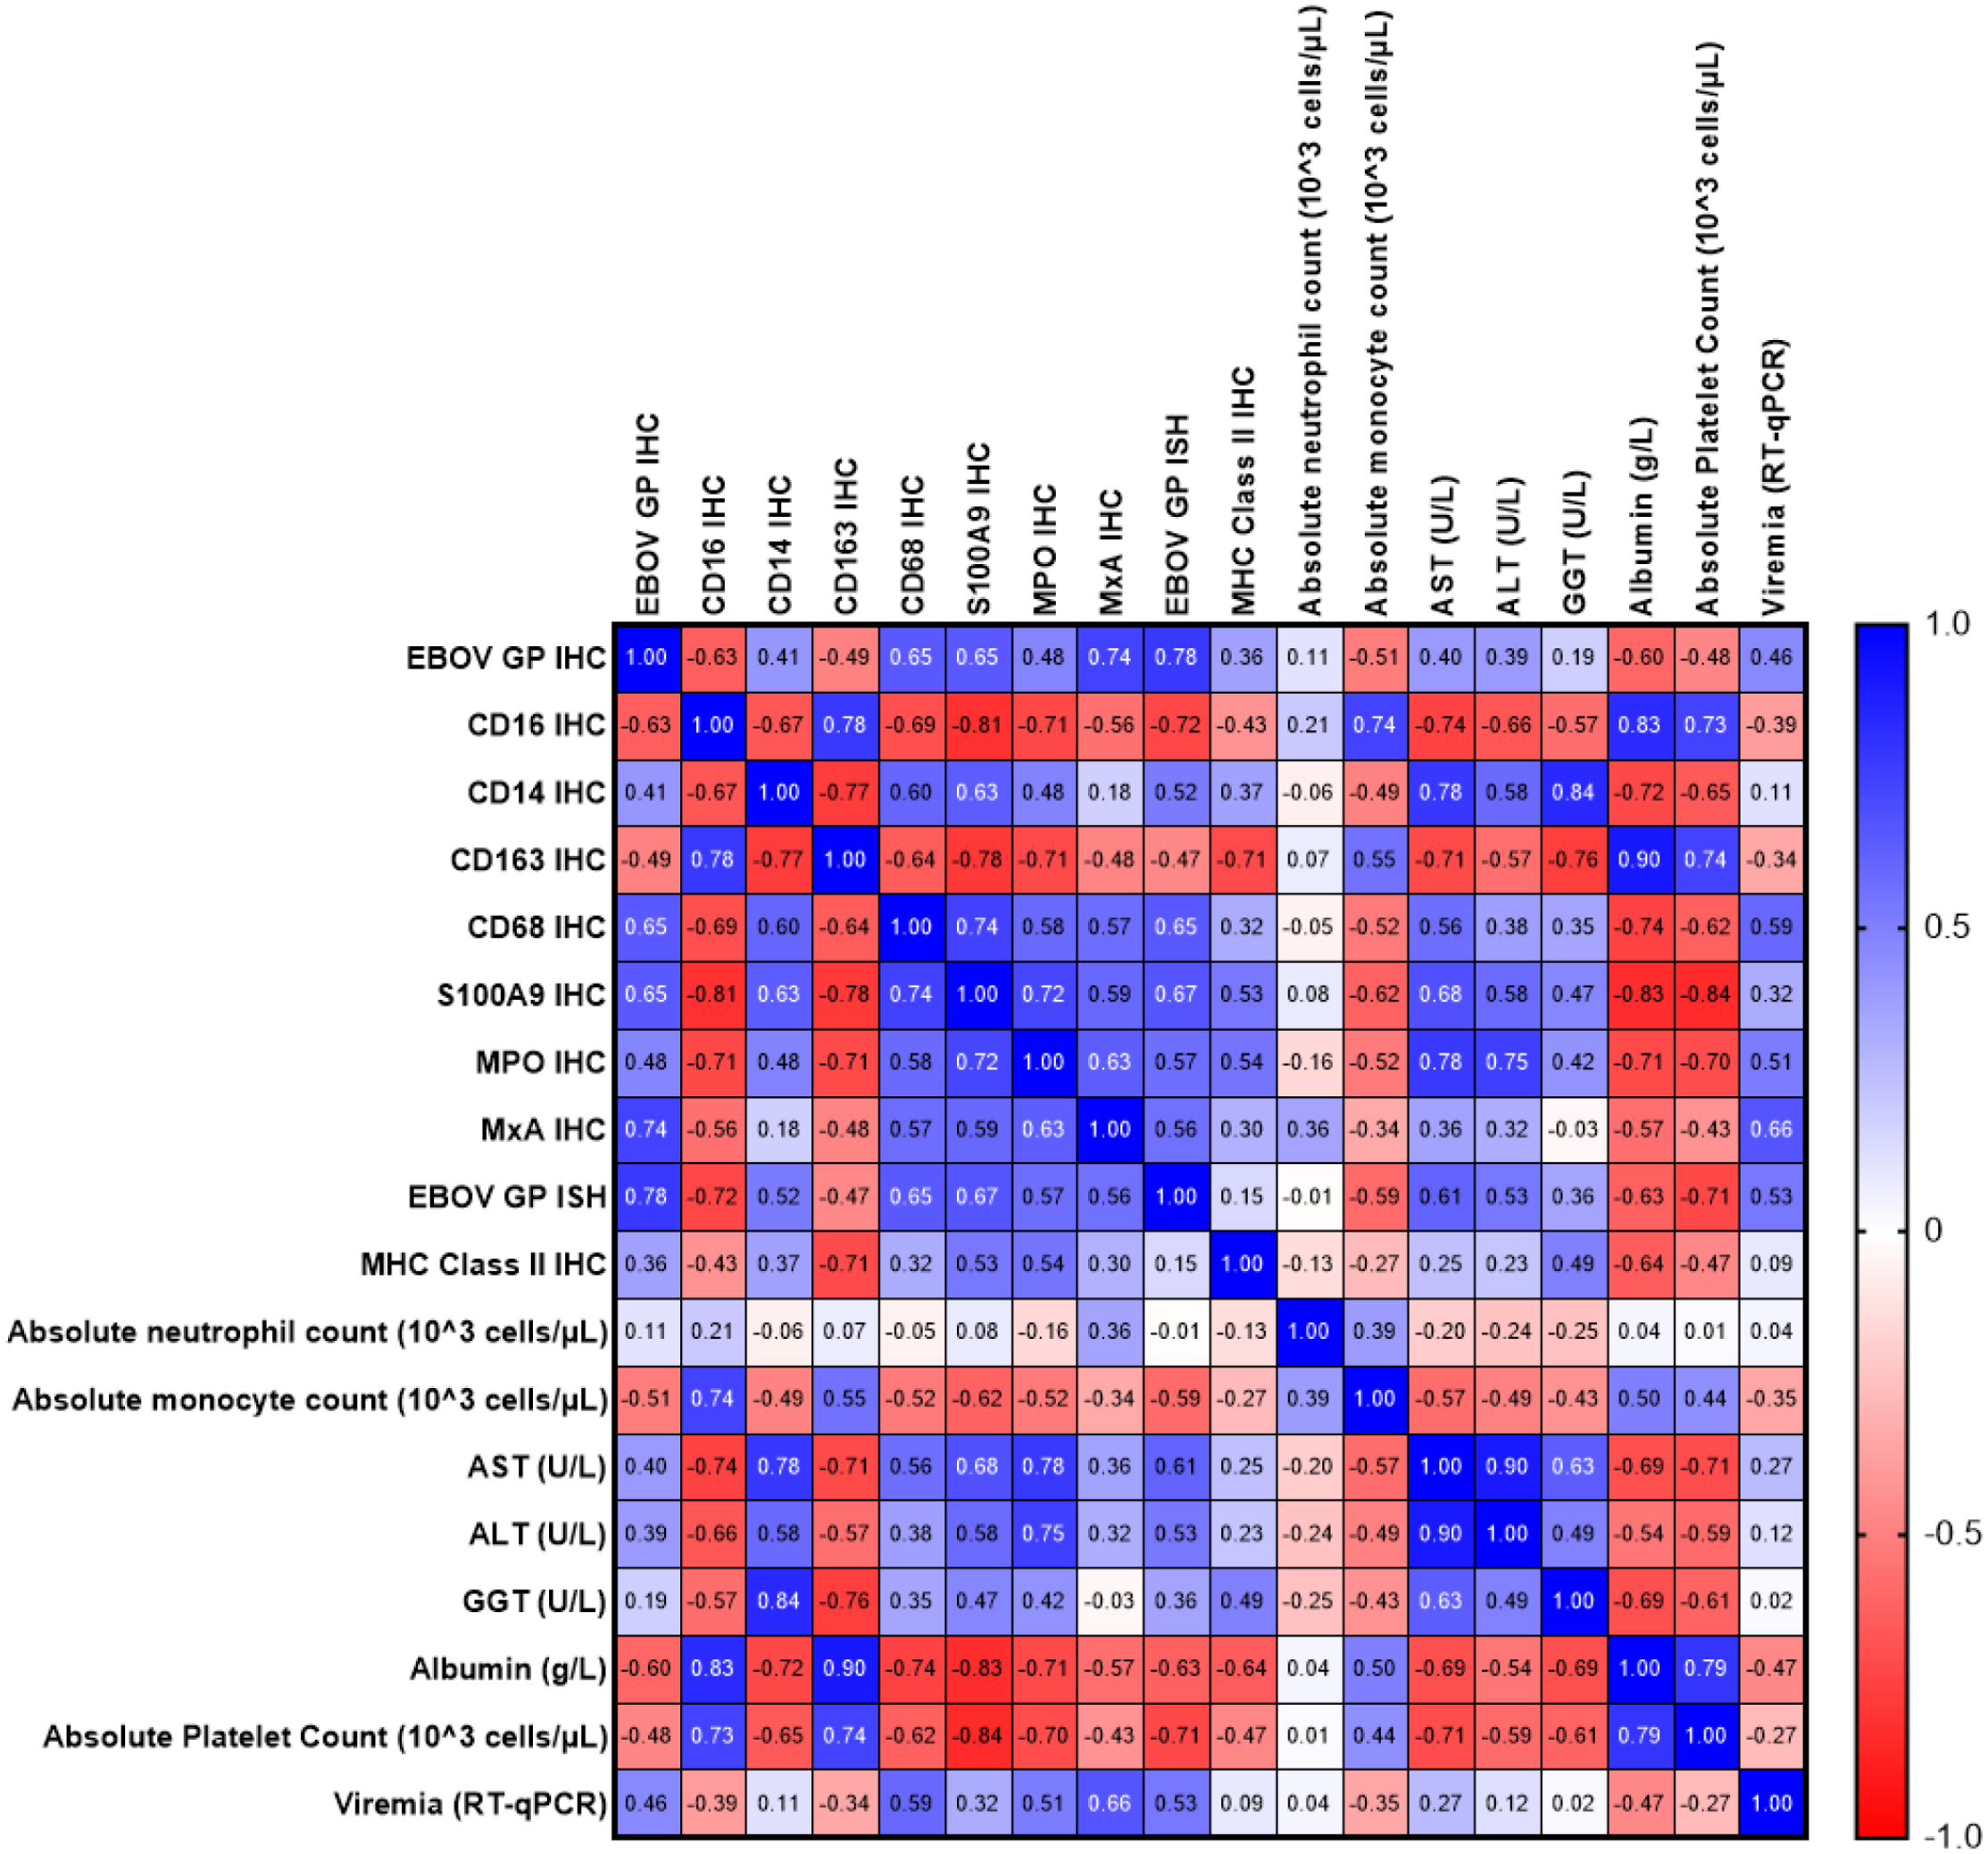
Heat map characterizing the correlation of previously published virological and clinicopathologic findings with the immunohistochemistry and in situ hybridization findings derived from this study. 6 Pearson r values from correlation analysis. Blue represents a positive correlation, while red indicates a negative correlation. Pearson’s r values associations were defined as follows: weak— ±0.2–0.4, moderate— ±0.4–0.6, strong— ±0.6–0.8, very strong— ±0.8–1.0.
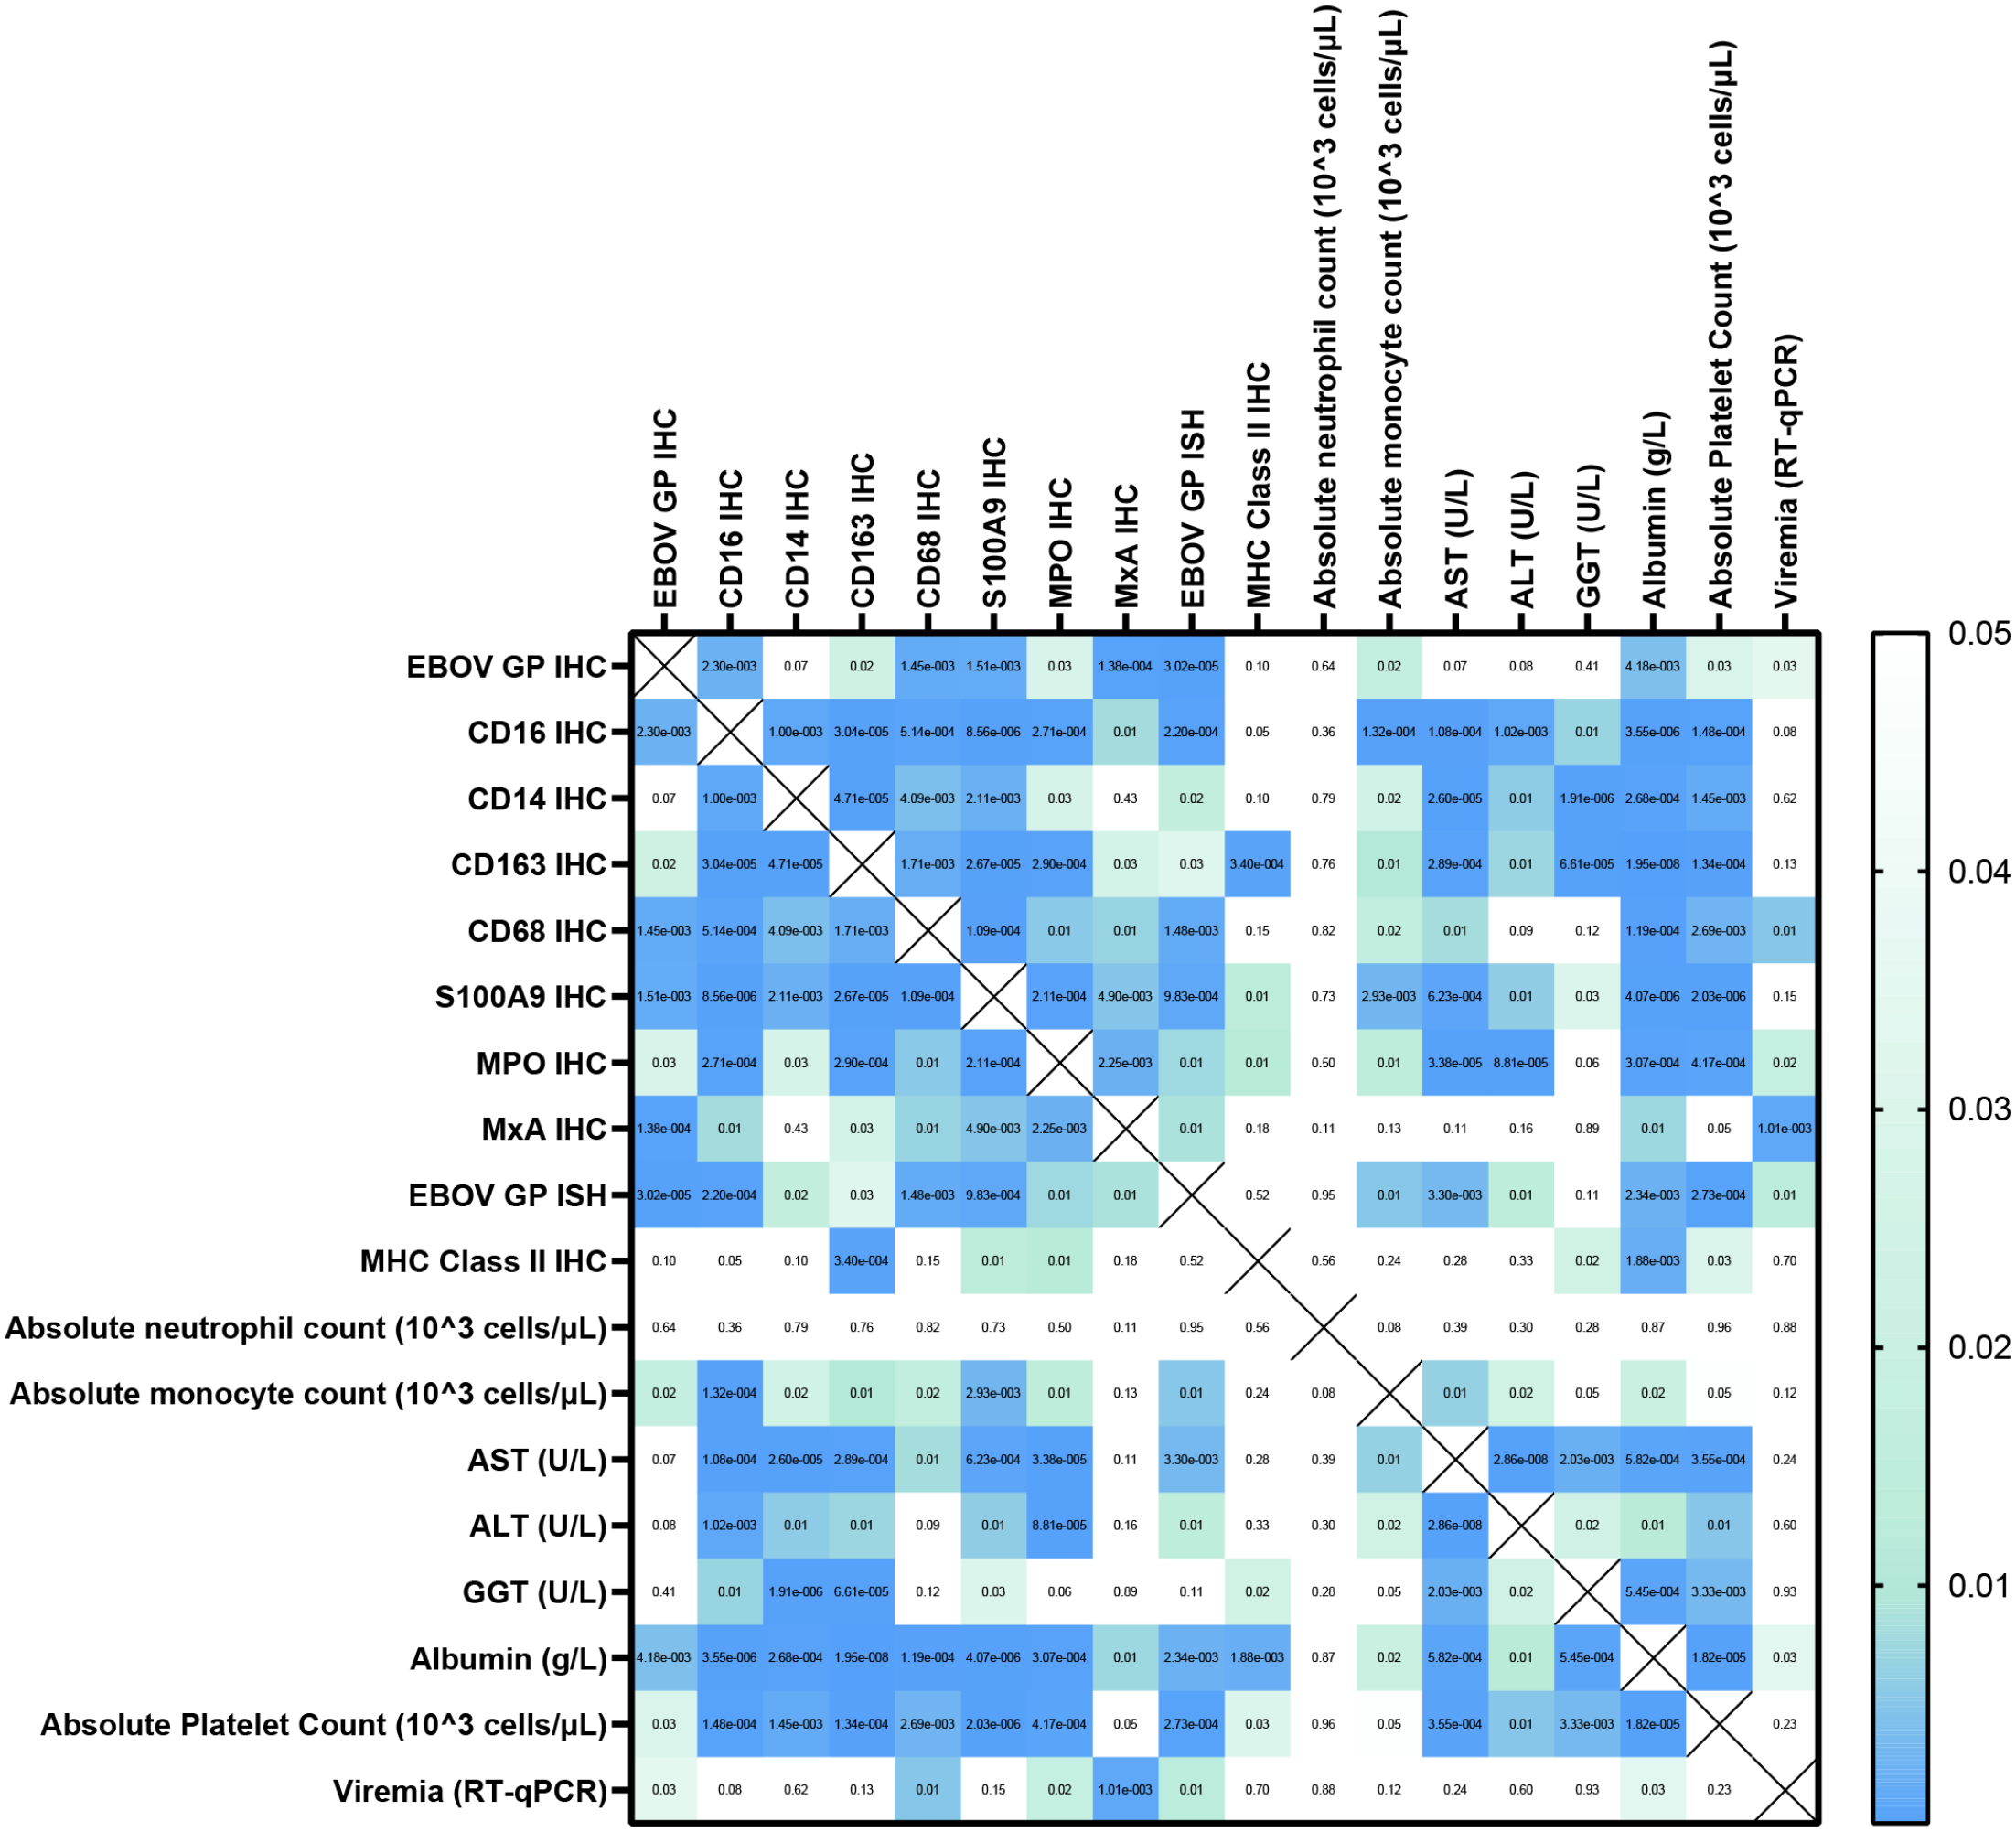
P values from the correlation matrix generated in Prism. White indicates P value > .05 while mint is .05 > P > .01, and blue shows a P value < .01. Alanine transaminase (ALT); aspartate transaminase (AST); gamma-glutamyl transferase (GGT); Cluster of differentiation (CD); Ebola virus (EBOV); EBOV glycoprotein (GP); immunohistochemistry (IHC); in situ hybridization (ISH); major histocompatibility complex (MHC) class II; myeloperoxidase (MPO); myxovirus resistance protein 1 (MxA); reverse transcription quantitative polymerase chain reaction (RT-qPCR).
Increased Hepatic Myeloid S100A9 Expression Precedes Abrupt Neutrophil Influx
S100A9 percent positive immunoreactivity increased in the liver of terminal animals compared with uninfected controls (P = .0005), 3 DPI (P = .0007), and 4 DPI (P = .0047) animals (Figs. 3, 5, 6). Furthermore, an increase in mean percent immunoreactivity occurred between 4 and 5 DPI (2.026 ± 2.149 SD vs 3.926 ± 1.583 SD, respectively), which coincided with abrupt alterations in liver macrophage populations and rapid rise in EBOV GP antigen. A 5.3-fold increase was observed in terminal animals compared with uninfected controls (P = .0005). S100A9 expression in uninfected controls and 3 DPI animals predominantly occurred as uniform cytoplasmic labeling in approximately 10-µm diameter, round mononuclear cells that commonly colocalized with CD16 and CD14 immunoreactivity, suggesting co-expression by macrophages. In contrast, at ≥ 5 DPI, S100A9 immunoreactivity was increasingly observed in small polymorphonuclear cells morphologically consistent with neutrophils independent of CD14 or CD16 immunoreactivity. This temporal shift in S100A9-expression from primarily macrophages to neutrophils is further supported by an increase in MPO percent positive immunoreactivity ≥ 6 DPI. Between 5 and 6 DPI, MPO immunoreactivity increased more than 2-fold (1.526 ± 0.781 SD vs 3.547 ± 1.569 SD, respectively; Fig. 5) and persisted through terminal disease (6–8 DPI). A 5.2-fold increase of MPO between uninfected controls and terminal animals was also observed (P = .0187). MPO percent positive immunoreactivity in both terminal and 6 DPI animals significantly increased compared with 3 DPI (terminal, P = .0167; 6 DPI, P = .0348) and uninfected animals (terminal, P = .0189; 6 DPI, P = .0387), as well as terminal and 4 DPI (P = .497) (Fig. 5).
EVD Progression Correlates With Temporospatial MxA and MHC Class II Immunoreactivity
MxA percent positive immunoreactivity increased precipitously at 4 DPI and persisted at high levels throughout terminal disease in parallel with increasing EBOV GP percent positive immunoreactivity (r = 0.7591, P < .0001). MxA immunoreactivity in uninfected control livers was rarely observed, represented by rare MxA+ mononuclear cells confined to vascular lumina (presumed circulating monocytes) and periportal mononuclear cells, suggesting minimal baseline expression. Expression in endothelial cells as well as faint granular cytoplasmic expression in hepatocytes was first observed at 3 DPI, with expression by biliary epithelium observed by 4 DPI. The intensity of MxA immunoreactivity across all compartments of the liver continued to increase temporally, peaking in terminal disease. Some terminal livers displayed > 40% positive immunoreactivity, highlighting the widespread expression of MxA protein (Figs. 3, 5, 6). A significant increase in overall MxA immunoreactivity occurred in terminal animals (6–8 DPI) compared with uninfected controls (P = .0039) and 3 DPI animals (P = .0106) (Fig. 5). By 6 DPI, MxA was highly expressed in cells not containing EBOV GP protein. In later stage livers (6–8 DPI), there was lower MxA expression in EBOV GP+ cells compared with neighboring EBOV GP− cells (P = .0006) (Fig. 5).
In uninfected negative controls, 3 DPI, and 4 DPI animals MHC class II immunoreactivity was primarily restricted to sinusoidal macrophages, with lesser immunoreactivity observed in endothelial cells. At 5 DPI, MHC class II expression was first identified on the membrane and within the cytoplasm of hepatocytes in a single 5 DPI outlier that displayed higher viral antigen loads compared with other animals at this time point, with a similar MHC class II expression patterns in all animals ≥ 6 DPI. Immunoreactivity was also observed in the biliary epithelium, and portal stromal cells ≥ 5 DPI, with increased intensity of immunoreactivity in the vascular endothelium. A significant increase in the percent positive MHC class II immunoreactivity occurred in terminal animals (6–8 DPI) compared with uninfected controls (P = .0343), 3 DPI animals (P = .0200), 4 DPI animals (P = .0206), 5 DPI animals (P = .0370), and 6 DPI animals (P = .0092) (Figs. 2, 5). This corresponds to a 4.7-fold increase from uninfected controls to terminal animals (P = .0174).
Discussion
Our study highlights how hepatic macrophage polarization strongly correlates with the clinical progression of EVD in rhesus monkeys and offers unique temporal insight into these dynamics. We described an abrupt change in hepatic macrophage molecular phenotypes, which transitioned from those more associated with tissue healing, homeostasis, inflammation resolution, and self-tolerance to molecular phenotypes implicated with production of proinflammatory cytokines, tissue damage, and pathogen-killing, between 4 and 5 DPI. Furthermore, subsequent alterations in the liver’s immune environment may be a result of this shift in macrophage polarization.
Temporal increases in CD14+ hepatic sinusoidal macrophages represent a major finding in this study as it represents a shift only observed in clinically ill animals. One possible rationale for this increase is infiltration of classical CD14+ MoMϕs into the liver, which subsequently enhanced TLR4 signaling through activation by shed EBOV GP, for which CD14 acts as a coreceptor. 16 From this perspective, it is reasonable that recruitment of CD14+ cells to the liver during EVD progression aids in exacerbating the proinflammatory response through activation of the nuclear factor kappa B (NF-kB) pathway. Recruitment of CD14+ MoMϕs into the liver is further supported by the change in myeloid cellular morphology, whereby CD14+ cells displayed a lack of delicate sinusoidal processes observed in CD16+ cells, presumed to represent KCs in uninfected controls. S100A9 also utilizes TLR4 to amplify innate proinflammatory immune response by inducing neutrophil chemotaxis, adhesion, and degranulation, forming a positive feedback loop. 9 The temporal dynamics of hepatic neutrophil influx (≥ 6 DPI) coincided with a return of peripheral neutrophil counts to within normal reference ranges (previously published dataset), suggesting recruitment of neutrophils into the liver parenchyma represents a hallmark of terminal disease. 6 Antagonists of TLR4 have been shown to suppress proinflammatory cytokine secretion and prevent lethal EVD in mice, demonstrating that engagement of TLR4 represents a key mediator of the innate response in EVD. 48 Furthermore, our findings suggest future studies aimed at inhibiting CD14 could represent an alternative approach to abrogate progression of EVD.
Expression of type I interferon is an outcome of TLR4 activation, resulting in MxA transcription; however, we acknowledge many other pattern recognition receptors beyond TLR4 can induce MxA expression. 46 Our observations suggest the early and persistent MxA expression throughout acute EBOV infection appears to have little effect on hindering viral spread within the liver, acknowledging EBOV GP antigen (protein and RNA) increased abruptly at 5 DPI, in the presence of persistently high MxA expression. The downregulation of MxA in many EBOV GP+ cells is likely attributable to the ability of EBOV viral proteins VP35 and VP24 to locally suppress interferon responses, which block RIG1 signaling and STAT1 nuclear import, respectively. 4 We interpret the near-global expression of MxA at terminal timepoints to reflect type I interferons’ insufficiency in restricting viral spread, at a time which systemic manifestations of EVD in most cases have already reached a decompensated physiological state. MxA has also been shown to cause apoptosis, and near-global expression of this protein by many different cell types could carry serious implications for liver function and recovery following survival warranting future investigation. 31
One of the more peculiar findings of this study was hepatocyte expression of MHC class II, which we attributed to reflect exacerbated inflammation and a failure to control viral replication. Persistent interferon stimulation is implicated as a major driver of MHC class II expression in non-traditional antigen-presenting cells and a shift in macrophage polarization may contribute to this constant stimulation. 11 Hepatocyte MHC class II expression has been observed in both viral and immune mediate hepatitis, potentially reflecting a biomarker of liver injury. 24 Although hepatocyte MHC class II expression has been shown to be effective at eliciting CD4 T-cell responses in the context of a transgenic mouse model, T-helper cell responses driven by hepatocytes in EBOV-infected animals is considered unlikely, acknowledging the widespread lymphoid depletion observed in end-stage EVD driven by persistent proinflammatory cytokinemia.
Macrophage polarization has been studied since the 1960s, but due to the high plasticity and lack of clear boundaries between phenotypes, much remains to be learned about macrophage subtypes and their role in homeostasis and disease. 32 Many diseases have been shown to be strongly influenced by macrophage polarization, and this remains a topic of high interest within the scientific community. Distinct clinical outcomes of Mycobacterium leprae are associated with differential macrophage polarization, with classical activation observed in tuberculoid forms, while alternative activation is seen in the lepromatous presentations. 20 Many liver diseases also display altered macrophage polarization status, such as hepatitis C, alcoholic liver disease, and metabolic-associated fatty liver disease, fueling research efforts with an overarching theme to regulate polarization of macrophages as an opportunity for potential therapeutic intervention for a broad array of diseases. 39
Macrophage-directed therapies, especially those aimed at restoring KC homeostasis and/or reducing influx of proinflammatory MoMϕs may represent a promising host directed pan-filovirus therapeutic opportunity that warrants future investigation. Specific examples include inhibition of the chemo-attractive axes (ie, CCL2/CCR2, CCL5/CCr5, and CCL1/CCR8) driving monocyte recruitment to permissive tissues through use of monoclonal antibodies, receptor antagonist, or small molecule inhibitors. An additional strategy would be reprogramming of macrophage polarization status through use of anti-inflammatory mediators, such as corticosteroids, interleukin (IL)-4, IL-10, and peroxisome proliferator-activated receptors agonist to return hepatic myeloid populations to homeostatic functionality. 47
Another takeaway from these results is the potential prognostic value in peripherally detectable CD163. CD16 and CD163 expression patterns have been described as characteristic homeostatic phenotypic markers of KCs in health and are disturbed during some infections, including chronic hepatitis B and C viruses.8,15 These liver-damaging diseases not only show a loss of CD163 expression in liver macrophages, but also show increased levels of detectable CD163 in the plasma. A soluble form of CD163 (sCD163) has also been implicated as a potential mediator of immune function, whereby metalloprotease-dependent cleavage by TACE/ADAM17 results in circulating sCD163. 18 Furthermore, healthy individuals have been shown to have low levels of circulating sCD163, but hepatic inflammation and even severe COVID-19 pneumonia have been reported to be associated with increased plasmatic sCD163.8,51 The TACE/ADAM17 protease pathway also activates systemic tumor necrosis factor (TNF) signaling, as this enzyme cleaves TNF alpha from its membrane bound form to its soluble form; however, sCD163 persists in the blood for far longer and could represent a useful prognostic biomarker of EVD progression. 17 This is evidenced by strong correlations between declining CD163 membrane expression in hepatic macrophages with several useful clinical parameters of liver function (albumin, r = 0.90) and hepatocellular injury (GGT, r = −0.76 and AST, r = −0.71). Since our results show a temporal decline in hepatic macrophage CD163 immunoreactivity, we hypothesize that this decline could be associated with a concurrent increase in circulating sCD163 levels. This warrants future investigation of sCD163 as a potential prognostic biomarker for EVD progression. It has been suggested that CD16 may also be shed from myeloid cell membranes through stimulation by lipopolysaccharide (LPS), flagellin, or polyinosilic: polycytidylic acid (poly I:C). 42 It is unclear whether the stark temporal decline of CD16 immunoreactivity observed in this study is due to death of these cells, membrane shedding, or macrophage reprogramming, but loss of expression could serve as an indicator of serious liver disease and/or reflect a change in liver cytokine production.
Rhesus monkeys are a well-established preclinical model of EVD; however, their clinical progression is more rapid than that described in humans, with most monkeys dying or meeting euthanasia criteria between 6 and 10 DPI following intramuscular inoculation with as little as 10 plaque-forming units.5,43 In comparison, symptoms in humans typically do not manifest until 8–12 days postexposure, with death, if to occur, 6–16 days after symptom onset. 26 While we cannot definitely extrapolate our findings to humans, our study suggests that dynamic changes in the myeloid compartment play an important role in liver pathogenesis of EBOV. Furthermore, given the more protracted nature of EBOV in humans, it is reasonable to assume the clinical intervention window for myeloid stabilization in the liver could be broader than that in NHP.
Supplemental Material
sj-docx-1-vet-10.1177_03009858231171906 – Supplemental material for Hepatic proinflammatory myeloid phenotypes are a hallmark of Ebola virus Kikwit pathogenesis in rhesus monkeys
Supplemental material, sj-docx-1-vet-10.1177_03009858231171906 for Hepatic proinflammatory myeloid phenotypes are a hallmark of Ebola virus Kikwit pathogenesis in rhesus monkeys by Anna E. Tseng, Mariano Carossino, Hans P. Gertje, Aoife K. O�Connell, Suryaram Gummuluru, Vijaya B Kolachalama, Udeni B. R. Balasuriya, John H. Connor, Richard S. Bennett, David X. Liu, Lisa E. Hensley and Nicholas A. Crossland in Veterinary Pathology
Footnotes
Acknowledgements
We thank the histopathology laboratory staff at Integrated Research Facility at Fort Detrick (IRF-Frederick) for processing the FFPE samples utilized in this analysis.
Declaration of Conflicting Interests
The author(s) declared no potential conflicts of interest with respect to the research, authorship, and/or publication of this article.
Funding
The author(s) disclosed receipt of the following financial support for the research, authorship, and/or publication of this article: This work was in part funded by a BU Hariri Pilot Research award (to N.A.C. & V.B.K.). This work utilized shared equipment purchased with NIH SIG grants S10-OD026983 and S10-OD030269 (to N.A.C.) This work was also partially funded through start-up funds from the School of Veterinary Medicine, Louisiana State University PG009641 (to M.C.). This project has been funded in whole or in part with Federal funds from the National Institute of Allergy and Infectious Diseases, National Institutes of Health, Department of Health and Human Services, under Contract No. HHSN272201800013C. D.X.L. and R.S.B. performed this work as employees of Laulima Government Solutions, LLC.
Supplemental material for this article is available online.
References
Supplementary Material
Please find the following supplemental material available below.
For Open Access articles published under a Creative Commons License, all supplemental material carries the same license as the article it is associated with.
For non-Open Access articles published, all supplemental material carries a non-exclusive license, and permission requests for re-use of supplemental material or any part of supplemental material shall be sent directly to the copyright owner as specified in the copyright notice associated with the article.