
Abstract
Horses with severe equine asthma (SEA), also known as heaves and recurrent airway obstruction, have persistent neutrophilic inflammation of the lower airways. Cytologic evaluation of bronchoalveolar lavage (BAL) fluid is commonly used to confirm the clinical diagnosis of SEA. However, the utility of microscopic assessment of bronchial brushings, endobronchial biopsies, and immunohistochemical detection of disease-associated biomarkers for the diagnosis of SEA remain poorly characterized. Salivary scavenger and agglutinin (SALSA) has anti-inflammatory properties and downregulated gene expression in SEA; therefore, it was investigated as a tissue biomarker for airway and systemic inflammation. Six asthmatic and 6 non-asthmatic horses were exposed to an inhaled challenge. Before and after challenge, samples of BAL fluid, bronchial brushing, and endobronchial biopsy were collected. Location of SALSA in biopsies was determined, and immunohistochemical label intensity was computed using image analysis software. Serum amyloid A (SAA) was measured to assess systemic inflammation. After challenge, neutrophil proportions were significantly higher in asthmatic versus non-asthmatic horses in BAL fluid (least squares means, 95% confidence interval: 80.9%, 57.2% to 93.1%, vs 3.6%, 1.1% to 10.7%) and in brush cytology slides (39.5%, 7.7% to 83.6%, vs 0.2%, 0% to 2.3%), illustrating the potential of brush cytology as an alternate modality to BAL for assessing intraluminal inflammation. Bronchial histopathologic findings and intensity of SALSA immunolabeling in surface and glandular epithelium were similar in asthmatic and non-asthmatic horses, indicating limited changes in bronchial tissue from the inhaled challenge. Increases in SAA indicated systemic inflammation, but SALSA immunolabeling did not change significantly.
Keywords
Asthma is a heterogeneous condition with multiple phenotypes and mechanisms. The different phenotypes of human asthma are classified according to features such as age at disease onset, predominant inflammatory cell type, and allergen responsiveness. 11,26 Like humans, horses experience a spectrum of naturally occurring inflammatory airway conditions, and the term “equine asthma” has been suggested to encompass these phenotypes. 4 Severe equine asthma, formerly heaves or recurrent airway obstruction, is the most severe manifestation of inflammatory airway disease. 4,9 It is a common, partially reversible respiratory disorder of mature horses in the Northern hemisphere. Although the pathogenesis is complex, inhalation of molds associated with dusty environments is a consistently identified trigger. 1,27 Recurrent bouts of inflammation result in changes in bronchial epithelium such as impaired cell repair, mitotic regulation, and cell migration. 36 Horses with SEA have chronic neutrophilic small airway inflammation, excessive mucus accumulation, and bronchial hyperreactivity leading to an increase in respiratory effort and impaired gas exchange. Recurrent inflammation and repair are postulated to promote fibroblast and smooth muscle proliferation leading to eventual airway remodelling. 7,9,27
A key diagnostic test for the diagnosis of SEA is the cytological assessment of bronchoalveolar lavage (BAL) fluid, with or without concurrent airway visualization. A proportion of neutrophils >25% among BAL leukocytes, in conjunction with clinical features such as increased respiratory rate at rest, cough, nasal discharge, and auscultatory abnormalities, are indicative of SEA. 9,18,27 Infusion and re-aspiration of lavage fluid is generally considered safe and practical for characterizing lower airway inflammation but procedural consequences such as coughing or fever may occur. 14 The BAL procedure itself may induce inflammation and bronchoconstriction, and therefore transiently impair gas exchange, a concern in severely asthmatic horses. 20,35 In one instance, BAL was associated with fatal pulmonary hemorrhage. 38 While current diagnostic assays are well established, other diagnostic approaches that do not involve airway occlusion as occurs during BAL could be of benefit in horses with severe respiratory impairment. 16 Additionally, there are instances where veterinarians are not comfortable with BAL, such as reported for some racing yard veterinarians; thus, alternative techniques may be valuable. 16
Alternative methods of cell or tissue collection include mucosal bronchial brushing and endobronchial tissue biopsy. Brushing collects cells from the mucosal surface of the airways, which include epithelial cells and inflammatory cells that attach to or line the mucosal surface. In horses, the use of bronchial brushing has largely been restricted to the collection of cells for cytokine analysis. 3,8 In one study, brush cytology identified higher average neutrophil proportions in asthmatic horses in crisis compared to controls, but detailed statistical analyses on the cytological findings were not provided. 8 Bronchial brush cytology has been assessed as a diagnostic modality for respiratory diseases in small animals, but its utility in SEA is undetermined. 39
In horses, the collection of endobronchial tissue biopsies is a safe technique with minimal adverse effects. 5 Unlike brushing, tissue biopsies allow analysis of the entire mucosa. However, intraluminal nonadherent material, or cells lining the mucosal surface, may be lost during tissue processing. Histopathologic assessment of endobronchial biopsies was demonstrated to be useful to distinguish horses with SEA from those without SEA. It also enables assessment of airway remodelling and tissue inflammation to predict the extent of disease, and also offers an opportunity to assess epithelial tissue by immunohistochemistry (IHC). 6 One potential biomarker, the salivary scavenger and agglutinin (SALSA) protein, also known as salivary agglutinin, glycoprotein-340, and deleted in malignant brain tumors 1 (DMBT1), is an innate host defense protein expressed by respiratory epithelium, especially mucus-producing cells. 28 Low SALSA gene expression was previously identified by RNA-Seq analysis of bronchial biopsies in asthmatic horses. 19 Immunohistochemical assessment of SALSA in lung sections of horses without respiratory disease was previously described, but in light of its ability to suppress inflammatory cytokine production, in situ assessment of SALSA protein in asthmatic horses may be useful. 24,30 Differences in concentration or distribution could provide information on the function of SALSA in the pathogenesis of SEA, and changes in protein expression might reflect disease stage. 19 Severe equine asthma induces systemic inflammation as indicated by increases in acute phase proteins such as serum amyloid A (SAA), but it is unclear whether detection of SALSA within bronchi could be a more specific early biomarker for airway inflammation. 13,17
We hypothesized that (1) brush cytology and endobronchial biopsy would identify airway inflammation in horses with SEA and (2) asthmatic relative to non-asthmatic horses have reduced SALSA in bronchial epithelium. Given that SEA is associated with marked intraluminal neutrophilic airway inflammation, it was also hypothesized that brush cytology would be better at identifying airway inflammation than endobronchial biopsy. Neutrophil proportions in BAL fluid and concentration of SAA served as references for airway and systemic inflammation, respectively.
Materials and Methods
Animals and Study Design
Six asthmatic horses (mean age ± SD; 18 ± 3.7 years) and 6 non-asthmatic horses (15 ± 4.2 years) of various breeds were included in the study. These horses were part of an institutional research herd. The asthmatic horses had been diagnosed with SEA at least 2 years before the study based on clinical features including coughing and increased respiratory effort at rest, decreased pulmonary function, >50% neutrophils in BAL fluid differential cell counts following exposure to dusty hay, and reversal of clinical signs upon return to pasture. 37 These features were consistent with those described for SEA. 9 The non-asthmatic horses had no history or current evidence of respiratory disease, and normal pulmonary function test and BAL fluid cytologic results. Pulmonary function testing was performed using a sealed mask over the nose, a heated pneumotachograph, and an esophageal balloon to measure airflow, volume, and pleural pressure, as described previously. 37 All animal procedures were approved by the University of Guelph Animal Care Committee (Animal Use Protocol 4185) and conducted in accordance with guidelines from the Canadian Council on Animal Care.
Horses were maintained outdoors for at least 2 months prior to the start of the study and were placed in a dust-free environment for the 24 hours preceding sample collection. The dust-free environment consisted of individual stables with rubber mats and no bedding. While in these stables, the horses received only pelleted feed, and stable windows were kept open to provide ventilation. For sample collection, horses were restrained in stocks in a respiratory testing laboratory, and a complete physical examination was performed on each horse to yield a general physical score and a 10-parameter respiratory score (Suppl. Table S1). Venous blood samples were collected into serum tubes for serum biochemistry.
Pulmonary function testing was performed in 10 horses. In 2 horses (one asthmatic and one non-asthmatic), the sedation-free procedure could not be performed due to horse temperament. Volume and pressure data were analyzed to derive maximal change in pleural pressure (ΔPplmax), dynamic compliance (Cdyn), and lung resistance (RL). Horses were then sedated with 0.05 to 0.08 mg/kg romifidine (Boehringer Ingelheim) and 0.01 to 0.03 mg/kg butorphanol (Zoetis), administered intravenously.
Under sedation, BAL fluid, brush samples, and endoscopic bronchial biopsies were sequentially obtained. Bronchoscopic features of the upper airways and trachea were noted, and a bronchoscopy score assessing 6 parameters was assigned to each horse (Suppl. Table S2). Once the horses recovered from sedation, they were placed in individual stalls with straw bedding and exposed to dusty hay. At 72 hours, or at 48 hours in 3 horses with SEA that had respiratory impairment consisting of nasal flaring, nasal discharge, and coughing, the procedures were repeated; samples were collected from the contralateral lung relative to the first set of samples. Hence, this protocol yielded 2 data sets for each horse: pre- and post-asthmatic challenge.
Bronchoalveolar Lavage
A 13-mm diameter, 1.8-m endoscope (Olympus) was passed through the ventral nasal meatus into the trachea. Lidocaine (0.2%; AstraZeneca) in warmed saline was infused through the biopsy channel periodically along the length of the trachea and bronchi to minimize coughing. The appearance of the upper airways was scored for the presence and severity of erythema, edema, mucus, hemorrhage, and cough reflex. The endoscope was advanced until it was wedged in a third- to fifth-generation bronchus (that is 1.2.1 to 1.2.1.1.1 or 1.3.1.1.1; and 2.2.1 to 2.2.1.1.1 or 2.3.1.1.1 according to the numbering system by Smith et al. 34 ). The BAL was performed by infusing 200 to 500 mL of warmed sterile 0.9% saline solution in boluses with 60-mL syringes. The variation in infused volume was to ensure at least 50 mL of fluid were retrieved. A vacuum pump was used for fluid retrieval, and in cases of airway collapse, the fluid was recovered by gentle manual aspiration with 60-mL syringes. The volume of BAL fluid recovered was recorded, and the fluid was placed in a sterile flask and stored on ice for less than 1 hour before processing. The mean total nucleated cell count was determined for each sample from triplicate analysis in an electrical impedance particle counter (Beckman Coulter Z2; Beckman Coulter). Two slides were prepared from 200-µL aliquots of fluid by cytocentrifugation (41 × g for 6 minutes; Cytospin 4; Thermo Scientific), and feathered edge slides were prepared from fluid sediment (centrifuged at 1000 × g for 10 minutes; IEC Centra CL2; Thermo Scientific). Slides were air-dried and stained with modified Wright’s stain using an automated stainer (Hematek 3000; Siemens).
Brush Cytology
The endoscope was repositioned slightly proximal to where it had been wedged, and a guarded 3.0-mm diameter, 2.0-m-long gastrointestinal cytology brush (Hobbs Medical) was passed through the biopsy channel of the endoscope for sample collection. Once at an appropriate location against the wall of a third-generation bronchus, the brush was extruded from its guard, and gently drawn back and forth along the mucosal surface for 5 seconds. The brush was then placed back into the guard and retracted through the endoscope. Immediately thereafter, the guard was removed, and the brush was gently rolled 3 times each on 4 glass slides. Slides were dried immediately, and stained as described above.
Endoscopic Biopsies
After airway brushings were obtained, 2-mm endoscopic biopsy forceps (EndoJaw, Olympus) were introduced through the biopsy channel of the endoscope. The forceps were used to collect pinch biopsies from the third-generation bronchus, avoiding the area previously sampled by brushing. At each time point, for each horse, 1 to 3 biopsies were collected until a total biopsy volume of approximately 5 to 10 mm3 was obtained. The tissue biopsies were immediately placed in 10% neutral buffered formalin. Following fixation for 24 hours, the samples were embedded in paraffin, sectioned at 5-µm thickness with a rotary microtome, and routinely stained with hematoxylin and eosin and with periodic acid–Schiff (PAS).
Immunohistochemistry
The anti-SALSA/DMBT1 primary antibody (polyclonal rabbit IgG, concentration 1 μg/μL, RRID: AB_2810221, Sino Biological) was previously validated using equine tissues, and tissue expression was characterized. 19 IHC for SALSA was performed as described previously: in brief, sections of endoscopic biopsy were placed onto charged glass slides, de-paraffinized in xylene, then immersed in pH 6.1 antigen retrieval solution (Dako) for 1.5 minutes at 110 °C in a de-cloaking chamber (Biocare Medical). 19 The slides were washed in 1× wash buffer (Dako) for 5 minutes before a 10-minute incubation step with dual enzyme blocker solution (Dako). Following another 5-minute wash in 1× wash buffer, the slides were incubated with serum-free protein blocker (Dako). The slides were subsequently incubated at room temperature for 2 hours with DMBT1 antibody diluted 1:750 in wash buffer, or buffer only (negative control). The slides were then immersed in 1× wash buffer for 45 minutes, changing the buffer every 5 minutes, before incubation at room temperature for 30 minutes with secondary antibody (polyclonal goat anti-rabbit immunoglobulins-HRP; RRID: AB_2617138, Dako) diluted at 1:2000. Nova Red chromogen (Dako) was applied as a chromogenic substrate for HRP, and the slides were counterstained for 3 minutes with Harris modified hematoxylin (ThermoFisher Scientific).
Microscopic Analysis
For each type of sample, a scoring scheme was applied to assess multiple variables (Suppl. Tables S3 to S6). Assessors (GKCL and DB) blinded to the identity of samples performed differential counts and scoring of the BAL slides, brush cytology, endoscopic biopsy, and IHC slides. Microscopic analyses were performed on a BX45 Olympus microscope, and images were acquired with a DP71 Olympus camera and cellSens Standard 1.12 software (Olympus). A minimum of 400 cells in 5 non-overlapping 400× magnification fields (2.37 mm2) was assessed for differential counts in each sample type. For BAL cell assessment, only leukocytes were included in the differential count with epithelial cells and red blood cells (RBC) enumerated separately. For brushings and biopsies, the number and type of leukocyte as a proportion of all nucleated cells was derived.
To objectively measure the labeling intensity in IHC sections, 3 representative images per tissue section were acquired in areas with distinct cytoplasmic labeling and free of artefact, avoiding the edges of tissue sections. The color intensity was then assessed with Fiji software, a distribution of the open source software ImageJ (version 2.0.0). 31,32 The various colors were deconvoluted using the HE DAB vector in order to separate the color of the chromogen. To assess chromogen intensity in the mucosa, the freehand selection tool was used to select an area comprising 30 epithelial cells in length and 2 epithelial cells in depth within the mucosa (Suppl. Fig. S1). For bronchial glands, the entire epithelial component of the glands was selected using the freehand selection tool. Mean intensity of the selected area was derived using the “analyze” feature of the software. This process was repeated for all images of each section, and the average of the mean intensities was calculated. The optical density was then derived from the averaged intensity using the following equation:

Maximum intensity equals 255.
The calculated optical density was compared to subjective visual assessment of labeling intensity for agreement.
Blood Samples
A complete blood cell count was performed for each horse at each time point using an Advia 2120 analyzer (Siemens). A serum biochemistry profile including albumin, globulin, and SAA measurement was obtained using a Cobas 6000 analyzer (Roche).
Statistical Analysis
Analyses were performed using SAS version 9.4. The data were collected in a split-plot manner arranged in a completely randomized design (CRD). For the whole plot treatment, horses were nested within either an asthmatic or non-asthmatic condition. Horses were then split into the 2 categories: pre- and post-challenge. The interaction between challenge and asthmatic condition was tested in this model, which provides information about whether the changes in parameters after challenge differed between asthmatic and non-asthmatic horses.
Microscopic scores, BAL nucleated cell counts, protein concentrations, albumin–globulin (A:G) ratio, respiratory and bronchoscopy scores, and pulmonary function test results were not normally distributed. Therefore, for these parameters, Mann-Whitney-Wilcoxon 2-sample rank tests were used for the following analyses: comparing simple effects between asthmatics and non-asthmatics at the pre-challenge time point, simple effects between asthmatics and non-asthmatics at the post-challenge time point, as well as the difference between post- and pre-challenge results between asthmatics and non-asthmatics. With this approach, the interactions between challenge and asthmatic condition were assessed as simple effects for each independent variable. In addition, a Wilcoxon signed rank test, equivalent to a main effect, was performed concurrently, assessing the difference between pre- and post-challenge samples regardless of asthmatic condition. All P values for these analyses were the exact permutation values.
Differential counts and percentages of goblet and SALSA-positive cells had a binomial distribution. Therefore, these sets of data were analyzed with Proc GLIMMIX (SAS 9.4). This analysis compared percentages between asthmatic and non-asthmatic horses, between challenge time points, and the interaction between challenge and asthmatic condition. If the interaction was significant, simple effects were tested and estimated. The analyses took into account repeated measurements on the same horse. A P value <.05 was considered to be statistically significant. Where indicated, confidence intervals (CIs) reflect 95%.
Results
Physical and Bronchoscopic Examinations
Asthmatic horses had higher median respiratory and bronchoscopy scores than non-asthmatic horses at the pre-challenge and post-challenge time points (Table 1).
Respiratory and bronchoscopic scores for asthmatic and non-asthmatic horses (N = 6 per group).a
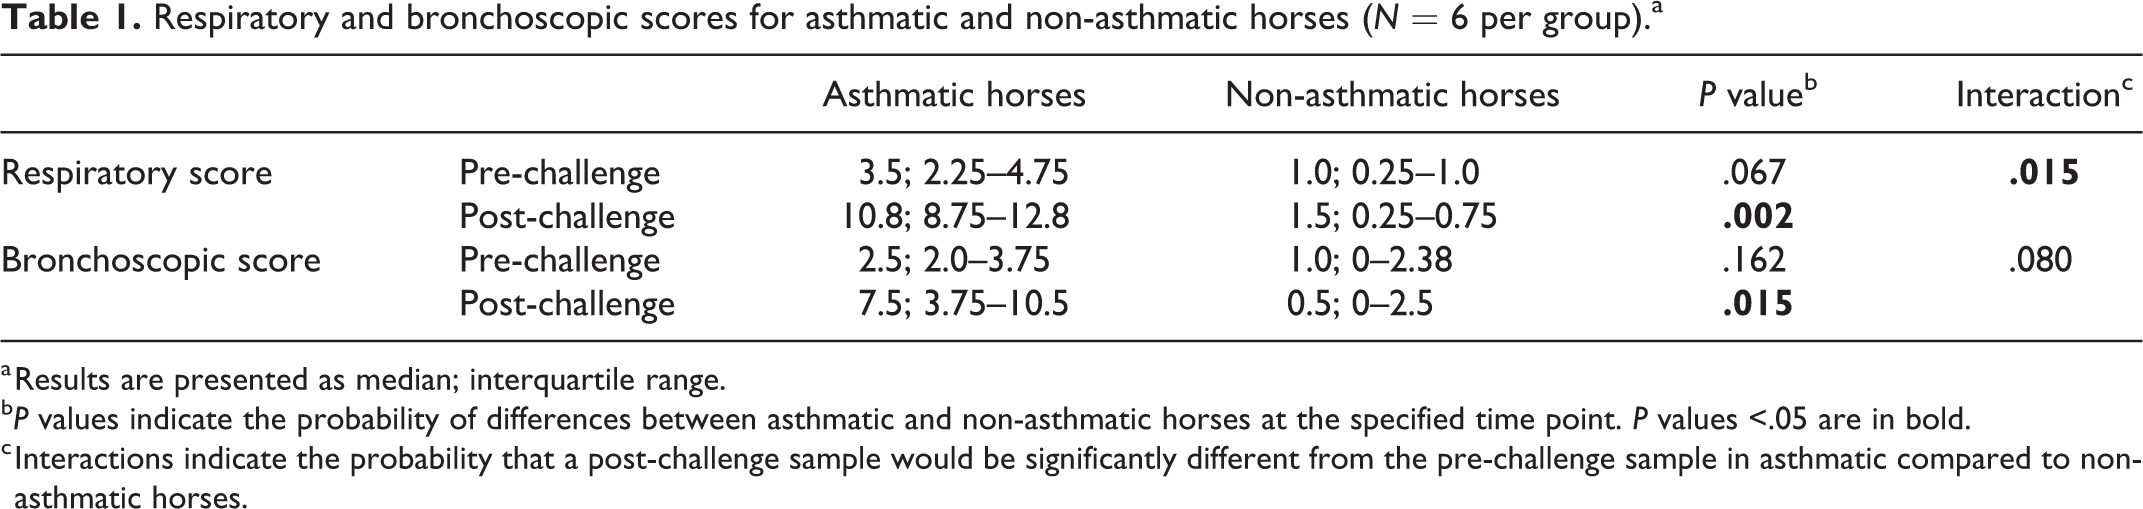
a Results are presented as median; interquartile range.
b P values indicate the probability of differences between asthmatic and non-asthmatic horses at the specified time point. P values <.05 are in bold.
c Interactions indicate the probability that a post-challenge sample would be significantly different from the pre-challenge sample in asthmatic compared to non-asthmatic horses.
Following challenge, the total respiratory score also was significantly higher in asthmatic compared to non-asthmatic horses (P = .015; Table 1, Suppl. Table S7).
Pulmonary Function Testing
Asthmatic horses had significantly higher ΔPplmax and RL, and lower Cdyn, compared to non-asthmatic horses post-challenge. This is consistent with impaired pulmonary function (Table 2, Suppl. Table S8).
Pulmonary function test results in asthmatic and non-asthmatic horses (N = 6 per group).a
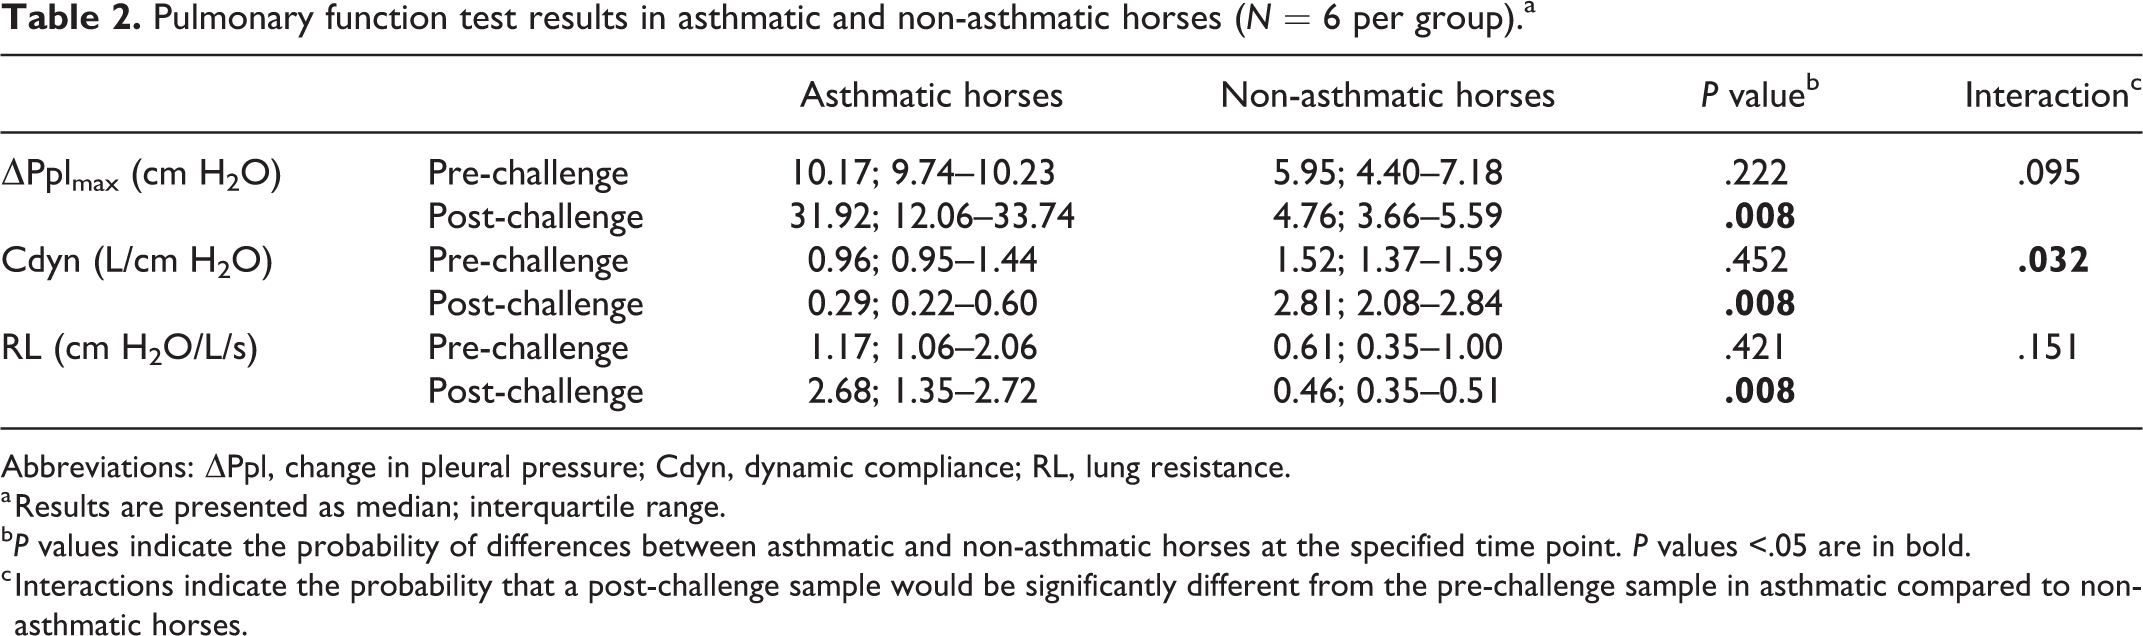
Abbreviations: ΔPpl, change in pleural pressure; Cdyn, dynamic compliance; RL, lung resistance.
a Results are presented as median; interquartile range.
b P values indicate the probability of differences between asthmatic and non-asthmatic horses at the specified time point. P values <.05 are in bold.
c Interactions indicate the probability that a post-challenge sample would be significantly different from the pre-challenge sample in asthmatic compared to non-asthmatic horses.
Bronchoalveolar Lavage Fluid
The total nucleated cell count in BAL fluid was significantly higher in asthmatic compared to non-asthmatic horses, at both pre-challenge (asthmatic median count 0.715 × 10⁹/L, interquartile range [IQR] 0.475–0.858 × 10⁹/L; non-asthmatic median count 0.310 × 10⁹/L, IQR 0.288–0.363 ×10⁹/L; P = .004) and post-challenge time points (asthmatic median count 1.030 × 10⁹/L, IQR 0.738–1.398 × 10⁹/L; non-asthmatic median count 0.410 × 10⁹/L, IQR 0.343–0.463 × 10⁹/L; P = .015; Suppl. Table S9).
All post-challenge samples in asthmatic horses had >25% neutrophils (mean ± SD, 72.2 ± 19.5%), while those from non-asthmatic horses had ≤6% neutrophils (3.8 ± 1.7%; Suppl. Table S10). Post-challenge, the proportion of neutrophils was significantly higher in asthmatic compared to non-asthmatic horses (Figs. 1, 3, 4, Table 3, Suppl. Tables S10 and S11). There were no significant differences in BAL epithelial cell, mucus, and hemorrhage scores between asthmatic and non-asthmatic horses (Suppl. Fig. S2, Suppl. Tables S12 and S13).
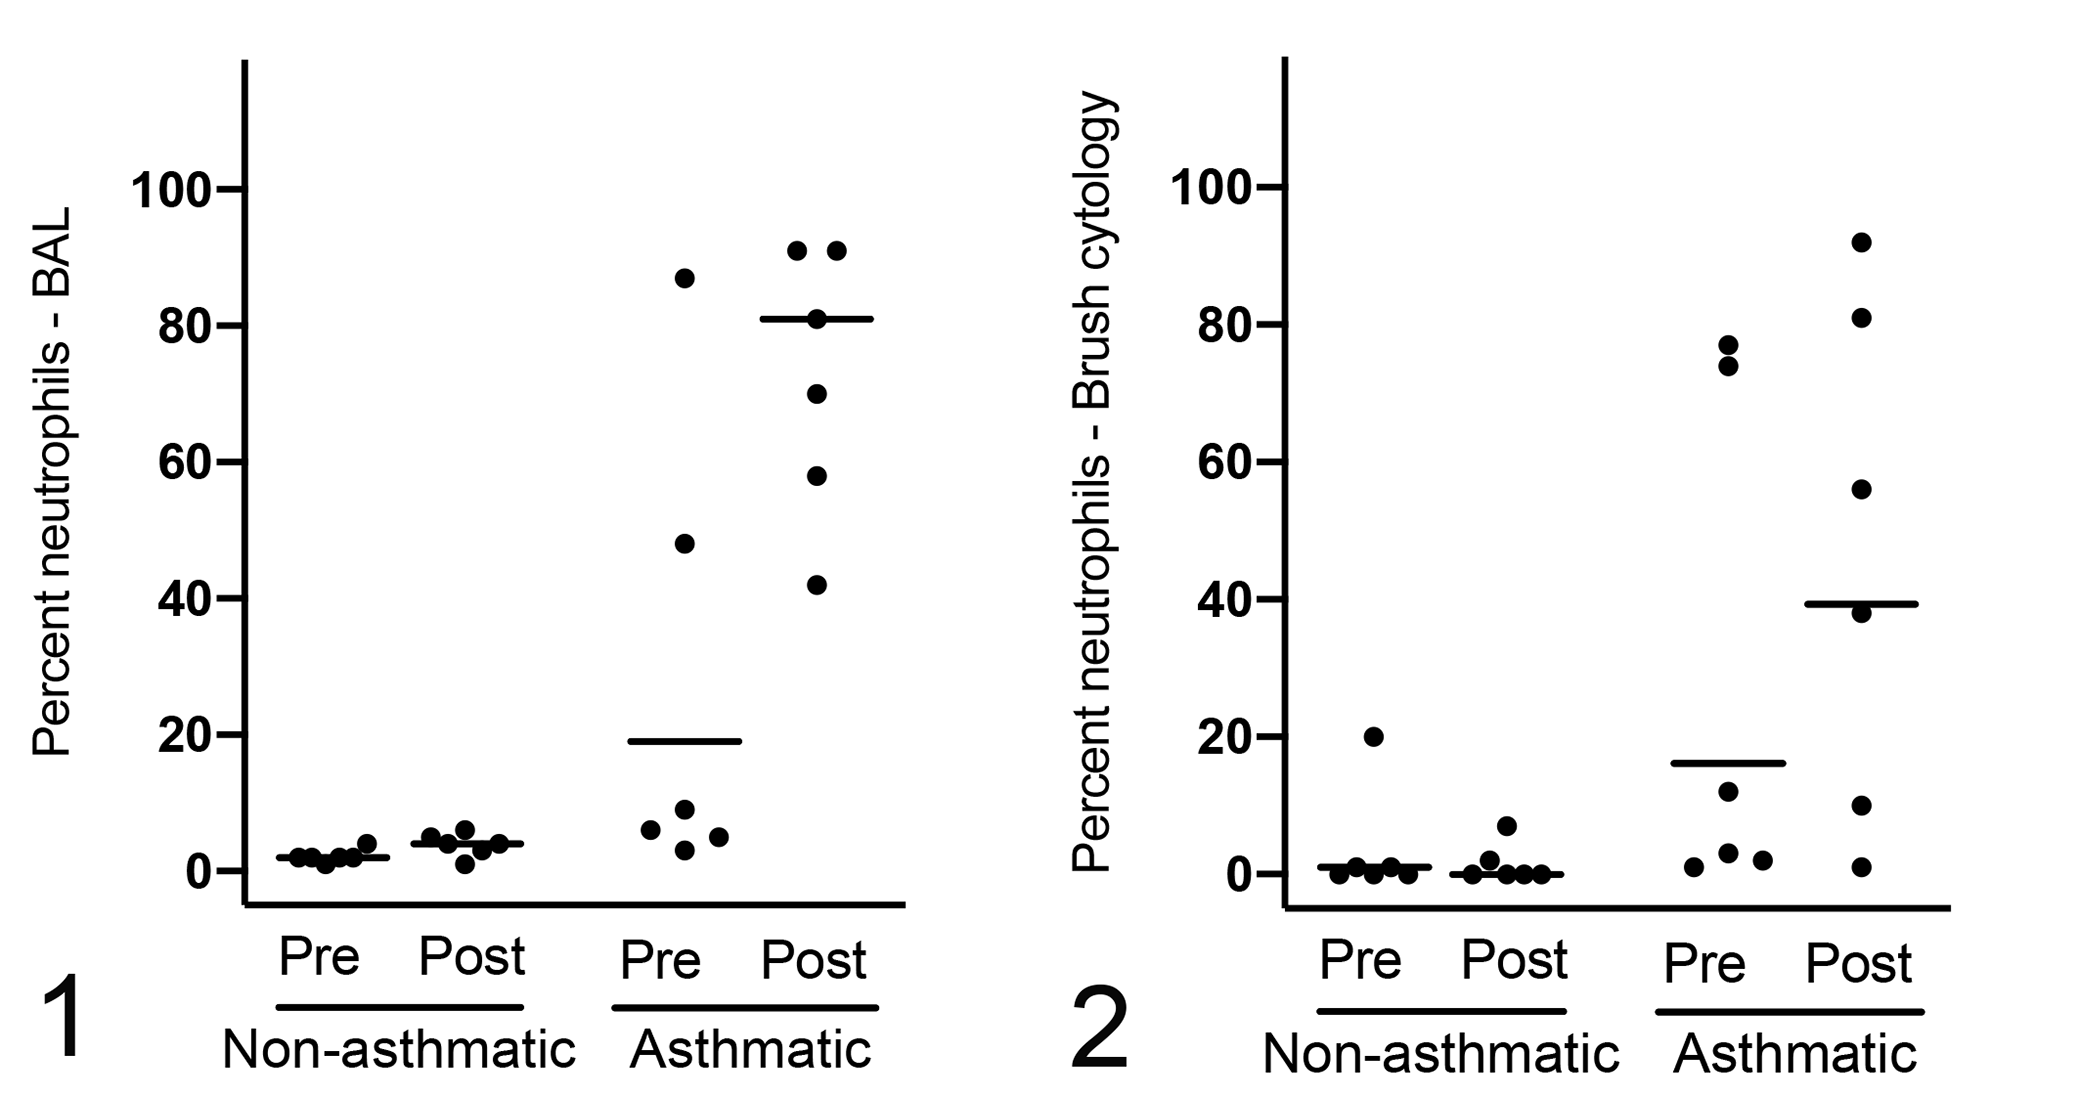
Bronchoalveolar lavage (BAL) (Fig. 1) and brush cytology (Fig. 2) preparations have a significantly higher mean proportion of neutrophils in asthmatic compared to non-asthmatic horses following challenge (P < .001 and P = .002, respectively; n = 6 per group). Horizontal bars represent the least squares mean.
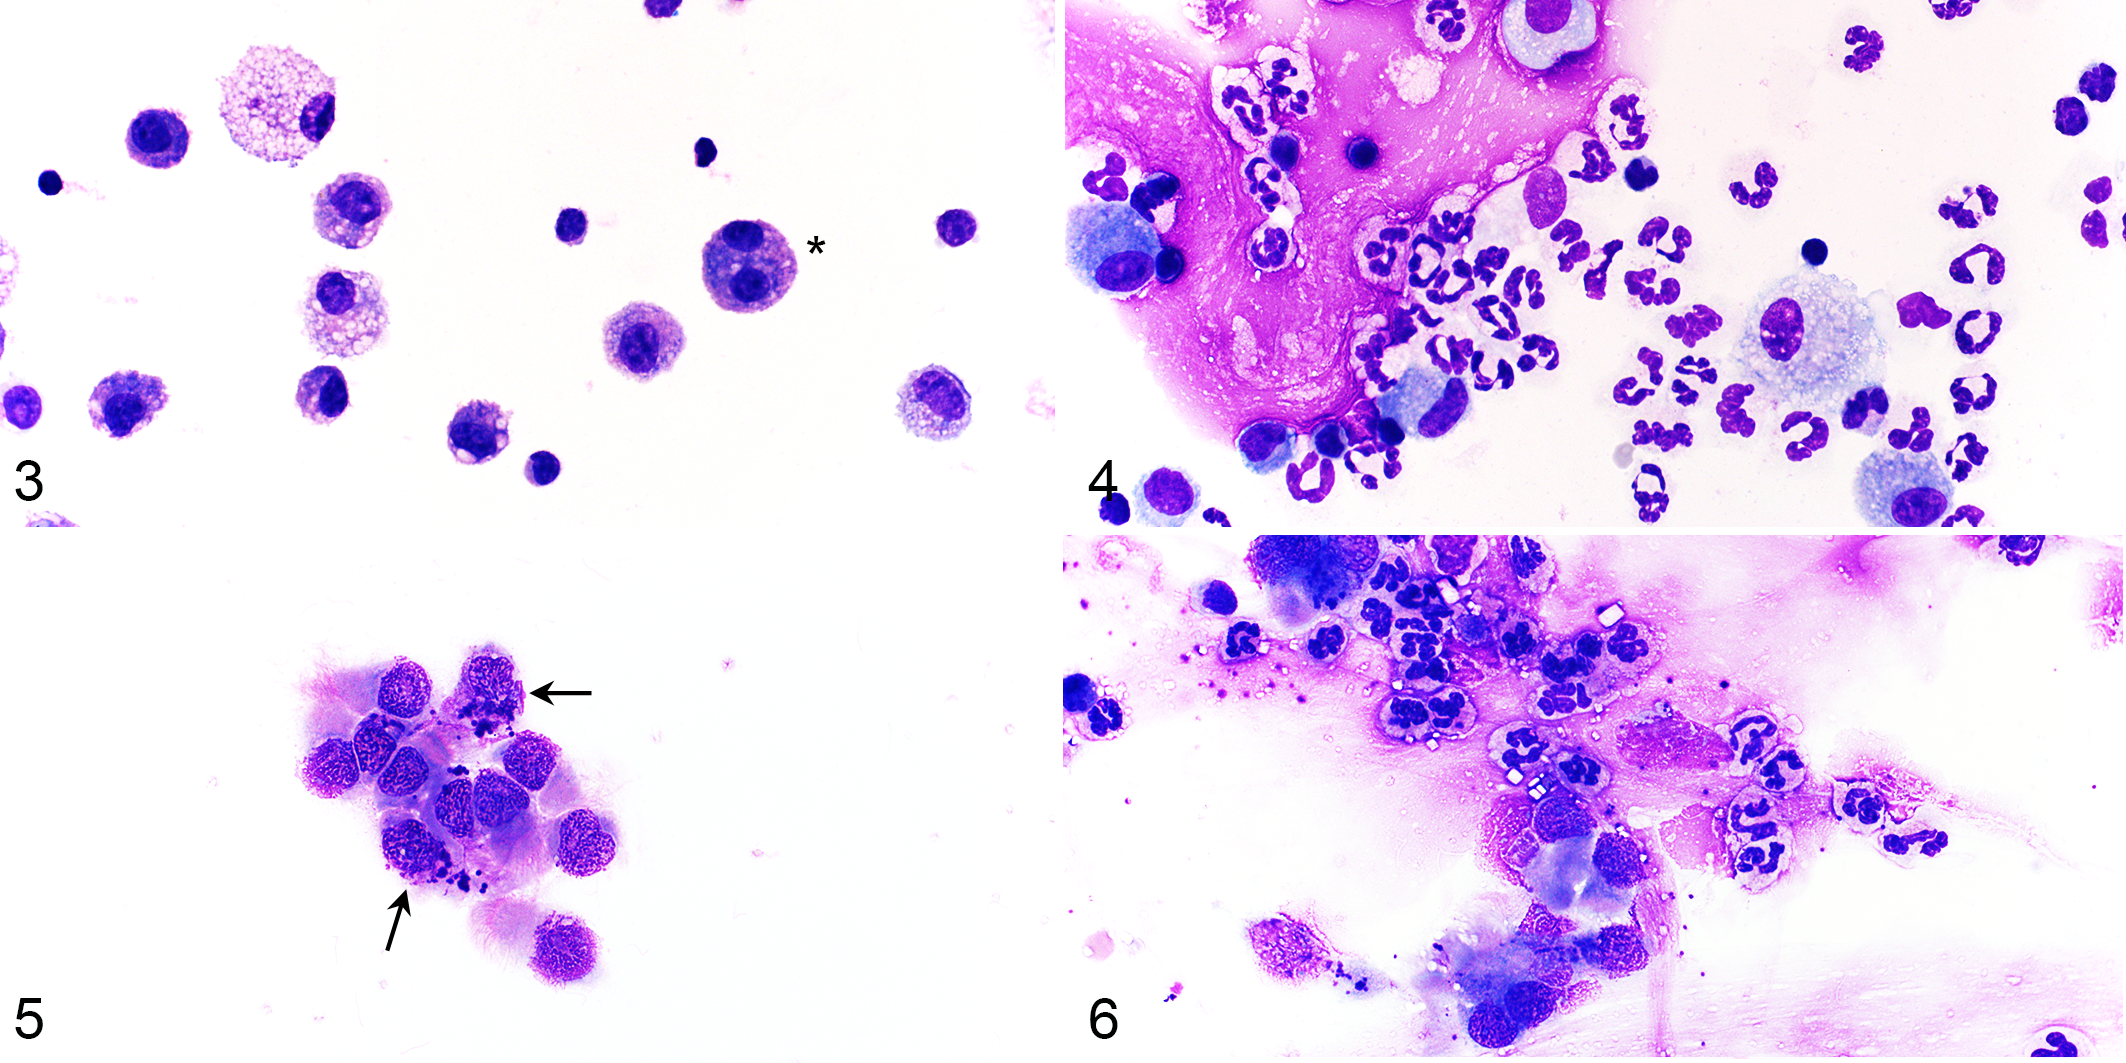
Cytology preparations from non-asthmatic and asthmatic horses (post-challenge). Modified Wright’s stain.
Inflammatory cells in different sample types in asthmatic and non-asthmatic horses (N = 6 per group).a
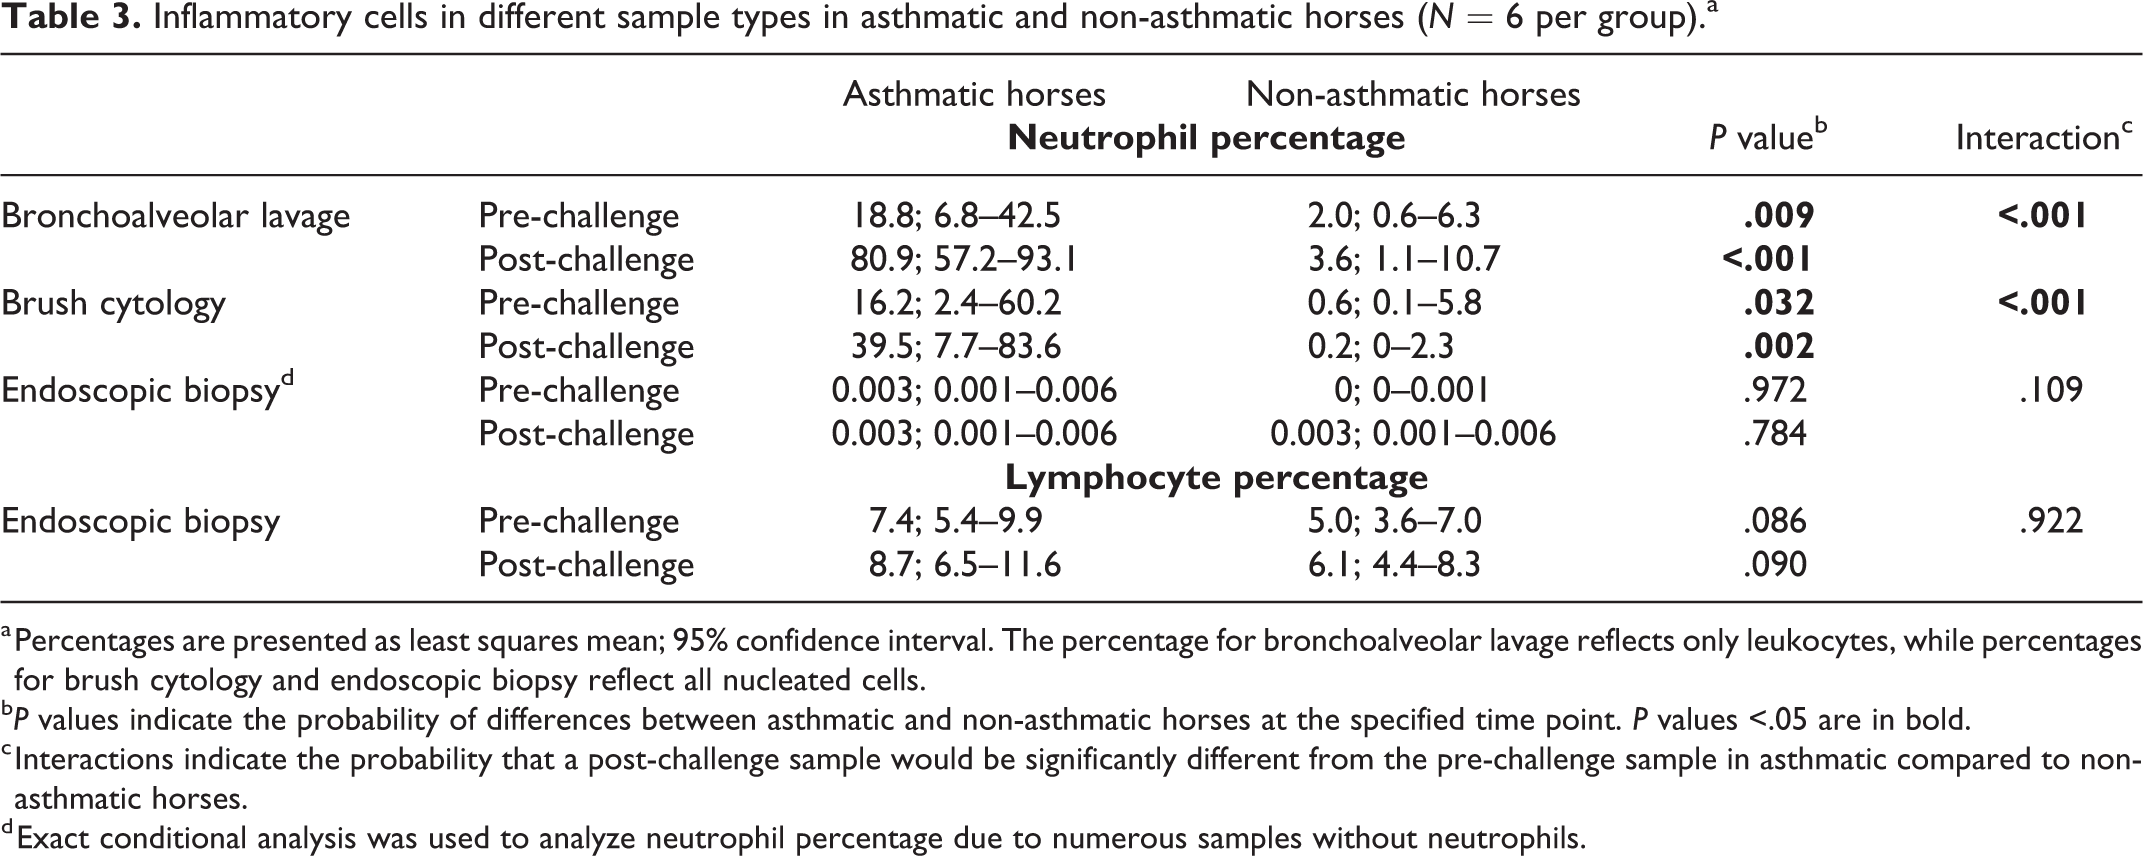
a Percentages are presented as least squares mean; 95% confidence interval. The percentage for bronchoalveolar lavage reflects only leukocytes, while percentages for brush cytology and endoscopic biopsy reflect all nucleated cells.
b P values indicate the probability of differences between asthmatic and non-asthmatic horses at the specified time point. P values <.05 are in bold.
c Interactions indicate the probability that a post-challenge sample would be significantly different from the pre-challenge sample in asthmatic compared to non-asthmatic horses.
d Exact conditional analysis was used to analyze neutrophil percentage due to numerous samples without neutrophils.
Brush Cytology
All brush cytology preparations had >600 cells (score = 4) and good cell preservation (median score = 3, Suppl. Table S12). Of the 24 samples, 17 had hemorrhage scores of 0 or 1, and 4 samples had >5% RBC. Most (11 of 12) samples from non-asthmatic horses contained ≥90% epithelial cells, including ciliated columnar epithelial cells and goblet cells. In contrast, only 5 of 12 samples from asthmatic horses had ≥90% epithelial cells with the remainder of cells being inflammatory cells (Suppl. Table S10). Post-challenge, neutrophil proportions were significantly higher in asthmatic compared to non-asthmatic horses (least squares mean, 95% CI: 39.5%, 7.7% to 83.6% in asthmatic vs 0.2%, 0% to 2.3% in non-asthmatic horses), and there was a significantly greater increase in neutrophil proportion following challenge in asthmatic compared to non-asthmatic horses (Figs. 2, 5, 6, Table 3). In 3 asthmatic horses, the neutrophil proportions were higher pre-challenge compared to post-challenge (Suppl. Table S10). The scores for mucus, proportion of goblet cells, and hemorrhage were not significantly different between asthmatic and non-asthmatic horses (Suppl. Fig. S3, Suppl. Tables S12 and S13).
Endoscopic Biopsies
The size of endoscopic biopsies ranged from 1 to 6 mm in length and 16 of 24 sections were >3 mm in length (median score 4, range 1–4; Suppl. Table 12). All samples contained mucosa, and the majority (16/24) of sections were free of crush artefact or fragmentation in >80% of the section (median score 2.5, range 0–4). Lymphocytes were the most frequent type of inflammatory cell identified in the mucosa of both asthmatic and non-asthmatic horses, while neutrophils were only rarely identified within the mucosa (Figs. 7, 8, Suppl. Table S10). The proportion of mucosal lymphocytes tended to be higher in asthmatic compared to non-asthmatic horses, but the differences were not statistically significant (Figs. 9, 10, Table 3). The proportion of mucosal neutrophils did not differ significantly between asthmatic and non-asthmatic horses (Table 3). In the post-challenge biopsy of one asthmatic horse, dozens of neutrophils were entrapped in mucus lining the mucosal surface (Figs. 11, 12). The scores for subepithelial inflammation, goblet cells, and mucus were not significantly different between asthmatic and non-asthmatic horses (Suppl. Fig. S4, Suppl. Tables S12 and S13). Extracellular mucus, when present, was most frequently trapped within the folds of the tissue sections (Figs. 13, 14).
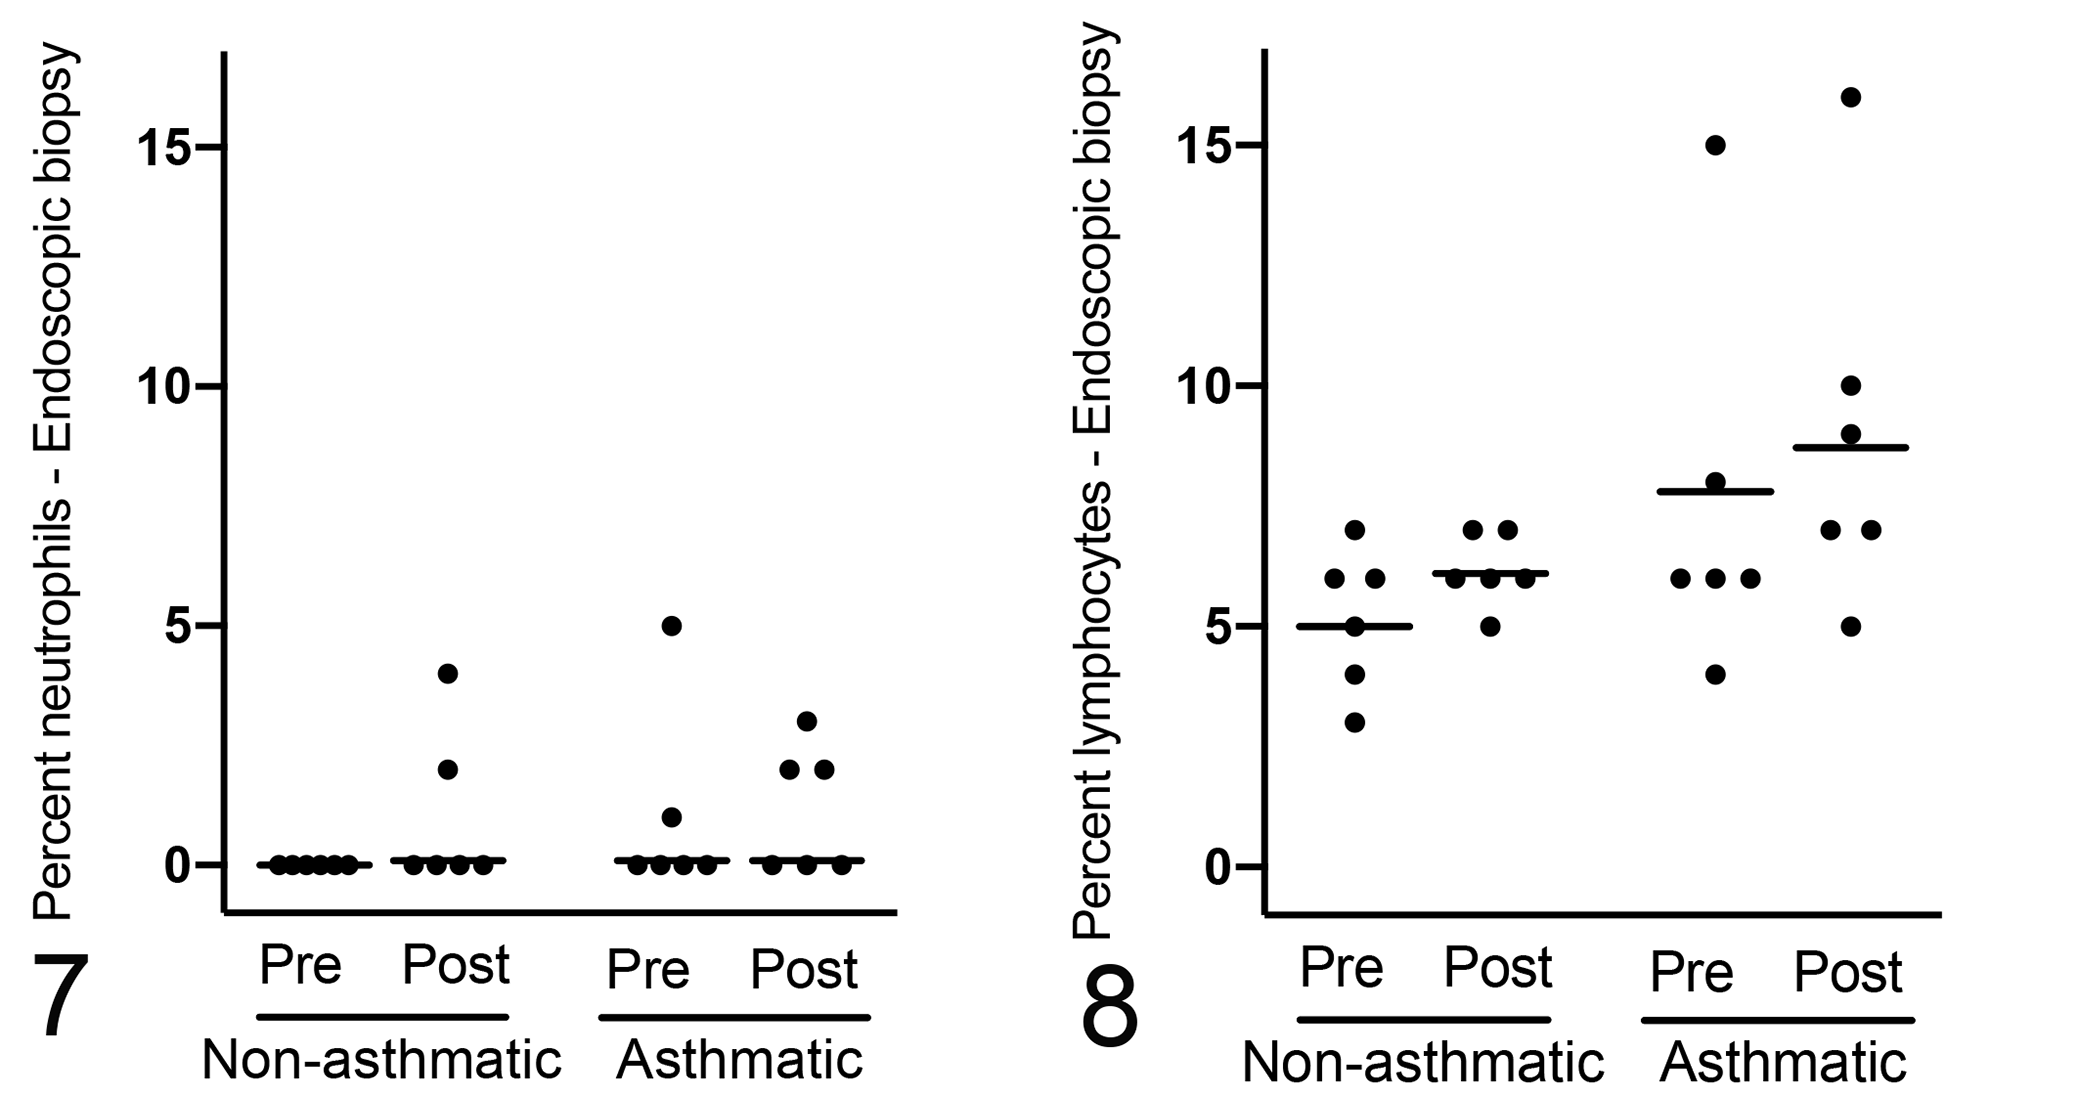
Neutrophils are infrequent within the mucosa of endoscopic bronchial biopsies and their proportion did not differ significantly between asthmatic and non-asthmatic horses, both at pre- (P = .972) and post-challenge (P = .784) time points; n = 6 per group.
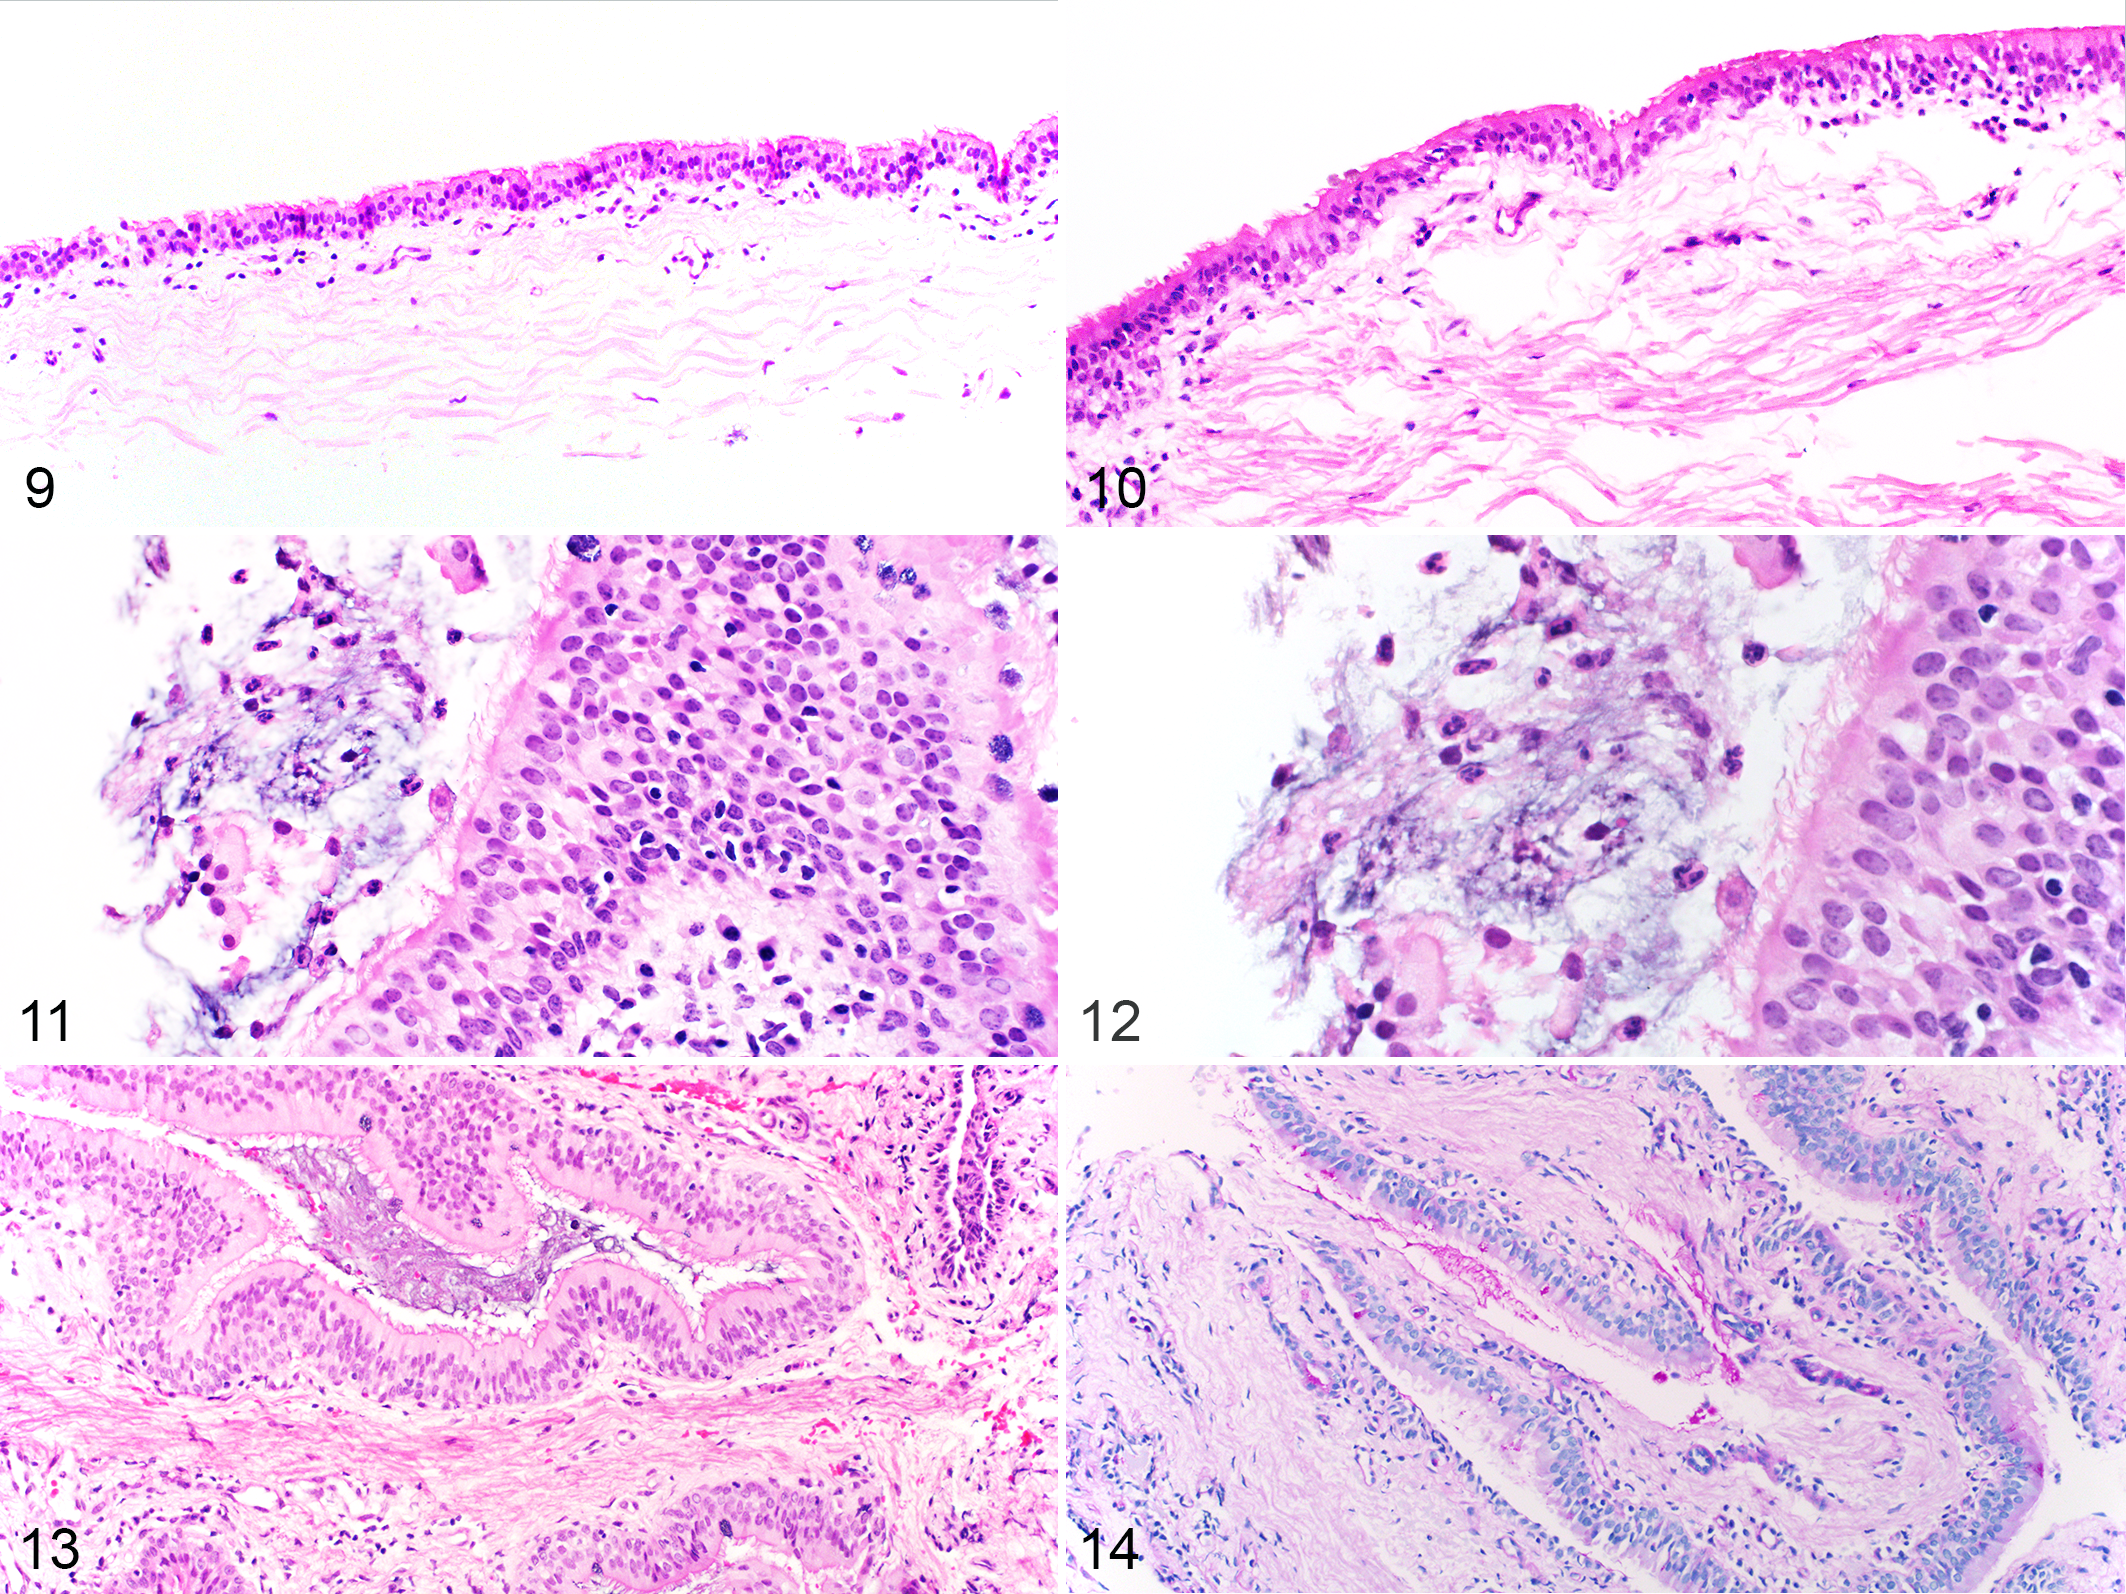
Non-asthmatic (Fig. 9) and asthmatic (Fig. 10) horses (post-challenge), endoscopic bronchial biopsies. Mucosal inflammatory cells are slightly more prominent in the asthmatic horse. Hematoxylin and eosin (HE).
Immunohistochemistry
In the bronchial mucosa, ciliated columnar epithelial cells, goblet cells, and bronchial gland epithelial cells were immunopositive for SALSA in all horses irrespective of the time point. The labeling was cytoplasmic and apical with a granular labeling pattern, and most intense along the luminal surface (Fig. 15). Bronchial gland epithelial cells had the strongest labeling intensity, followed by goblet cells, and then ciliated columnar epithelial cells (Fig. 16). Mucus, both extracellular and within goblet cells, was immunopositive for SALSA. Bronchial glands were absent in 5 of 24 biopsy samples, and these samples were excluded from the analysis of bronchial glands. Intensely labeled cells were defined as having ≥5 chromogenic pinpoint granules, a surrogate for mucus-containing cells (Fig. 15). The percentage of intensely labeled cells was significantly higher in asthmatic horses compared to non-asthmatic horses, post-challenge (P = .031). There were no significant differences by asthmatic status for any of the other assessed criteria (Figs. 17, 18, Table 4, Suppl. Fig. S5, Suppl. Tables S12 and S13).
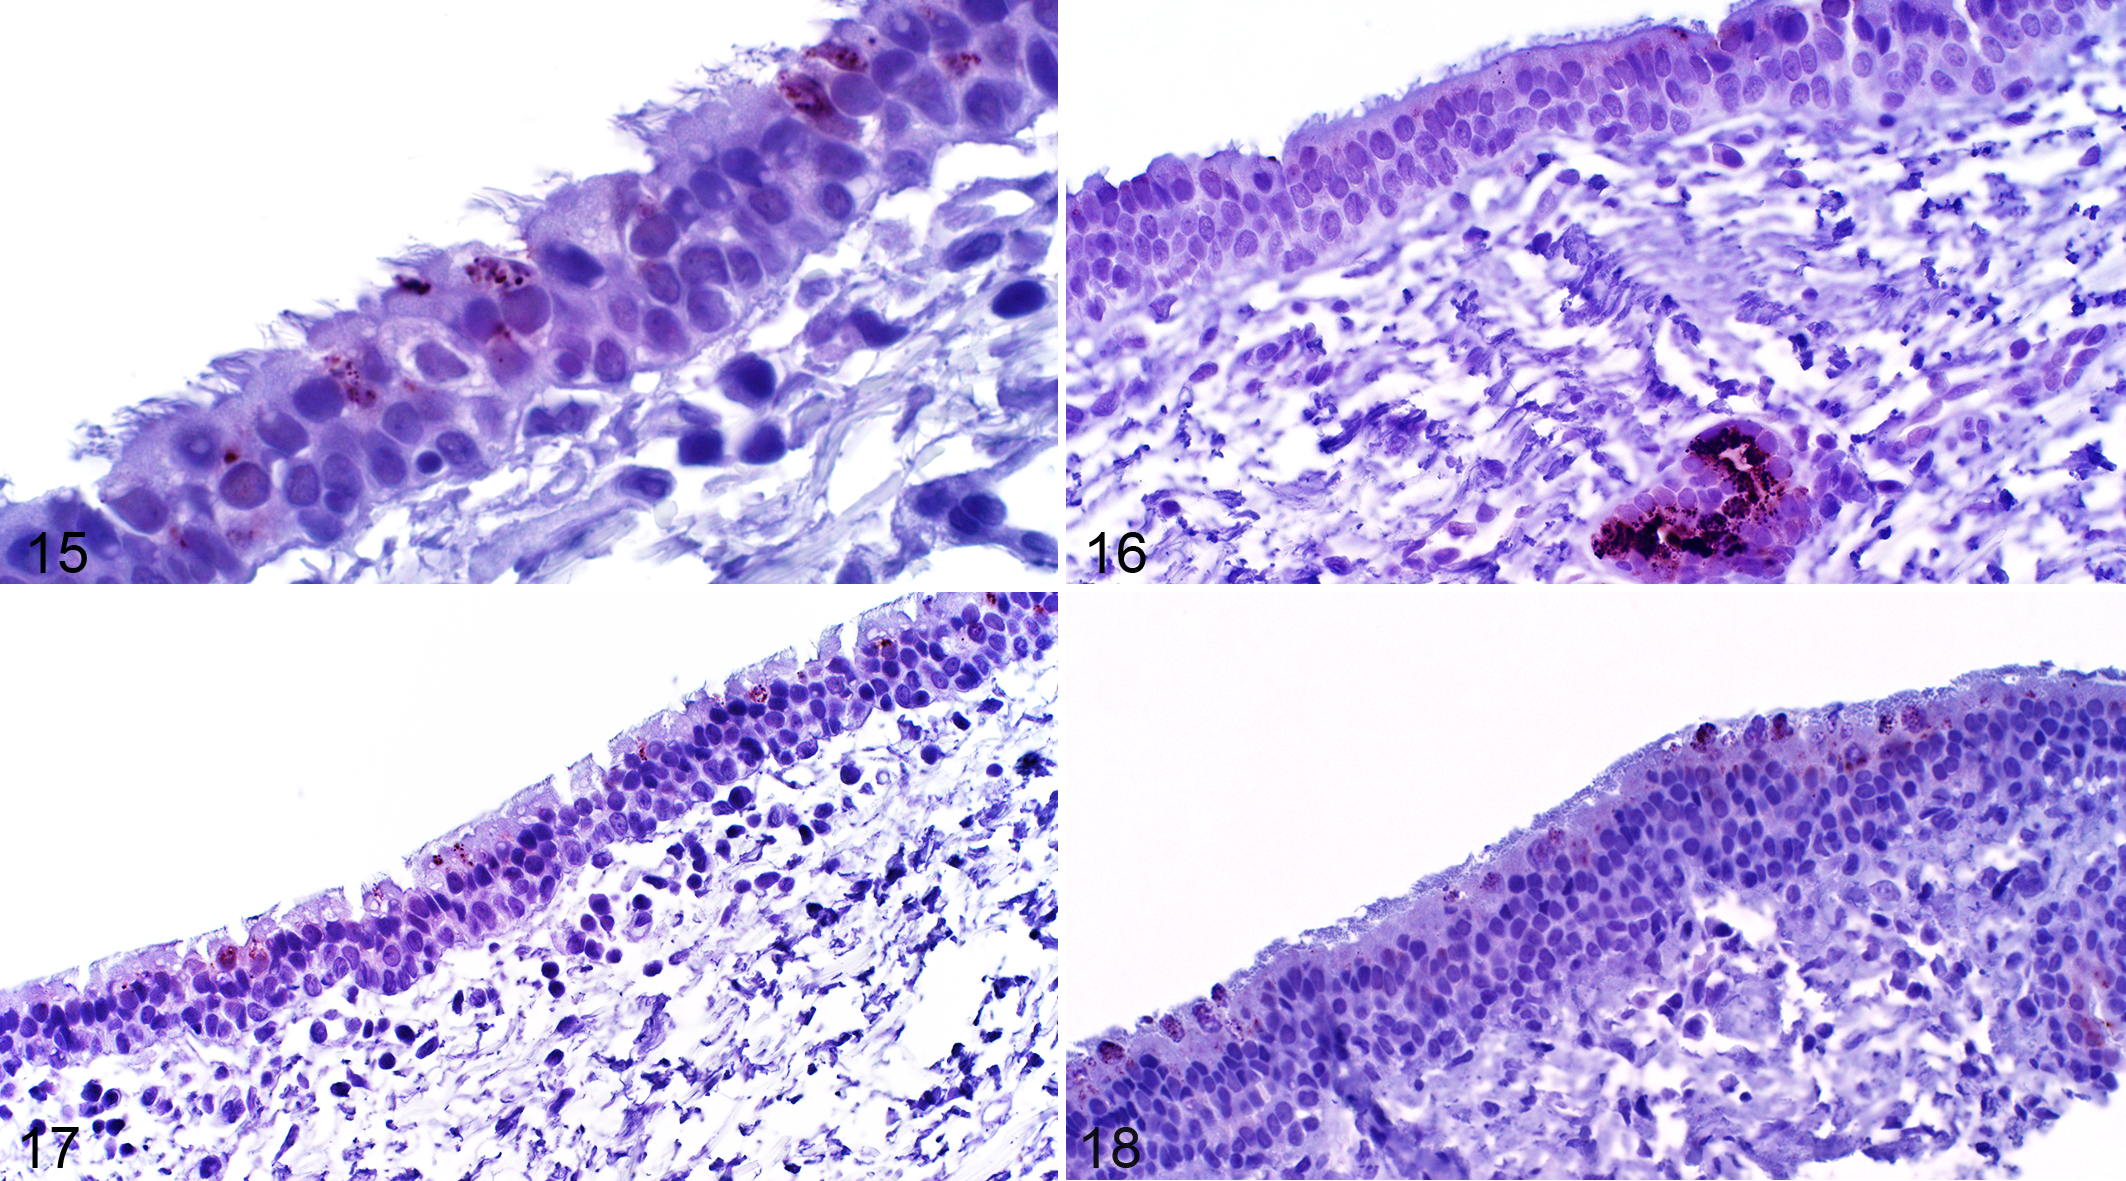
Asthma, endoscopic bronchial biopsies, horse. Immunohistochemistry for salivary scavenger and agglutinin (SALSA). The immunolabeling is cytoplasmic and apical with a granular pattern (Fig. 15). Bronchial gland epithelial cells have strong labeling intensity, especially along the luminal surface, compared to goblet cells and ciliated columnar epithelial cells (Fig. 16).
Immunolabeling for SALSA in bronchial mucosal biopsies from asthmatic and non-asthmatic horses (N = 6 per group).
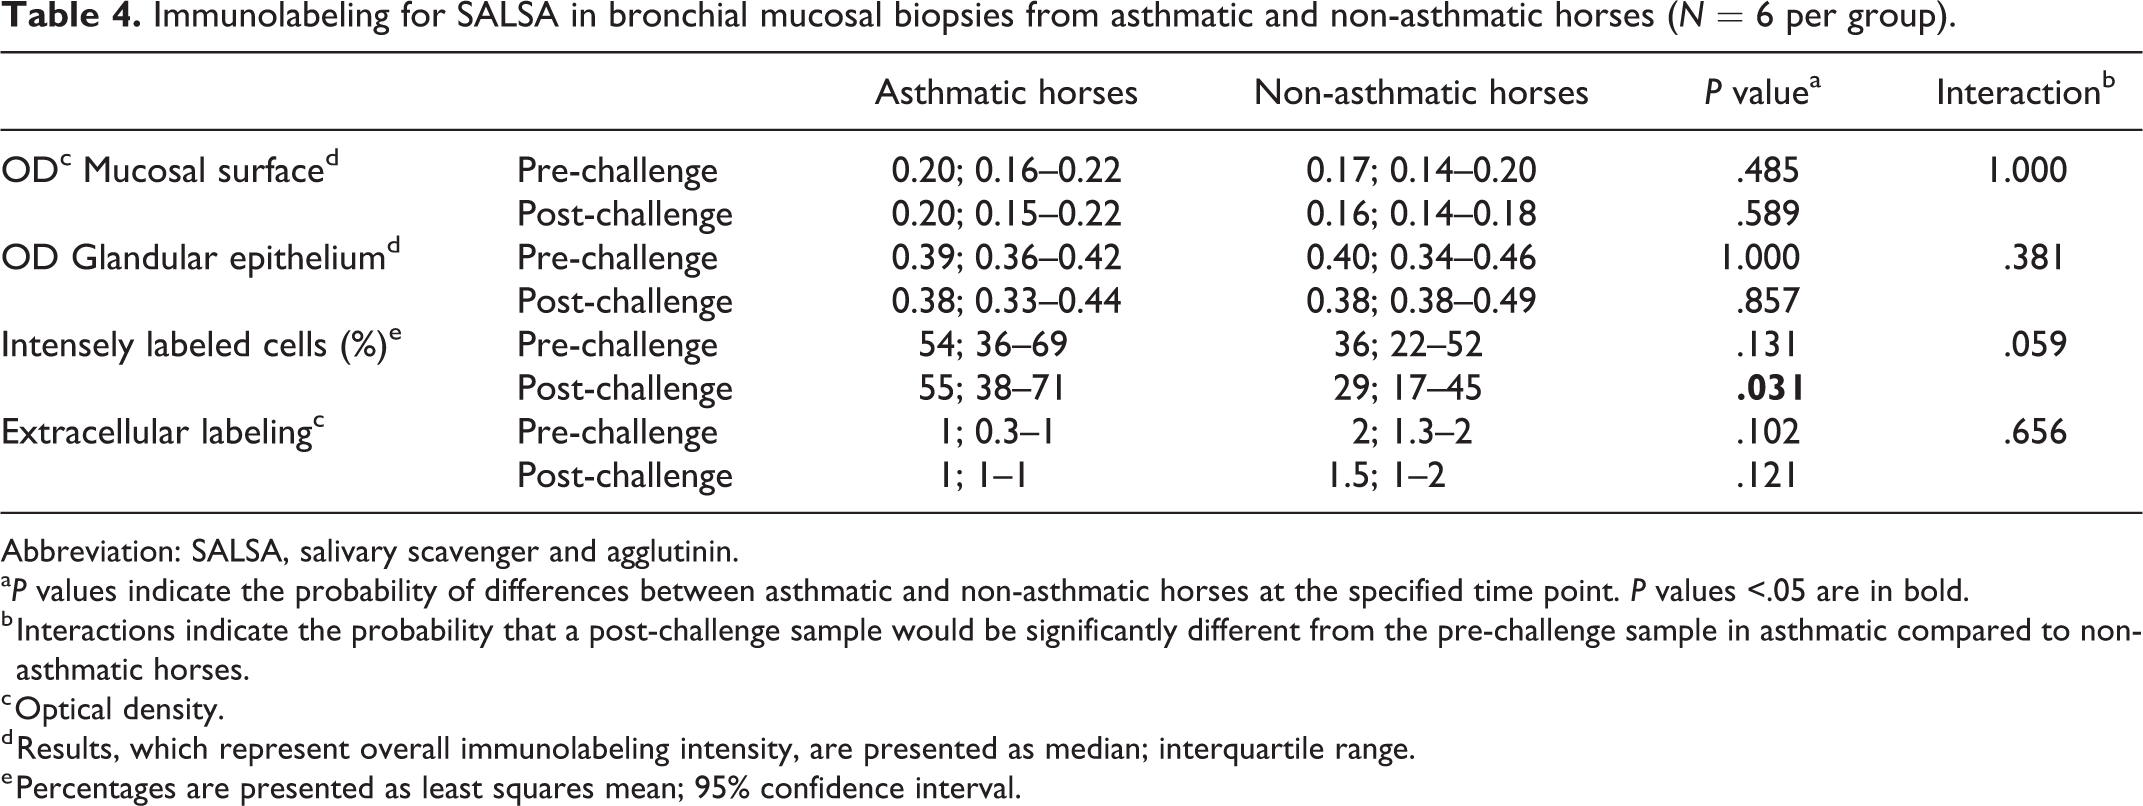
Abbreviation: SALSA, salivary scavenger and agglutinin.
a P values indicate the probability of differences between asthmatic and non-asthmatic horses at the specified time point. P values <.05 are in bold.
b Interactions indicate the probability that a post-challenge sample would be significantly different from the pre-challenge sample in asthmatic compared to non-asthmatic horses.
c Optical density.
d Results, which represent overall immunolabeling intensity, are presented as median; interquartile range.
e Percentages are presented as least squares mean; 95% confidence interval.
Blood Samples
In all pre-challenge serum samples SAA was ≤1.1 mg/L, but post-challenge SAA was >100 mg/L in 4 of 6 asthmatic horses, and 3.1 to 60.1 mg/L in 3 non-asthmatic horses. The concentration of SAA tended to be higher in asthmatic horses compared to non-asthmatic horses post-challenge, but the differences were not statistically significant (P = .167; Fig. 19, Table 5, Suppl. Table S14).
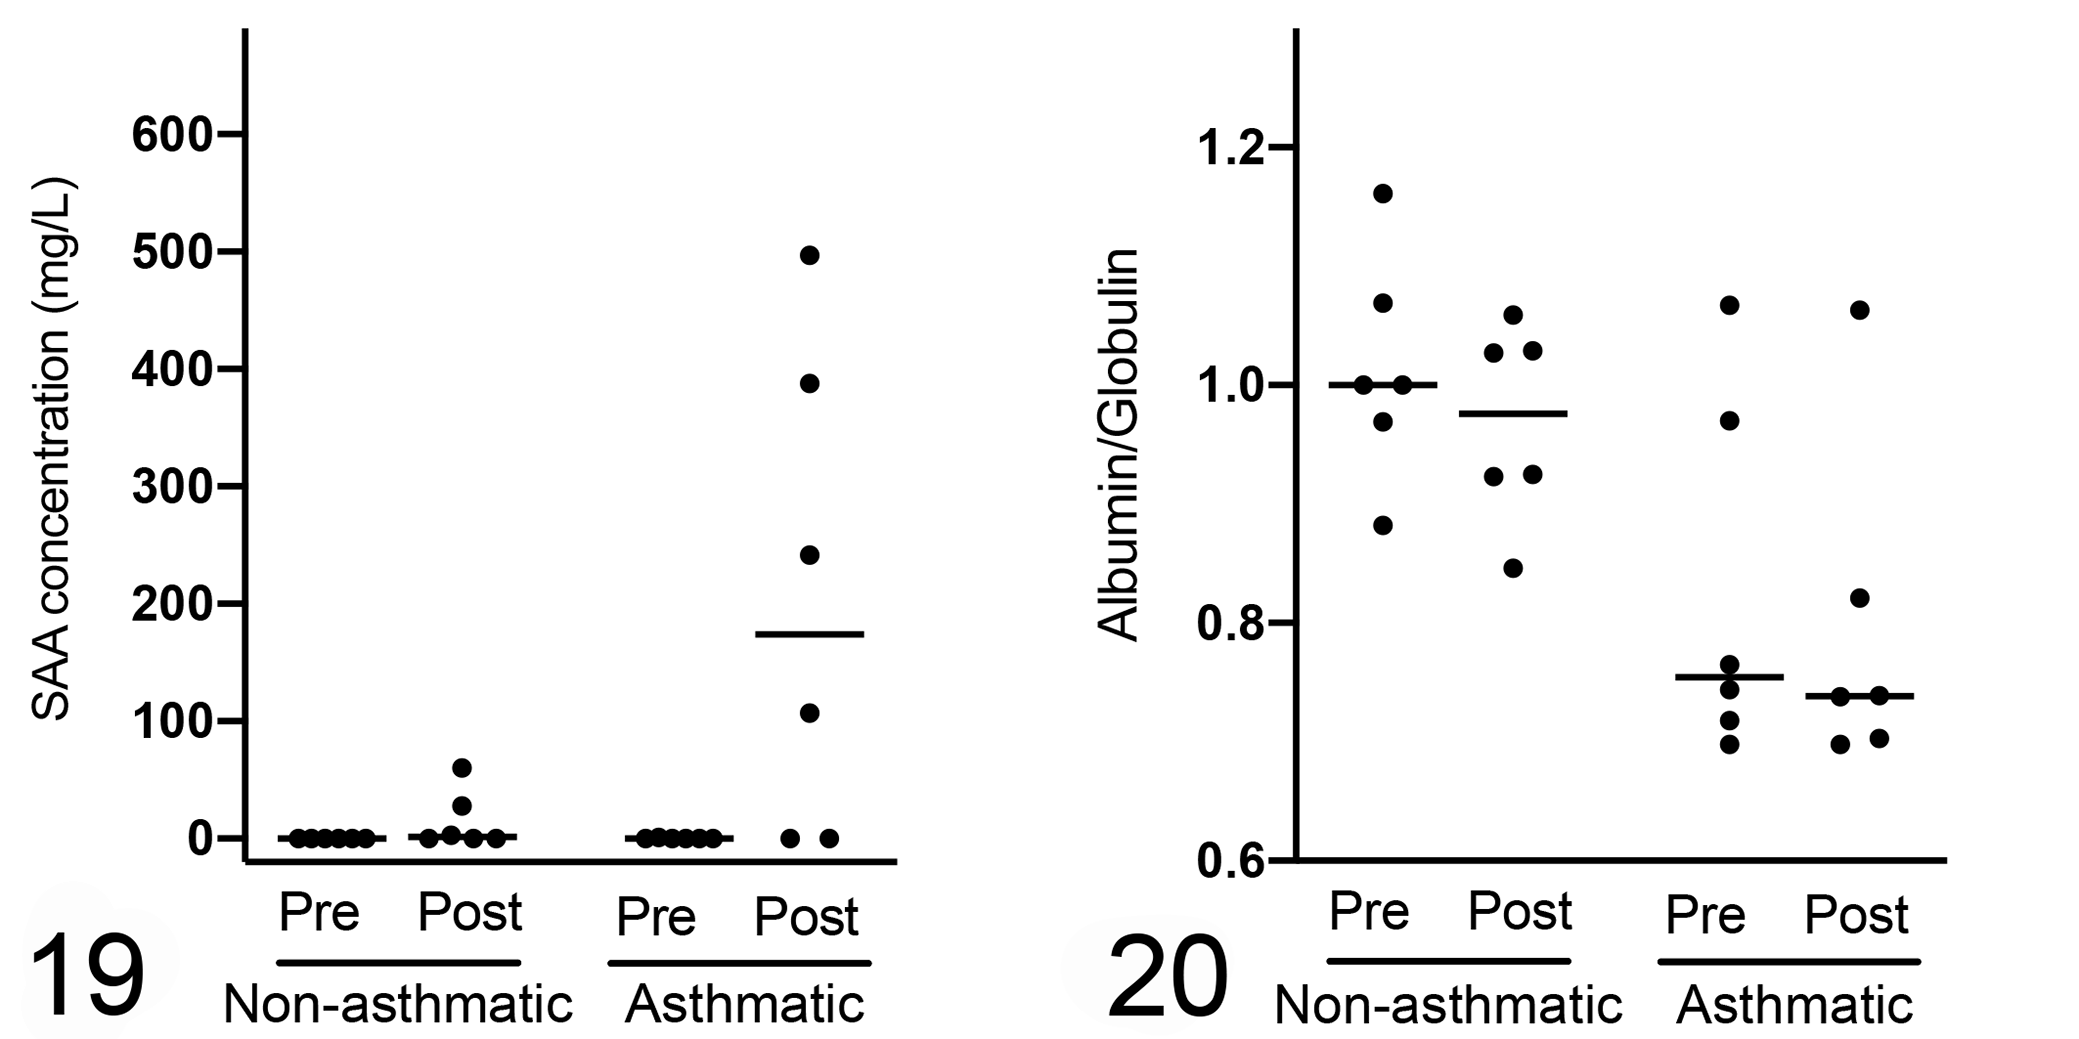
Serum inflammatory markers. There is a greater increase in serum amyloid A (SAA) concentration (Fig. 19) and lower albumin–globulin (A:G) ratio (Fig. 20) in asthmatic compared to non-asthmatic horses following challenge, but changes were not statistically significant (P = .167 and P = .093, respectively; n = 6 per group). Horizontal bars represent the median.
Serum analytes in asthmatic and non-asthmatic horses (N = 6 per group).a
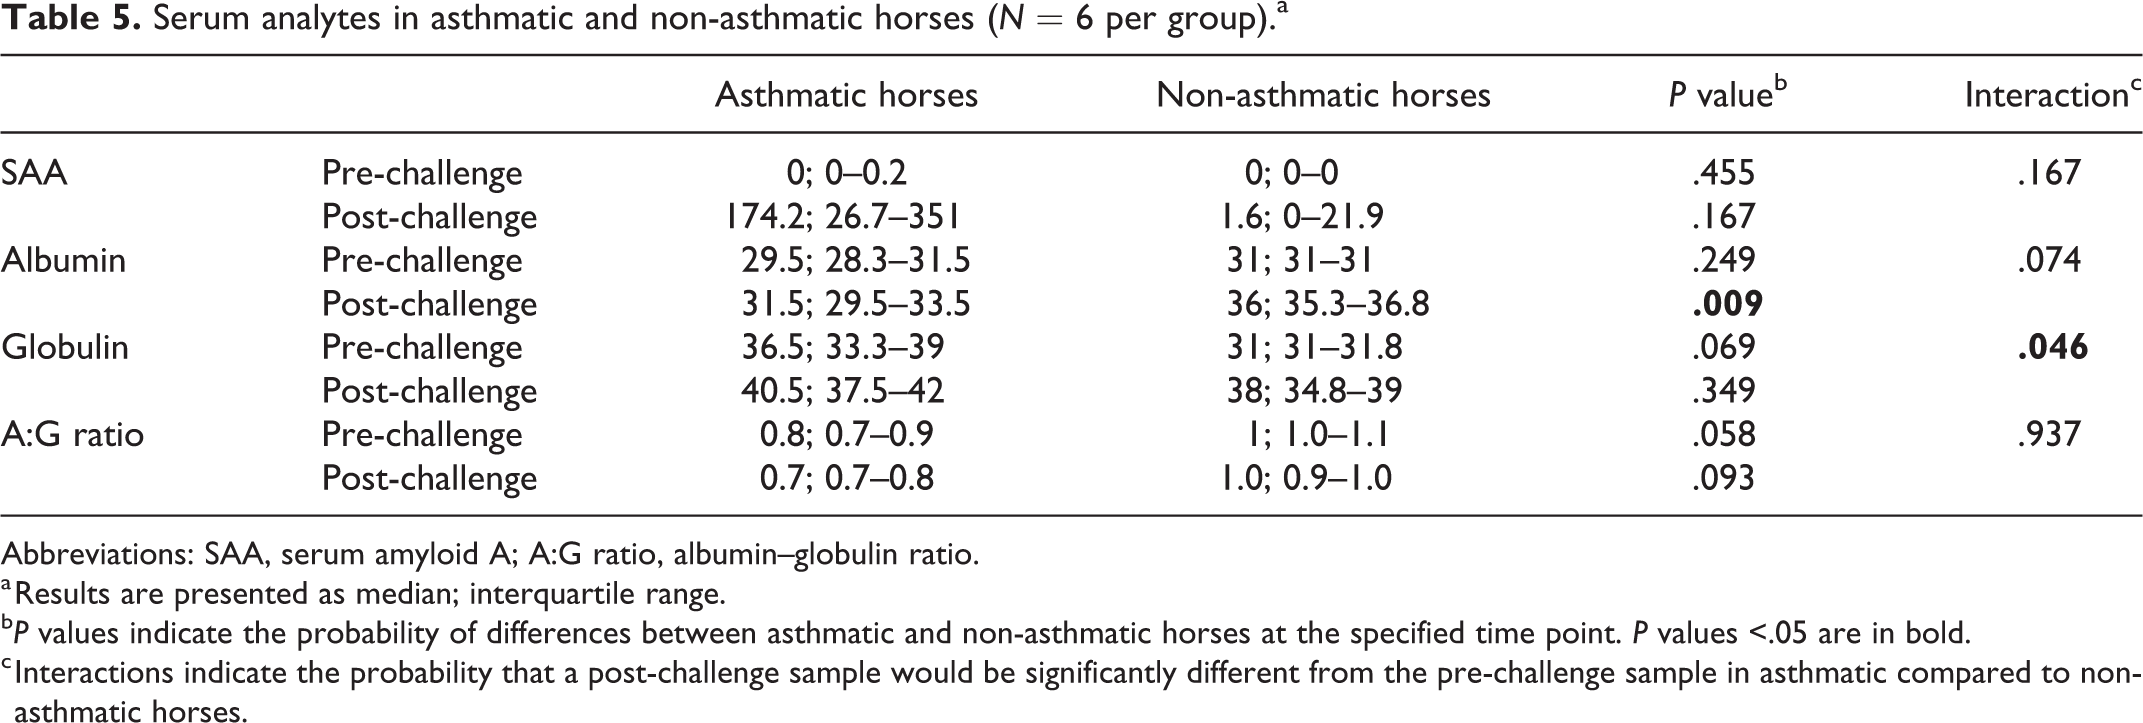
Abbreviations: SAA, serum amyloid A; A:G ratio, albumin–globulin ratio.
a Results are presented as median; interquartile range.
b P values indicate the probability of differences between asthmatic and non-asthmatic horses at the specified time point. P values <.05 are in bold.
c Interactions indicate the probability that a post-challenge sample would be significantly different from the pre-challenge sample in asthmatic compared to non-asthmatic horses.
Serum albumin concentration was significantly lower in asthmatic compared to non-asthmatic horses at the post-challenge time point (P = .009). Conversely, serum globulin concentrations tended to be higher in asthmatic compared to non-asthmatic horses, and the A:G ratio tended to be lower in asthmatic compared to non-asthmatic horses, but the differences were not statistically significant (Fig. 20, Table 5).
Discussion
The primary objectives of this study were to describe brush cytology, endobronchial biopsy, and detection of SALSA in SEA. Brush cytology identified more than 25% neutrophils in 4 of 6 asthmatic horses post-challenge, whereas endobronchial biopsies did not discern differences between asthmatic and non-asthmatic horses following the challenge period. Bronchial SALSA immunolabeling was not significantly different in SEA and controls, despite evidence of local and systemic inflammation in asthmatic horses post-challenge. Notably, on brush cytology, 3 asthmatic horses had lower neutrophil proportions post-challenge compared to pre-challenge, which differed from the BAL findings.
Consistent with established findings, post-challenge BAL samples from asthmatic horses had markedly higher neutrophil proportions than those from non-asthmatic horses. 9,15 It has been demonstrated that exposure to organic dust elicits neutrophilic inflammation within the bronchi of both asthmatic and non-asthmatic horses, but of much greater magnitude in asthmatic horses. 10 The proportion of BAL neutrophils in non-asthmatic horses reached up to 6%, consistent with mild inflammation, while in asthmatic horses BAL neutrophils were >25%; these align with findings from others. 10 Similarly, the proportion of neutrophils was ≥10% in 5 of 6 brush cytology samples from asthmatic horses, while all samples from non-asthmatic horses had ≤7% neutrophils post-challenge. During BAL, intraluminal lower airway and alveolar leukocytes distal to a bronchial seal formed by the endoscope are aspirated, while endoscopic brushing collects leukocytes adherent to a particular region of the bronchial mucosa. Thus, the techniques are not equivalent in regard to sample origin, as illustrated by one asthmatic horse where the brush sample did not capture post-challenge neutrophilic inflammation. This also means that the cutoff of >25% neutrophils in BAL for diagnosis of SEA is likely not directly applicable for brush cytology samples. Since a higher proportion of epithelial cells is sampled by brushing, it seems likely that a lower proportion of neutrophils may be sufficient to diagnose airway inflammation on brush cytology. In this study, samples from 5/6 asthmatic horses exceeded a cutoff of 10% neutrophils on brush cytology post-challenge, while samples from all non-asthmatic horses were below that cut-off. However, a larger sample size is required to determine a more accurate cutoff, and to validate the technique. Absence of frequent neutrophils may not rule out SEA since histologically, neutrophilic inflammation in SEA is most intense in distal bronchioles and alveoli, but endoscopic brushing sampled the third-generation airways. 7,33 Three of the asthmatic horses had higher neutrophil percentages pre-challenge compared to post-challenge on brush cytology, highlighting that the neutrophil percentage alone may not be reliable indicator of the severity of airway inflammation, given that the technique only samples a limited area compared to BAL. Therefore, brush cytology has caveats as a diagnostic tool for SEA. However, morphological evaluation of epithelial cells can be more easily performed on brush cytology. 21
Histological assessment of endobronchial biopsies revealed that lymphocytes were the predominant inflammatory cell type in the mucosa, and that they tended to be more frequent in post-challenge relative to pre-challenge samples although the differences were not statistically significant. Subtle differences by asthmatic status may be due to the small number of samples, limited biopsy size, and short duration of the challenge. In another study, significant differences in inflammatory infiltrates in the mucosa and extracellular matrix were noted between asthmatic horses in exacerbation compared to asthmatic horses in remission and non-asthmatic horses, but a longer challenge period of 2 weeks was used in that study. 6 It is likely that a longer challenge period would be associated with more significant differences, but that would induce overt dyspnea and coughing in asthmatic horses, which is not permissible within prevailing animal care guidelines. Neutrophils were scarce in endobronchial biopsies, reflecting their predominant bronchiolar intraluminal location. In samples from one asthmatic horse, neutrophils were entangled in mucus along the mucosal surface. These may be neutrophils that are coughed up from the distal airways, and might have been sampled by brushing. Such mucus strands with entrapped neutrophils were only rarely noted, perhaps because they are not easily captured during the pinch biopsy procedure or are lost during fixation and processing. Therefore, endoscopic biopsies are for the most part unable to capture the intraluminal neutrophilic inflammation associated with SEA. Compared with endoscopic biopsies, brush cytology offers the advantage of being able to identify intraluminal neutrophilic inflammation and possibly provide a rapid diagnosis but does not produce consistent results like BAL. On the other hand, endoscopic biopsies offer the opportunity to assess changes associated with airway remodelling and mucosal mononuclear inflammation. Although the changes noted on endoscopic biopsy were minimal in our study, longer challenge or exposure periods would likely result in more pronounced changes in the walls of the airways, which would be better predictors of responsiveness to treatment and long-term prognosis. 6
Gene expression of SALSA was decreased in bronchial biopsies of asthmatic compared to non-asthmatic horses; therefore, in situ SALSA protein was measured in this study. 19,36,37 The median mucosal immunolabeling intensity in samples from asthmatic horses was slightly higher than in samples from non-asthmatic horses, but the differences were not significant. Gene expression is not equivalent to protein production, and lack of agreement between gene and protein quantification may reflect differences in mRNA stability or physiological variation. 12 Samples used for RNASeq were from a comparable location in asthmatic and non-asthmatic horses; therefore, the discrepancy between mRNA and protein may be due to post-transcriptional factors affecting mRNA stability, or subtle differences captured by RNASeq but not IHC. 37 In humans with bacterial pneumonia or inflammatory bowel disease, SALSA labeling intensity increased with the severity of inflammation. 22,23,25,29 Increased SALSA is considered to be a protective response since SALSA can scavenge and inactivate microorganisms, and regulate inflammatory pathways such as the complement cascade and Toll-like receptor 4 signalling. 28 The higher percentage of intensely labeled cells noted in asthmatic horses post-challenge might be suggestive of such a response, but since the mucosal immunolabeling intensity was overall not significantly different in exacerbated SEA, this subtle change is of questionable significance, and would likely be of limited diagnostic utility.
In this study, SAA, albumin and globulin were measured to assess systemic inflammation. 17 The concentration of SAA increased markedly in 4 of 6 asthmatic horses post-challenge, and A:G ratios were decreased, which indicated acute systemic inflammation. Bronchial SALSA immunolabeling intensity did not differ despite evidence of inflammation, suggesting that bronchial SALSA is not a sensitive marker for systemic inflammation. 2 The lack of significant difference in SALSA immunolabeling intensity between asthmatic and non-asthmatic horses could perhaps be explained by the minimal inflammatory changes in endoscopic biopsies. Additionally, SEA does not have an infectious cause, and the role of specific inflammatory mediators is undetermined. As detected by IHC, SALSA is highly expressed in goblet cells and extracellular mucus. 19 Goblet cells and mucus were assessed in brush cytology and endobronchial biopsy samples to evaluate the influence that airway remodelling, as suggested by goblet cell hyperplasia, might have on expression of SALSA. Neither brush cytology nor endobronchial biopsy identified significant differences between groups of horses in goblet cell proportion or mucus. This may reflect a relatively short challenge period causing acute exacerbation rather than maximally severe airway disease.
Findings in this study need to be considered in light of several limitations. The number of animals assessed was limited. The gold standard criteria for diagnosis of SEA (respiratory function and BAL) were significantly different between affected and unaffected horses, but the differences identified with other tests were not as significant with this sample size. Bronchial brushings were performed following BAL. Although brushings were performed proximal to where the endoscope formed a seal within the bronchi, it is possible that lavage displaced intraluminal cells onto the mucosal surface of the bronchi. However, alveolar macrophages were not a prominent feature of bronchial brushings, suggesting minimal interference. Future studies should consider performing bronchial brushings prior to BAL to avoid this potential limitation. Endoscopes for bronchial biopsies and brush samples only allow access to bronchi rather than bronchioles, but bronchi may not be as affected in SEA relative to bronchioles. Endobronchial biopsies also are of limited depth, and may therefore not capture the full extent of inflammation. Given these limitations, this study should be viewed as a description of various diagnostic techniques in SEA, rather than guidelines for diagnostic use.
In summary, endoscopic brush samples were capable of identifying neutrophilic inflammation in most cases of SEA; however, the neutrophil percentage noted was not consistently associated with the degree of inflammation. Using the neutrophil percentage alone has the potential to misidentify asthmatic status, and additional studies on a larger sample size would be required to validate the use of bronchial brushings in SEA. Therefore, BAL remains the diagnostic test of choice for SEA, and should not be substituted by brush cytology when BAL can be performed safely as there is the potential for false positive and negative results. In cases where BAL might not be feasible, for example, in horses with markedly impaired pulmonary function, brush samples can be considered an alternative diagnostic tool, with the understanding of its limitations. Based on our limited sample size, determination of mucosal and subepithelial inflammation and IHC measurement of SALSA did not distinguish asthmatic from non-asthmatic horses during acute exacerbation. Serum protein concentrations supported the presence of systemic inflammation in SEA. Overall, bronchial SALSA was not a sensitive marker for either systemic or airway inflammation.
Supplemental Material
Supplemental Material, sj-pdf-1-vet-10.1177_03009858211048635 - Bronchial brush cytology, endobronchial biopsy, and SALSA immunohistochemistry in severe equine asthma
Supplemental Material, sj-pdf-1-vet-10.1177_03009858211048635 for Bronchial brush cytology, endobronchial biopsy, and SALSA immunohistochemistry in severe equine asthma by Gary K. C. Lee, Janet Beeler-Marfisi, Laurent Viel, Érica Piché, Heng Kang, William Sears and Dorothee Bienzle in Veterinary Pathology
Supplemental Material
Supplemental Material, sj-xlsx-1-vet-10.1177_03009858211048635 - Bronchial brush cytology, endobronchial biopsy, and SALSA immunohistochemistry in severe equine asthma
Supplemental Material, sj-xlsx-1-vet-10.1177_03009858211048635 for Bronchial brush cytology, endobronchial biopsy, and SALSA immunohistochemistry in severe equine asthma by Gary K. C. Lee, Janet Beeler-Marfisi, Laurent Viel, Érica Piché, Heng Kang, William Sears and Dorothee Bienzle in Veterinary Pathology
Footnotes
Acknowledgements
We thank Sean Marak and Mary Ellen Clark for assisting with sample collection.
Declaration of Conflicting Interests
The author(s) declared no potential conflicts of interest with respect to the research, authorship, and/or publication of this article.
Funding
The author(s) disclosed receipt of the following financial support for the research, authorship, and/or publication of this article: This study was supported by Equine Guelph and the Natural Sciences and Engineering Research Council (NSERC) of Canada. GKCL is the recipient of a University of Guelph doctoral fellowship.
Supplemental material for this article is available online.
References
Supplementary Material
Please find the following supplemental material available below.
For Open Access articles published under a Creative Commons License, all supplemental material carries the same license as the article it is associated with.
For non-Open Access articles published, all supplemental material carries a non-exclusive license, and permission requests for re-use of supplemental material or any part of supplemental material shall be sent directly to the copyright owner as specified in the copyright notice associated with the article.