
Abstract
Mice with an inactivating mutation in the gene encoding asparagine synthetase domain containing 1 (ASNSD1) develop a progressive degenerative myopathy that results in severe sarcopenia and myosteatosis. ASNSD1 is conserved across many species, and whole body gene expression surveys show maximal expression levels of ASNSD1 in skeletal muscle. However, potential functions of this protein have not been previously reported. Asnsd1−/− mice demonstrated severe muscle weakness, and their normalized body fat percentage on both normal chow and high fat diets was greater than 2 SD above the mean for 3651 chow-fed and 2463 high-fat-diet–fed knockout (KO) lines tested. Histologic lesions were essentially limited to the muscle and were characterized by a progressive degenerative myopathy with extensive transdifferentiation and replacement of muscle by well-differentiated adipose tissue. There was minimal inflammation, fibrosis, and muscle regeneration associated with this myopathy. In addition, the absence of any signs of lipotoxicity in Asnsd1−/− mice despite their extremely elevated body fat percentage and low muscle mass suggests a role for metabolic dysfunctions in the development of this phenotype. Asnsd1−/− mice provide the first insight into the function of this protein, and this mouse model could prove useful in elucidating fundamental metabolic interactions between skeletal muscle and adipose tissue.
Keywords
In order to identify pharmaceutically relevant targets for treating human disease, 75,77 Lexicon Pharmaceuticals initiated its Genome5000 functional genomics program, which applied high-throughput mutagenesis and phenotyping approaches in characterizing 4654 novel knockout (KO) mouse lines. 4 During this process, many phenotypes in mice were discovered that have since proven useful in elucidating fundamental biological processes as well as genetic causes of disease. 10 We report here the development of a degenerative myopathy and myosteatosis in Asnsd1 Gt(OST460318)Lex KO mice (Asnsd1−/− mice) having a gene-trapped deletion of the protein asparagine synthetase domain containing 1 (ASNSD1). This protein is conserved across many species (https://www.ncbi.nlm.nih.gov/homologene/6564), and whole body gene expression surveys show maximal expression levels of ASNSD1 in the skeletal muscle in humans (https://www.proteinatlas.org/ENSG00000138381-ASNSD1/tissue) and several other species. 23,60 However, to the best of our knowledge, no potential functions of this protein have been previously reported.
Many studies have focused on humans or on the mouse as a model organism to better understand the genetic complexity of obesity and myopathies, 64 and mouse models have proven essential in discovering the function of many genes and proteins and in elucidating the underlying mechanisms involved in myopathies (reviewed in Rahimov and Kunkel 43 ). Notably there was no mention of an ASNSD1-related myopathy included in the most recent comprehensive listing of monogenic muscle diseases. 5 Given the adipose tissue and skeletal muscle phenotypes we observed in Asnsd1−/− mice, it is interesting that ASNSD1 was included in a set of 213 candidate genes linked to type 2 diabetes mellitus. 44 Future studies in Asnsd1−/− mice may lead to a more complete understanding of the underlying pathomechanisms involved in myopathies that culminate in the transdifferentiation of myoblasts into adipocytes. Studies on these mice might also help elucidate the effects of sarcopenia and myosteatosis on metabolism, both being conditions that are of major clinical significance in aged humans.
Materials and Methods
Generation of Asnsd1−/− Mice
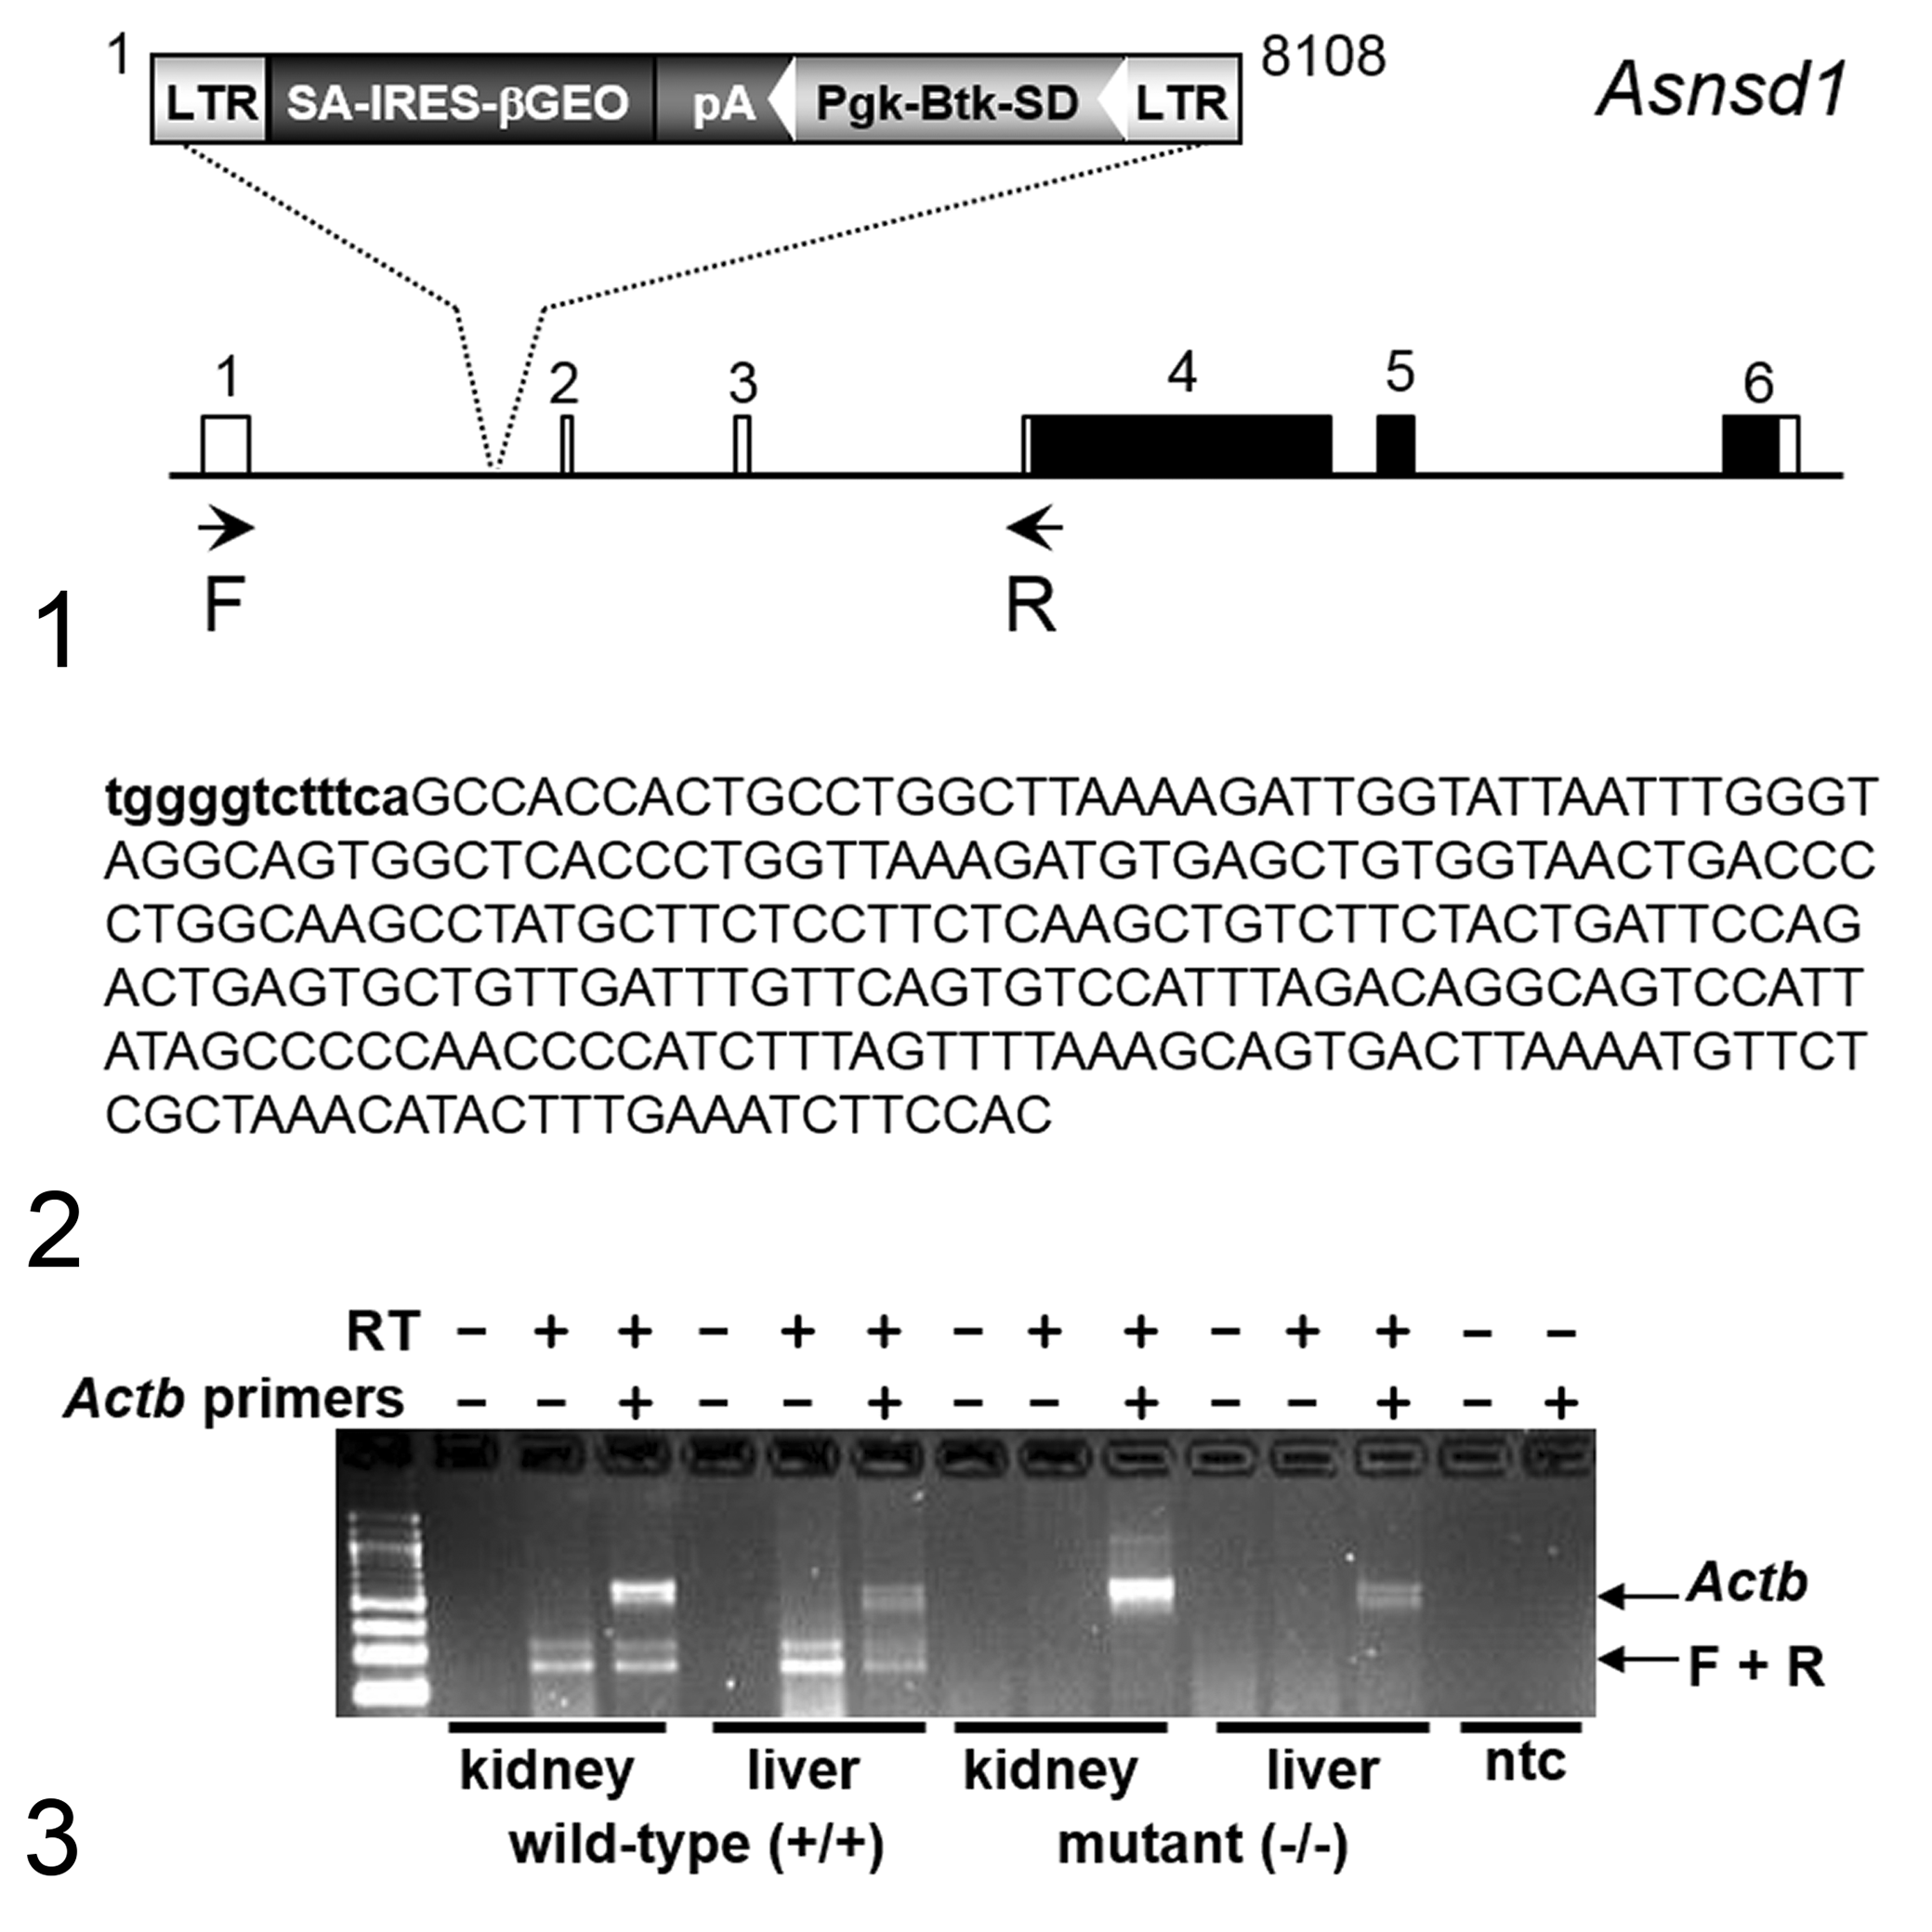
Our approach to knocking out and phenotyping mouse orthologs of the 5000 potential drug targets in the human genome is published; all mouse KO lines were generated by gene trapping or by homologous recombination. 4,9,68,75,77 Asnsd1 Gt(OST460318)Lex knockout mice (Asnsd1−/− ) were generated using the Asnsd1 gene trap in Omnibank embryonic stem (ES) cell clone OST460318 (accession CG667396.1) as shown in Figures 1 to 3. The mutation was generated using vector VICTR37, which contains both a splice acceptor sequence for capture of the endogenous transcription and an intraribosomal entry site to allow translation of the reporter gene. Vector insertion, which occurred within the 5′ untranslated region of Asnsd1 (transcript variant 1 is shown, NM_133728.3), is expected to prevent both transcription and translation of the endogenous transcript. Methods for gene trapping in ES cells, identifying trapped genes using Omnibank Sequence Tags (OSTs), characterizing retroviral gene-trap vector insertion sites and reverse transcriptase-polymerase chain reaction (RT-PCR) analysis of KO and wild-type (WT) transcripts are published. 75 The F2 Asnsd1−/− mice used in these phenotyping studies were produced by intercrossing the F1 heterozygous Asnsd1+/− offspring of chimeric founder parents and were therefore of mixed C57BL and 129 genetic background (129S5/SvEvBrd and C57BL/6J). Genotyping was performed on tail DNA as previously described. 78 In all experiments reported here, mutant mice were compared directly with their WT littermates used as negative controls.
Mouse Care and Study
All reported studies were carried out in strict accordance with the recommendations in the Guide for the Care and Use of Laboratory Animals. 38 All studies were performed at Lexicon Pharmaceuticals (AAALAC Accredited) and were approved by the Lexicon Institutional Animal Care and Use Committee. Mice were housed in a temperature-controlled environment on a fixed 12-hour light/12-hour dark cycle and with free access to water and food. Mice were fed either standard rodent chow 9F 5020 (Purina, St Louis, MO) as our chow diet or D12451 (Research Diets, New Brunswick, NJ) containing 45% of kcals from fat as our high-fat diet (HFD).
Phenotype Screening
Wild-type and knockout mice were subjected to a comprehensive battery of phenotype screening exams as previously described. 4,10,75,76 These screening assays included behavioral tests (such as circadian rhythm, open field, inverted screen, prepulse inhibition of the acoustic startle response, tail suspension, marble burying, and context trace conditioning), fundoscopy and retinal angiography exams, blood pressure and heart rate measurements, serum chemistries, insulin levels, glucose tolerance testing, urinalysis, quantitative magnetic resonance, dual-energy x-ray absorptiometry scans, computed axial tomography (CAT) scans, microcomputed tomography (micro-CT) scans, fertility testing, skin fibroblast proliferation assays, and pathology. Immunology assays included hematology, peripheral blood flow cytometric analysis, acute phase response, and ovalbumin challenge.
Body Composition Studies
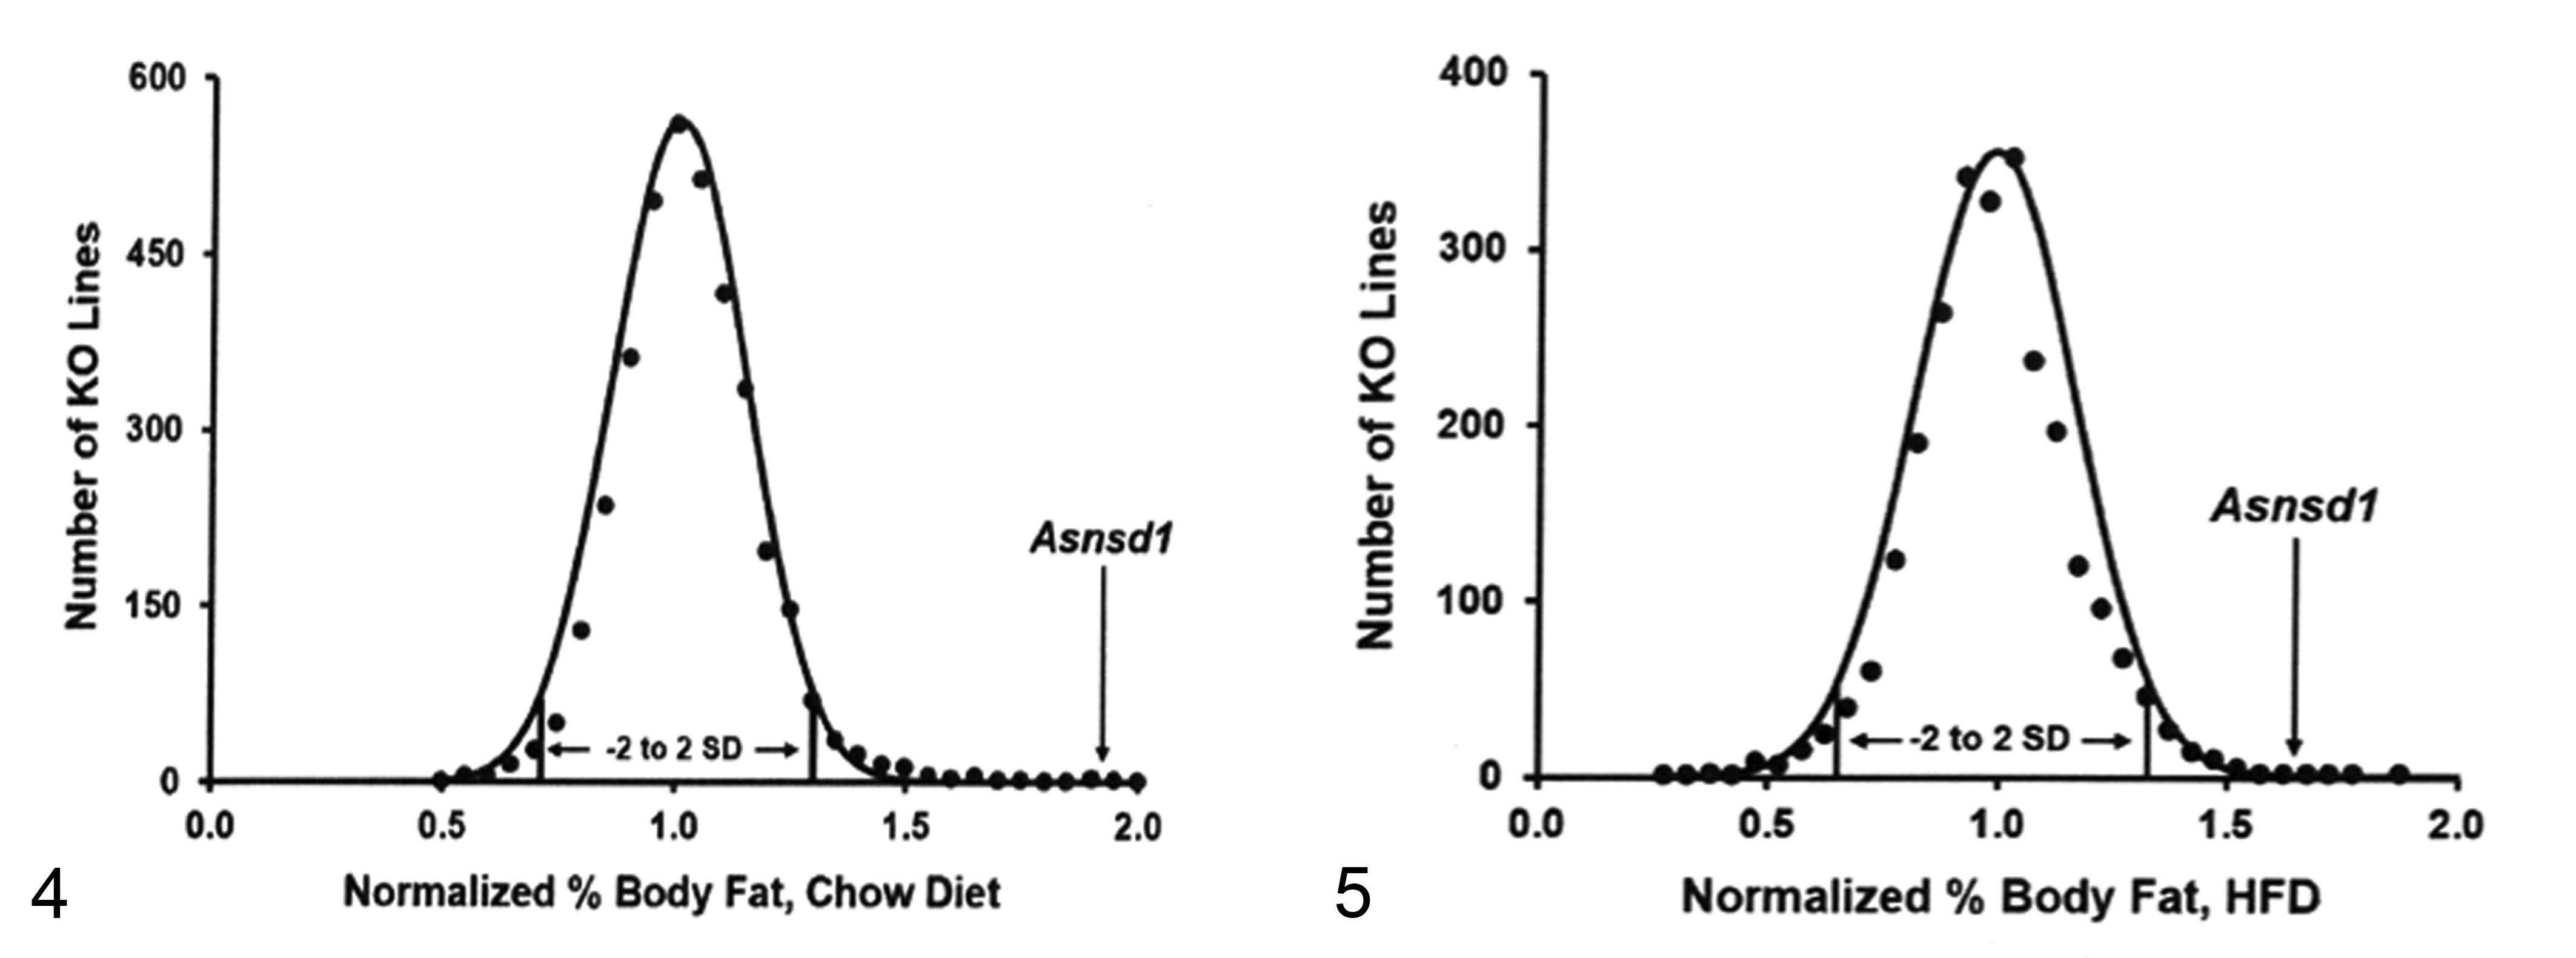
As part of our high-throughput primary screen of KO lines fed standard rodent chow diet from weaning, we used dual-energy X-ray absorptiometry (PIXImus, GE Medical Systems, Madison, WI) to analyze the body composition of 3651 KO lines, including a cohort of the Asnsd1−/− line (4 male and 4 female KO mice along with 2 male and 2 female WT littermate mice), at 14 weeks of age. For each KO line, the percent body fat in KO relative to WT mice (ie, mean KO % body fat/mean WT littermate % body fat) was calculated for both male and female mice, and these male and female values were then averaged, yielding a normalized % body fat value, as described previously. 9 As part of our high-throughput primary screen of KO lines fed HFD from weaning, we used quantitative magnetic resonance (QMR; ECHO Medical Systems, Houston, TX) to analyze the body composition of 2463 KO lines, including a cohort of the Asnsd1−/− line (5 male KO mice along with 5 male WT littermate mice), at 11 weeks of age; for each KO line, mean KO % body fat/mean WT littermate % body fat was calculated to generate the normalized % body fat value as described previously. 42 To confirm the body composition phenotype identified in the Asnsd1−/− mice in the primary phenotypic screen, additional cohorts of chow-fed Asnsd1−/− and WT littermate mice were analyzed by QMR.
Behavioral Assays
Inverted Screen
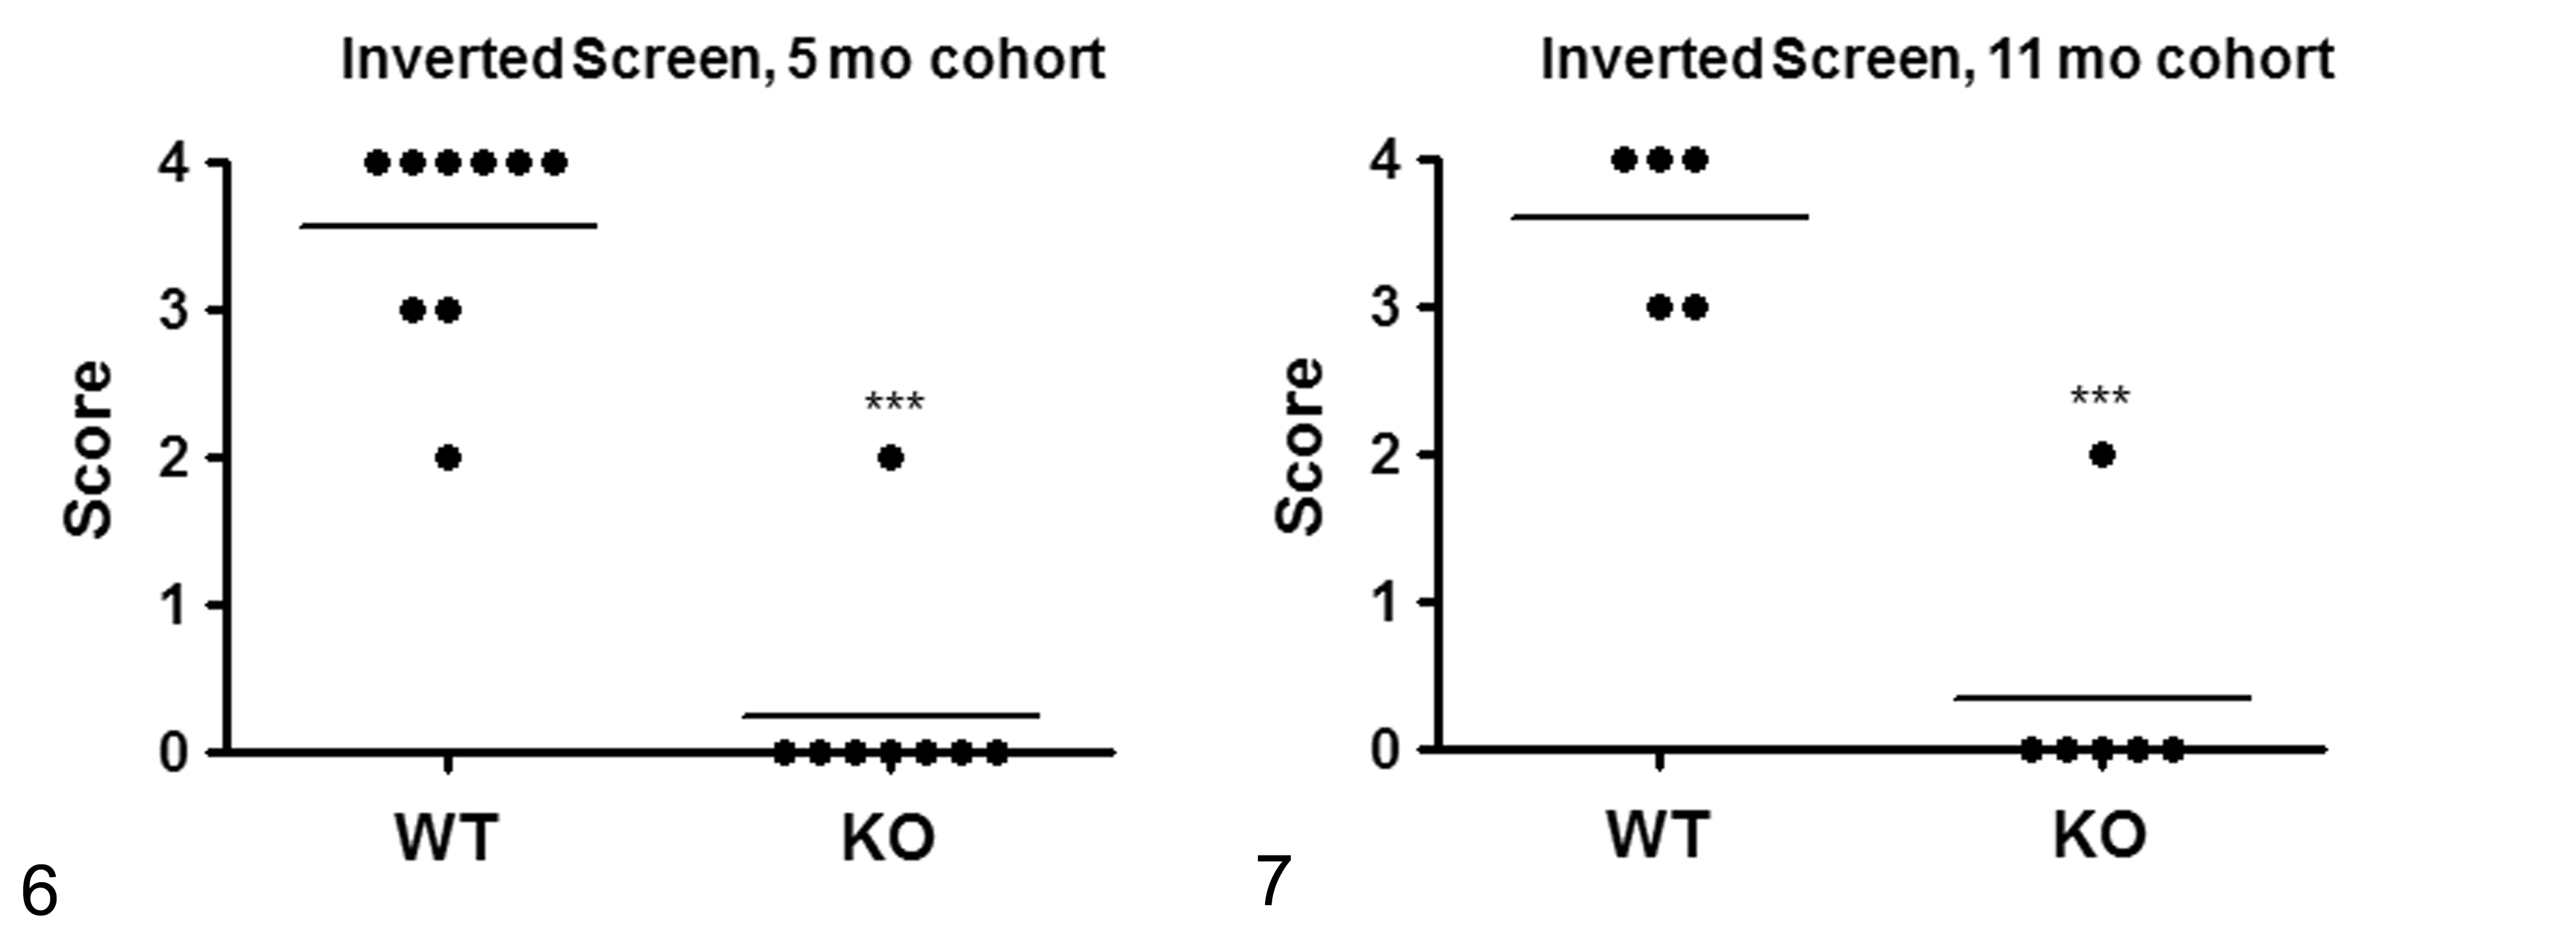
Mice were placed individually on top of a square (7.5 cm × 7.5 cm) wire screen mounted horizontally on a metal rod. The rod was then rotated 180° so that the mice were hanging upside down on the bottom of the screen. Sixty seconds after inverting the screen, the following behavioral responses were recorded and scored as follows: fell off the screen = 0; remained on the bottom of the screen but did not move = 1; remained on the bottom of the screen but moved around = 2; remained on the screen and climbed part way to the top = 3; and climbed to the top of the screen = 4.
Grip Strength
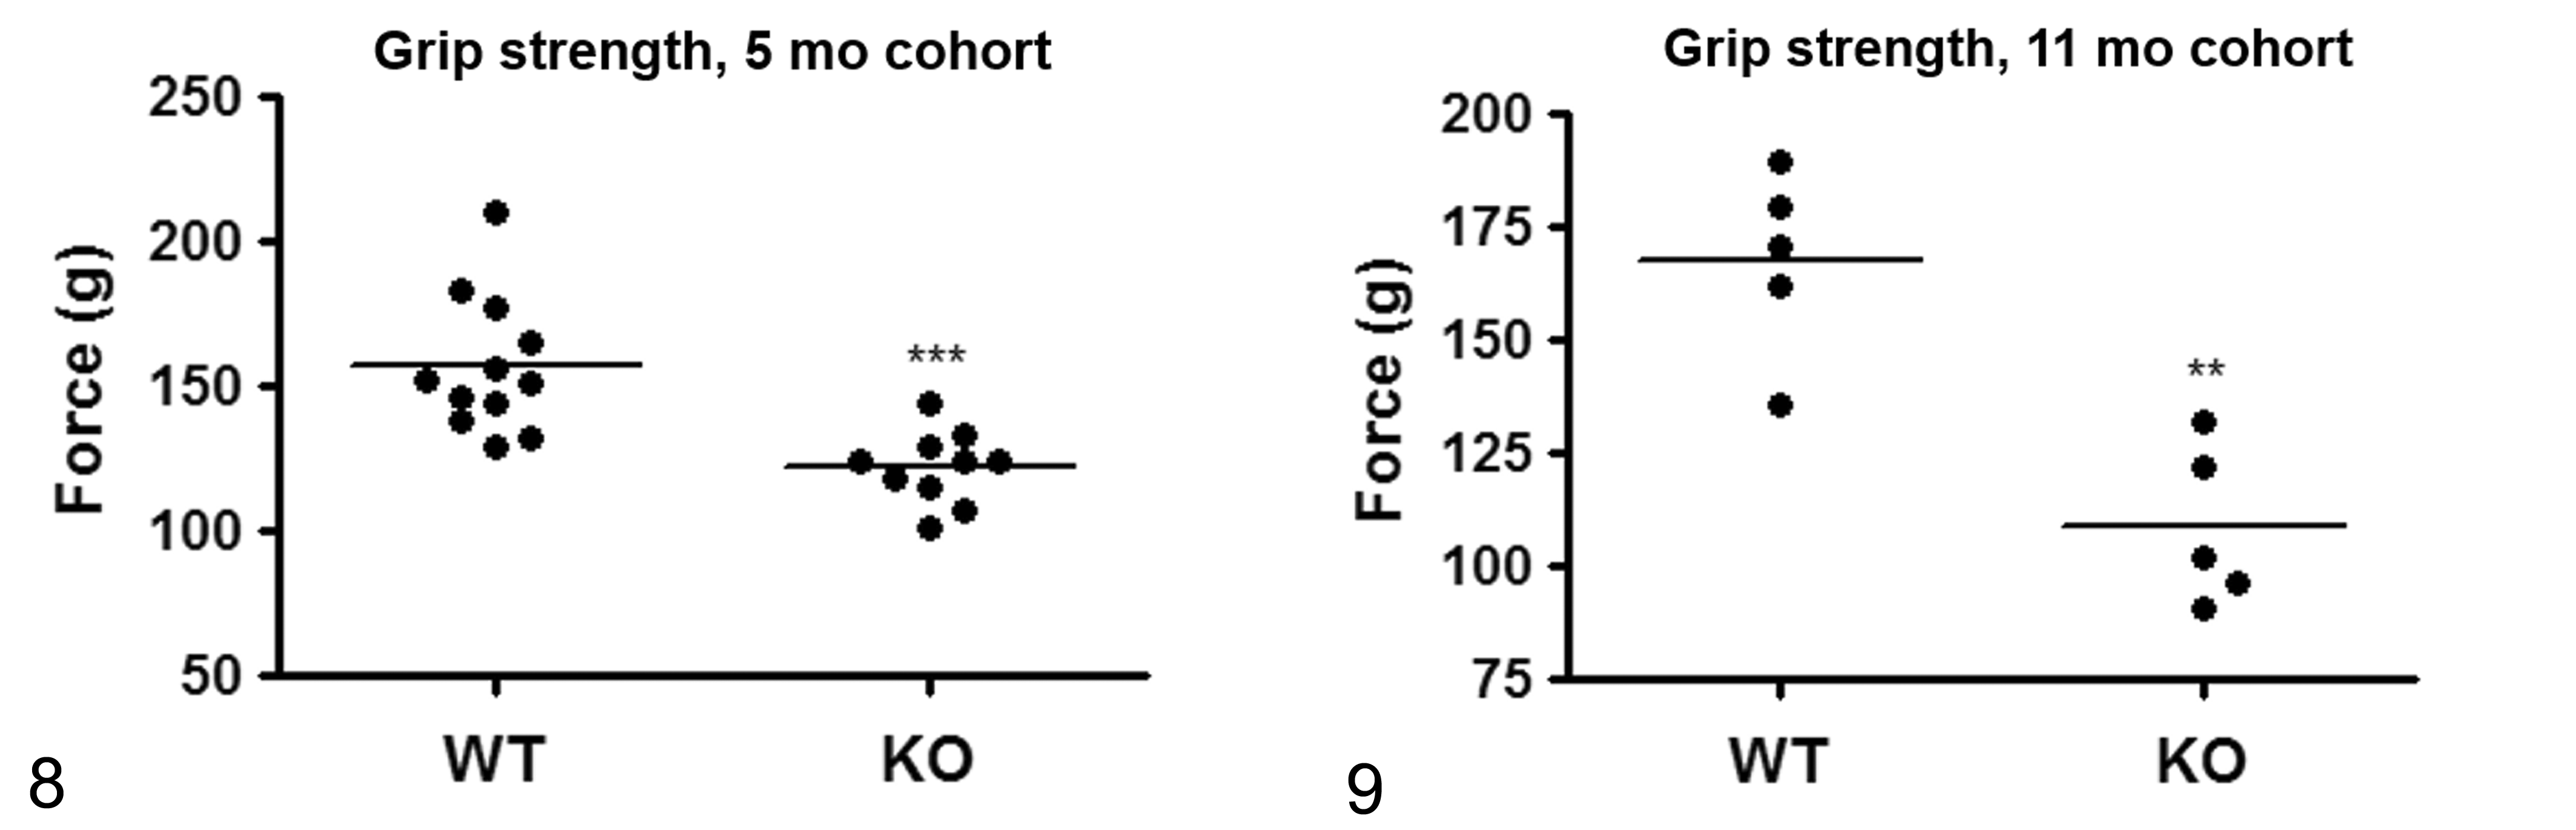
Forelimb grip strength was measured as described previously 55 using a Grip Strength Meter MK-380 (Muromachi Kikai Inc, Tokyo, Japan). Briefly, after the mice grasped a piece of wire gauze using their forelimbs, they were steadily pulled by the tail horizontally away until their grip was lost, at which time maximal force values were recorded.
Blood Sample Analysis
Blood samples were obtained from the retroorbital plexus of conscious mice at 12 weeks of age. As part of our high-throughput primary screen, blood chemistries on fed mice were measured by Cobas Integra 400 as described. 4 Fasting blood glucose levels were measured by ACCU-CHEK Aviva glucometer (Roche, Indianapolis, IN) as described. 45
Systolic Blood Pressure
Systolic blood pressure (SBP) was measured using a tail-cuff system (Visitech Systems, Apex, NC). SBP was measured 10 times daily for 4 consecutive days, and the SBP value reported was the mean value of the 40 readings, as described. 62
Statistical Analysis
Data are presented as mean ± SD. Comparisons between 2 groups were analyzed by unpaired Student’s t test; comparisons between 2 groups with significantly different variances were analyzed by the Mann-Whitney test. Chi-square testing was used to evaluate whether Mendelian ratios deviated from expected values. For all comparisons, differences were considered significant when P < .05.
Pathology and Immunohistochemistry
For pathology, Asnsd1−/− and WT littermate control mice that had not been subjected to any other phenotyping assays were selected at random (2 male and 2 female Asnsd1−/− mice and 1 male and 1 female WT controls at both time points). Immediately after euthanasia, these mice were fixed by cardiac perfusion with 10% neutral buffered formalin. Tissues submitted for histopathological examination included heart, skeletal muscle, tongue, lungs, trachea, thyroid gland, liver, kidney, adrenal gland, salivary glands, lymph nodes, white adipose, brown adipose, aorta, thymus, spleen, pancreas, stomach, duodenum, jejunum, ileum, cecum, colon, urinary bladder, skin, brain, eyes, nose, teeth, ear, bone, bone marrow, and either testes, epididymis, prostate gland, seminal vesicles and vas deferens or uterus and ovaries. All tissues were immersed in 10% neutral buffered formalin for an additional 48 hours, except for the eyes, which were removed and fixed by immersion in Davidson’s fixative (Poly Scientific, NY) overnight at room temperature. After fixation, all tissues were embedded in paraffin, sectioned at 4 μm, mounted on positively charged glass slides (Superfrost Plus; Thermo Fisher Scientific, Waltham, MA), and dried at 60 °C for 20 minutes before dewaxing and staining of sequential sections with hematoxylin and eosin (H&E). Skeletal muscle sections (cross-sections of rear leg, diaphragm, and epaxial/hypaxial muscles) were also stained with Sirius red and Masson’s trichrome using standard methods. Additional sequential sections were immunolabeled for desmin, fast and slow myosin heavy chains, MyoD, myogenin, perilipin (the major lipid droplet coat protein in mature adipocytes), and 2 different antibodies (Iba-1, F4/80) to detect macrophages. The primary antibodies and assay parameters are outlined in Table 1.
Immunohistochemical Methods Used in this Study.
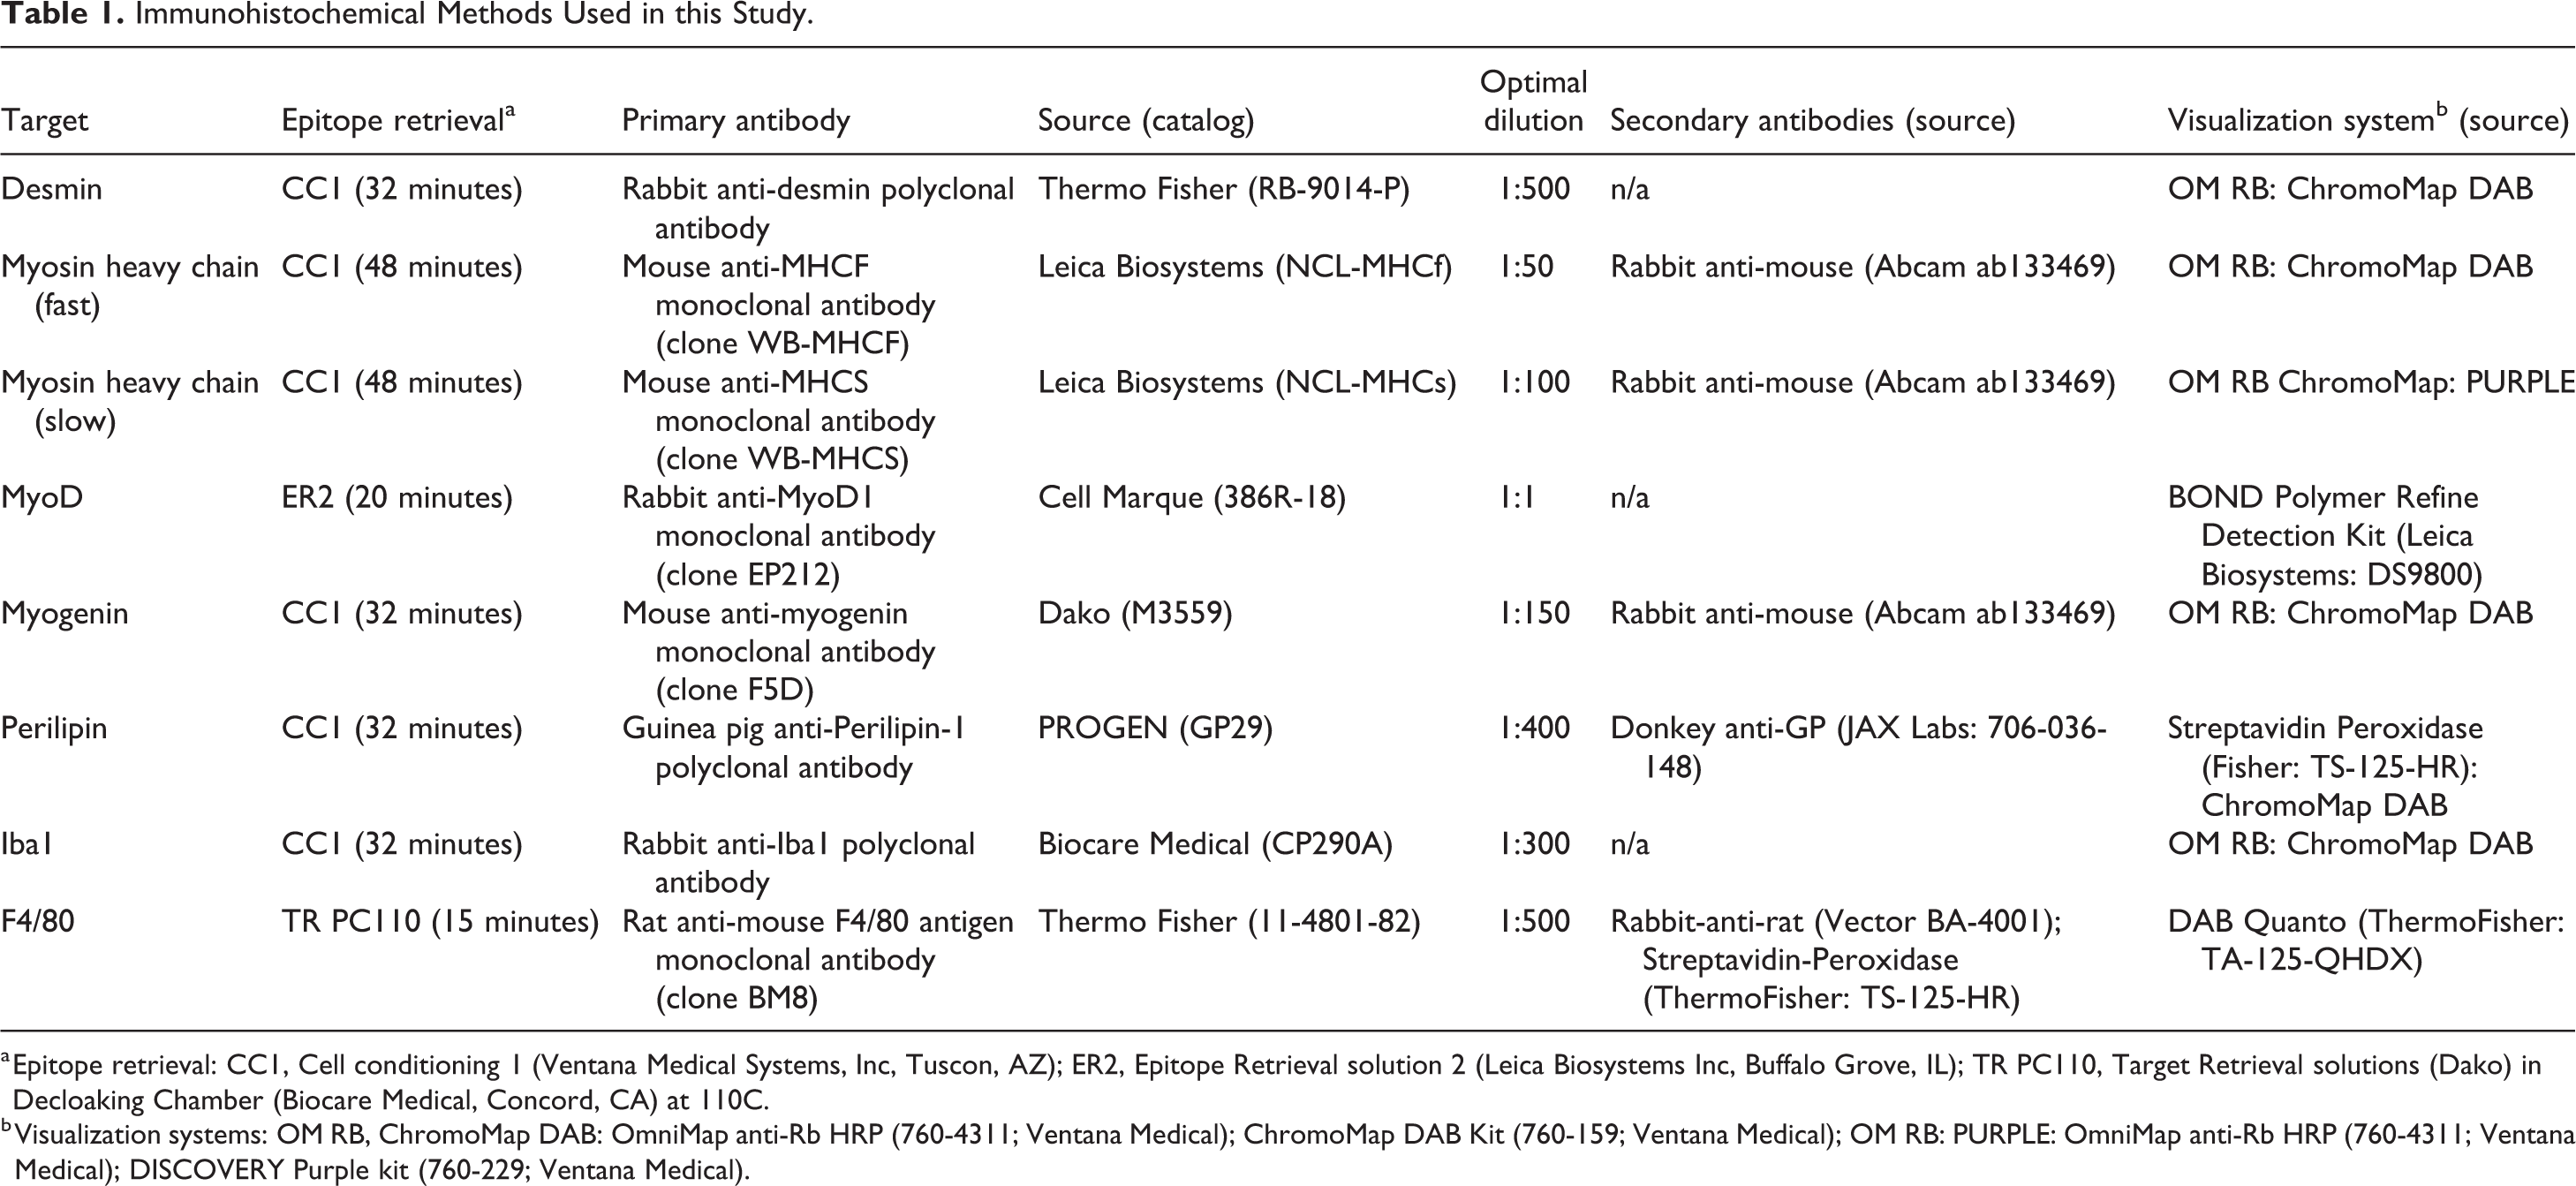
a Epitope retrieval: CC1, Cell conditioning 1 (Ventana Medical Systems, Inc, Tuscon, AZ); ER2, Epitope Retrieval solution 2 (Leica Biosystems Inc, Buffalo Grove, IL); TR PC110, Target Retrieval solutions (Dako) in Decloaking Chamber (Biocare Medical, Concord, CA) at 110C.
b Visualization systems: OM RB, ChromoMap DAB: OmniMap anti-Rb HRP (760-4311; Ventana Medical); ChromoMap DAB Kit (760-159; Ventana Medical); OM RB: PURPLE: OmniMap anti-Rb HRP (760-4311; Ventana Medical); DISCOVERY Purple kit (760-229; Ventana Medical).
Results
At weaning, the Asnsd1 allele appeared to be transmitted with a somewhat unbalanced Mendelian ratio (114 WT, 251 HET, 90 KO), which suggested reduced viability of Asnsd1−/− mice (P < 0.05). Although Asnsd1−/− mice appeared normal by casual inspection, profound handling-associated seizures were observed in many Asnsd1−/− mice between the ages of 3 and 12 months. However, no histologic lesions were detected in the brains of Asnsd1−/− mice.
Body Composition
In 2 independent primary phenotypic screens for body composition performed on 14-week-old mice fed chow diet from weaning and 11-week-old mice fed a high-fat-diet from weaning, Asnsd1−/− mice already showed an increased % body fat (Figs. 4, 5) and decreased lean body mass (data not shown). To confirm this finding, we studied additional cohorts of chow-fed mice and found that male and female Asnsd1−/− mice had essentially normal body weights, but significantly increased body fat, and significantly decreased lean body mass relative to WT littermate controls (Table 2).
Measures of Body Composition in ASNSD1-Deficient (KO) and WT Mice.
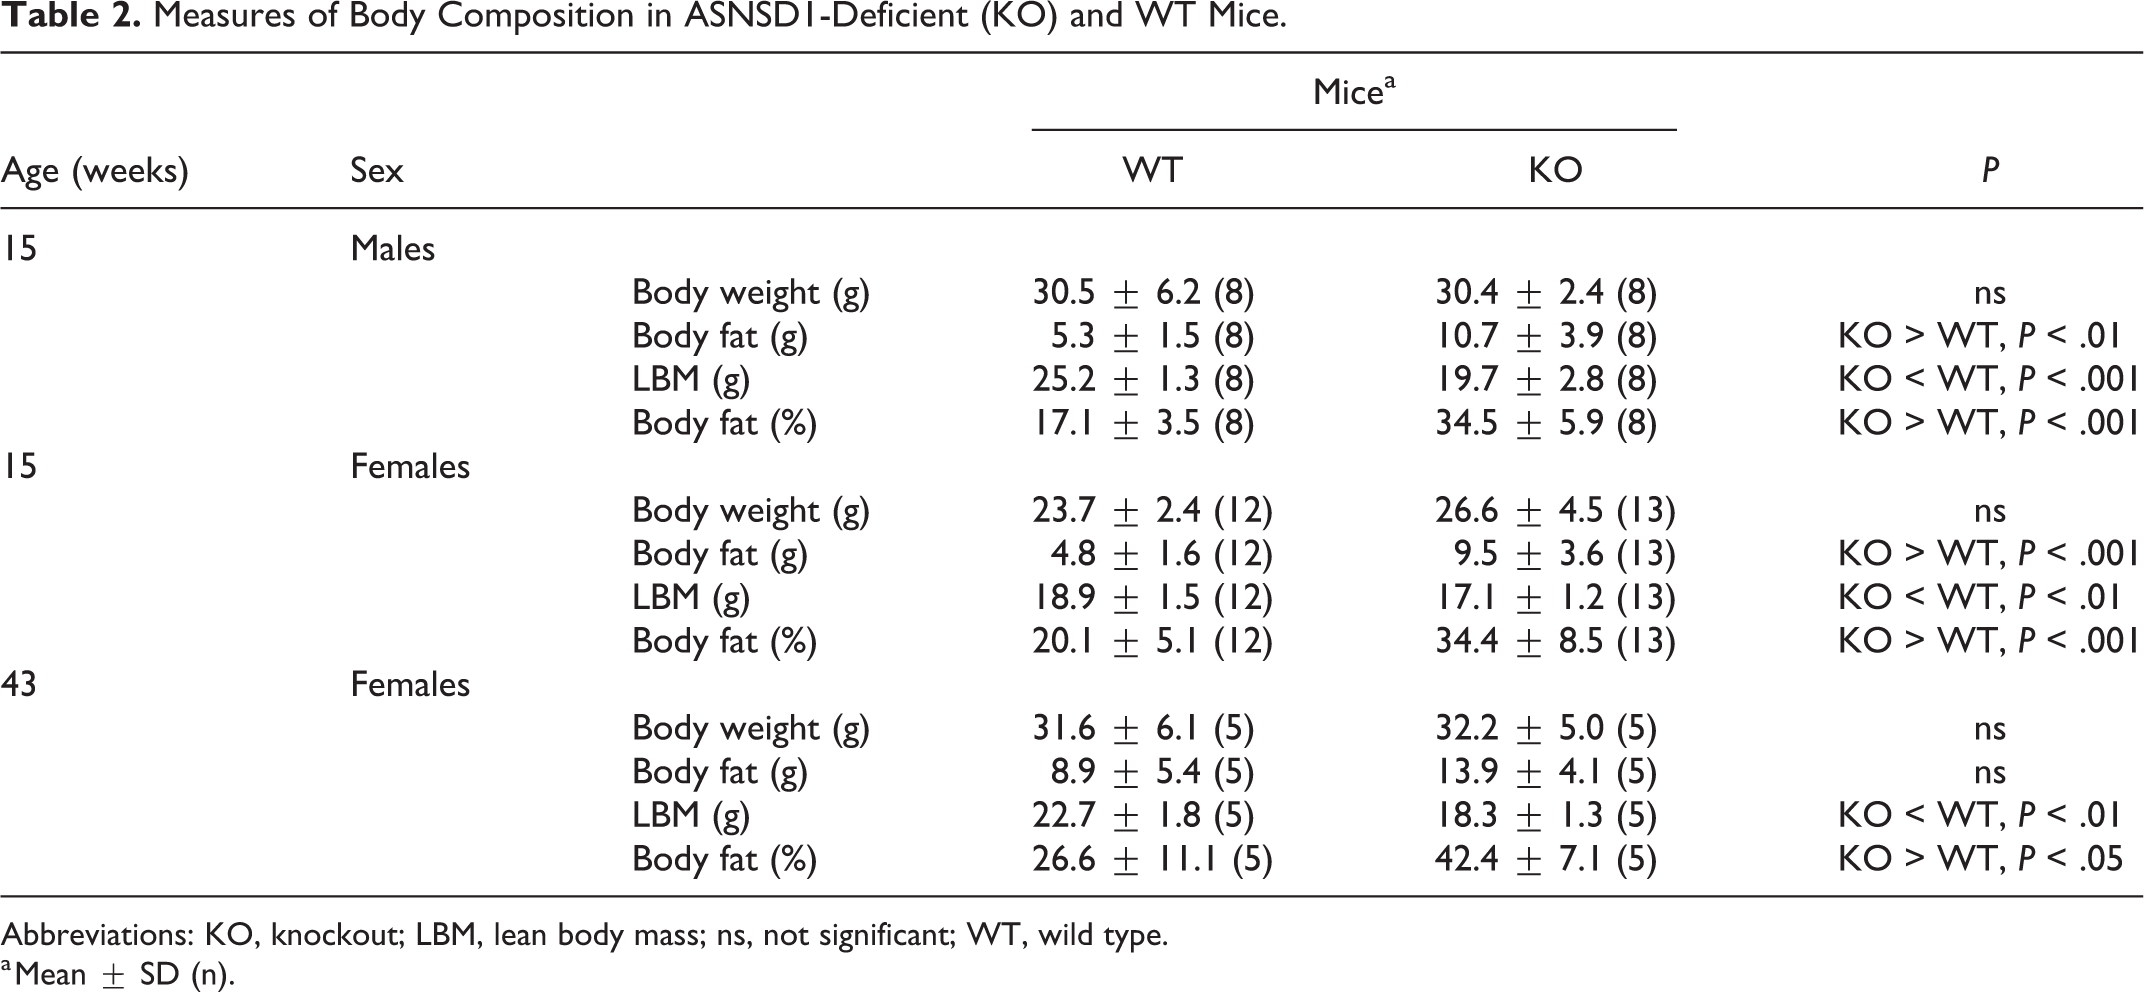
Abbreviations: KO, knockout; LBM, lean body mass; ns, not significant; WT, wild type.
a Mean ± SD (n).
Muscle Strength and Systolic Blood Pressure
The 2 independent cohorts of Asnsd1−/− mice performed more poorly than their WT littermates during the inverted screen assay at both 5 (Fig. 6) and 11 (Fig. 7) weeks of age; most of the Asnsd1−/− mice fell off the screen immediately, consistent with a muscle weakness phenotype. The grip strength of these same Asnsd1−/− mice was directly measured and found to be significantly decreased relative to that of their WT littermates at both 5 (Fig. 8) and 11 (Fig. 9) weeks of age. The systolic blood pressure of 12-week-old Asnsd1−/− mice was significantly decreased relative to WT littermates (KO mice = 101 ± 7 mm Hg, n = 16 [12 females, 4 males]); WT = 109 ± 6 mm Hg, n = 10 [8 females, 2 males]; P < .01).
Clinical Chemistries
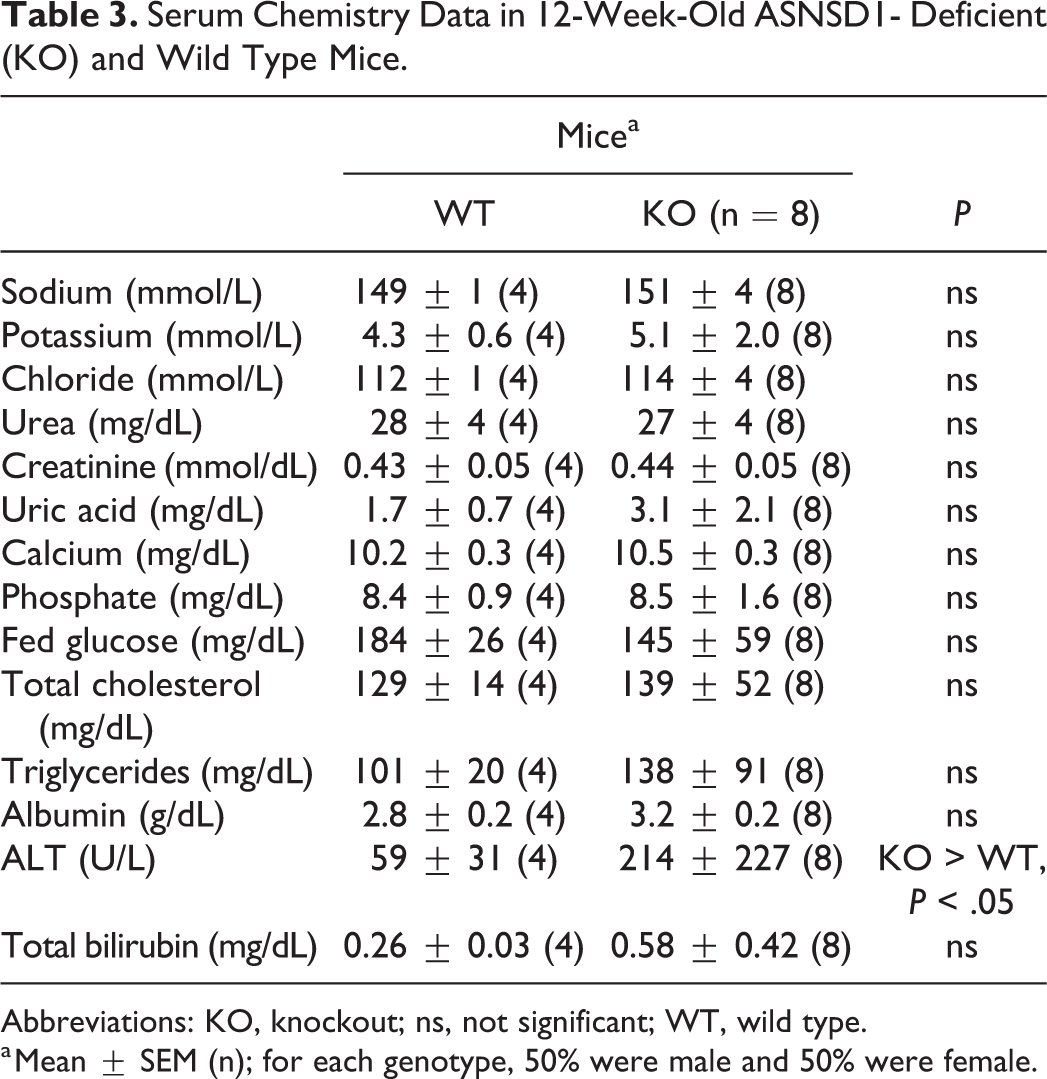
Asnsd1−/− and WT mice had similar fed serum chemistry levels at 12 weeks of age, including sodium, calcium, phosphate, glucose, and creatinine. The only exception was ALT, which was significantly higher in Asnsd1−/− mice (Table 3). Fasting serum glucose levels from 12-week-old male mice were also similar (Asnsd1−/− mice = 90 ± 25 mg/dL, n = 7; WT = 94 ± 20 mg/dL, n = 9; P > .05).
Serum Chemistry Data in 12-Week-Old ASNSD1- Deficient (KO) and Wild Type Mice.
Abbreviations: KO, knockout; ns, not significant; WT, wild type.
a Mean ± SEM (n); for each genotype, 50% were male and 50% were female.
Histopathology
Muscle in both male (n = 2) and female (n = 2) Asnsd1−/− mice and WT controls (n = 2) was evaluated histologically at 2 time points (14 and 37 weeks of age). At the earliest stages, most fibers appeared normal, but there were scattered individual and small groups of muscle fibers exhibiting features of degeneration such as internalized nuclei, hypereosinophilia (hyaline degeneration), and loss of cross-striations, progressing to necrosis with disrupted flocculated sarcoplasm and sometimes with intracellular macrophages. In cross-sections of many but not all muscle groups examined from 14-week-old mice, there were extensive mild degenerative changes, primarily consisting of diffuse internalization of myocyte nuclei (Fig. 10). At this early time point, there were also widely scattered individual hypereosinophilic degenerating fibers (Fig. 11a); these fibers showed extensive rearrangement and loss of normal banding patterns of both myosin (Fig. 11b) and desmin (Fig. 11c). Less severely affected atrophic fibers also showed disordered myofibril alignment and disrupted banding patterns. We found that atrophic fibers and myofibrillar disarray were best detected by immunohistochemical labeling for desmin. Similar patterns were observed in longitudinal sections, where scattered degenerating myocytes showed loss of striations and coagulation of sarcoplasm (Fig. 12a). Again, both heavy chain myosin and desmin were typically absent in necrotic myocytes (Fig. 12b and c), although hypertrophic satellite cells in affected myotubes were often desmin-positive (Fig. 12c). Immunohistochemical labeling for myosin heavy chains showed that myopathic lesions were restricted to type II (fast twitch) muscle fibers.
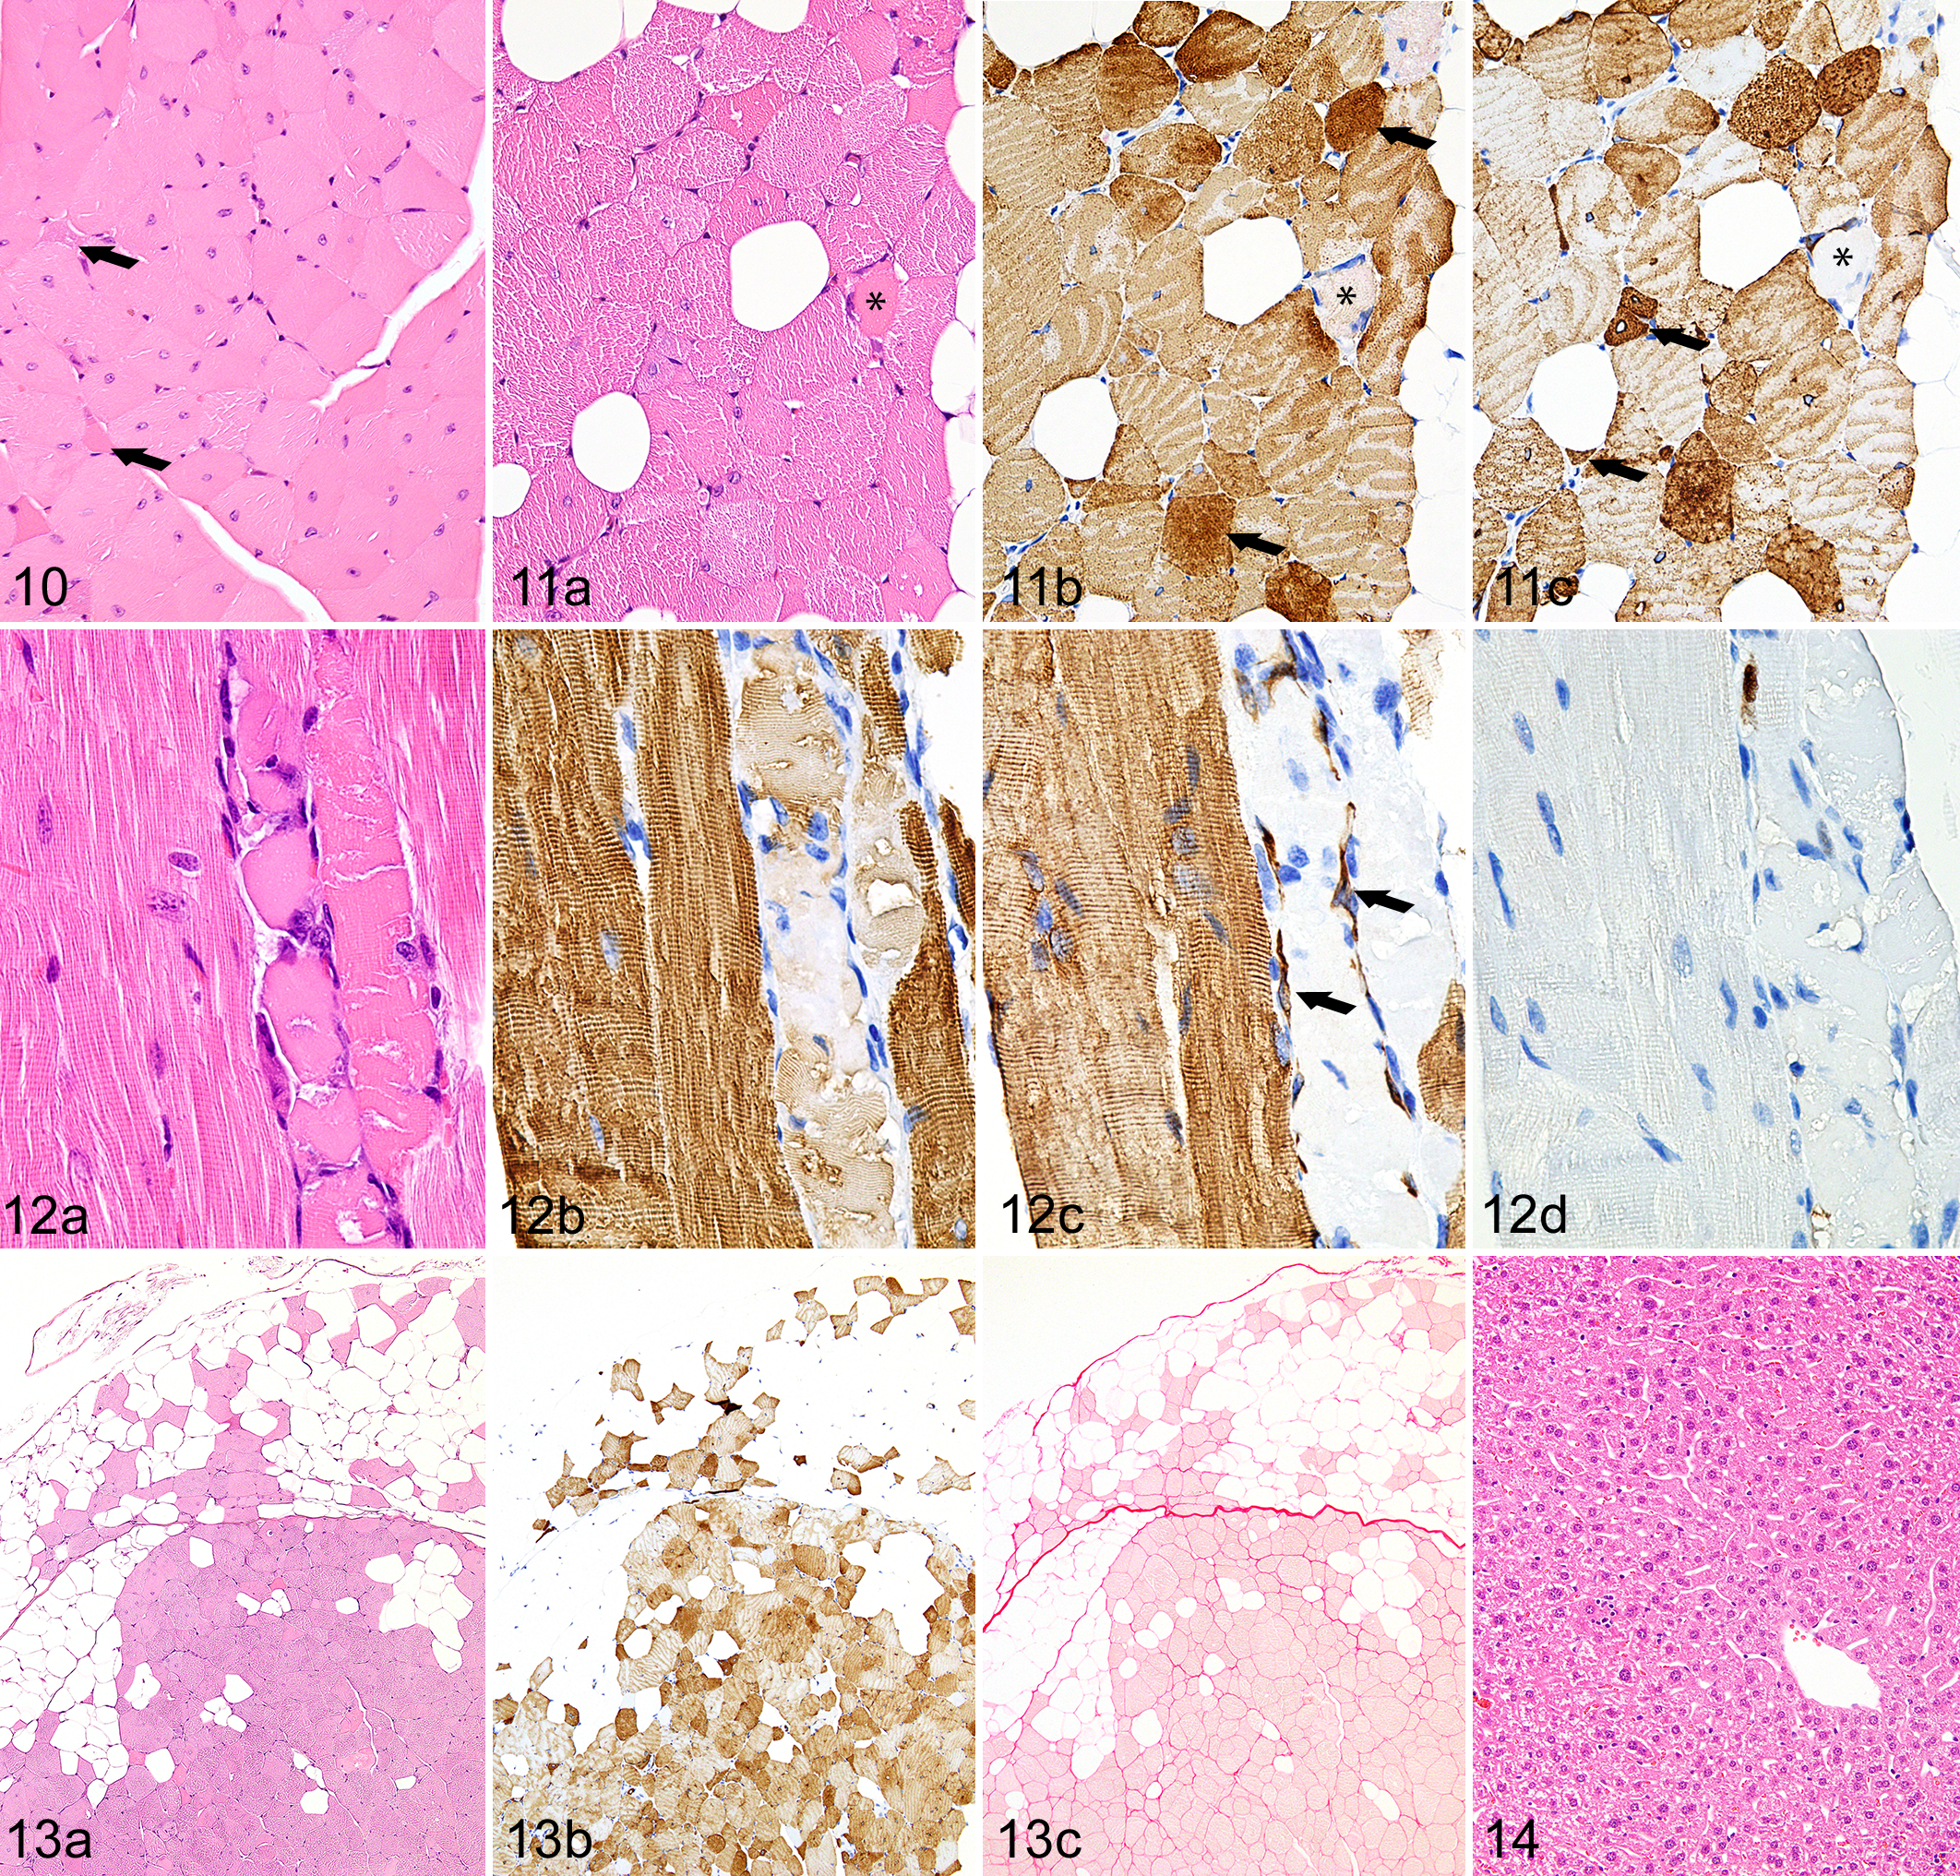
Although degenerative lesions were widespread in 14-week-old mice, there was very little evidence of muscle regeneration in somatic muscles, where only rare satellite cells stained for MyoD or myogenin (Fig. 12d). Histologic and immunohistochemical evidence of myogenic regeneration were more common in the diaphragm. The extent of myosteatosis was generally mild but varied among muscles (Fig. 13a). For example, in the thigh, there was marked replacement of myocytes by adipocytes in the vastus lateralis and tensor fascia latae muscles, whereas adipocytes were relatively uncommon in other proximal leg muscles. Immunolabeling for desmin demonstrated the full-extent loss of normal banding patterns and variable distribution of desmin in degenerating and atrophic fibers (Fig. 13b). Other than macrophage infiltrates within and adjacent to necrotic myocytes, inflammatory cell infiltrates were rarely present.
In 14-week-old mice, there was no evidence of increased endomysial/perimyseal fibrosis or macrophages in affected muscles (Fig. 13c). Notably, there was no histological evidence of steatosis or lipotoxicity in the liver or heart (Fig. 14).
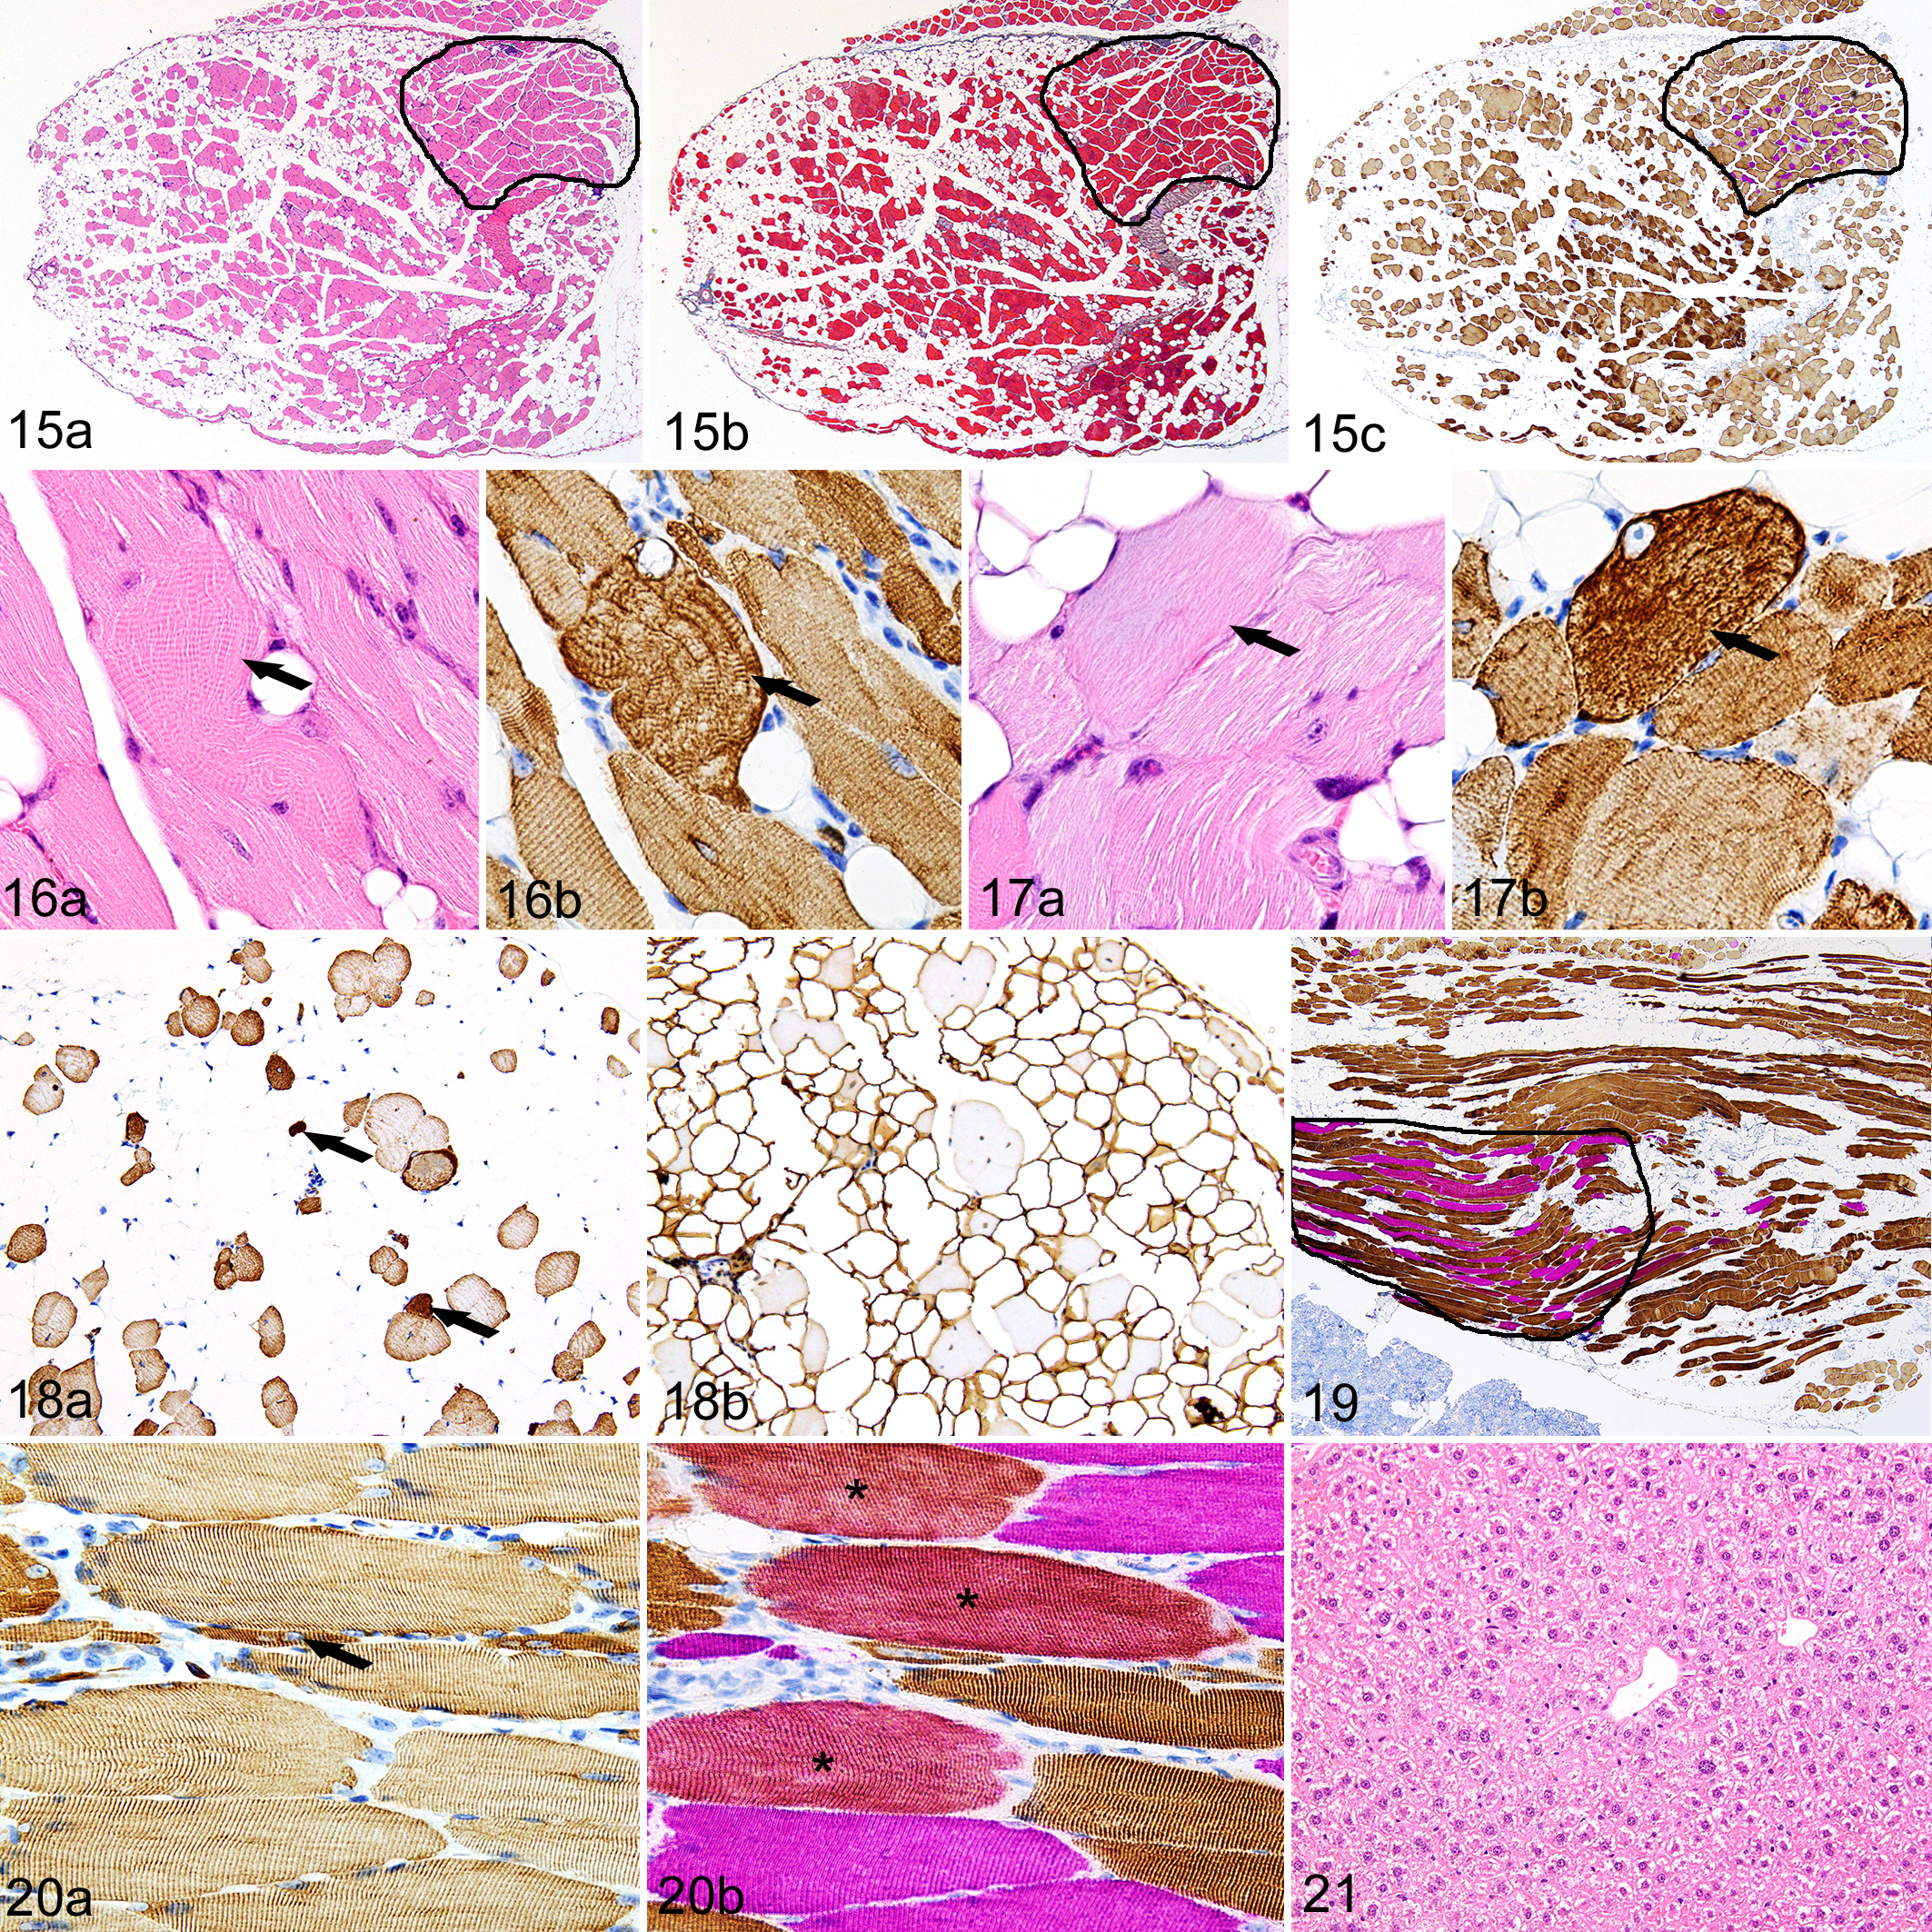
In the 37-week-old mice, the severity and extent of sarcopenia with intramuscular and interstitial steatosis was markedly increased (Fig. 15a) but fibrosis was still minimal (Fig. 15b). Interestingly, myosteatosis was most severe in type II fiber-dominant muscles, whereas mixed fiber type muscles were largely spared (Fig. 15c). Myofibrillar disarray was a common feature in otherwise normal myocytes (Fig. 16a and b), while pallor of fibers in HE-stained sections (Fig. 17a) was associated with disrupted desmin in many other myocytes (Fig. 17b). In severely affected muscles, scattered clusters of rounded atrophic fibers with centralized nuclei and degenerating myocytes (Fig. 18a) were surrounded by abundant well-differentiated mature white adipocytes (Fig. 18b). The extent of adipose replacement varied between muscles, with large groups of muscle fibers remaining in some muscle fascicles but being virtually absent in others. In these aged 37-week-old mice, morphological signs of skeletal muscle regeneration, such as small-diameter regenerating fibers with rows of centralized MyoD/Myogenin-positive nuclei, were detected only in the diaphragm. Mild cellular inflammatory infiltrates were limited to the interior of degenerating and necrotic fibers and consisted almost entirely of macrophages. The extent and severity of adipose tissue replacement and myodegeneration were markedly more severe in type II fiber-dominant muscles. In contrast, these lesions were mild to absent in the mixed fiber type muscles such as the vastus intermedius and soleus muscles (Fig. 19). Interestingly, IHC labeling showed that the distribution of desmin was essentially normal in these muscles (Fig. 20a) but some of the type II fibers normally present in these mixed fiber muscles appeared to have converted into hybrid (mixed fast and slow myosin) muscle fibers (Fig. 20b). Again, even with the increased extent and severity of myosteatosis in the older (37-week-old) Asnsd1−/− mice, there was no histological evidence of lipotoxity in the liver, heart, or any other tissue (Fig. 21).
Discussion
The degenerative myopathy with extensive replacement of myocytes by adipocytes in Asnsd1−/− mice is similar to conditions known as muscular steatosis or lipomatous myopathy, which have been reported as sporadic findings in cattle, pigs, sheep, horses and dogs. 6,39,40 For example, in the lipomatous myopathy affecting Piedmontese cattle, the degenerative myopathy is characterized by variations in fiber size, internalized nuclei, fiber necrosis, macrophage invasion, and finally the replacement of degenerating muscle cells by adipocytes. 6,41 In certain other breeds of cattle, extensive replacement of muscle by well-differentiated mature white adipocytes, small numbers of degenerating, necrotic, or atrophic myocytes, little evidence of regenerating myocytes, and minimal proliferation or thickening of the perimysial connective tissue have been reported. 39,40 At a cellular level, these findings essentially mirror what occurs in Asnsd1−/− mice. However, unlike our mice, only a few muscle groups are affected in cattle, and they also typically developed marked hepatic steatosis. 39,40
The cause of the moderately reduced viability of Asnsd1−/− mice at weaning was not determined, but it may be related to seizures, which were observed in approximately half of Asnsd1−/− mice from 3 to 12 months of age and were associated with handling. Evaluation of brain and spinal cord sections and blood chemistry data failed to identify an obvious cause for the seizures. The only abnormal clinical pathology finding was the mildly elevated alanine aminotransferase (ALT) in Asnsd1−/− mice, which was most likely attributable to muscle damage since both liver histology and total bilirubin appeared normal. The systolic blood pressure was significantly lower in Asnsd1−/− mice, suggesting that the myopathy might also affect cardiomyocyte function, although no notable lesions were detected in the heart. Muscle weakness was a consistent early finding in Asnsd1−/− mice, with almost all falling off quickly during the inverted screen assay. The reduced muscle strength was confirmed by directly measuring grip strength, which was significantly decreased in the Asnsd1−/− mice. The muscle weakness phenotype of the Asnsd1−/− mice is entirely consistent with the histopathologic findings of diffuse myopathy/myosteatosis. Moreover, the Asnsd1−/− mice showed increased body fat and decreased lean body mass at the earliest time points evaluated (11 weeks), both findings being consistent with the presence of sarcopenia/myosteatosis. The absence of any histological evidence of lipotoxicity in the liver and other organs of these mice was surprising given the high body fat percentages and severe sarcopenia/myosteatosis observed in Asnsd1−/− mice, and this unexpected finding certainly merits additional investigation.
Increased adiposity and decreased lean body mass are common findings in humans with various muscular dystrophies. 13 In fact, fat infiltration into muscle is recognized as a hallmark pathological feature in several forms of muscular dystrophy in humans, 35 most notably in the dystrophinopathies 57 and sarcoglycanopathies. 33 The increase in body fat percentage and decrease in lean body mass percentage observed in Asnsd1−/− mice are similar to changes reported in humans with Duchenne muscular dystrophy (DMD). 37 However, DMD is characterized by early regenerative responses that gradually decline as the disease progresses, so that initial myofiber repair is superseded by the formation of fibrotic scars and fat infiltration. 52 Similarly, the increased body fat percentage observed in children with DMD is due mainly to fat deposition in muscles as connective tissue and adipocytes replace necrotic muscle fibers. 31 The resulting replacement of muscle by fatty and fibrous tissue leaves muscles increasingly weak and nonfunctional. 66
The ASNSD1-associated degenerative myopathy in mice is very mild compared to DMD but interspecies differences in progression of myopathy are not unprecedented. For example, dystrophin-deficient BL10-mdx mice show a much milder disease phenotype in comparison to humans, and this discordance has been attributed to differences in size and muscle loading as well as differences in species-dependent regenerative capacities. 22 However, it has also been recognized that genetic background may play a more critical role, because D2.B10-Dmdmdx /J (D2-mdx) display a more severe dystrophic phenotype than BL10-mdx mice. Thus, disease in D2-mdx mice, characterized by impaired regeneration, decreased muscle weight, and elevated levels of fibrotic tissue in skeletal muscles, appears to more closely model the human disease. 19,61 The morphology of skeletal muscle lesions in Asnsd1−/− mice differs in important respects from that seen dystrophin-deficient BL10-mdx mice in that the absence of ASNSD1 results in a progressive degenerative myopathy that is predominantly characterized by the extensive replacement of myocytes by mature adipocytes. This myopathy is associated with minimal myocyte regeneration or interstitial inflammation, and when present, fibrosis is minimal and essentially limited to the endomysium whereas the epimysium and perimysium are generally of normal thickness. As a result, the severely steatotic muscles outwardly retain their normal size and contours. Another notable feature of myopathy in Asnsd1−/− mice is the sparing of type I fiber-dominant muscles. In these muscles, the proximity of type I fibers appears to protect the otherwise susceptible type II fibers and may promote their conversion into hybrid fiber–type myocytes. This finding, when taken together with the absence of lipotoxicity in the liver (no steatosis and inflammation) or heart (no myocardial lipidosis), further supports a role for ASNSD1 in skeletal muscle and liver metabolism.
The apparent propensity of damaged muscle in Asnsd1−/− mice to transdifferentiate into adipose tissue is also unusual but the cellular origins and underlying mechanisms responsible for the progressive myosteatosis that develops in many myopathies are still not fully understood. 26 Satellite cells have a clearly established role in muscle regeneration, 30 and they apparently contribute to the infiltration/development of intramuscular adipose tissue in mice 2,65 and humans as well. 64 Normally, skeletal muscle regeneration is mediated by satellite cells that are located between the sarcolemma and basal lamina of myocytes. Following muscle injury, satellite cells typically differentiate into myoblasts that then proliferate and migrate to repair damaged or degenerating myocytes. 17 These activated satellite cells proliferate and express several myogenic transcription factors known as myogenic regulatory factors (MRFs). These include myogenic factor (Myf) 5, 28 myogenic differentiation 1 (MyoD), 51,70 and myogenin (MyoG). 11,70
However, activated satellite cells and newly differentiated myoblasts are also able to transdifferentiate into nonmyogenic cells such as adipocytes. Adipocyte infiltration and replacement of skeletal muscle during degeneration/regeneration processes is believed to involve the activation of adipogenesis-competent cells within skeletal muscle during muscle regeneration. 73 Satellite cells, which are the skeletal muscle stem cells, 74 have been shown to transdifferentiate into adipocytes both in vitro and in vivo, 2,8,65 although some studies also implicate fibroblasts as a source of transdifferentiated adipocytes. 1,58 These cells, also known as mesenchymal fibro-adipogenic progenitor cells, are located in the epi- and endomysium of skeletal muscle and readily differentiate into adipocytes following muscle injury. 1,15,46,54,59
Skeletal muscle degeneration and regeneration increase the adipogenic potential of the satellite cells, 73 and this adipogenic potential appears to increase even more with age. 56 Wnt signaling plays a critical role in activating myogenic differentiation, while inhibiting adipogenic differentiation. 16 In mice, differentiation of satellite cells into adipocytes is at least partially mediated by Wnt proteins, with Wnt10b signaling promoting myogenic differentiation whereas myoblasts lacking Wnt10b show increased adipocyte differentiation. 63 Wnt10b has also been implicated in adipogenesis and muscle-to-fat conversion resulting in obesity and reduced muscle insulin sensitivity in obese Zucker rats. 50 Normal fed and fasting blood glucose levels in Asnsd1−/− mice suggest the absence of lipotoxicity-mediated insulin resistance even in the face of extensive myosteatosis in these mice. Differentiation of myoblasts from satellite cells is regulated by the myogenic basic helix-loop-helix (bHLH) transcription factor family, which includes MyoD, Myf5, myogenin, and MRF4. 3 Of these, MyoD and Myf5 appear to be the most important in lineage determination because satellite cells transdifferentiate into adipocytes or fibrocytes in their absence. 12,67,72 Loss of MyoD promotes transdifferentiation of myoblasts into adipocytes 67 whereas forced expression of MyoD in adipocyte precursors inhibits adipogenesis and promotes myogenesis. 27,69 Understanding the processes of satellite cell differentiation is important because the accumulation of intramuscular fat and increased insulin resistance are associated with age-related sarcopenia. 48,71
We found that fast-twitch (type II) fibers in Asnsd1−/− mice are more susceptible to degeneration and transdifferentiation into adipose tissue than slow-twitch (type I) fibers. In addition, we observed a marked increase in the number of hybrid fibers in mixed fiber muscles (vastus intermedius and soleus), suggesting that type I fibers somehow protect adjacent type II fibers by influencing their conversion into hybrid fibers. The underlying mechanisms responsible for selective fiber type atrophy and damage are not presently understood but it seems likely that the variable susceptibility is influenced by whichever metabolic pathway the muscle fiber utilizes as an energy source. Type I or slow-twitch fibers use aerobic respiration to produce ATP whereas type II or fast-twitch fibers primarily use anaerobic glycolysis. Type I fibers contain many more mitochondria than the glycolytic type II fibers and are capable of contracting for longer periods because of the large amount of ATP they can produce. In contrast, type II fibers contain high amounts of glycogen and fewer mitochondria because they utilize anaerobic glycolysis as their ATP source. In mice, most muscles are predominantly type II although postural muscles contain a mixture of each fiber type.
Differences in fiber type susceptibility to myodegeneration and the development of hybrid fibers are not unprecedented, as they have been reported in other conditions in both mice and humans. 14,32 In humans, the age-related reduction in muscle fiber numbers and diameters preferentially affects type II fibers. 7,29 It is thought that myosteatosis may be involved in the transition of type II to type I muscle fibers in obesity-associated diabetes, a change characterized by muscle fiber atrophy and fast-to-slow fiber transition. 34
Another surprising finding in these sarcopenic Asnsd1−/− mice was the absence of hepatosteatosis. In humans and other mouse models, increased amounts of intramuscular adipose tissue are typically associated with impaired glucose metabolism and contribute to the onset of type 2 diabetes. 18,21,25 In humans, both aging sarcopenia 24 and muscular dystrophy are associated with reduced skeletal muscle mass and increased adipose tissue. 36 Similarly, the severity of muscle atrophy correlates with the accumulation of adipose tissue within skeletal muscle in obese mouse models. 79 Generally, sarcopenia aggravates obesity by increasing visceral adiposity, which subsequently leads to dyslipidemia, insulin resistance, and lipotoxicity in nonadipose tissues. 20 Skeletal muscle plays a key role in regulating blood glucose levels and insulin sensitivity. In fact, the glucose intolerance observed in Mdx mice is attributed to the progressive loss of skeletal muscle mass over time. 53 White adipose tissue normally acts as a storage depot for free fatty acids, but when the storage capacity for free fatty acids is decreased due to either overload (obesity) or deficiency (lipodystrophy) of white adipose tissue, the typical result is hepatosteatosis, myosteatosis, lipotoxicity, and insulin resistance. 49
Further studies on these Asnsd1−/− mice may provide a more complete understanding of the interactions between muscle and adipose tissue and lead to the identification of mediators that direct differentiation of satellite cells toward the formation of adipocytes at the expense of myocytes. In addition, Asnsd1−/− mice may provide a more complete understanding of the biological pathways involved in the development of sarcopenia and myosteatosis. The identification of appropriate mouse models of sarcopenia/myosteatosis is important because they may lead to development of treatments that could block the development of these lesions in humans, thereby slowing or even stopping the progression of age-related frailty. 47
Footnotes
Acknowledgements
The authors wish to thank Kristi Boehm, MS, ELS, Lexicon Pharmaceuticals, for her help in preparing the figures; Ryan Vance for necropsy and histology support; and Meifen Lu and Pam Johnson for immunohistochemical staining.
Declaration of Conflicting Interests
The author(s) declared no potential conflicts of interest with respect to the research, authorship, and/or publication of this article.
Funding
The authors received no external financial support for the research, authorship, and/or publication of this article.