
Abstract
Thyroid cancer is the most common endocrine malignancy in dogs. Dogs and humans are similar in the spontaneous development of thyroid cancer and metastasis to lungs; however, thyroid cancer has a higher incidence of metastasis in dogs. This study developed a preclinical nude mouse model of canine thyroid cancer using a canine thyroid adenocarcinoma cell line (CTAC) and measured the expression of important invasion and metastasis genes in spontaneous canine thyroid carcinomas and CTAC cells. CTAC cells were examined by electron microscopy. Short tandem repeat analysis was performed for both the original neoplasm and CTAC cells. CTAC cells were transduced with luciferase and injected subcutaneously and into the tail vein. Tumors and metastases were monitored using bioluminescent imaging and confirmed with gross necropsy and histopathology. Invasion and metastasis genes were characterized in 8 follicular thyroid carcinomas (FTCs), 4 C-cell thyroid carcinomas, 3 normal thyroids, and CTAC cells. CTAC cells grew well as xenografts in the subcutis, and they resembled the primary neoplasm. Metastasis to the kidney and lung occurred infrequently following subcutaneous and tail vein injection of CTAC cells. STR analysis confirmed that CTAC cells were derived from the original neoplasm and were of canine origin. Finally, 24 genes were differentially expressed in spontaneous canine thyroid carcinomas, CTAC, and normal thyroids. This study demonstrated the usefulness of a nude mouse model of experimental canine thyroid carcinoma and identified potential molecular targets of canine follicular and C-cell thyroid carcinoma.
Canine thyroid cancer is the most common endocrine neoplasm, 4 and accounts for 1% to 4% of all neoplasms in dogs. 29 Canine thyroid neoplasms are classified as adenomas or carcinomas, 58 and carcinomas are distinguishable from adenomas by capsular and/or vascular invasion. 32 In dogs, most thyroid neoplasms (60%–90%) are carcinomas. 58 Most thyroid carcinomas are unilateral and nonfunctional, and most dogs are clinically euthyroid. 39 The risk of thyroid cancer increases in older dogs with a mean age of 9–10 years at the time of diagnosis. 14,32,36,48,70 The prognosis and therapeutic approaches for canine thyroid carcinomas depend on tumor size, invasion, and metastasis. 4
Canine thyroid carcinoma can be derived from either follicular or C-cells, giving rise to follicular thyroid carcinoma (FTC) or C-cell (medullary) thyroid carcinoma (CCTC), respectively. 11,14 Histologically, FTC is classified as follicular, compact (solid), papillary, undifferentiated, and mixed. 58 Follicular carcinoma is the most common thyroid cancer in dogs, while papillary carcinoma is the most common form in humans. 36,58 Follicular thyroid carcinoma in dogs exhibits positive immunolabeling for thyroglobulin, 37,45 Pax8, and thyroid transcription factor (TTF-1 or NKX2). 49,52
C-cell thyroid carcinoma accounts for less than 5% of thyroid neoplasms in dogs, has a compact cellular pattern, and may be difficult to distinguish from follicular tumors without immunohistochemistry (IHC). 37,45,48,58 C-cell thyroid carcinoma exhibits strong immunoreactivity to calcitonin, calcitonin gene-related peptide (CGRP), 37,48,58 and napsin A. 52 Human CCTCs express high levels of the calcium-sensing receptor (CaSR) 22 and have mutations in the RET gene, 12 and the protein product is a therapeutic target for CCTC. 59
Human thyroid nodules are 4 times more common in women compared with men, and the risk of thyroid cancer increases in older women. In contrast, no sex predisposition has been identified in dogs. 14,36,58,70 Breed-associated risk of canine thyroid cancer remains controversial. Various studies have shown that Boxers, Beagles, Golden Retrievers, 29,36 Shetland Collies, Old English Sheepdogs, Cairn Terriers, 65 and mixed-breed dogs 34 have an increased risk, while no breed predilection was found in another study. 14
Metastasis is common in canine thyroid carcinoma, and about one-third of dogs have metastasis at the time of initial diagnosis. 11,14,29,32,39,65 Canine thyroid carcinoma commonly metastasizes to the lung and regional lymph nodes, 36,57 and occasionally to other organs, such as the adrenal glands, brain, kidneys, heart, liver, and bone. 44 CCTC may have a lower metastatic rate compared with FTC. 14 Metastasis increases in likelihood as primary carcinoma increases in size. Thyroid cancer invasion into surrounding tissues and distant metastases is the most common cause of thyroid cancer-related death in humans. 16 Clinically, canine thyroid carcinomas are either freely mobile or locally invasive. Approximately 25% to 55% of thyroid carcinomas are mobile and can be controlled by surgical resection, with median survival times of 36 months in dogs after surgery. However, 45% of all canine thyroid carcinomas are locally invasive, and surgical resection of these tumors is not possible because of their high vascularity and the involvement of important adjacent structures. 14,34,47 Alternative therapeutic modalities for locally invasive canine thyroid carcinomas have been reported, and these include chemotherapy, radioiodine, and radiation therapy. 1,9,50
There are important similarities between the development of metastatic thyroid cancer in dogs and humans. Both dogs and humans develop thyroid cancer with progressive disease and lung metastases. However, dogs have a higher incidence of metastatic disease compared with humans, because most thyroid cancers in humans are the papillary subtype that have a favorable prognosis and low incidence of metastasis. 26 Therefore, investigations on thyroid cancer in dogs are needed because of its high metastatic rate, but these studies also have the potential to benefit humans with aggressive thyroid carcinomas. It is likely that clinical trials for new therapeutic approaches can inform medical therapy for both species. The first aim of our study was to develop a preclinical nude mouse model of canine thyroid cancer. The second aim was to characterize the molecular features of spontaneous canine thyroid cancer by measuring the expression of invasion and metastasis genes in spontaneous canine thyroid carcinoma samples and the canine thyroid adenocarcinoma cell line (CTAC) compared with normal thyroid gland. CTAC is the only known canine thyroid cancer cell line. 31
Materials and Methods
Canine Thyroid Tissues
Fresh-frozen samples from 15 canine thyroids and tumors, including 3 normal canine thyroids (designated as CBF CGM, CBL CGK, and CAL CML), 8 FTCs (SW, TC, LP, KK, LA, EM, AJ, and MH), and 4 CCTCs (IS, BM, MC, and SB), were obtained from research dogs and The Ohio State University (OSU) College of Veterinary Medicine Biospecimen Repository. Tissue samples were derived from dogs of different breeds with case descriptions as follows.
Three histologically normal thyroid glands were selected from research Beagle dogs (CBF CGM, CBL CGK, and CAL CML), and their ages were 4 years, 3 years 4 months, and 5 years, respectively. The dogs were euthanized for reasons unrelated to thyroid pathology.
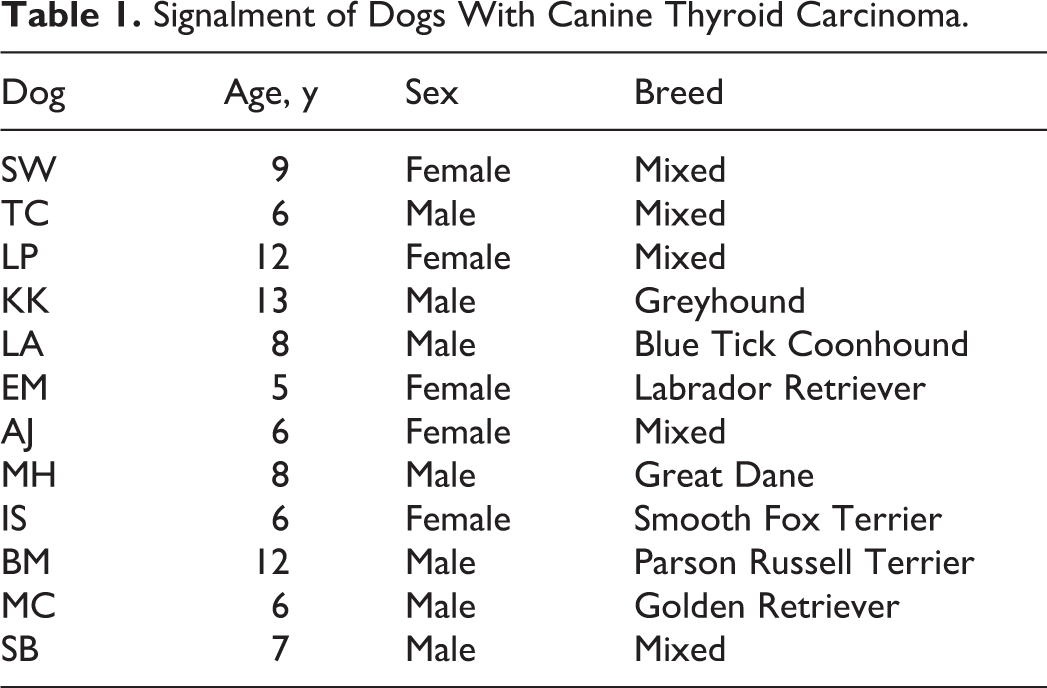
Twelve dogs with thyroid carcinomas were presented to the OSU Veterinary Medical Center oncology service for evaluation and/or removal of thyroid carcinoma (Table 1).
Signalment of Dogs With Canine Thyroid Carcinoma.
Immunohistochemistry
Immunohistochemistry for calcitonin was performed on all 4 CCTCs, and they were positive for calcitonin. After dewaxing and rehydration, antigen retrieval was performed by immersion of slides in target retrieval solution (pH 6), distilled water was added in a decloaking chamber, and slides were heated to 125°C. Slides were allowed to cool for 10 minutes. Endogenous peroxidase was blocked with 3% hydrogen peroxide for 15 minutes, followed by rinsing with water and washing buffer. Sections were incubated with the primary antibody (rabbit anti-human calcitonin; Dako #A0579, 1:4000 dilution) with background reducing agents for 30 minutes. Negative (omission of primary antibody) and positive (canine thyroid tissue) controls were conducted by The Comparative Pathology Shared Resource in the Department of Veterinary Biosciences, OSU. Incubation with biotinylated goat anti-rabbit diluted 1:1000 was performed at room temperature for 30 minutes. After each incubation step, sections were rinsed with washing buffer. Incubation with chromogen (DAB) was for 5 minutes. The sections were then counterstained with hematoxylin, rinsed in tap water, dehydrated, and mounted with cover slips.
CTAC Cell Line
CTAC cell line (Supplemental Fig. S1) was established by Louis Kasza (Department of Veterinary Pathology, OSU, Columbus, Ohio). 31 CTAC cells originated from a 7-year-old female boxer with thyroid adenocarcinoma of the undifferentiated small-cell type. Histologically, the original cancer was a compact FTC and was positive for thyroglobulin (the slides were incubated with rabbit anti-human primary antibody; Dako #A0251; 1:14 000 dilution for 30 minutes) and negative for calcitonin by IHC (see above). The thyroglobulin IHC procedure was performed similarly as the calcitonin IHC by the Comparative Pathology Shared Resource, Department of Veterinary Biosciences, OSU. Cells were cultured in DMEM (Life Technologies, Grand Island, NY) supplemented with 10% fetal bovine serum (FBS; Life Technologies), 2 mM L-glutamine, and 1X penicillin/streptomycin (Life Technologies). Cells were maintained in a humidified incubator at 37°C and 5% CO2. Cells were verified to be mycoplasma-free using a mycoplasma detection kit (InvivoGen, San Diego, CA). CTAC cells were harvested at 70% to 80% confluence using 0.25% trypsin (Life Technologies) and injected into the subcutis or tail vein (TV) of nude mice (see below). Viable cells (95%–100%) were counted using a Cellometer Auto T4 cell counter (Nexcelom Bioscience, Lawrence, MA), resuspended in sterile Dulbecco’s phosphate-buffered saline (PBS; Life Technologies) and kept on ice until injection. Paraffin-embedded tissue of the original carcinoma and frozen CTAC pellet were authenticated by short tandem repeat (STR) profiling (IDEXX BioAnalytics, Columbia, MO).
Lentiviral Luciferase Transduction
CTAC cells were grown in 6-well tissue culture plates with DMEM, 10% FBS, 2 mM L-glutamine, and 1X penicillin/streptomycin (Life Technologies). When the cells were 85% confluent, the medium was removed and each well was treated with 100 μL of luciferase-containing virus (VSV-G pseudo-typed), 1.9 ml of culture medium, and 1.6 μL of polybrene stock (8 μg/ml; Sigma-Aldrich Co, St. Louis, MO). YFP-Luc lentiviral particles were produced by transient triple transfection of 293 T cells with 10 μg packaging plasmid pCMV▵R8.2, 2 μg of envelope plasmid pMD.G, and 10 μg transfer plasmid pHIVSIN-Luc/YFP using calcium phosphate, as previously described. 66 Following centrifugation at 2700 rpm for 1 hour at 30°C, the plate was placed in a cell culture incubator at 37°C and 5% CO2 for 24 hours, after which the virus-containing medium was aspirated and replaced with fresh culture medium without virus. After 48 hours, the cells were detached with 0.25% trypsin and grown in 25 cm2 flasks. Luciferase transduced cells were confirmed by in vitro bioluminescence.
Subcutaneous and TV Injection of CTAC-Luc Cells in Nude Mice
All animal experimental procedures were approved by the OSU Institutional Laboratory Animal Care and Use Committee and were carried out in accordance with all applicable institutional, local, and national guidelines. All animal work was done in the animal research facility at the College of Veterinary Medicine, OSU. Mice were housed in cages and were provided food pellets and water ad libitum. On injection day, CTAC-Luc cells were counted using a Cellometer Auto T4 cell counter (Nexcelom Bioscience). Viable cells (95%–100%) were counted, and cell size measured by the Cellometer was recorded. Then, cells were resuspended in sterile Dulbecco’s PBS (Life Technologies) and kept on ice until injection. Mice were selected randomly for the subcutaneous and TV injections. The injected cell numbers and animal group numbers were based on previous experience by the authors with these models.
Subcutaneous
Athymic male nude mice (6 weeks old, 30 g; NCr-nu/nu) were purchased from The Ohio State University Comprehensive Cancer Center (OSUCCC) Target Validation Shared Resource (TVSR). Nude mice (n = 4) were subcutaneously injected with CTAC-Luc cells. A suspension of 3 × 10⁶ CTAC-Luc cells in 0.3 ml of PBS was injected subcutaneously between the shoulders or into the flank using a 25-gauge needle. Tumor volume was measured weekly in 3 dimensions using an electronic caliper and calculated using the formula length × width × height × 1/2. Body weight was measured weekly.
Tail vein
Athymic male nude mice (6 weeks old; 30 g; NCr-nu/nu) were purchased from OSUCCC TVSR. Nude mice (n = 7) were injected into the lateral TV with CTAC-Luc cells. A suspension of 5 × 10⁵ CTAC-Luc cells in 0.1 ml of PBS was injected into the lateral TV using a 28½-gauge needle. Tumor metastasis was monitored weekly using bioluminescent imaging for 8–10 weeks. Body weight was measured weekly.
Bioluminescent Imaging
Mice were anesthetized in an induction chamber with a 3% isoflurane/oxygen mixture and maintained at 2% isoflurane using a nose-cone delivery system during imaging. Sterile PBS (0.15 ml) containing 4.5 mg D-Luciferin (Caliper Life Sciences, Hopkinton, MA) was injected into the peritoneal cavity 15 minutes prior to imaging. Bioluminescent in vivo imaging was performed using the IVIS 100 (Caliper Life Sciences), and photon signal intensity was quantified using Living Image software version 2.50 (Caliper Life Sciences). Imaging was performed every 2 minutes until peak photon signal was achieved (approximately 10 to 15 minutes postinjection). The IVIS 100 was set to 1-minute exposures with medium binning. The mice that received TV injections were imaged immediately after injection to confirm that the tumor cells were successfully injected, which was demonstrated by light emission from the lungs.
Postmortem and Histopathological Examination
Euthanasia was performed at 8–10 weeks postinjection, when the mice reached the humane euthanasia criteria endpoints (eg, rapid weight loss, hunched posture, and/or moribund status). A complete necropsy was performed after euthanasia. Organs and subcutaneous xenografts were collected and examined to confirm metastases. All neoplasms were weighed and fixed for 48 hours in 10% neutral-buffered formalin, embedded in paraffin, sectioned, and stained with hematoxylin and eosin (HE).
Cell Proliferation Assay
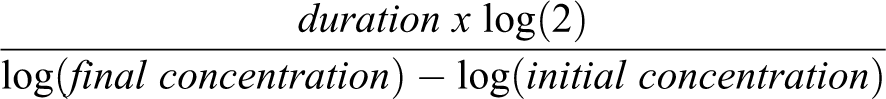
CTAC cells were plated at 20000 cells per well in 6-well plates (3 replicates). Fresh medium was replaced every other day. Cells were harvested at days 3, 5, and 7 and counted using a Cellometer Auto T4 (Nexcelom Bioscience). Detached cells were removed, and wells were washed with PBS. The adherent cells were trypsinized. Live and dead cells were counted using trypan-blue exclusion assay, and cell number and viability were recorded. The CTAC doubling time in culture was calculated using the formula:
Wound-Healing Assay
Cell migration was measured using a wound-healing assay for CTAC cells, which were cultured until 100% confluence. The monolayers were wounded (scratched) in a straight line across the well with a 200-μl pipette tip. The wounded monolayers were then washed twice with PBS to remove cell debris and loosely attached cells. Culture medium was added to the wells. The wound area was subsequently inspected and photographed after 1, 6, and 24 hours using an inverted-phase contrast microscope with a digital camera. The wound-closing speed was calculated using Wimasis (WimScratch, Córdoba, Spain) by using the formula: covered area (time 2) – covered area (time 1)/time 2 – time 1.
STR Analysis
One million CTAC cells and the paraffin block of the original carcinoma were authenticated by STR profiling (IDEXX BioAnalytics, Columbia, MO). This test was performed to genetically confirm canine species origin, CTAC and tumor identity, canine STR profile, and potential interspecies contamination.
Transmission Electron Microscopy
Transmission electron microscopy was performed on 1 CTAC subcutaneous mouse xenograft. After euthanasia, the subcutaneous xenograft was dissected and cut into small pieces (0.5 mm3), fixed in 3% glutaraldehyde, and stored at 4°C for 72 hours. The samples were processed by the Molecular and Cellular Imaging Center at the Ohio Agricultural Research and Development Center (Wooster, OH).
RNA Extraction and Quantitative Real-Time Reverse Transcription–Polymerase Chain Reaction (RT-qPCR)
Total RNA was extracted from snap-frozen normal canine thyroids (n = 3), carcinomas (FTCs (n = 8), and CCTC (n = 4) and CTAC (n = 3) cells using the total RNA protocol from the mirVana miRNA isolation kit (AM 1560, Thermo Fisher Scientific, Waltham, MA). RNA concentration was assessed with a NanoVue Plus (GE Healthcare Life Sciences), and purity and integrity were assessed with a 2100 Bioanalyzer Instrument (Agilent, Santa Clara, CA). Average RNA integrity number for all samples was 7.9. Total RNA was reverse transcribed using the Superscript II First Strand cDNA synthesis kit (Invitrogen, Carlsbad, CA), and RT-qPCR was performed using a LightCycler 480 (Roche, Indianapolis, IN) for the housekeeping gene ubiquitin C (UBC), as well as the following invasion and metastasis genes: serine/threonine protein kinases (AKT1, 2, and 3); rearranged during transfection (RET); osteopontin or secreted phosphoprotein 1 (OPN, SPP1); v-Raf murine sarcoma viral oncogene homolog B (BRAF); receptor tyrosine kinase (MET); calcitonin gene-related peptide (CGRP); phosphatidylinositol-4,5-bisphosphate 3-kinase catalytic subunit alpha (PIK3CA); insulin-like growth factor-1 (IGF-1); calcium-sensing receptor (CaSR); sodium/iodide symporter or solute carrier family 5, member 5 (NIS, SLC5A5); thyroglobulin (TG); thyroid peroxidase (TPO); thyroid stimulating hormone receptor (TSHR); cyclooxygenase 2 (COX2); vascular endothelial growth factor receptor 1 (FLT1); notch homolog 1 (NOTCH1); fibronectin 1 (FN1); thyroid transcription factor (NKX2); paired box 8 (Pax8); myoferlin (MYOF); and platelet-derived growth factor receptor α and β (PDGFRα and β). The RT-qPCR results were analyzed using LightCycler 480 software, and relative mRNA expression was calculated using the delta-delta Ct (▵▵Ct) method: all values were normalized to their corresponding UBC values (▵Ct), and normal thyroid samples were then used as a calibrator/reference when calculating the relative expression values (▵▵Ct) for all samples. UBC was chosen because it had the least amount of variability between the 3 housekeeping genes tested (GAPDH, PP1A, and UBC), and our unpublished deep-sequencing data showed that UBC had identical levels of normalized expression between the 3 groups (normal thyroid, FTC, and CCTC). The primers were chosen from 3 to 4 different primer pairs designed for each gene, and the primer pair that had the best amplification and RT-qPCR product melting characteristics for each gene was chosen (Supplemental Table S1). The primer pairs were designed using Primer-BLAST software (http://www.ncbi.nlm.nih.gov/tools/primer-blast). To confirm primer specificity, all RT-qPCR products were verified by electrophoresis on a 2% agarose gel and stained with ethidium bromide to confirm a single amplification product of the expected size. The entire PCR reactions were then purified using the QIAquick PCR Purification Kit (Qiagen, cat. No. 28106) and sequenced at the Plant-Microbe Genomics Facility at OSU using a 3730 DNA Analyzer (Applied Biosystems, Grand Island, NY) and BigDye Terminator Cycle Sequencing chemistry (Applied Biosystems). Sequences were verified by a BLAST search using the NCBI website. In addition, the amplification efficiency of all of our primers was measured by performing serial 10-fold dilutions and generating standard curves for each primer pair. These efficiencies (a measure of the fold change in the number of molecules between cycles in the serial dilution study) were all in the 1.9–2.1 range, indicating that these primer pairs were well suited for performing RT-qPCR.
Statistical Analysis
Data from RT-qPCR were analyzed using Graph Pad Prism 6.0 software (San Diego, CA). All RT-qPCR samples were repeated in duplicate. Normal distribution of the data for the different variables was assessed using the Kolmogorov-Smirnov test. The RT-qPCR data from FTCs, CCTCs, and CTAC cells were compared statistically to the normal thyroid RT-qPCR data using the Mann-Whitney test for skewed data. A P value <.05 was considered statistically significant.
Results
In Vitro Characterization of CTAC Cell Line
The CTAC cells grew in monolayers as spindle-shaped cells. The doubling time of CTAC in culture was 33 ± 2 hours (Fig. 1). The wound-healing assay evaluated cell migration and wound closure of CTAC cells in vitro. At time 0, the wound area was approximately 35% of the imaged field. After 1 and 6 hours, there was no significant difference in migration or wound closure. After 24 hours, there was a significant increase in CTAC migration and a decrease to 5% in wound area (**P < .01; Fig. 2).
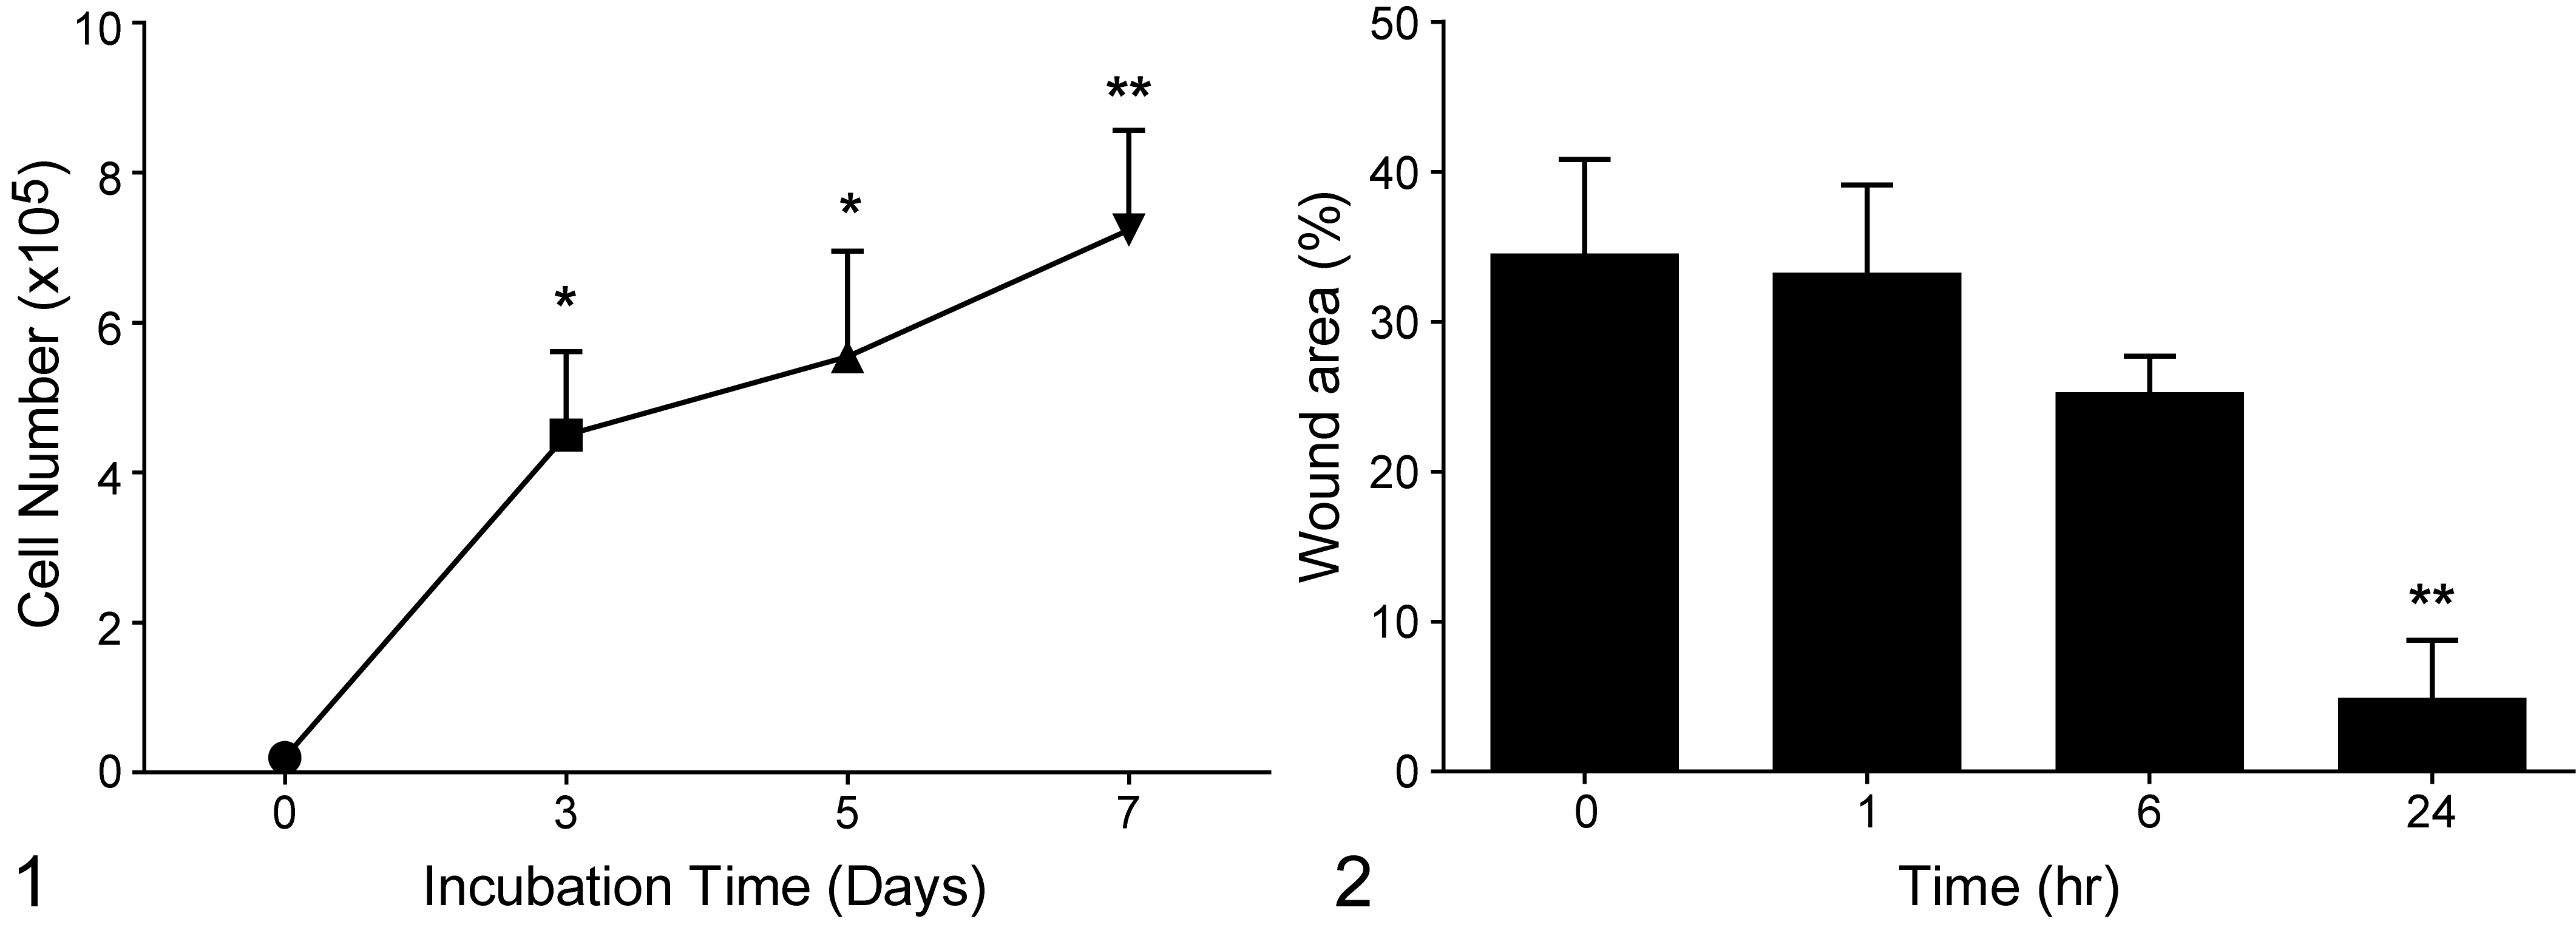
In vitro growth of canine thyroid adenocarcinoma cell line (CTAC). Data are presented as the mean and standard deviation of 3 replicates of CTAC grown separately. Significant differences from day 0 are indicated as *P < .05, **P < .01.
In the STR analysis, CTAC cells were confirmed to be of canine origin with no mammalian interspecies contamination. A genetic profile was generated for the primary neoplasm and CTAC cells using a panel of microsatellite markers for genotyping. These data are presented in Table 2 as allele sizes in base pairs (bp). A 1-bp difference in allele size between the samples represents run-to-run variability, but differences of 2 bp or greater represent different allele sizes between the samples. The genetic profile for the cell line had an extra allele at marker 13 and was missing an allele at markers 1 and 5 when compared with the genetic profile for the original neoplasm (paraffin block). Allelic loss is a common finding in cell lines established from neoplasms. The cell line had 94% identity when compared with the tumor genetic profile, which is greater than the 80% cutoff for establishing identity of a cell line. 53 Thus, the genetic profile of the cell line was consistent with an origin from the original dog thyroid carcinoma.
Microsatellite Analysis of CTAC Cell Line and the Original Thyroid Follicular Carcinoma.
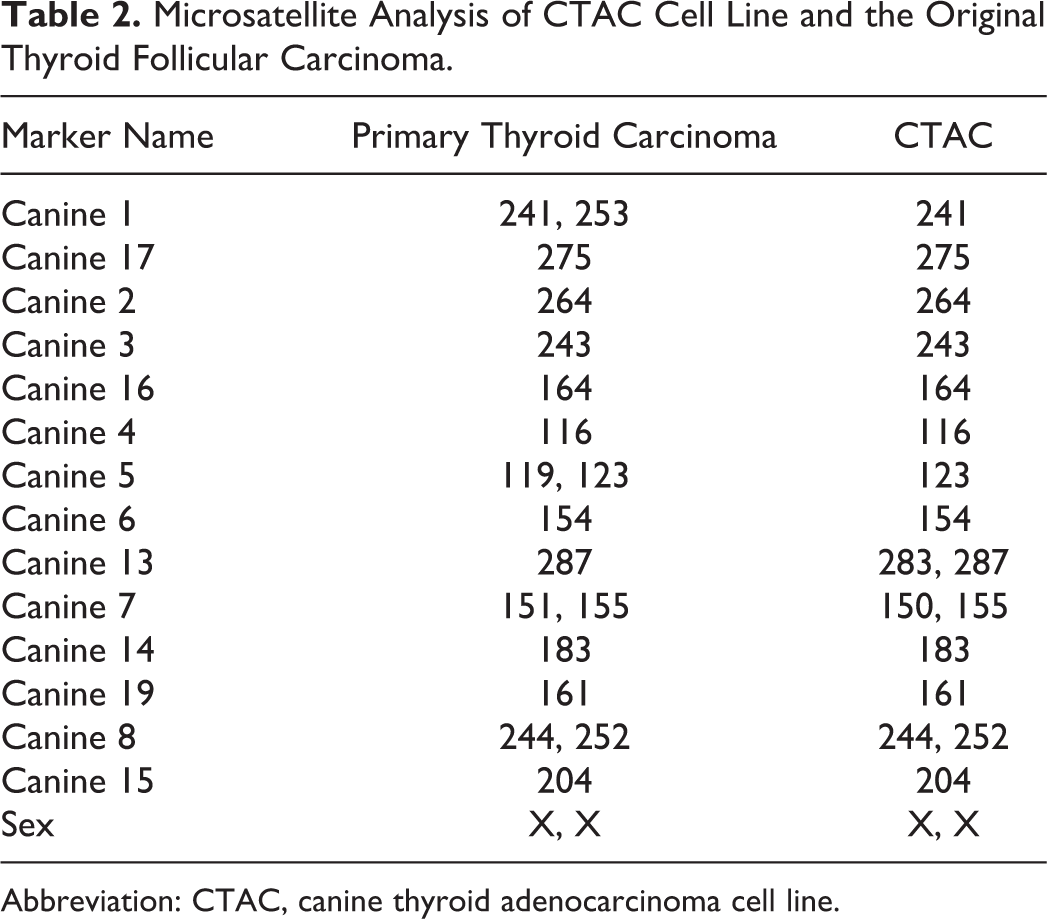
Abbreviation: CTAC, canine thyroid adenocarcinoma cell line.
Subcutaneous Injection of CTAC-Luc Cell Line
CTAC mouse xenografts were grossly visible in the transplanted sites from 20 days after implantation in all implanted mice. Mice were euthanized at 8–10 weeks after implantation, and tumors ranged in size from 0.03 to 1.8 cm3 (mean size = 0.4 cm3). The subcutaneous tumors were invasive and attached to the underlying muscle. Histologically, the xenografts were poorly differentiated solid thyroid carcinoma, similar to the primary cancer in the dog (Fig. 3). Bioluminescent imaging was effective at monitoring the presence and growth of sucutaneous neoplasms. One CTAC xenograft metastasized to the kidney 10 weeks following subcutaneous injection (Fig. 4).
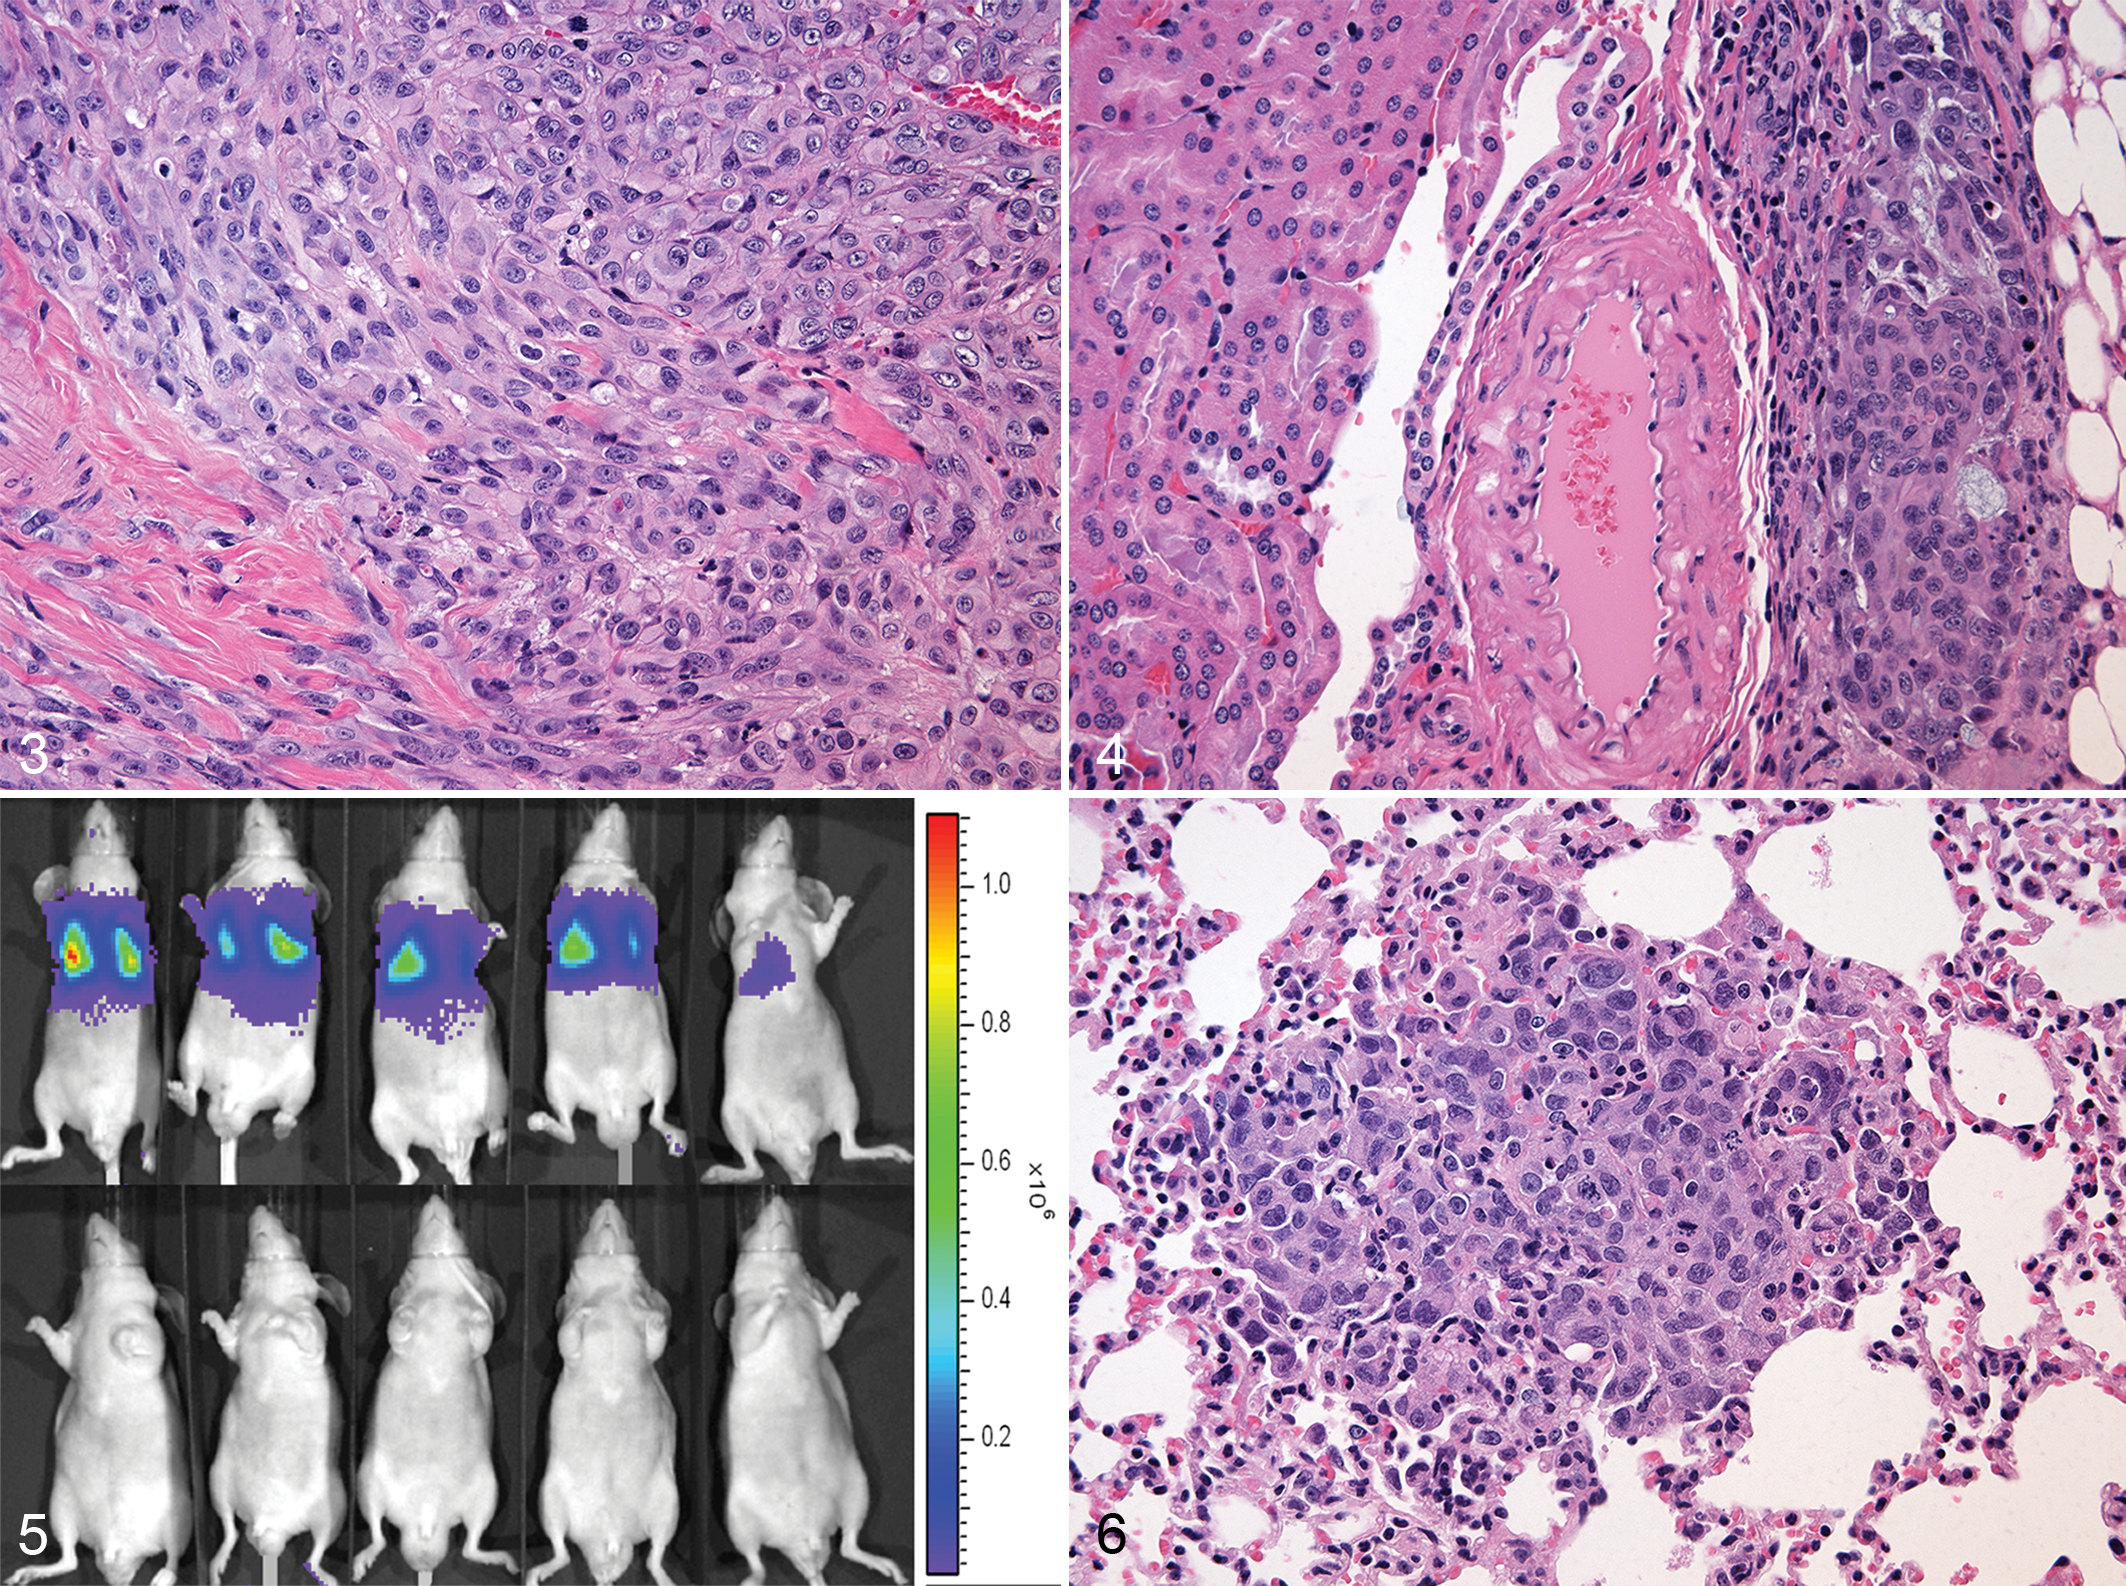
Canine thyroid adenocarcinoma cell line, subcutaneous xenograft, nude mouse. The xenograft is a poorly differentiated solid thyroid carcinoma similar to the primary cancer in the dog. The neoplastic cells are large and round to elongated with large nuclei and granular cytoplasm. Hematoxylin and eosin (HE).
TV Injection of CTAC-Luc Cell Line
Injection of cancer cells into the TV is an established method of inducing metastatic lung tumors. Tail vein injections were successful in 7 of 7 mice based on bioluminescence from the lungs at 5 minutes after injection of CTAC-Luc cells. There was no bioluminescence observed between 1-week postinjection and euthanasia (8–10 weeks postinjection; Fig. 5). One mouse developed lung metastases 10 weeks postinjection (2 metastases were observed histologically with a diameter of 190 and 700 μm; Fig. 6).
Transmission Electron Microscopy
Follicular thyroid carcinoma cells from a CTAC subcutaneous mouse xenograft had an intact basement membrane (Supplemental Fig. S2). Nuclei were enlarged and membrane irregularities were frequent. The endoplasmic reticulum was pleomorphic, disorganized, and had dilated cisternae. The lysosomes were prominent and frequent. The Golgi complex was hypertrophic. Mitochondria were increased in number, variably sized, and swollen with irregular cristae. Evidence of thyroglobulin-containing vesicles was not found.
Analysis of Normal Canine Thyroid, Thyroid Carcinomas, and CTAC
The histopathological characteristics of canine thyroid neoplasms are summarized in Table 3. The expression of 24 invasion and metastasis genes (AKT1, AKT2, AKT3, RET, SPP1, BRAF, MET, CGRP, PIK3CA, IGF-1, CaSR, SLC5A5, TG, TPO, TSHR, COX2, FLT1, NOTCH1, FN1, NKX2, Pax8, MYOF, PDGFRα, and PDGFRβ) was measured by RT-qPCR in normal thyroids, thyroid carcinomas, and CTAC (Figs. 11 –22 and Figs. 23 –34).
Histopathological Characteristics of Canine Thyroid Neoplasms.
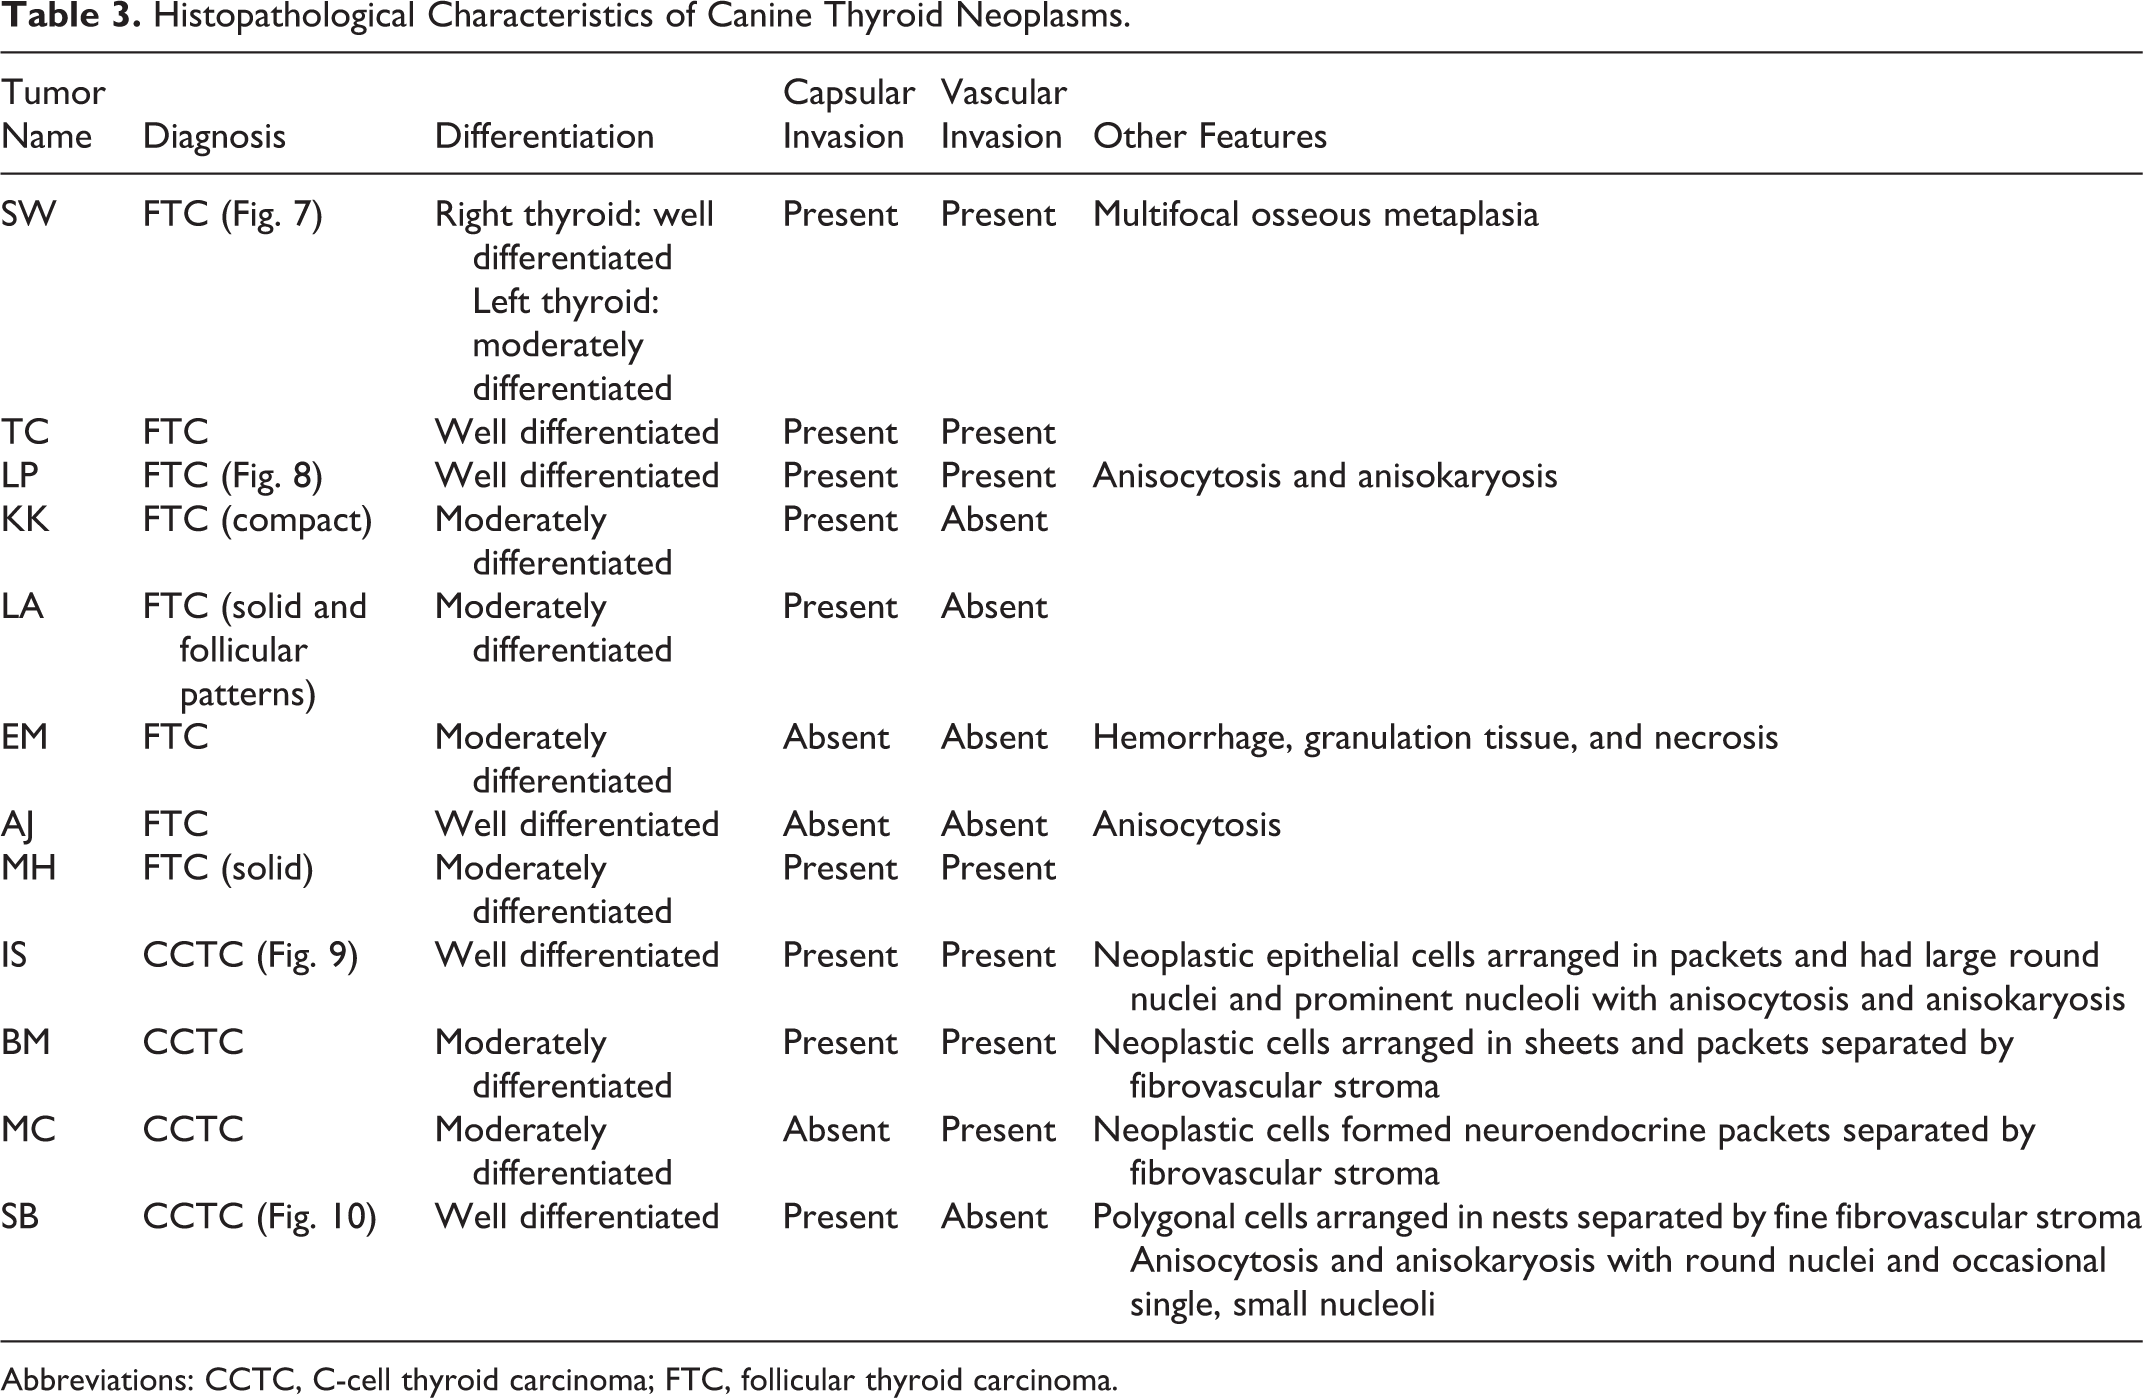
Abbreviations: CCTC, C-cell thyroid carcinoma; FTC, follicular thyroid carcinoma.
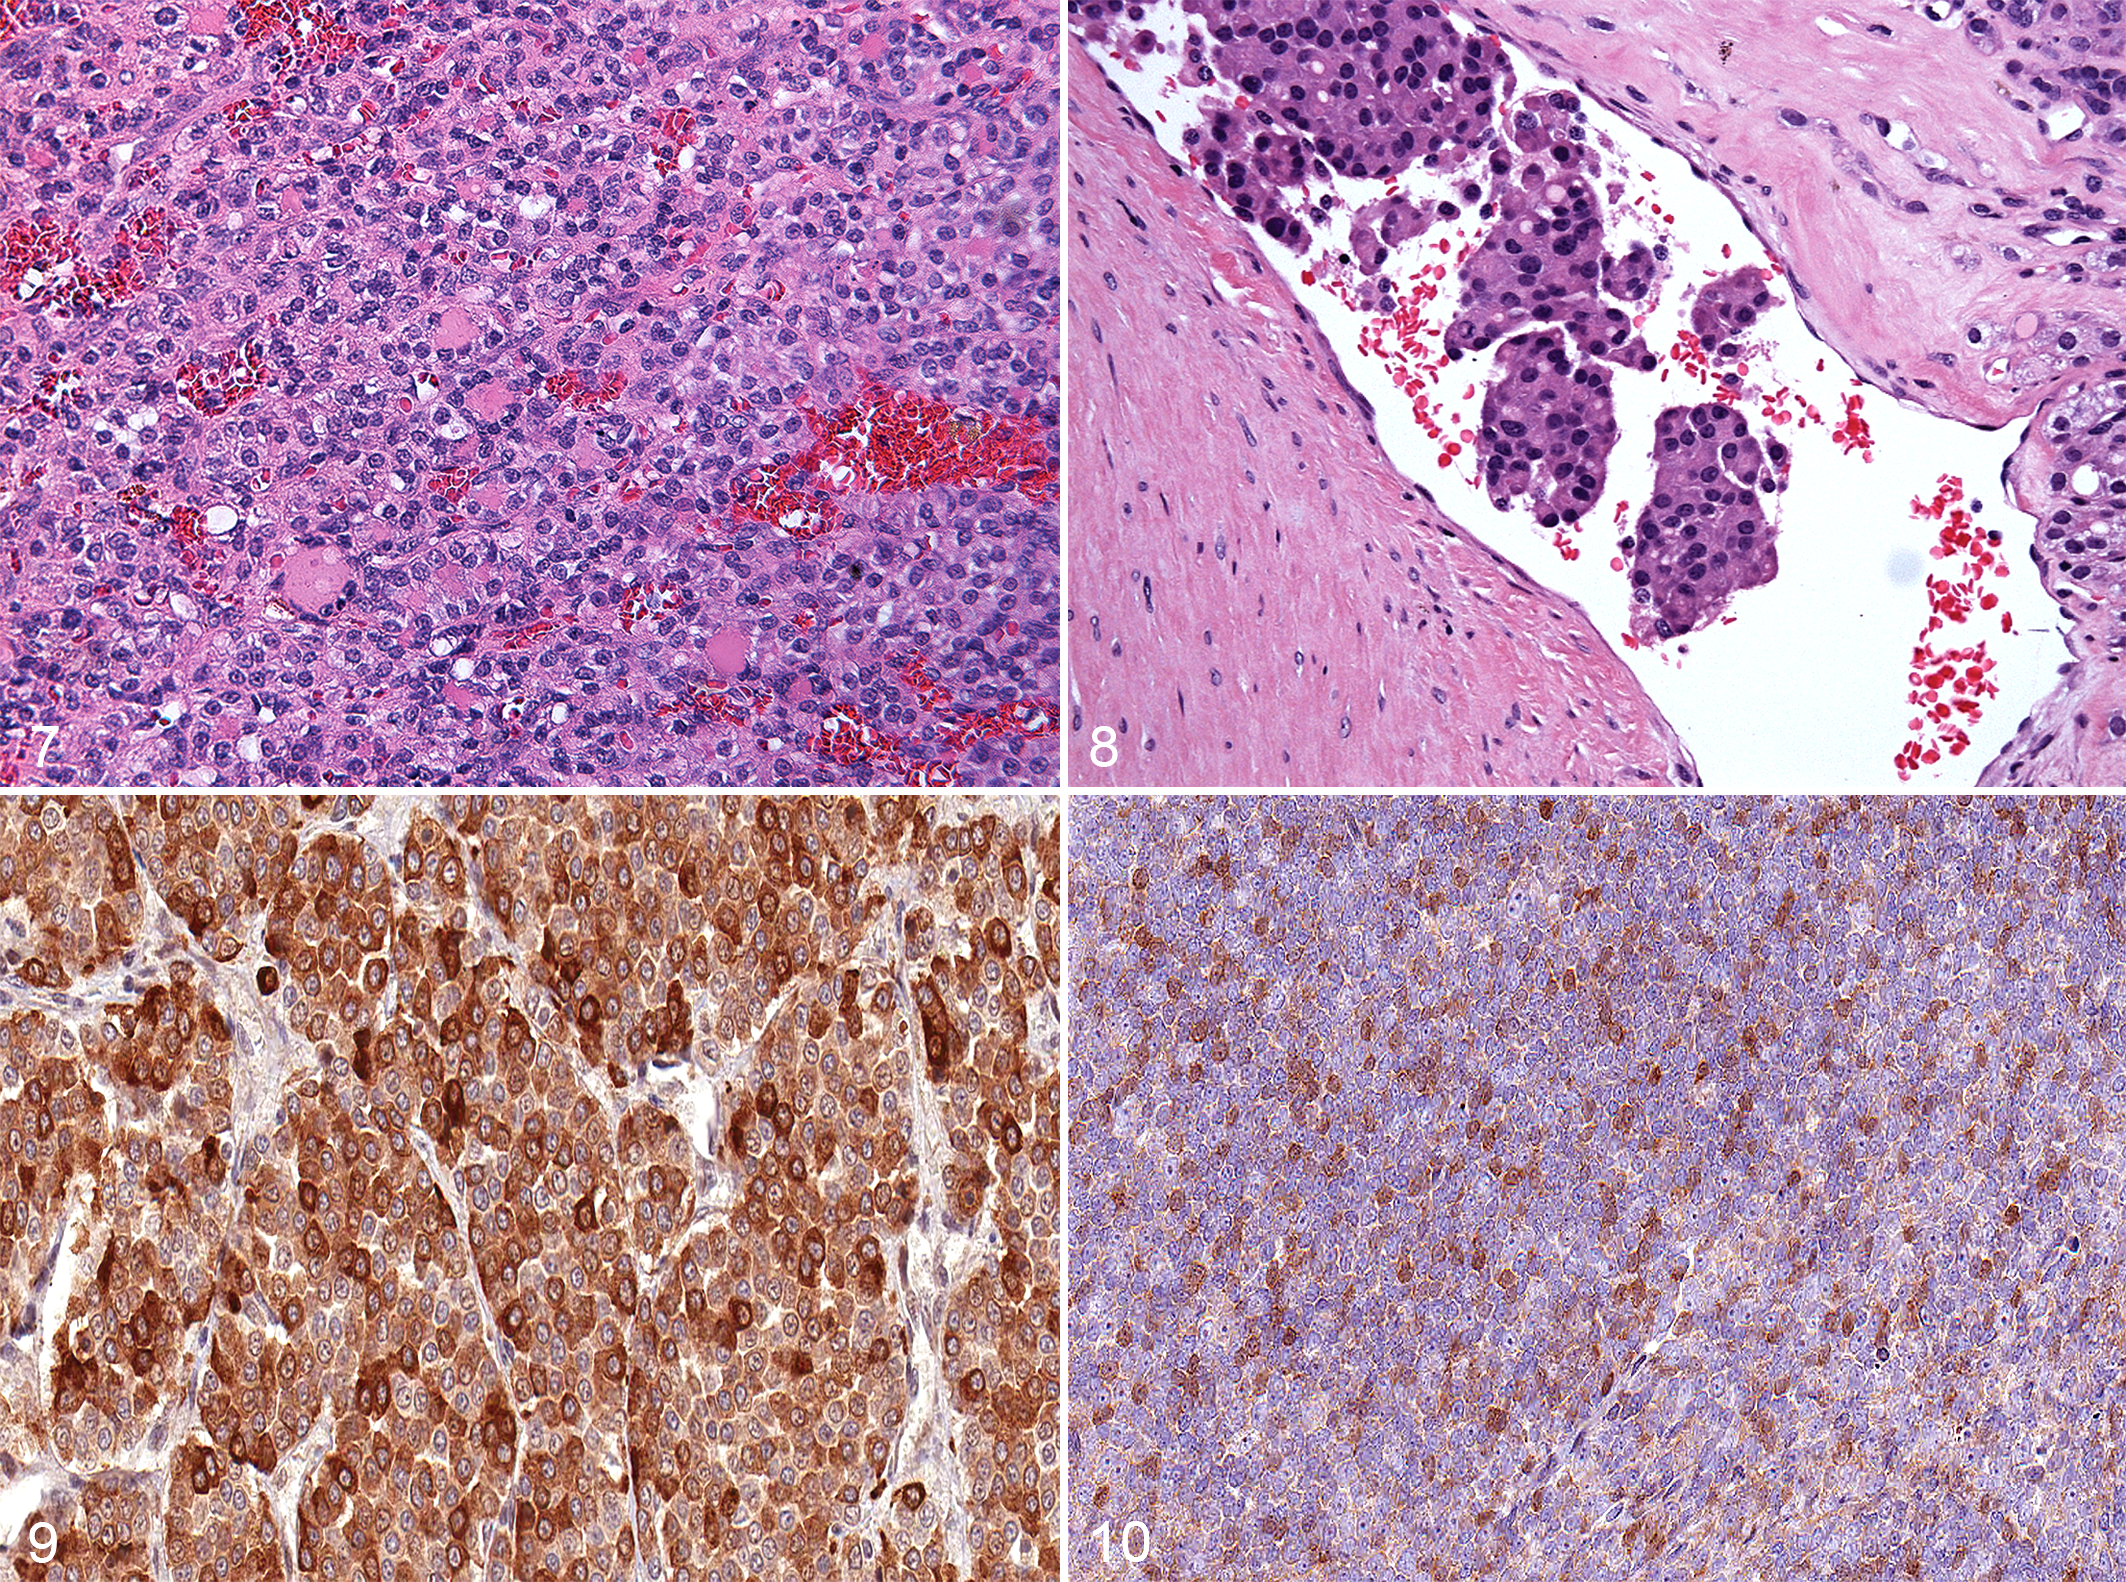
Canine follicular thyroid carcinoma, thyroid neoplasm, dog. Moderately differentiated follicular carcinoma (patient SW). Hematoxylin and eosin (HE).
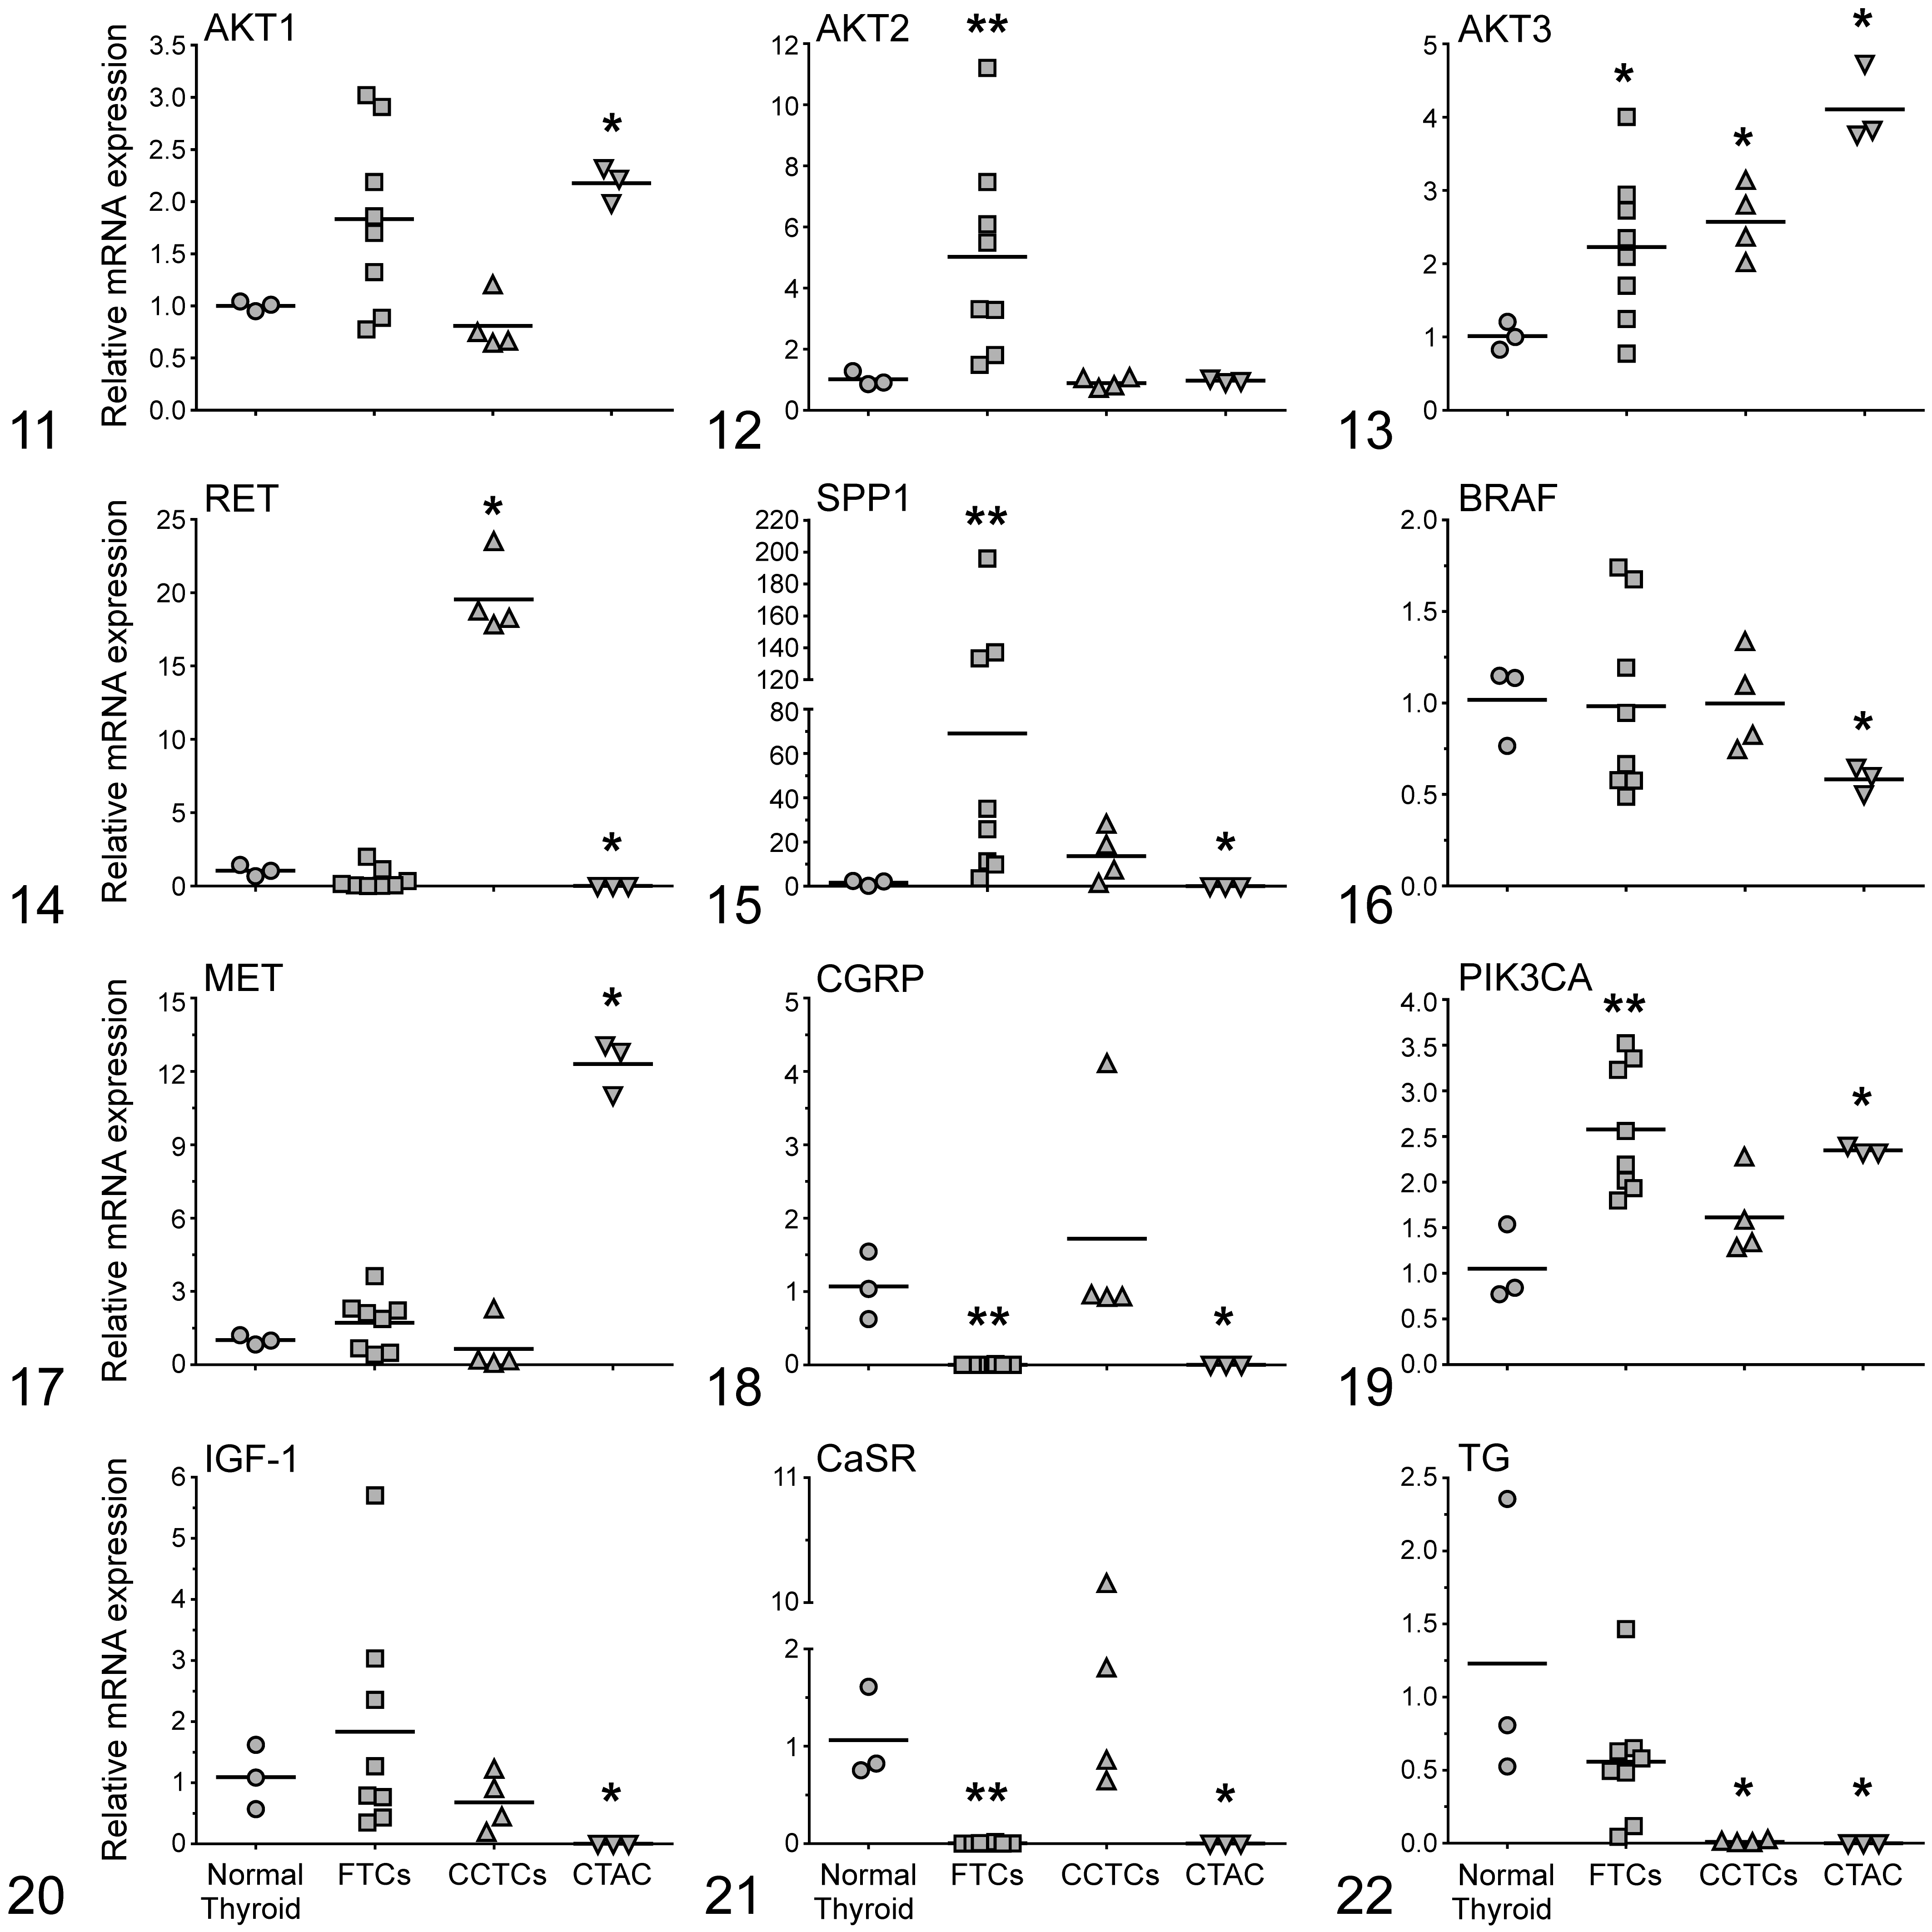
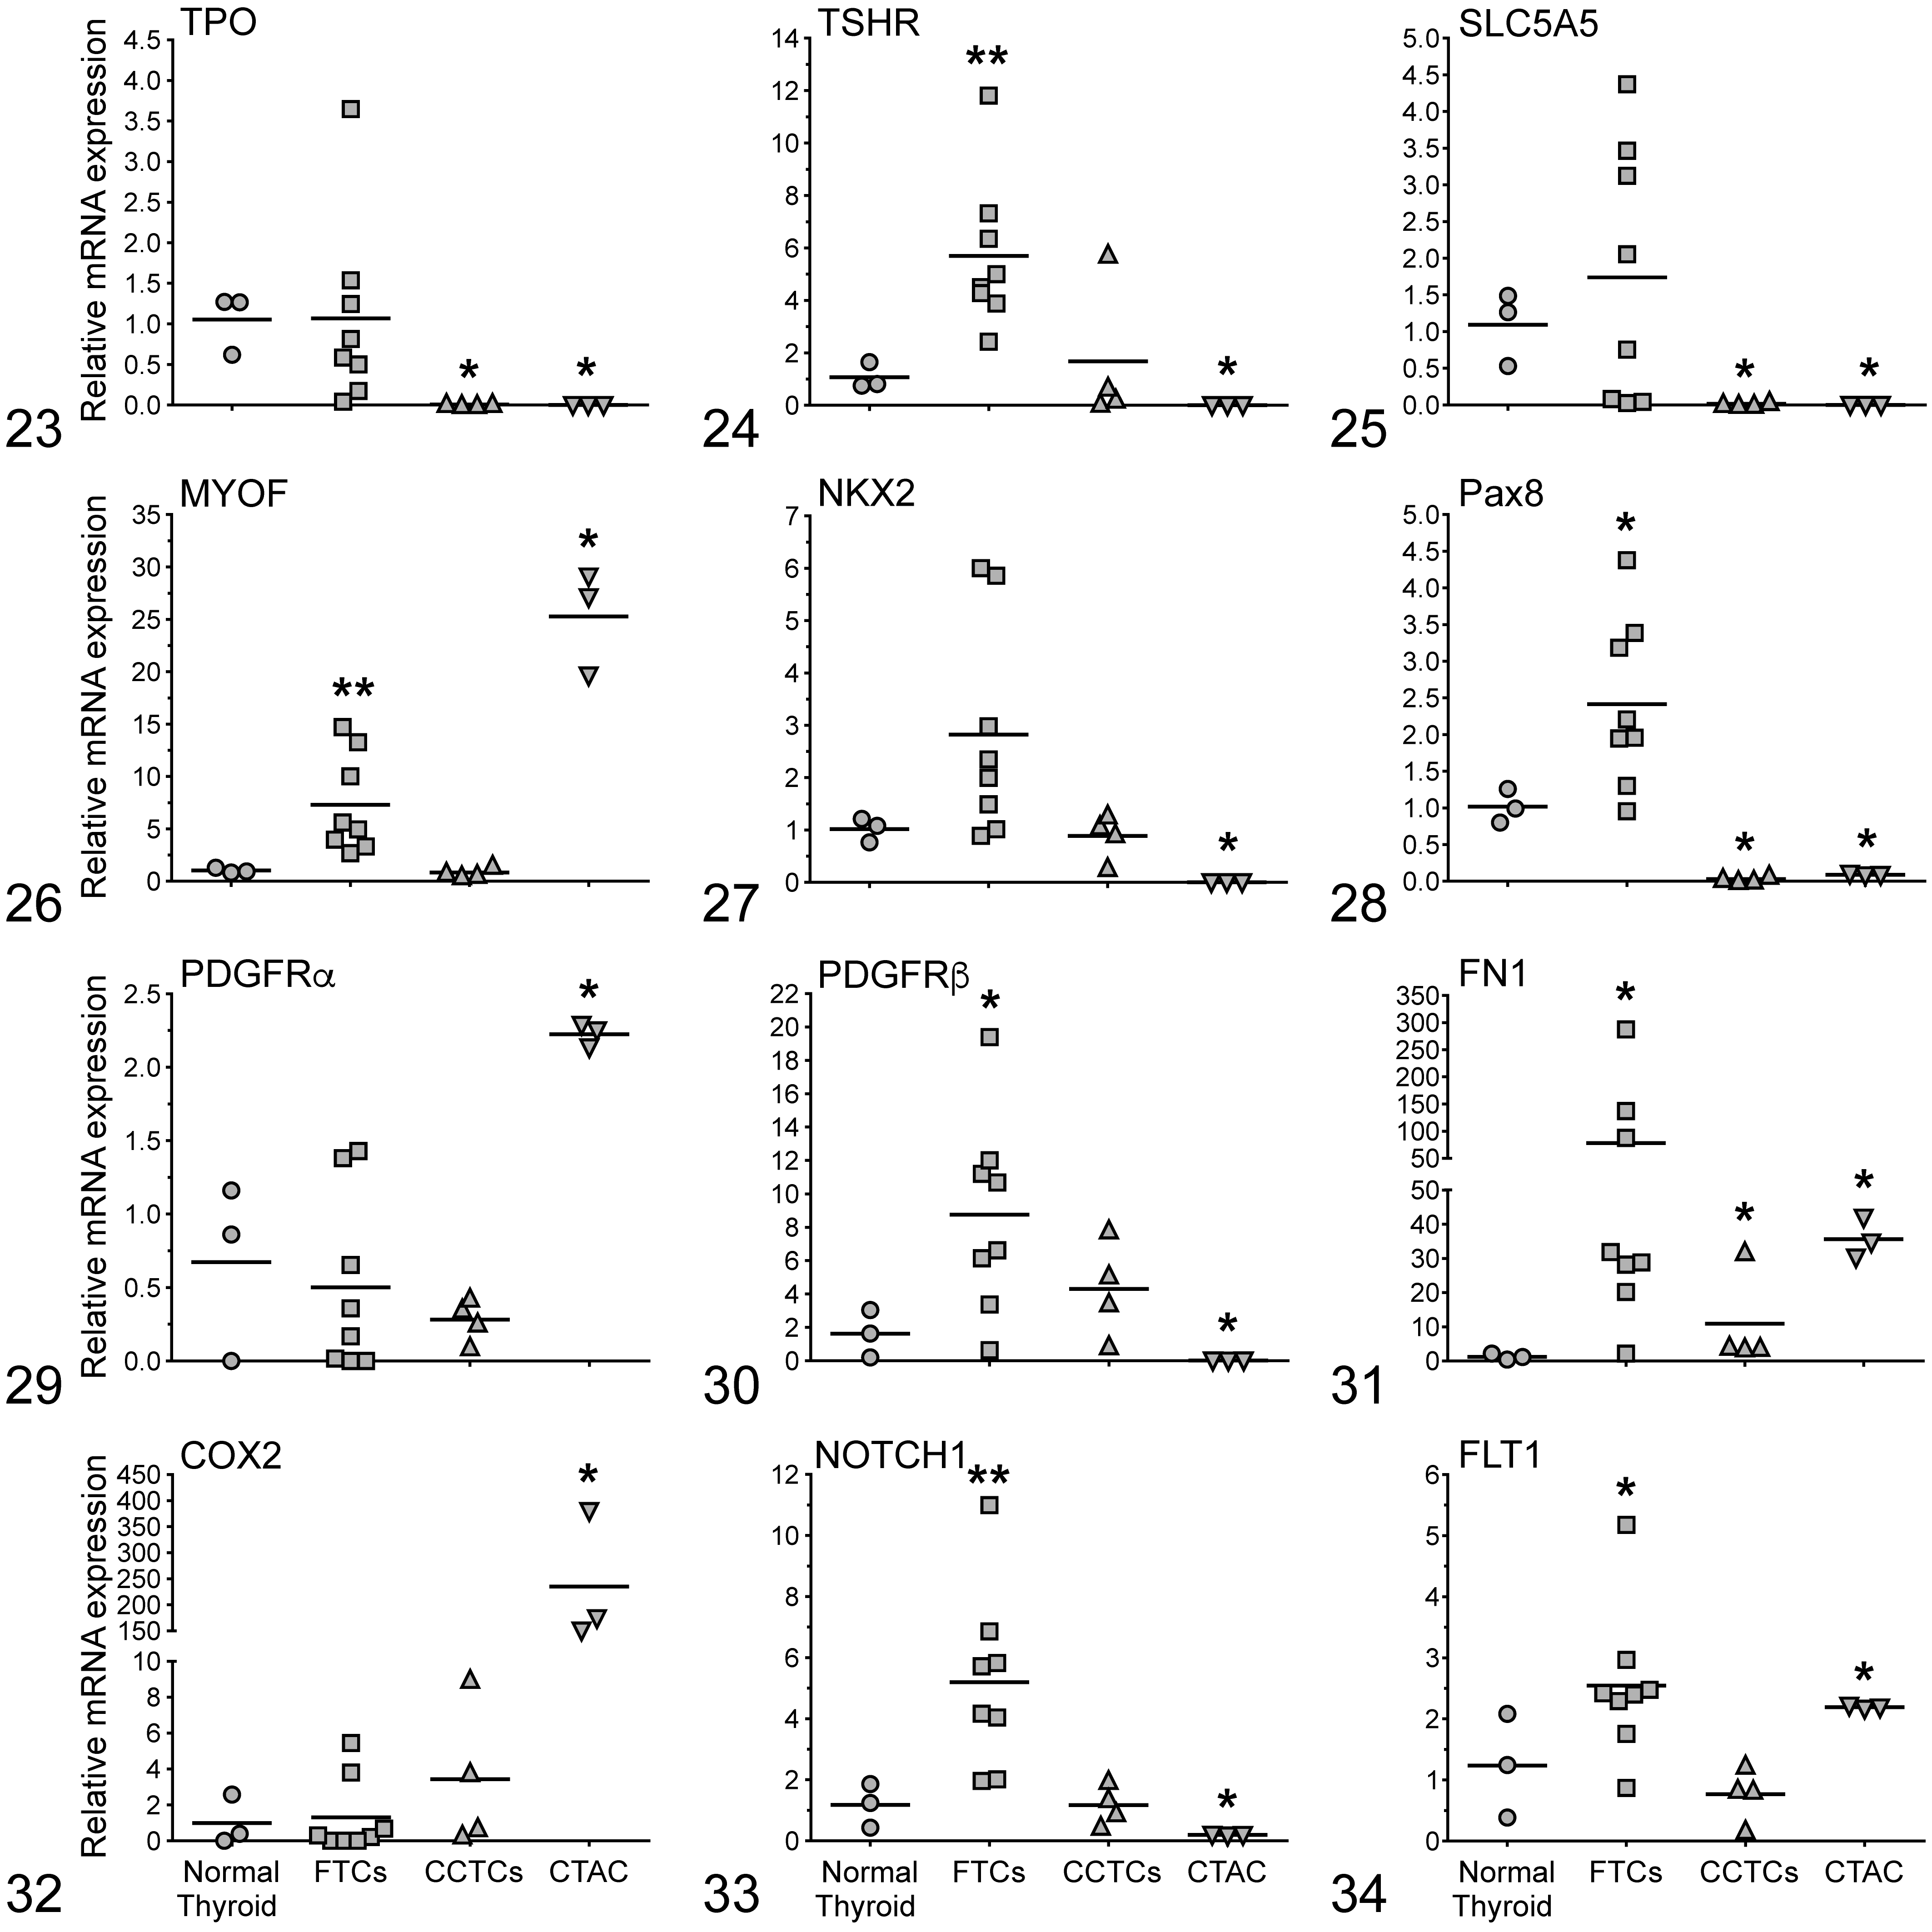
The FTCs had significantly increased (AKT2 [5-fold], AKT3 [2-fold], SPP1 [69-fold], PIK3CA [2.5-fold], TSHR [5.6-fold], MYOF [7-fold], Pax8 [2.4-fold], PDGFRβ [9-fold], FN1 [78-fold], NOTCH1 [5-fold], and FLT1 [2.5-fold]) mRNA levels when compared with normal thyroid glands. Relative expression levels of AKT1, BRAF, MET, IGF-1, TG, TPO, SLC5A5, NKX2, PDGFRα, and COX2 were not significantly different between FTCs and normal thyroid glands. FTCs had no expression of RET, CGRP, and CaSR mRNA. The expression of both SPP1 and FN1 among FTC cases was highly variable. In the case of SPP1, FTCs were divided into 2 subpopulations, one with overexpression in the 10- to 40-fold range and the other with overexpression in the 140- to 200-fold range compared with normal thyroid. Similarly, FTCs were divided into 2 subpopulations based on FN1 expression, with 1 population having 20- to 40-fold increased expression and 1 population having 100- to 300-fold increased expression compared with normal thyroids.
The CCTCs had significantly increased AKT3 (2.5-fold), RET (19.5-fold), and FN1 (11-fold) mRNA levels when compared to normal thyroid glands. Relative expression levels of AKT1, AKT2, SPP1, BRAF, MET, CGRP, PIK3CA, IGF-1, CaSR, TSHR, MYOF, NKX2, PDGFRα, PDGFRβ, COX2, NOTCH1, and FLT1 were not significantly different between CCTCs and normal thyroid glands. CCTCs had no expression of TG, TPO, SLC5A5, and Pax8 mRNA.
CTAC had significantly increased AKT1 (2-fold), AKT3 (4-fold), MET (12-fold), PIK3CA (2-fold), MYOF (25-fold), PDGFRα (2-fold), FN1 (35.6-fold), COX2 (235-fold), and FLT1 (2-fold) mRNA levels when compared with normal thyroid glands and lower levels of BRAF (0.5-fold) when compared with normal thyroid. The expression of AKT2 was not significantly different between CTAC and normal thyroid glands. CTAC cells had no expression of RET, SPP1, CGRP, IGF-1, CaSR, TG, TPO, TSHR, SLC5A5, NKX2, Pax8, PDGFRβ, and NOTCH1 mRNA.
Discussion
Animal models are important in vivo tools to characterize the molecular pathways of cancer progression and metastasis, and an appropriate animal model should be representative of the spontaneous cancer. 61 Several types of animal models of human cancers have been developed, including xenograft, orthotopic, and transgenic or genetically engineered mice. 67 Xenograft tumors derived by subcutaneous inoculation of human thyroid cancer cells into immunocompromised mice has been a commonly used model. 13 Subcutaneous xenograft models are technically simple, and it is easy to measure tumor growth after inoculation. 46
Thyroid cancer is a relatively common and aggressive spontaneous malignancy in dogs. 23 Therefore, it is important to develop a reliable and reproducible in vivo mouse model of advanced canine thyroid cancer to investigate pathogenesis and new therapies, especially for the aggressive forms of thyroid cancer. We successfully developed a novel model of canine thyroid cancer in nude mice. This is the first model of canine thyroid cancer, and it will be useful for translational research relevant to human thyroid cancer. It will be desirable to develop a lung metastatic subline using serial transplantation of metastatic tumor. Additional refinement of the model will be needed for investigations of lung metastasis.
In addition, spontaneous thyroid carcinomas were assessed for relative quantification of metastasis-associated genes to identify potential pathways that may be worthy of further investigation for targeted-oncologic therapies. The canine FTCs had no expression of RET, CGRP, or CaSR mRNA, while the CCTCs had no expression of TG, TPO, SLC5A5, or Pax8 mRNA (thyroid follicle–specific genes). Therefore, there was a strong concordance between gene expression and cancer subtypes. Both IHC and RT-qPCR were useful to differentiate FTCs and CCTCs. It may be important to distinguish between FTCs and CCTCs as new therapies could vary by cancer subtype.
CTAC cells were developed in the early 1960s and have been passaged more than 400 times. 31 We suspect that some thyroid differentiation markers may have been lost from the anaplastic CTAC cells. We found increased expression of AKT1, AKT3, MET, PIK3CA, MYOF, PDGFRα, FN1, COX2, and FLT1 mRNA in CTAC cells when compared with normal canine thyroid tissue. No TPO expression was present in CTAC cells. The expression of TPO is decreased in undifferentiated human malignancies and is absent in human anaplastic FTC. 10 Also, STR analysis of the CTAC cells and original paraffin-embedded neoplasm confirmed that they are identical and of canine origin with no mammalian interspecies contamination. CTAC cells grew rapidly as subcutaneous xenografts in nude mice and a single metastasis to the kidney was observed. Lung metastases were observed in 1 mouse following TV injection of CTAC-Luc cells. There is a need to develop novel approaches to treat metastatic thyroid cancer. For future investigations, we plan on developing a subline of CTAC cells with a greater propensity of lung metastasis by growing substrains of cells from lung metastases, as has been described for other metastatic tumors.
To assess the genetic alterations in canine thyroid cancer, we measured the relative mRNA expression of 24 genes that are related to invasion and metastasis (Table 4). Eleven of the 24 genes (AKT2, AKT3, SPP1, PIK3CA, TSHR, MYOF, Pax8, PDGFRβ, FN1, NOTCH1, and FLT1) had significantly greater expression in FTCs compared with normal thyroid. Phosphoinositide-3 (OH) kinase (PI3K)-Akt signaling plays an important role in the formation and progression of a wide variety of tumors, including FTC. 15,33 PI3K activation leads to AKT phosphorylation, which contributes to tumorigenesis. 7 There are 3 isoforms of AKT, and each has a distinct role in PI3K-mediated cellular responses. 64 In this study, mRNA expression of PIK3CA (Class I PI3K catalytic subunit) was significantly increased in FTC and CTAC when compared with normal canine thyroid. AKT1 mRNA expression was significantly greater in CTAC when compared with normal canine thyroid, while AKT2 mRNA expression was significantly greater in FTC. These data are similar to that reported previously in humans in which AKT2 mRNA was overexpressed in FTC compared with normal tissues. 55 In addition, AKT3 mRNA expression was significantly greater in all groups (FTCs, CCTCs, and CTAC) when compared with normal thyroid. These data suggest their involvement in the pathogenesis of canine thyroid carcinoma and warrant further research.
Gene Characteristics Analyzed by RT-qPCR.
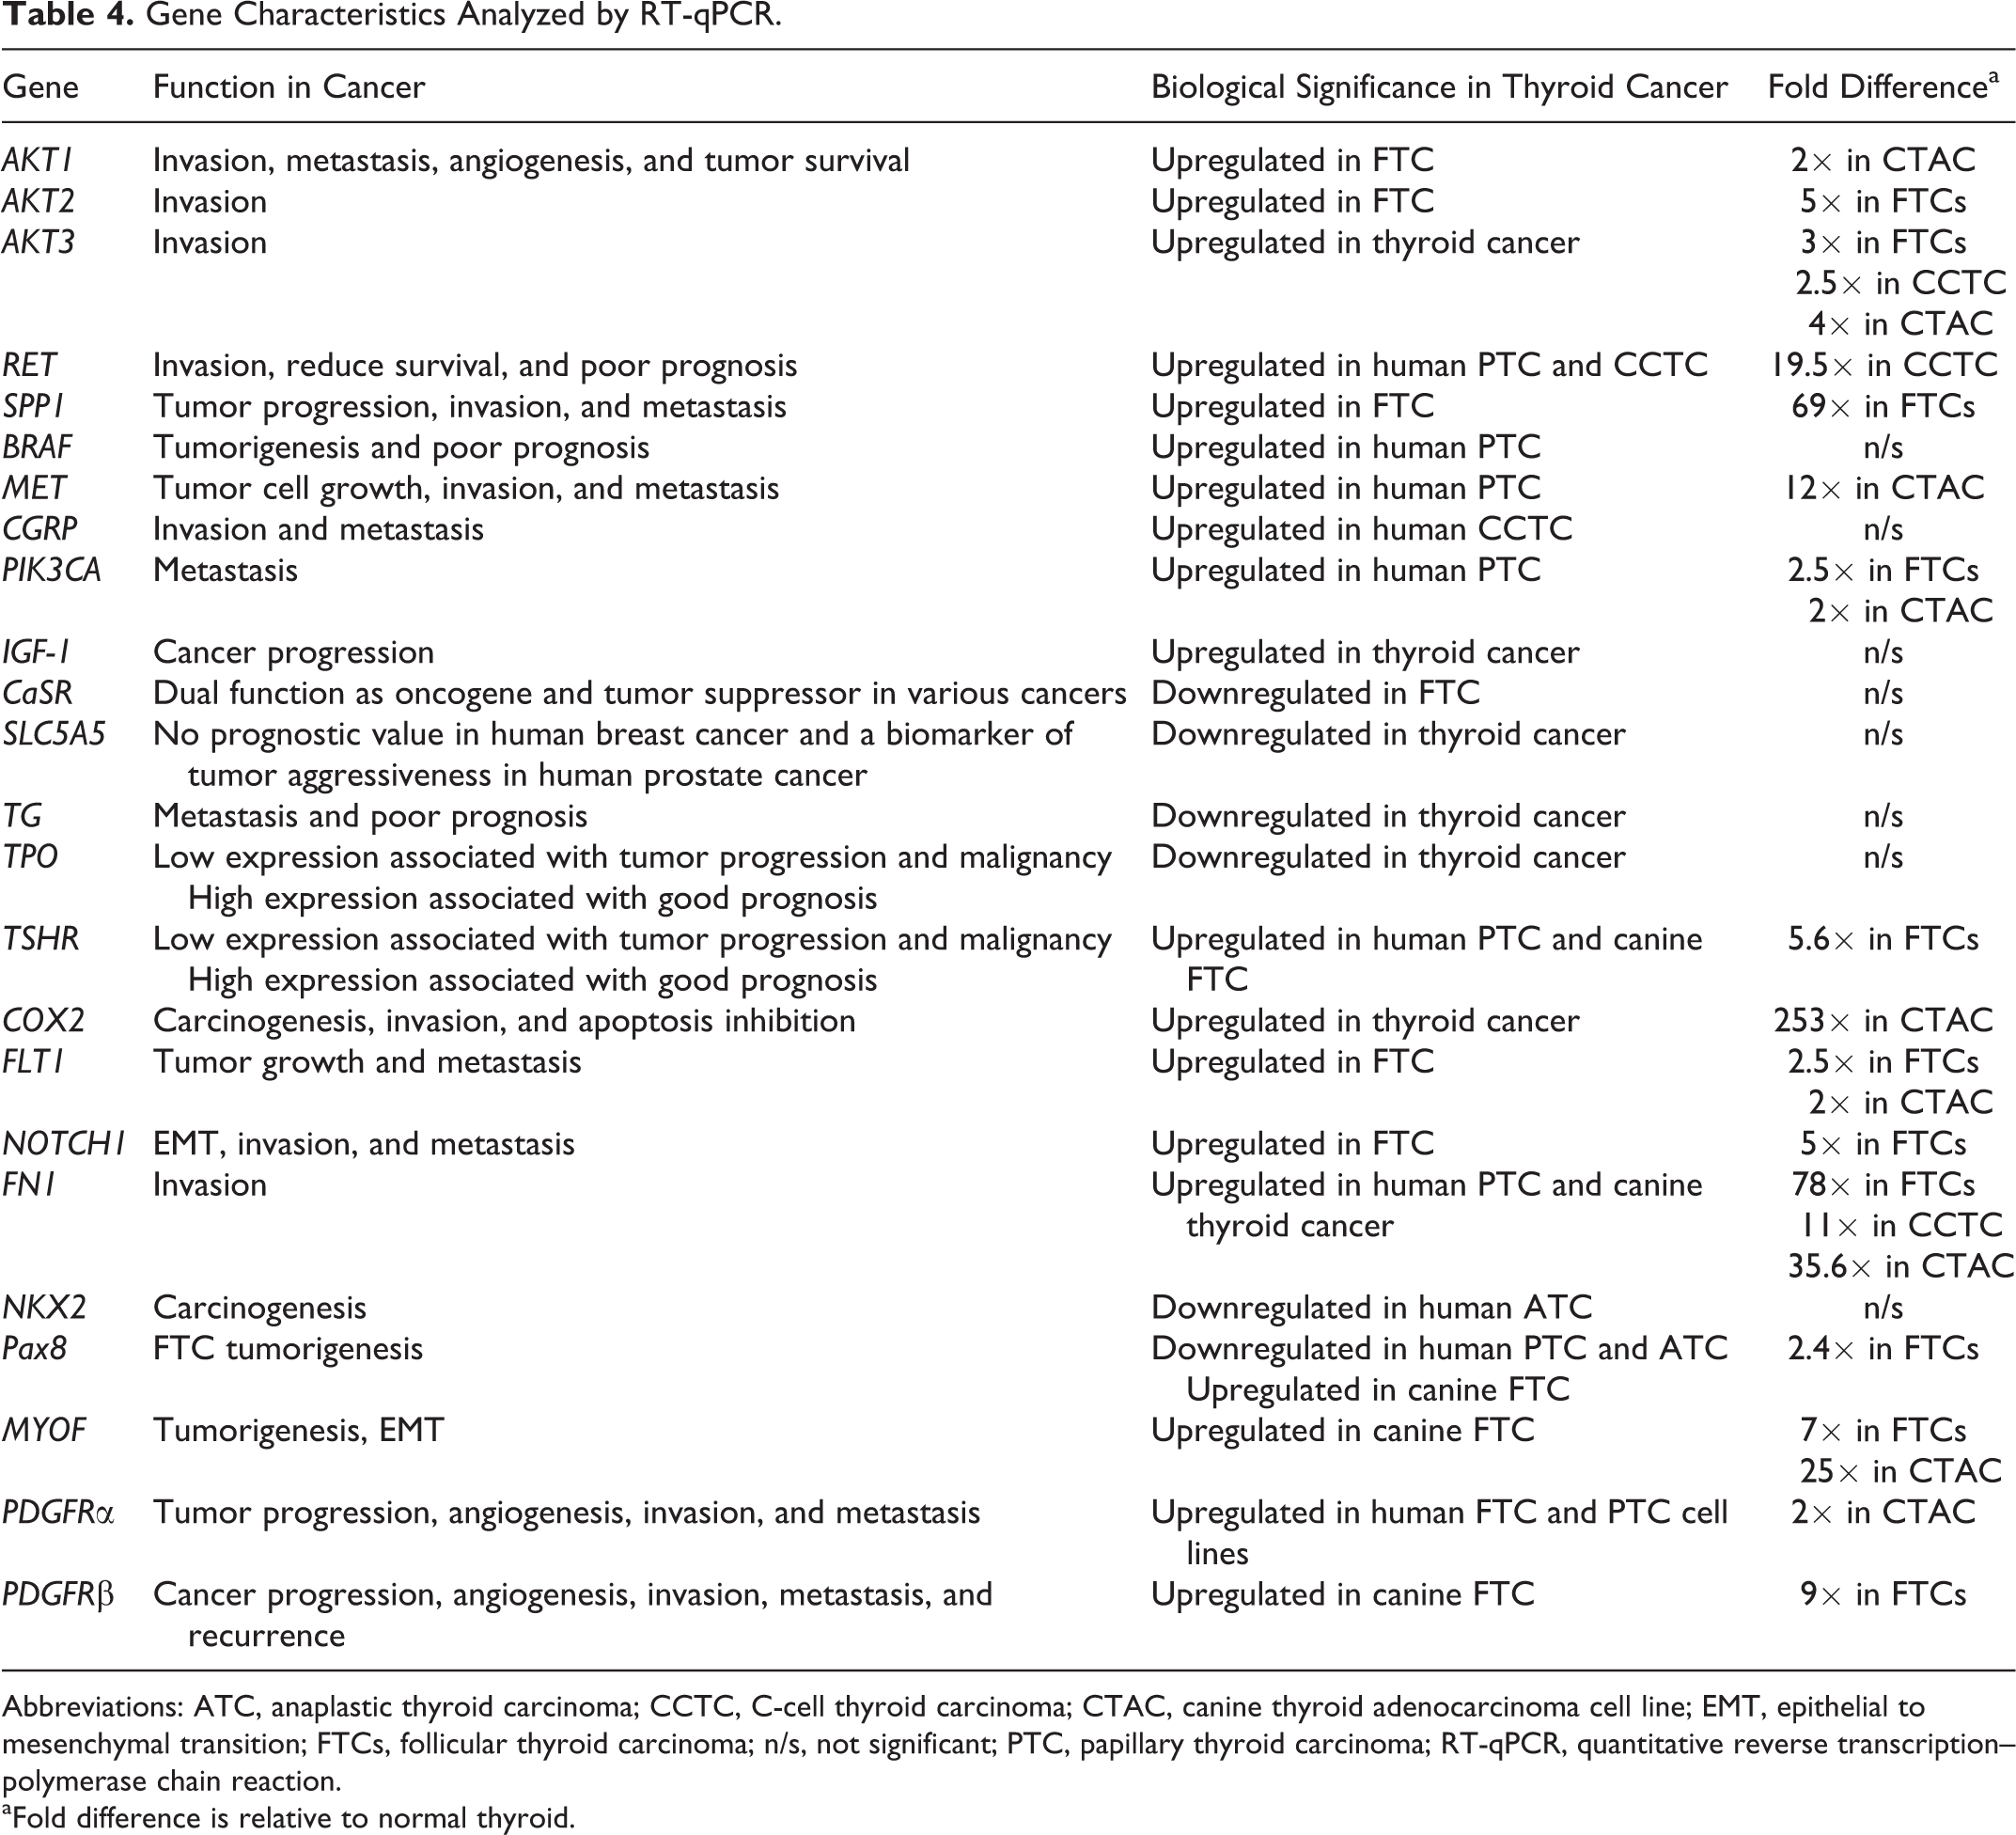
Abbreviations: ATC, anaplastic thyroid carcinoma; CCTC, C-cell thyroid carcinoma; CTAC, canine thyroid adenocarcinoma cell line; EMT, epithelial to mesenchymal transition; FTCs, follicular thyroid carcinoma; n/s, not significant; PTC, papillary thyroid carcinoma; RT-qPCR, quantitative reverse transcription–polymerase chain reaction.
aFold difference is relative to normal thyroid.
Osteopontin (SPP1) is a potential biomarker for cancer detection, monitoring, and therapy because it is secreted into blood and extracellular fluid. 42 Osteopontin plays a role in bone remodeling, 18 osteoclast attachment to bone matrix, 54 adhesion and migration of leucocytes, wound healing, induction of cytokine production, 69 and evasion of apoptosis. 19 Osteopontin is overexpressed in human papillary thyroid carcinoma, 27 and its expression has been correlated with poor prognosis. In the current study, the expression of osteopontin was significantly upregulated in canine FTC when compared with normal thyroid, consistent with a previous study. 42 Several of the canine FTCs had a very large increase (>120-fold) in osteopontin. The role of osteopontin in FTC pathogenesis needs to be further investigated.
Pax8 is a thyroid-specific transcription factor required for the development of thyroid follicular cells and controls the expression of thyroid-specific genes (eg, TG, TPO, and NIS), and its expression is dysregulated in thyroid cancer. 24,56 Pax8 expression has been reported to be reduced in human thyroid cancer. 51 In the present study, we found that Pax8 expression was significantly greater in FTCs, while there was no Pax8 expression in CCTCs when compared with normal thyroid. Therefore, Pax8 mRNA level is a good candidate for discriminating between FTC and CCTC.
The Notch signaling pathway regulates cell differentiation, proliferation, apoptosis, adhesion, epithelial-mesenchymal transition, migration, and angiogenesis. 8 The role of Notch signaling in canine FTC has not been reported. We provide the first description of the relative expression of NOTCH1 in canine thyroid carcinomas, which was significantly greater in FTC but not CCTC when compared with normal thyroid. This suggests that NOTCH1 may be associated with FTC progression and metastasis. It has been reported that NOTCH1 upregulation was positively correlated with capsular invasion and lymph node metastasis in human papillary thyroid carcinoma patients. 71
RET is essential for the development of neuroectodermal-derived tissues, including the adrenal medulla chromaffin cells; thyroid C-cells; the sympathetic, parasympathetic, and enteric ganglia; kidney; and testis. 2,3,40 Germ-line point mutations in RET predispose to multiple endocrine neoplasia type 2 and medullary (C-cell) carcinoma in humans. 41 In this study, the expression of RET was ∼20-fold greater in CCTCs when compared with FTCs and normal thyroid, which was the highest level of overexpression for the genes analyzed in the CCTC samples. Since RET mutations lead to the constitutive activation of RET kinase and downstream MAPK and PI3K-AKT pathways, it is likely that genes in these pathways are important in canine CCTC. These data emphasize the need to further study the role of RET receptor and related pathway(s) in canine CCTC.
Two genes (MET and COX2) displayed significant upregulation only in the CTAC cells relative to normal thyroid. MET overexpression is common in human thyroid carcinomas, 6 while a low expression level has been observed in normal thyroid tissues. 20,21 Increased MET expression was reported in human anaplastic thyroid carcinoma cell lines. 5 COX2 plays an important role in the pathogenesis of several epithelial cancers 62 and is expressed in human colorectal, stomach, pancreas, prostate, neck, urinary bladder, cervix, endometrium, and thyroid carcinoma. 17,35,43,62 mRNA expression of COX2 was not significantly increased between FTC and CCTC; however, its expression was ∼200-fold greater in CTAC compared with normal thyroid. The importance of overexpression of both MET and COX2 in CTAC cells remains to be elucidated, and whether the overexpression is due to an artifact of many in vitro passages cannot be excluded.
Myoferlin and FLT1 were highly expressed in FTC and CTAC when compared with normal thyroid. Myoferlin is associated with cancer cell membrane repair following injury and is associated with increased proliferation of cancer cells. Therefore, MYOF may have an important role in tumorigenesis. 38 Myoferlin was overexpressed in a canine prostate cancer cell line 60 and feline mammary cancers and cell lines. 30 To the authors’ knowledge, the expression of MYOF has not been previously investigated in canine thyroid cancer. Vascular endothelial growth factor, a proangiogenic factor, is mitogenic for vascular endothelial cells, secreted by cancer cells, and plays an important role in tumor angiogenesis through binding to its receptor, FLT1. 25
The role of PDGFR has been previously investigated in the pathogenesis of human thyroid cancer 28 and was reported to be expressed in canine thyroid carcinomas. 68 We found increased PDGFRα and PDGFRβ mRNA in CTAC and FTCs, respectively, when compared with normal thyroid.
Fibronectin 1 (FN1) is overexpressed in human anaplastic thyroid cancer and regulates cell adhesion, migration, and invasion. 63 Interestingly, we report overexpression of FN1 mRNA in all groups (FTC, CCTC, and CTAC) but especially in FTCs, where several neoplasms had greater than 100-fold overexpression of FN1. To our knowledge, this is the first study to show that FN1 mRNA expression is greater in canine thyroid carcinomas compared with normal thyroid. FN1 mRNA expression may be a marker for canine thyroid cancer aggressiveness.
In conclusion, a novel model of canine thyroid cancer was developed in nude mice. Canine and mouse models of canine thyroid cancer will be valuable in preclinical studies of antioncogenic compounds and to translate research findings from the laboratory to human relevance. Gene expression of important invasion and metastasis genes was identified in FTCs and CCTCs. The thyroid cancer genes identified in this study inform the pathogenesis of thyroid cancer in dogs and guide the development of novel therapeutics. The protein products of these genes warrant further study.
Footnotes
Acknowledgements
We thank Dr Holly Borghese and Ms Emily Kuhn for invaluable assistance in the collection of canine thyroid carcinoma tissues at the Ohio State Veterinary Biospecimen Repository, which is supported by the National Institutes of Health (UL1TR001070). We thank Alan Flechtner and Anne Saulsbery for tissue processing and preparation of slides. We thank Dr Tea Meulia for technical assistance in transmission electron microscope and Tim Vojt for assistance with figures.
Declaration of Conflicting Interests
The authors declared no potential conflict of interest with respect to the research, authorship, and/or publication of this article.
Funding
The authors disclosed receipt of the following financial support for the research, authorship, and/or publication of this article: This work was funded through a grant from the Development Research Program (DRP) of the Specialized Program of Research Excellence (SPORE) grant (CA168505) from the National Institutes of Health and by the Ministry of Higher Education and Scientific Research, Egypt.
References
Supplementary Material
Please find the following supplemental material available below.
For Open Access articles published under a Creative Commons License, all supplemental material carries the same license as the article it is associated with.
For non-Open Access articles published, all supplemental material carries a non-exclusive license, and permission requests for re-use of supplemental material or any part of supplemental material shall be sent directly to the copyright owner as specified in the copyright notice associated with the article.