
Abstract
Bone marrow (BM) cytology and histopathology are complementary tools used to investigate hematological diseases. The purpose of this study was to determine if there are site-dependent differences in the diagnostic quality, myeloid to erythroid ratio (MER), and discordant findings in samples from different sites in the same dog. Eighteen apparently healthy dogs were used in the study. The sequence of sample acquisition was randomized according to a Latin square, and samples for BM cytology and histology were collected from both humeri and both ilial crests immediately after death. Board-certified clinical and anatomical pathologists read the cytology and histology, respectively. The data were analyzed using a mixed-effect model. The site of BM acquisition did not affect BM sample quality. The rate of discordant clinical findings between sites was 0.05 (95% confidence interval, 0.01–0.13). In general, by cytology, the MERs were slightly but significantly greater in samples from the ilial crests than from the humeri (P = .01). The measured MER for histology was nearly twice that for cytology for all sites (P < .001). In conclusion, there was a low-rate, site-dependent discordance in diagnostic findings in BM samples and differences in MER between the ilial crest and the humerus. A similar study is justified in sick dogs with hematological disease to determine the effect of sampling site on discordant findings between sites.
Bone marrow (BM) cytology and histopathology are common and essential diagnostic tools for the evaluation and monitoring of hemopoietic dyscrasias and neoplasms. 18,27 Bone marrow fine-needle aspirate and core biopsies are typically taken unilaterally from either the proximal humerus or iliac crest of dogs based on clinician preference. 8,9,13,22,26 This inconsistent method of sampling site selection, however, relies on the assumption that hematopoietic dyscrasias or hemic neoplastic disorders are distributed uniformly throughout the patient’s BM. This supposition is based on similarities of selected BM indices from different anatomical sites from healthy dogs. 19 However, there is conflicting evidence regarding the consistency between sampling sites with regard to BM cellularity, specific stages of myeloid and erythroid precursors, and the myeloid to erythroid ratio. 20,25 If the conjecture that the BM has the same composition across sampling sites is inaccurate, certain conditions—for example, BM aplasia, hypoplasia or dysplasia, and myelofibrosis—might be misdiagnosed while other conditions such as hemic neoplasia might be missed.
In theory, there could be several reasons why the BM would not have the same composition across the different sampling sites. For example, previous studies indicated that there are differences in perfusion of the axial and appendicular skeleton. 10,16,24 Differential blood supply to the axial and appendicular skeleton could affect the oxygen tension in the BM. The oxygen tension is one of a few factors that regulate BM hematopoiesis. Therefore, differences in BM oxygen tension can lead to anatomical differences in BM content. In support of that hypothesis, magnetic resonance imaging (MRI) scans of the axial skeleton of people and dogs indicate differences in BM fat content throughout the axial skeleton. 3,20 The presence of nearby inflammation may also affect BM composition. Clinical and experimental observations indicate the presence of MRI lesions in the subchondral BM of people with rheumatoid arthritis, as well as people and dogs with chronic osteoarthritis, respectively. 5,15,17 Therefore, sampling BM from anatomical sites adjacent to joints (such as the proximal humerus) with chronic osteoarthritis or other local inflammatory conditions could alter the interpretation of the BM. Variation in the degree to which weight-bearing forces are applied to the different sampling sites is a further potential cause of differences in BM composition. The iliac crest, in comparison to the humerus, is nonarticular and not exposed to articular forces that might alter BM morphology.
The rationale for this study was that demonstration (or elucidation) of differences in BM composition in healthy dogs would justify a clinical study in dogs with hematologic diseases to determine if sampling site differences are clinically important. Therefore, the hypothesis was that there are site-dependent differences in BM composition. Consequently, the aims of the study were to compare selected cytological and histological BM indices, BM quality, and presence of discordant findings among 4 anatomical sites.
Materials and Methods
Timeline
Between May 2015 and May 2016, we prospectively recruited 18 dogs into a randomized and blinded study of canine BM obtained by fine-needle aspiration and core biopsy from 4 different anatomical sites. Inclusion criteria were that the dog was apparently healthy at presentation and was being humanely euthanized under local council bylaw for reasons unrelated to physical health. Dogs were excluded from the study if the authors could not obtain blood for a complete blood count prior to euthanasia or if the authors could not acquire concurrent BM fine-needle aspirates and core biopsies from each of the predetermined anatomical sampling sites. The Massey University Animal Ethics Committee approved the study (MUAEC protocol 15/28).
The descriptive statistics of 18 dogs included in the study are summarized in Supplemental Table S1. Sex was determined based on physical examination of the cadaver. The dogs’ ages were unknown; however, based on the physical examination of the dogs, there were no identifiably juvenile or geriatric dogs. The predominant physical characteristics of the dogs were used to determine breed. The median body weight of the dogs was 20 kg (range, 7.6–36 kg). Bone marrow samples were collected from each dog at 4 locations.
Study Design
Immediately prior to euthanasia, blood was collected into 2-ml EDTA tubes (BD Vacutainer; BD, Auckland, New Zealand) via venipuncture of the cephalic vein. Immediately after euthanasia, cytological BM samples were collected from both the humeri and the iliac crests. After completing the collection of the cytological samples, the samples for histology were collected. For each dog, the sequence of the acquisition of the samples of bone marrow cytology and histology was random according to a Latin square design (Fig. 1). Sampling of all sites was under 45 minutes from the beginning to the end. A veterinary diagnostic laboratory (IDEXX/New Zealand Veterinary Pathology, Palmerston North, New Zealand) performed complete blood counts with a manual differential count within 45 minutes of blood collection.
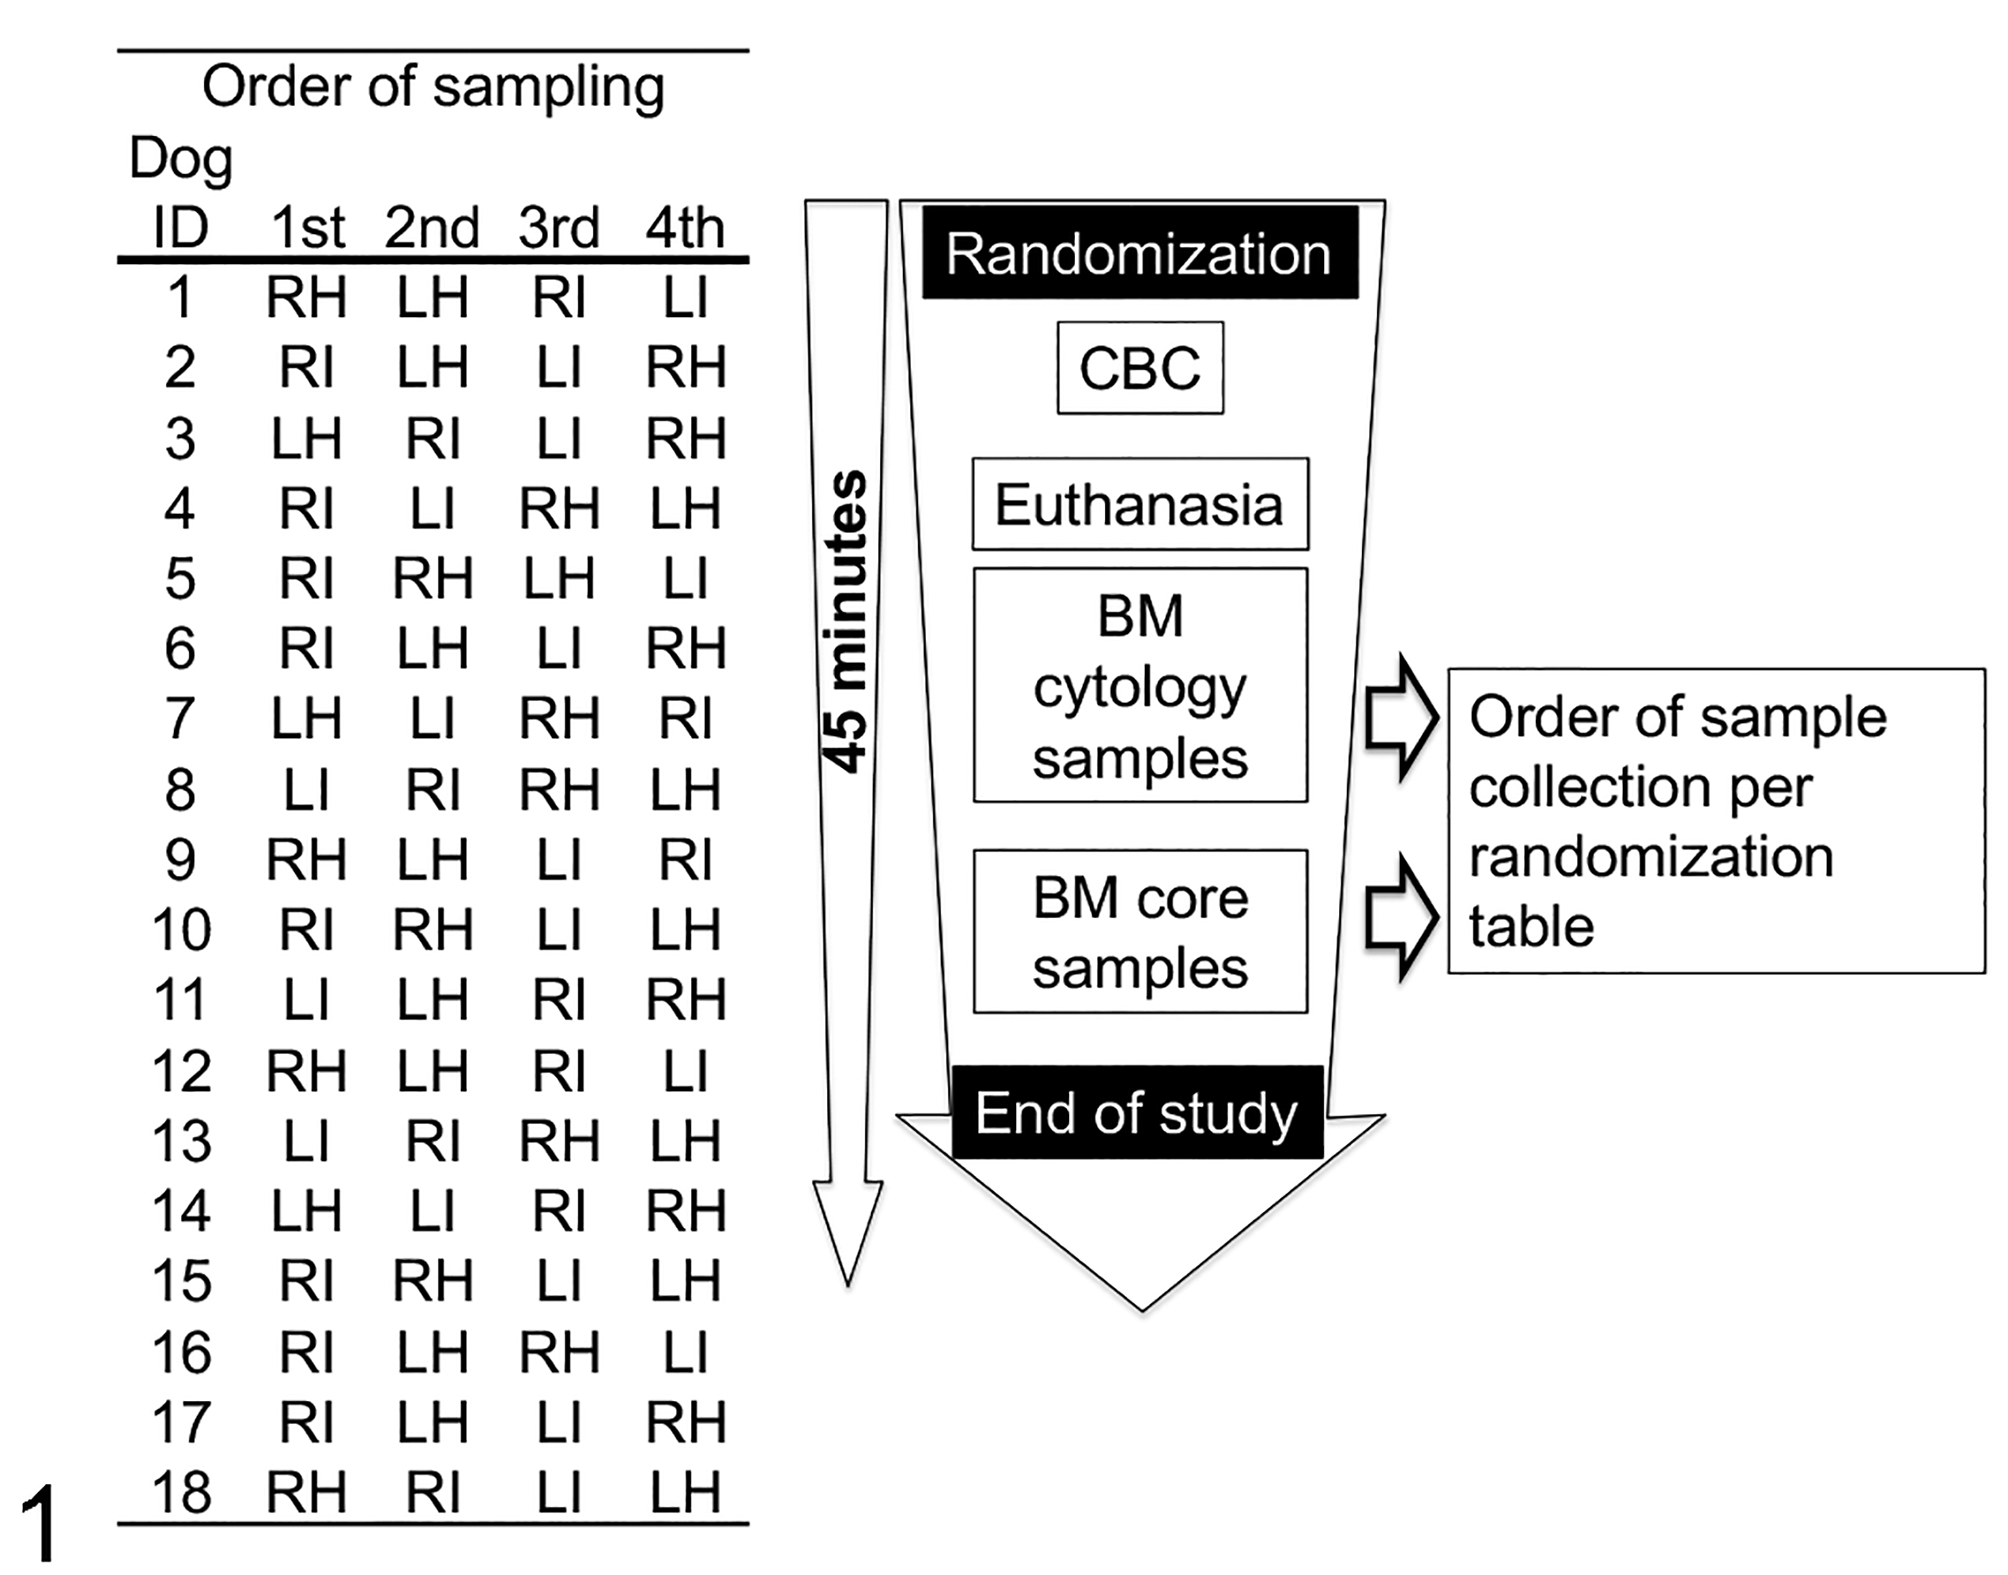
Randomization table for determining the bone marrow sampling site and the study design timeline. BM, bone marrow; CBC, complete blood count; LH, left humerus; LI, left ilium; RH, right humerus; RI, right ilium.
Acquisition of BM Cytologic and Histologic Samples
Samples were acquired from both sides of the widened cranial dorsal aspect of the iliac crest and the flat area on the craniolateral surface of the proximal humerus lateral and distal to the greater tubercle. 8,13 The needle was inserted into the iliac crest, parallel to the long axis of the wing of the ilium after performing a small stab incision in the skin. 8,13 In contrast, the orientation of the needle at the proximal humerus was perpendicular to its craniolateral surface. 8
The authors used 16-gauge × 2.688-in. Illinois sternal-iliac BM aspiration needles (Illinois sternal-iliac BM aspiration needle; BD) and 11-gauge × 4-in. Jamshidi BM core biopsy needles (Jamshidi BM core biopsy needles; BD) to acquire BM cytology samples and biopsy cores, respectively. Prior to acquisition of BM samples for cytology, the aspiration needles were flushed with 4% potassium citrate (Citra-Lock 4%; Dirinco, Ketelmeer, The Netherlands). When the needle was in the BM, the stylet was removed and a 20-ml syringe was attached. Negative pressure was applied by pulling the plunger backward until a small volume of BM appeared in the syringe. Following disconnection of the aspiration needle from the syringe, a drop of a citrated anticoagulated BM was smeared on a clean glass slide. The BM smears were allowed to dry spontaneously. In the case of the BM cores for histology, the authors grossly inspected the cores at the time of their acquisition and determined their quality. If a sample was deemed unsatisfactory, the authors repeated the procedure up to 3 times.
Sample Processing
A veterinary diagnostic laboratory stained the cytology slides with Wright-Giemsa stain. After the BM tissue cores underwent fixation in 10% buffered formalin for at least 24 hours and decalcification with 5% aqueous solution of EDTA disodium salt dihydrate for 24 hours, a veterinary histology laboratory processed the formalin-fixed decalcified BM core biopsies, embedded them in paraffin wax, sectioned 3-μm thick histological sections, and stained each with hematoxylin and eosin, periodic acid–Schiff (PAS), Giemsa, and Perl’s stains. Board-certified clinical (A.L.M.) and anatomical (A.G.) pathologists read the cytology and histology, respectively, without knowledge of the findings of the other method.
Bone Marrow Cytologic Interpretation
Cytology samples were scanned at low magnification (10× objective lens) to evaluate the quality of the smear, the quantity of BM spicules and hematopoietic precursors, and the presence of iron stores (as evident from blue-black pigment accumulation). Iron stores were recorded as absent, rare, scant, or adequate and were assigned a numerical value (0, 1, 2, or 3, respectively). The number of megakaryocytes present in 2 sets of 10 random 10× microscopic fields was averaged to give an estimate of the number of megakaryocytes in the sample. Cytology sample quality was subjectively rated as inadequate, poor, fair, good, or excellent based upon the presence of BM spicules (none, rare, low numbers, or adequate numbers of spicules) and the ability to assess differences in cellular morphology (Suppl. Figs. S1–S10). In cellular cytology samples with adequate cellular morphology, 500 hematopoietic precursors were differentially counted at high magnification (100× objective lens) into 7 subsets: (1) immature erythroid (rubriblasts and prorubricytes), (2) mature erythroid (basophilic rubricytes, polychromatophilic rubricytes, and metarubricytes), (3) immature myeloid (myeloblasts and promyelocytes), (4) mature myeloid (myelocytes, metamyelocytes, bands, and segmented granulocytes), (5) lymphoid, (6) plasmacytoid, and (7) histiocytic precursors. One to 3 slides from each site were used to complete the 500-cell differential counts. Five 100-cell differential counts were performed at different areas of the slides. Cells included in the counts were located as close to BM spicules as possible. To calculate the myeloid to erythroid ratio, we divided the myeloid subsets (early myeloid and mature myeloid) by the erythroid subsets (early erythroid and mature erythroid). The number of mitotic figures per 500 hematopoietic precursors was recorded. All cell lines were evaluated for complete and orderly maturation.
Bone Marrow Histologic Interpretation
Histology samples were scanned at low magnification (1.25×) to evaluate the quality of the core biopsy (Suppl. Figs. S11–S18). The core biopsy was considered to have an excellent quality if the core included the cortical and trabecular bones with intact intertrabecular spaces containing BM elements interspersed between the trabecular bones. 1
PAS-stained slides were used for the manual cell counts. Morphometric software (ImageJ 1.49v; National Institutes of Health, Bethesda, MD) was used to calculate the percentage of BM cells relative to BM cells and adipose tissue. In brief, images of representative intact intertrabecular spaces were taken at a 10× magnification. The images were saved in a tiff format and then changed into 16-bit. Then, the image threshold was manually adjusted on the red channel to achieve maximal separation between the BM adipose tissue and the BM cells. The measurement tool was used to calculate the percentage of BM cells in a manually outlined region of interest.
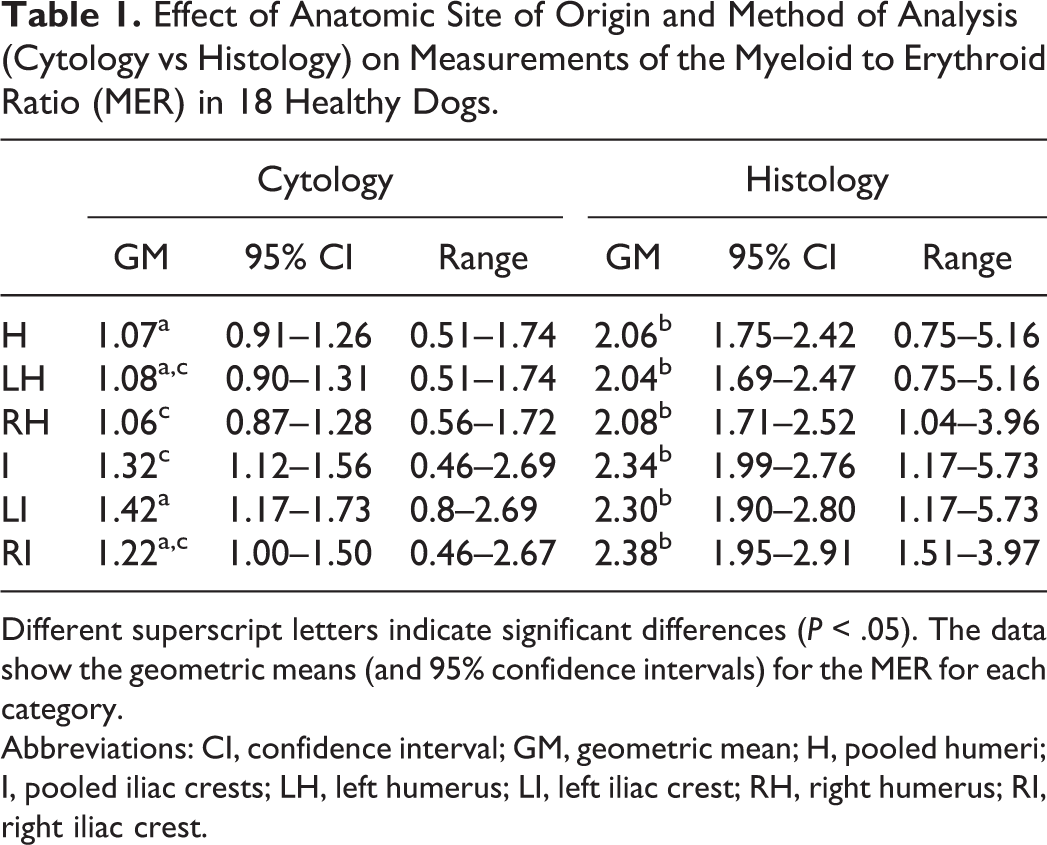
The number of megakaryocytes was estimated in the sample by counting the total number of megakaryocytes present in 10 random 40× microscopic fields (area per field of 0.237 mm2). Five hundred hematopoietic precursors were differentially counted at high magnification (100× objective lens) into 7 subsets: (1) immature erythroid (rubriblasts and prorubricytes), (2) mature erythroid (rubricytes and metarubricytes), (3) immature myeloid (myeloblasts and promyelocytes), (4) mature myeloid (myelocytes, metamyelocytes, bands, and segmented granulocytes), (5) lymphoid, (6) plasmacytoid, and (7) other cells that did not fall in any of the above categories (Figs. 2–3). To calculate the myeloid to erythroid ratio, we divided the myeloid subsets (early myeloid and mature myeloid) by the erythroid subsets (early erythroid and mature erythroid). The number of mitotic figures per 500 hematopoietic precursors was recorded. All cell lines were evaluated for complete and orderly maturation. The BM iron content was quantified by counting the total number of iron-positive particles per ten 40× fields (Perl’s stain).
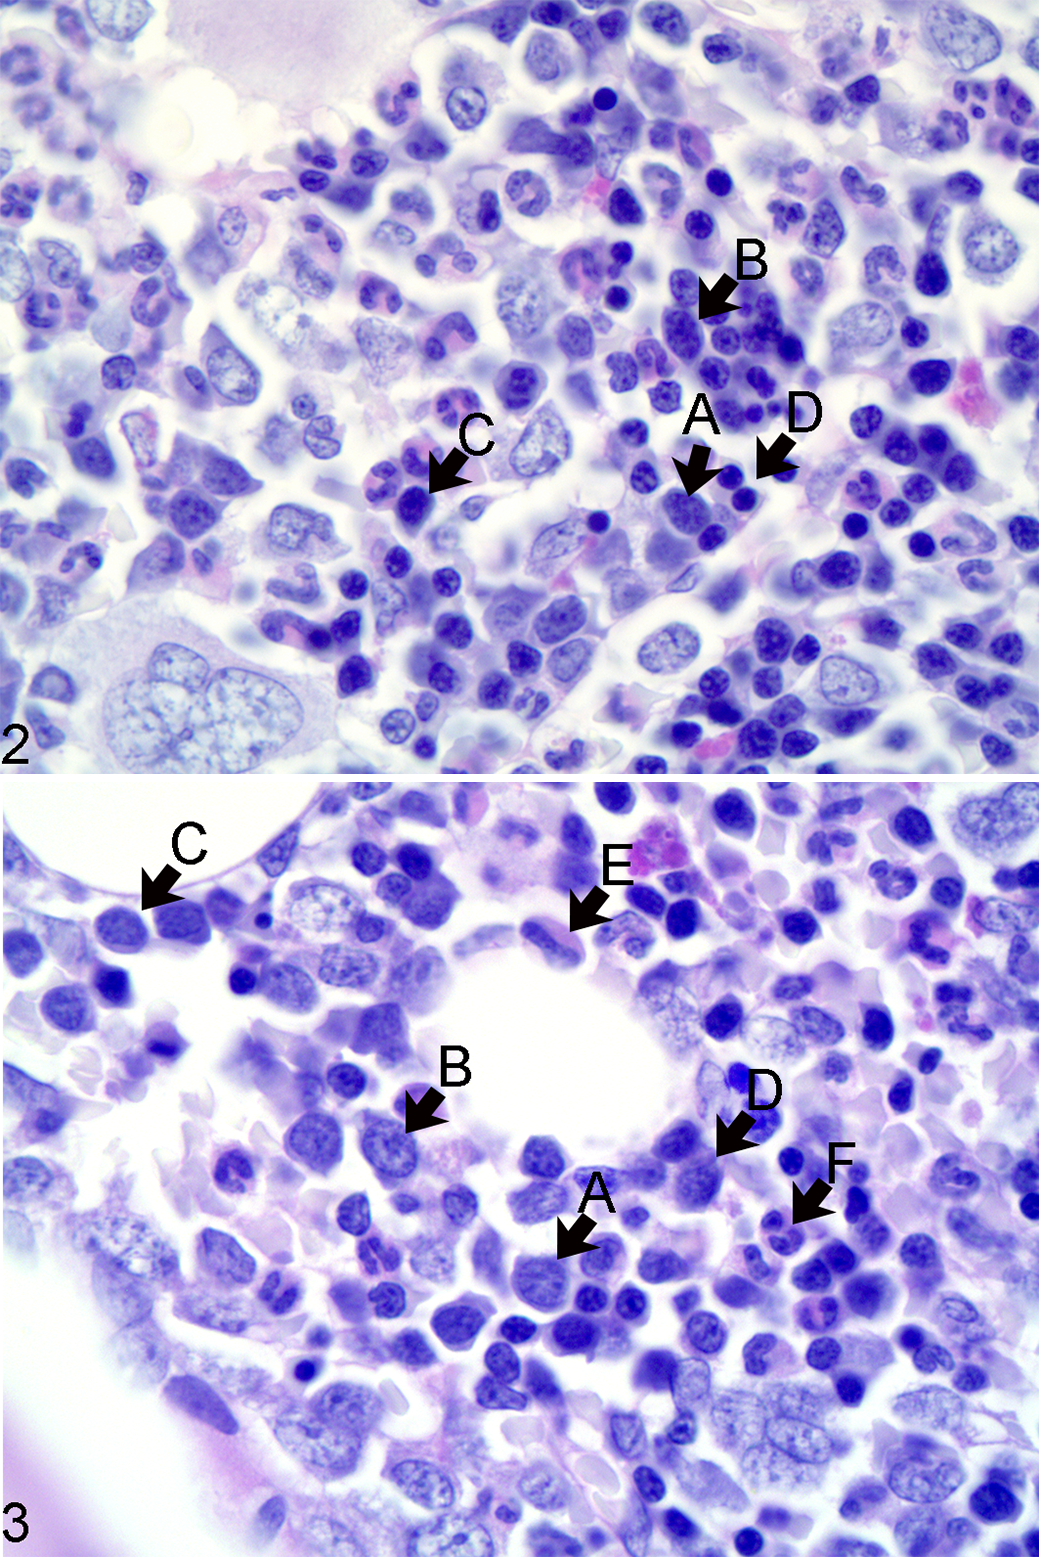
Erythroid and myeloid precursor subsets, bone marrow, left iliac crest, dog. Figure 2. The rubriblast (A) has a large nucleus with fine reticular chromatin, a small basophilic nucleolus, and small rim of lightly basophilic glassy cytoplasm. The prorubricyte (B) has a large nucleus with fine to coarse reticular chromatin, inconspicuous nucleolus, and small amounts of glassy basophilic cytoplasm. The rubricyte (C) has a medium-sized nucleus with clumped chromatin and small to moderate amounts of glassy basophilic cytoplasm. The metarubricyte (D) has a small round nucleus with clumped to condensed chromatin and small to moderate amounts of glassy basophilic cytoplasm. Figure 3. The myeloblast (A) has fine vesicular chromatin with few small basophilic nucleoli and small amounts of pale basophilic cytoplasm. The promyelocyte (B) has fine vesicular chromatin and small amounts of pale basophilic cytoplasm and a hint of eosinophilic hue. The myelocyte (C) has a smaller nucleus with fine vesicular to clumped chromatin and larger amounts of pale basophilic to eosinophilic cytoplasm. The metamyelocyte (D) has a smaller polygonal nucleus with clumped chromatin and moderate amounts of pale eosinophilic faintly granular cytoplasm. The band neutrophil (E) has a horseshoe-shaped thick nucleus with clumped chromatin and moderate amounts of faintly granular and eosinophilic cytoplasm. The segmented neutrophil (F) has a nucleus consisting of 3 or more segments of clumped chromatin and moderate amounts of faintly granular and eosinophilic cytoplasm. Histologic section, periodic acid–Schiff reaction.
The sections were scanned and uploaded to a web-based open-access teaching platform and are available with no restrictions for use (see Suppl. Table S2 for hyperlinks and metadata).
Statistical Analysis
A priori power sample size analysis estimated that a sample size of 22 dogs would be required to detect a 25% difference between the highest and lowest values of repeated measures of BM myeloid to erythroid ratio (MER) within the same dog with a correlation of 0.6, α value of 0.05, and power of 0.8.
The authors (N.L.-V., J.C.M., and A.G.) used the lme4 package 2 of R version 3.4.2 21 to perform analyses of variance for the dependent variables (quality scores, MER, and overall diagnosis) with a linear mixed model that included the fixed effect of site of acquisition of BM samples and the random effect of dog to account for repeated measures from the same dog. Effects of sequence of sampling, sex, weight, and the interaction between sequence and method (ie, cytology vs histology) were not significant, and therefore these factors were not included in the model. We determined the final model based on Akaike’s information criterion between models. Least squares means and standard errors for the site of acquisition of BM samples were compared using Tukey’s test pairwise comparisons. We used the Fisher exact binomial test to estimate the error rate for the cytologic and histologic evaluation of BM samples. The histologic MER variable did not follow a normal distribution and was analyzed after a natural logarithm transformation. Back transformation of the mean on the transformed scale was done by taking the antilog of the geometric mean. 4 Since this method cannot be applied to the standard error, we back-transformed the confidence intervals and reported the geometric mean with its 95% confidence intervals. 4
Results
Effect of Anatomic Site on Bone Marrow Quality
Of the 72 samples evaluated cytologically, 62 were adequately cellular and cell morphology was sufficiently intact for a 500-cell differential count to be performed. Of these 62 samples, 16 were excellent, 26 were good, 14 were fair, and 6 were of poor quality. A 300-cell differential count was performed for 5 samples; 2 were poor and 3 samples were of inadequate quality. No differential count was recorded for the remaining 5 samples, all of which were of inadequate quality. Of the 72 samples evaluated histologically, 64 were adequately cellular for a 500-cell differential count to be performed. Of these 64 samples, 33 were excellent, 10 were good, and 21 were fair. Details of the differential counts and scores are given in Supplemental Table S3.
The site of acquisition of BM samples did not contribute to differences in the BM cytological and histological normalized quality scores (P = .2, P = .99, respectively). For histology, the percent BM cellularity and BM iron content were not associated with the BM normalized quality scores (P = .99, P = .894), while the BM megakaryocyte numbers did (P < .01). For cytology, the BM cellularity were not associated with the BM normalized quality scores (P = .06), while both the BM megakaryocyte numbers and BM iron content did (P < .001). Also, there were no differences in the BM quality score between cytology and histology (P = .29).
Effect of Anatomic Site on MER
The 10 cytology and 8 histology samples that lacked a 500-cell differential count were considered nondiagnostic and were not included in further statistical analyses.
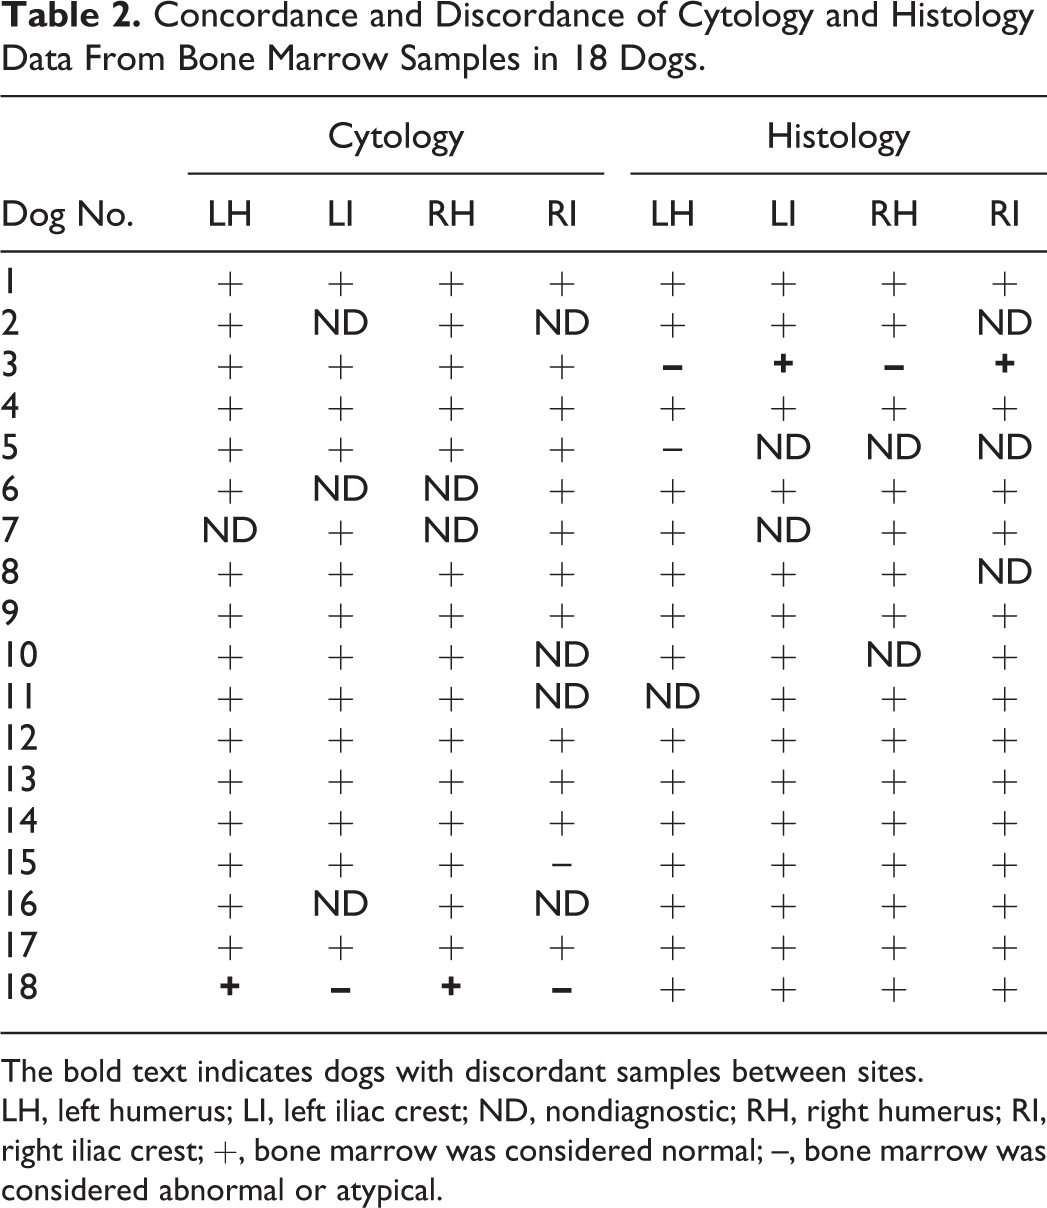
There were statistically significant differences in the least squares means of the log-transformed MER between the cytology and histology samples (P < .001) and between anatomical sites (P = .02). In general, the geometric means (derived from back transformation of the log-transformed MER) of the histologic MER were greater than the geometric means of the cytologic MER (Table 1), and the percentages of immature cells were higher based on histology than on cytology. Also, the geometric means of the MER from the iliac crest were greater than the geometric means of the MER from the humeri.
Effect of Anatomic Site of Origin and Method of Analysis (Cytology vs Histology) on Measurements of the Myeloid to Erythroid Ratio (MER) in 18 Healthy Dogs.
Different superscript letters indicate significant differences (P < .05). The data show the geometric means (and 95% confidence intervals) for the MER for each category.
Abbreviations: CI, confidence interval; GM, geometric mean; H, pooled humeri; I, pooled iliac crests; LH, left humerus; LI, left iliac crest; RH, right humerus; RI, right iliac crest.
The pairwise comparisons of the least squares means of the log-transformed MER indicated differences in cytology between the left iliac crest and right humerus (P = .04), as well as between the left humerus and iliac crest (P = .07). The pairwise comparisons of the least squares means of the log-transformed histologic MER between sites did not differ significantly. When we pooled the humeri and iliac crests, there was a significant difference in the cytologic log-transformed MER between the humeri and iliac crests (P = .01) but not for the histologic log-transformed MER.
The pairwise comparisons of the least squares means of the log-transformed MER between cytology and histology for each site differed significantly (left humerus, P < .001; left iliac crest, P < .001; right humerus, P < .001; right iliac crest estimate, P < .001).
The Effect of Site on Discordant Cytologic and Histologic Samples
Two dogs with cytologic BM samples and 1 other dog with histologic BM samples had at least 1 site that was discordant with the other sites (Table 2). In the cases of the discordant cytology samples, all had an MER within reference intervals and hematopoietic cell maturation was considered complete, but low numbers of atypical (large) metamyelocytes were observed. In the case of the discordant histologic sample, there was an unexplained increase in the ratio of immature to mature myeloid cells.
Concordance and Discordance of Cytology and Histology Data From Bone Marrow Samples in 18 Dogs.
The bold text indicates dogs with discordant samples between sites.
LH, left humerus; LI, left iliac crest; ND, nondiagnostic; RH, right humerus; RI, right iliac crest; +, bone marrow was considered normal; –, bone marrow was considered abnormal or atypical.
In the mixed-effect model, the factor “site” did not have a statistically significant effect on the presence of discordant samples (P = .92). Also, cytology vs histology did not have a significant effect on the presence of discordant samples (P = .16). The cytology and histology error rates were calculated under the assumption that all dogs were healthy and should not have any morphologic abnormalities in hematopoietic precursors. We found that the cytology error rate was 0.05 (95% confidence interval [CI], 0.01–0.13). Similarly, the histology error rate was 0.05 (95% CI, 0.01–0.13).
The Effect of Stain on the Evaluation of Histologic Bone Marrow Smears
The authors considered that they achieved the best differentiation between myeloid and erythroid precursors with PAS reaction (Figs. 4–9). With PAS, the myeloid nucleus is much lighter than the erythroid nucleus, and the cytoplasm of the myeloid lineage has a faint granular light pink hue in contrast to the glassy basophilic appearance of the erythroid lineage.
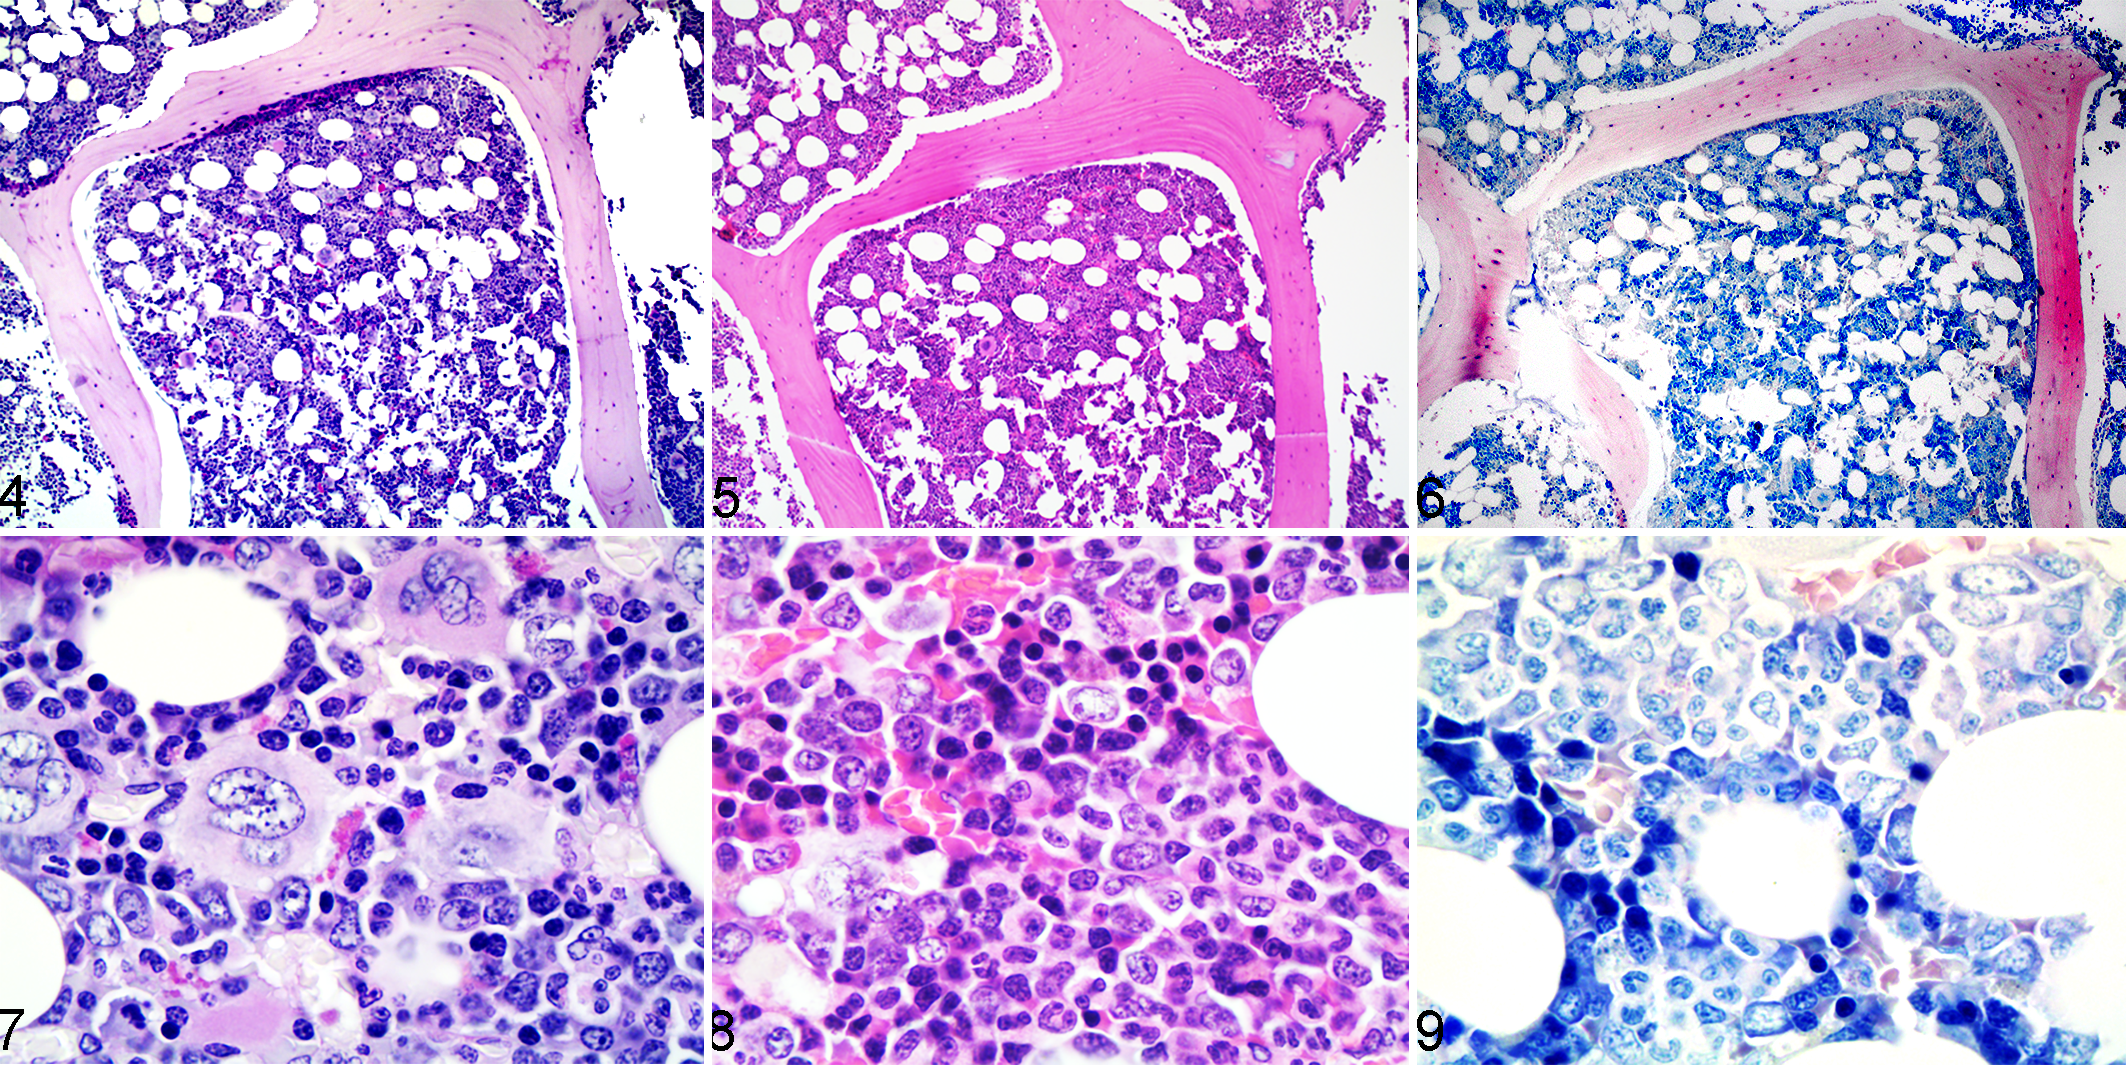
Normal bone marrow histology, right humerus, dog. Figures 4 and 7. Periodic acid–Schiff. Figures 5 and 8. Hematoxylin and eosin. Figures 6 and 9. Giemsa.
Discussion
In this study, we hypothesized that site-dependent differences in BM composition would be present and aimed to compare selected cytological and histological BM indices, BM quality, and presence of discordant findings among 4 anatomical sites. Consequently, we found a significant difference in the MER (specifically, the least squares means of the log-transformed MER) between the left iliac crest and right humerus for cytology. In addition, we found that the histological MER was nearly twice that for cytology for all sites. Although the differences in MER observed between sites were not clinically relevant, it remains to be determined if substantial site differences exist in sick dogs.
The MER is one of the major components in cytologic and histologic assessment of BM. The reported MER of healthy dogs varies among prior studies, with some listing a reference interval of 0.9 to 1.8 11,22 and others of 0.75 to 2.53. 12,14 The cytologic MER in the current study fell within the reported range for dogs, but the histologic MER exceeded that range and was approximately twice the cytologic MER (Table 1). To our knowledge, there has not been a distinction between cytologic and histologic MER in the literature. Previously reported reference intervals were based on cytology and have been used interchangeably between cytology and histology. 11,12,14,22 While we cannot exclude that the differences between histology and cytology might reflect interoperator variation either due to the methodology or the operator, we considered 2 explanations that could account for the significant differences in MER between cytology and histology. First, in histologic BM preparation, the spatial relationship between myeloid and erythroid precursors remains intact. In contrast, in cytologic preparations, there are multifocal aggregates of individualized BM precursors present. Differences in the spatial arrangement of hematopoietic cells between histology and cytology could affect cell counts and the calculated MER. For example, it is thought that myeloid precursors are more closely associated with BM spicules than erythroid precursors in cytologic samples. Cells trapped within spicules are not routinely counted in a cytologic differential count due to the inability to accurately assess cellular morphology in thick areas of slides. This would effectively decrease the MER in cytology samples compared to histology samples. Second, the resolution of cellular detail in cytology surpasses that achieved in histology. It may be that inaccuracies in the histologic identification of individual cells skew the histologic MER. However, the authors found that PAS staining of histology samples allowed for excellent characterization of individual cell types. It is of note that in our study, the MERs were proportionally similar between histology and cytology at each site despite the differences in the absolute counts of myeloid and erythroid cells (Table 1).
According to our results, the MER in the iliac crest (flat bone) is higher than that of the humerus (long bone) (Table 1). As mentioned above, the bones and possibly BM at different sites are subjected to different mechanical forces and differences in blood supply. 7,10,16,24 The forelimbs proportionally carry a larger weight than the hindlimbs; hence, the proximal humerus is subjected to a larger dynamic load than the iliac crest. 6,23 In contrast, the iliac crest is nonarticular but is loaded via the anchorage of the associated cranial pelvic muscles. These effects in the bone could affect the BM. We postulate that these dynamic changes affect the microenvironment in which the BM hematopoietic cells are present and account for the observed differences in MER in this study.
We used a mixed-effect model to test if the anatomical site had an effect on the overall assessment of the BM as normal or abnormal. We found that the site of BM acquisition was not associated with the presence of discordant samples. However, at the level of the individual animal, 3 dogs were discordant for both cytology and histology (ie, differing cytologic and histologic diagnoses of normal vs abnormal/atypical; Table 2). Two possible reasons for why this occurred are operator errors and the quality of the samples, both of which could in theory affect the overall diagnosis.
In line with the above, we calculated the observed operator error rate for cytology and histology under an assumption that all anatomical sites from which we harvested the BM had a normal BM in all dogs. For cytology, no overt evidence of disease was noted in any of the diagnostic samples; however, samples were characterized as abnormal if any cellular atypia was observed. For histology, no overt evidence of disease was noted in any of the diagnostic samples, but samples were characterized as abnormal if there was an unexplained increase in the ratio of immature to mature myeloid precursor relative to the peripheral complete blood count. We found that for both cytology and histology, the error rate was 0.05 (95% CI, 0.01–0.13). The resulted calculated error rate was higher than anticipated given that the dogs were apparently healthy. It may indicate that acquisition of samples from more than 1 anatomical site would increase the diagnostic accuracy of BM analysis.
We then looked at the quality of the core biopsies and found that the anatomical site of BM acquisition did not have an effect on the modified BM quality score. A previous study found a significant correlation between the histologic quality of BM core biopsies and BM density, cellularity, and megakaryocyte numbers. 1 In our study, we calculated the percent BM cellularity via morphometric software, and it is expected to be similar to the combination of density and cellularity from the previous study. In contrast to the previous study, the percent BM cellularity (histology) and BM cellularity (cytology) were not significantly associated with the BM-modified quality score (however, the cytologic BM cellularity was approaching statistical significance). In agreement with that study, the BM megakaryocyte number was significantly correlated with the BM-modified quality score for both cytology and histology. We also found that the BM iron content was significantly correlated with the cytological BM-modified quality score.
Megakaryocytes are often closely associated with spicules of BM. In cytologic samples with few BM spicules, relatively low numbers of megakaryocytes are expected. Since the number of spicules was used as a criterion for grading the quality of the samples, it is not surprising that the numbers of megakaryocytes were positively associated with the quality of the BM in this study. The same explanation can be applied to the positive association between iron and BM quality because iron stores are only readily apparent within BM spicules in cytology samples. In histology samples, iron is observed within macrophages throughout the sample. The more even and dispersed distribution of iron in histologic compared to cytologic samples is likely the reason that an association between iron and BM quality was not observed in the histological preparations.
Conclusion
In normal dogs, there were small, clinically insignificant site differences in the MER. This suggests that bone marrow precursors may not be uniformly distributed within the different hematopoietic sites. It is unknown if these differences could become clinically significant in ill patients. Additional studies are warranted to determine if collection of bone marrow samples from multiple sites is warranted in patients with evidence of hematopoietic disease. Also, substantial differences were identified in this study between the cytological and histological MER of apparently healthy dogs.
Supplemental Material
Supplemental Material, DS1_VET_10.1177_0300985818780469 - The Site of Bone Marrow Acquisition Affects the Myeloid to Erythroid Ratio in Apparently Healthy Dogs
Supplemental Material, DS1_VET_10.1177_0300985818780469 for The Site of Bone Marrow Acquisition Affects the Myeloid to Erythroid Ratio in Apparently Healthy Dogs by Arnon Gal, Richard K. Burchell, Andrew J. Worth, Nicolas Lopez-Villallobos, Jonathan C. Marshall, and Amy L. MacNeill in Veterinary Pathology
Footnotes
Acknowledgement
This work was supported by the New Zealand Companion Animal Health Foundation Project Grant of the New Zealand Veterinary Association. Preliminary results were presented at the European College of Veterinary Medicine Annual Meeting in Malta 2017.
Declaration of Conflicting Interests
The author(s) declared no potential conflicts of interest with respect to the research, authorship, and/or publication of this article.
Funding
The author(s) received no financial support for the research, authorship, and/or publication of this article.
Supplementary material for this article is available online.
References
Supplementary Material
Please find the following supplemental material available below.
For Open Access articles published under a Creative Commons License, all supplemental material carries the same license as the article it is associated with.
For non-Open Access articles published, all supplemental material carries a non-exclusive license, and permission requests for re-use of supplemental material or any part of supplemental material shall be sent directly to the copyright owner as specified in the copyright notice associated with the article.