
Abstract
Qualitative histopathology is the gold standard for routine examination of morphological tissue changes in the regulatory or academic environment. The human eye is exceptional for pattern recognition but often cannot detect small changes in quantity. In cases where detection of subtle quantitative changes is critical, more sensitive methods are required. Two-dimensional histomorphometry can provide additional quantitative information and is quite useful in many cases. However, the provided data may not be referent to the entire tissue and, as such, it makes several assumptions, which are sources of bias. In contrast, stereology is design based rather than assumption based and uses stringent sampling methods to obtain accurate and precise 3-dimensional information using geometrical and statistical principles. Recent advances in technology have made stereology more approachable and practical for the pathologist in both regulatory and academic environments. This review introduces pathologists to the basic principles of stereology and walks the reader through some real-world examples for the application of these principles in the workplace.
The role of the pathologist in the research and regulatory environment is ever changing. The human eye is great for pattern recognition, and qualitative evaluation of tissue sections by a trained pathologist is the gold standard for routine diagnostic, experimental, and regulatory toxicology studies. However, small differences in cell or particle density are often below the sensitivity of the human eye and, depending on the tissue, the difference must be at least 25% to 40% before it can be appreciated. In a previous study, a 33% reduction in total hippocampal neuron number was not detected by pathologists, even with side-by-side photomicrographs. 3 To obtain additional quantitative information about a tissue or structure, histomorphometric methods can be used. With these methods, measurements or counts are performed on single or multiple 2-dimensional (2D) tissue sections, often with the aid of computer-assisted image analysis. This can give the pathologist valuable information on particle density or percentage of positive immunohistochemical staining within a tissue. However, these methods make assumptions about the tissue that are sources of bias and therefore have limitations. Conversely, stereology is design based and does not make assumptions about the tissue, which reduces bias. Stereology provides 3-dimensional (3D) estimates about the tissue or structure of interest through rigid sectioning and sampling methods based on statistical principles and stochastic geometric theory.
Recent advances in technology and stereological theory have made stereology more approachable and efficient. The pathologist has a unique role in the design and implementation of these studies in that we have extensive knowledge of tissue histology, responses to injury, pathophysiology, and effects of fixation and processing. The objective of this review is to provide the pathologist with a basic introduction to the principles of stereology as well as to give examples of the pathologist’s role in its applications in regulatory and academic environments.
Unique Role of Pathologists in Stereology Studies
As pathologists, we have the opportunity to play a unique role in studies using stereological analysis. We have superior knowledge of normal histology and tissue reactions to injury that can aid in study design as well as data capture and analysis. The pathologist’s knowledge of underlying pathophysiology and disease mechanisms can aid decision making of principal investigators by providing guidance on the best way to quantify tissue changes. Histopathology remains the gold standard in tissue evaluation, and pathologists should embrace these quantitative techniques as a complement to histopathology evaluation, rather than viewing them as a possible replacement. Pathologists should understand the principles and applications of stereology to counsel toxicologists, clinical researchers, or clients on the best way to reach a desired end point. Pathologists should be involved from the beginning of the study design process to ensure that adequate statistical power is present in the study, that additional animals to be used for pilot studies are included if needed, and that tissues are collected, fixed, and sampled appropriately at necropsy and beyond.
Basic Principles of Unbiased Stereology and Application to Study Design
In contrast to 2D methods, stereology is design based (rather than assumption based) and therefore unbiased (accurate). Statistically speaking, unbiased methods, on average, yield estimates that are close to the true population mean. These estimates can be either precise (having low variability) or imprecise (having high variability). With stereology, higher precision can be obtained through more rigorous sampling methods (sampling additional animals, additional tissue sections, and/or additional microscopic fields of view), and the precision can be estimated by calculating the coefficient of error (CE). In a pilot study, both the CE and observed biological variability (coefficient of variation, or CV) can be estimated and used to determine whether the sampling is rigorous enough. This is accomplished through the PROBE (precision range of an optimally balanced estimator) equation, which is CV2/CE2. 15 The results of this calculation should be between 2 and 4. If the result is less than 2, the results are too imprecise, and more rigorous sampling methods need to be applied. If the result is more than 4, the study can be made more efficient by lessening the sampling rigor.
The way tissues are fixed, processed, embedded, and sampled can have a profound impact on quantitative end points. For example, whether the tissue is fixed via perfusion or immersion can affect the data, particularly if the tissue is highly vascular or if end points such as capillary number are important. Lower glomerular volume has been noted in kidneys fixed by immersion fixation compared with those fixed by perfusion due to lower capillary wall surface area. 25 The type of fixative used can become important if additional analyses are desired (such as electron microscopy) or if immunohistochemistry (IHC) is needed to identify a certain cell type. For most applications, fixation in 10% neutral-buffered formalin, with transfer to 70% ethanol after approximately 48 hours if IHC will be performed, is adequate. Although paraffin is the classical tissue-embedding medium, it can lead to underestimations of tissue volume due to a high degree of shrinkage. The degree of shrinkage is influenced by the tissue type, processing times, and other factors. For example, a study found that, on average, bovine kidney and liver samples exhibited a 15% loss in size following paraffin processing, and another study found that glomerular volume estimates were 40% lower for kidneys embedded in paraffin compared with those embedded in methacrylate. 19,25 If cell or object number is the only desired end point of the study, the effects of tissue shrinkage can be avoided by using the fractionator technique, where the fraction of the organ sampled at each sampling step is recorded and used in the final estimate. 11 However, if volume estimation is desired, plastic embedding using glycol methacrylate may need to be considered, as it causes a much lesser degree of tissue deformation. 25 Unfortunately, plastic embedding may be prohibitive if IHC staining is required to identify certain cell types, as many IHC stains cannot penetrate into the plastic. In addition, for some tissues such as the lung, simple embedding in glycol methacrylate has also been reported to result in tissue shrinkage, which was reduced by pretreating the samples with osmium tetroxide and uranyl acetate. 29 In these cases, a correction for global shrinkage can be applied to paraffin- or plastic-embedded tissue (outlined in Example 3). Frozen embedding is also possible; however, it carries its own caveats. These include less architectural detail and considerable shrinkage in the z-axis (section thickness). In addition, frozen embedding can introduce considerable artifacts due to the freezing-thawing process and ice crystal formation, which may affect cell and tissue volumes. Therefore, it is only considered as a last resort by the author.
Sampling of organs or regions of interest for stereology involves a process known as systematic uniform random sampling, or SURS. SURS ensures that every structure of interest within the tissue has an equal chance of being sampled; thus, stereology cannot be performed retrospectively on tissue that has already been sampled. With SURS, the length of the tissue is measured and a sampling interval (T) is chosen, generally an interval that will capture approximately 8 to 10 sections through the tissue (or region of interest). The location of the first sampling interval is random (between 0 and T) and is chosen via a random number table. Subsequent sections are taken at regular intervals of T until the entire tissue or region of interest has been sampled (Fig. 1).
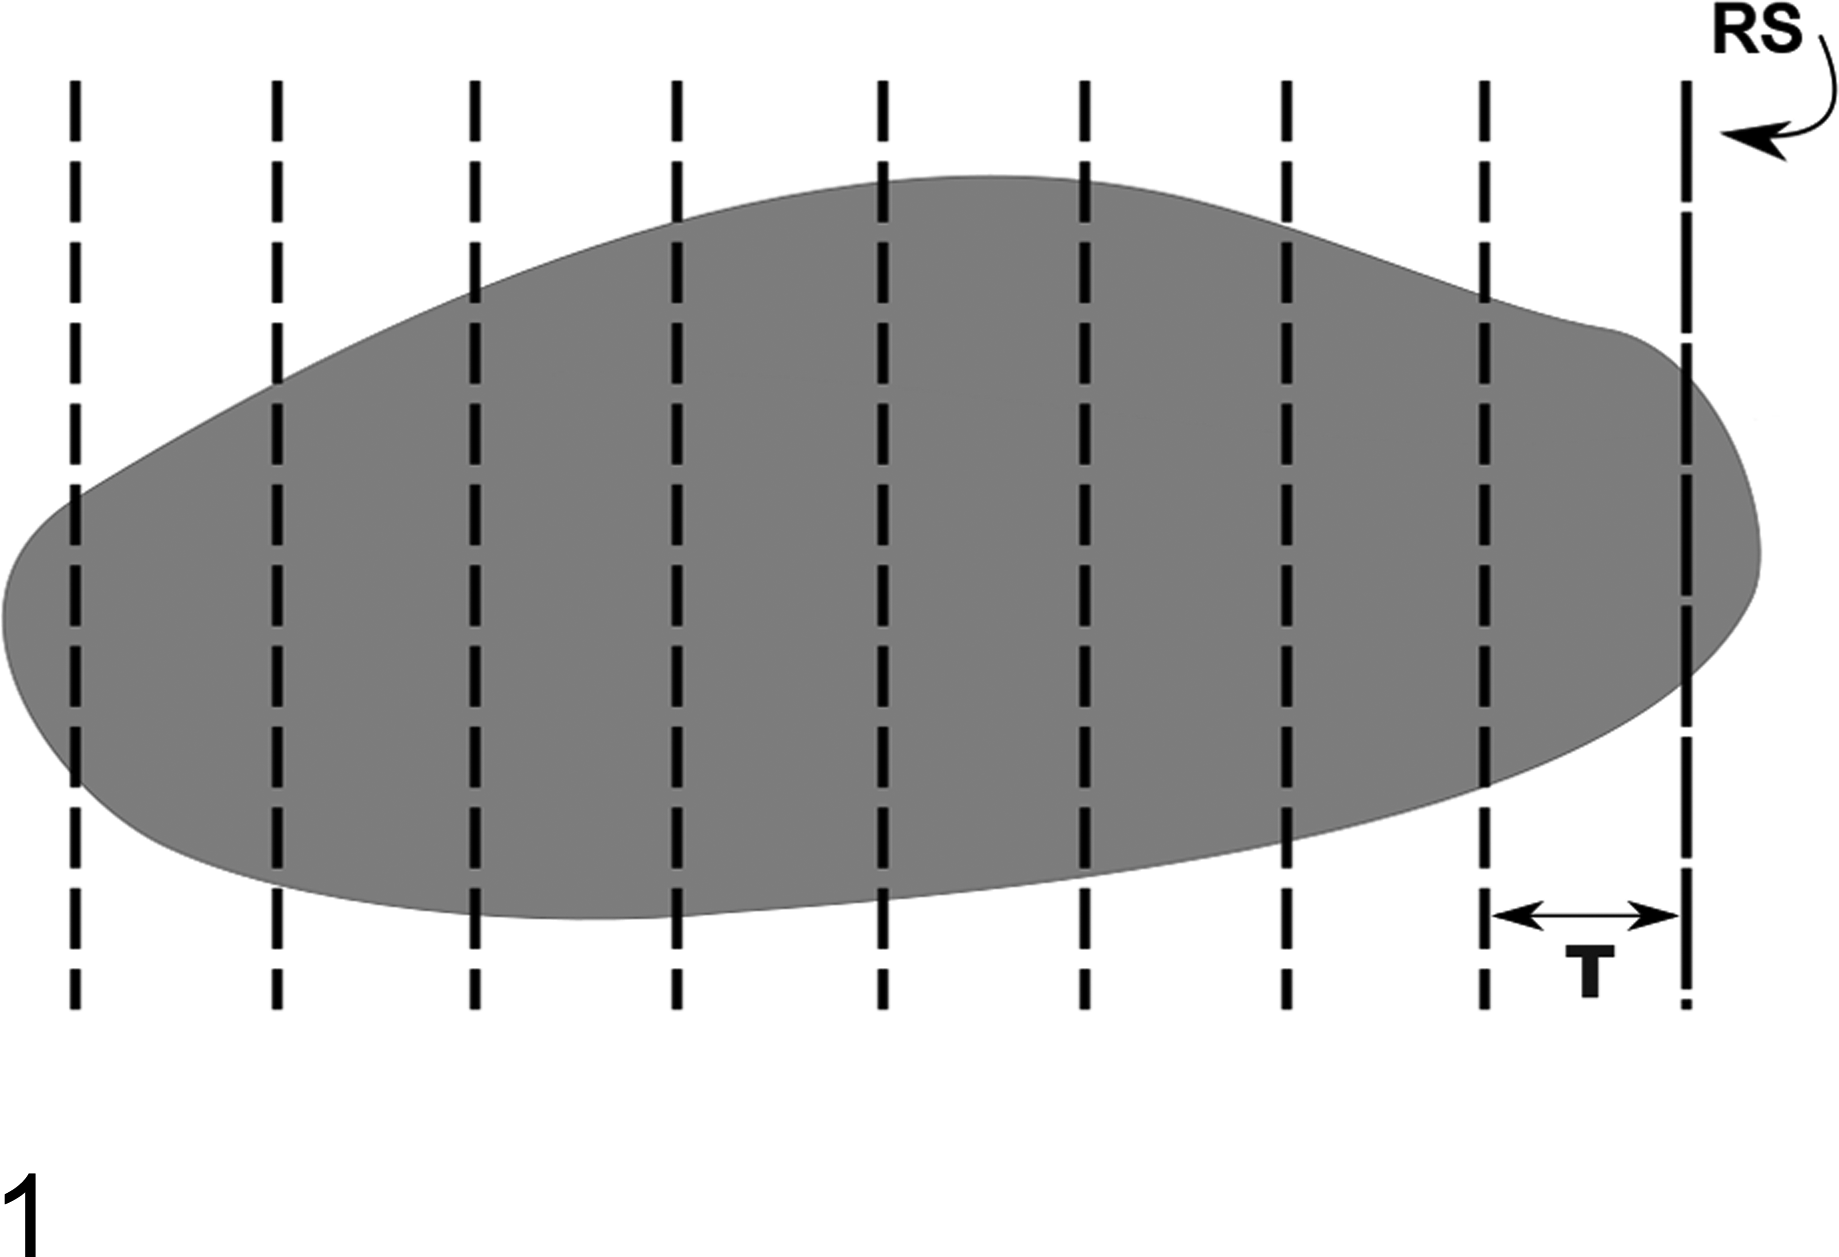
Sectioning of an organ by systematic uniform random sampling (SURS). The length of the tissue is measured and a sampling interval (T) is chosen that will yield 8 to 10 sections through the tissue. The first section is taken at a random start (RS) between 0 and T, and subsequent sections are taken at regular intervals of T throughout the tissue.
The way a tissue is sampled depends on several factors, including its size, the desired stereologic end points, and whether a portion of the tissue is needed for other analyses, such as electron microscopy or in vitro assays. If the tissue is small enough, SURS sampling can be accomplished entirely at the microtomy stage (the tissue is embedded whole and exhaustively sectioned). If this is the case, an automated microtome is necessary and needs to be calibrated to the section thickness (microtome advance). At each sampling interval, several additional serial tissue sections should be obtained to use as backup sections in case errors occur during staining or other phases of the study. In addition, sections can be obtained (serial or nonserial) for routine hematoxylin and eosin (HE) staining, additional special stains, or IHC stains. This is extremely important in this sampling design, as additional sections cannot be obtained once the block has been exhausted. Thought also has to be made as to whether additional pieces of tissue will be required for other analyses, such as molecular analysis of frozen tissue. If this is the case and the tissues are small, either one side can be used for stereology and the other side for other purposes (if the tissue is bilateral), or a separate cohort will need to be included in the study for stereology.
For medium-sized tissues, such as rat lung or nonhuman primate pancreas (see Examples 2 and 3), the tissue can first be embedded, sectioned by SURS to obtain tissue slabs, and then further processed. If the final embedding medium will be plastic, the tissue can first be embedded in agar for SURS sampling, as in Example 2. If the tissue will be paraffin embedded, the entire tissue should be processed and then sectioned to avoid processing-related shrinkage after the final sectioning stage (see Example 3). For large tissues, such as nonhuman primate liver, a technique such as the fast fractionator or other sampling paradigms may be used, as in Gundersen et al. 15
Another consideration for tissue sampling is whether or not the sections need to be isotropic uniform random (IUR). Isotropy means that all directions have an equal chance of being chosen. For number or Cavalieri volume estimates, IUR sections are not necessary. However, for length, surface area, or cell volume estimates, particularly for objects with anisotropic orientation (such as blood vessels or large airways within the lung), IUR sections are needed (Table 1). Two techniques used to obtain IUR sections are the orientator/disorientator and the isector. 16,24,26,27 The orientator technique is outlined in Example 2. The isector technique involves embedding tissues (or subsamples of tissues) in agar using spherical molds (Suppl. Fig. S1), then rolling the specimen on a table or other flat surface to obtain an isotropic orientation. 27 In some cases, vertical sections may be used in place of isotropic sections. Examples of vertical sections include sectioning a cylindrical tissue (ie, ganglion, vertebra) after randomly rotating it around its long axis or sectioning of skin or other flat epithelia normal to the exterior macroscopic surface. 2 Example 4 walks through the use of vertical sections for estimating neuron size in dorsal root ganglia. Regardless of the sampling strategy employed, the goal in stereology is usually to obtain 8 to 10 tissue sections through the tissue using SURS, either in a single sampling step or in several subsampling steps.
Relationship of Structural Feature of Interest and Stereological Probes.
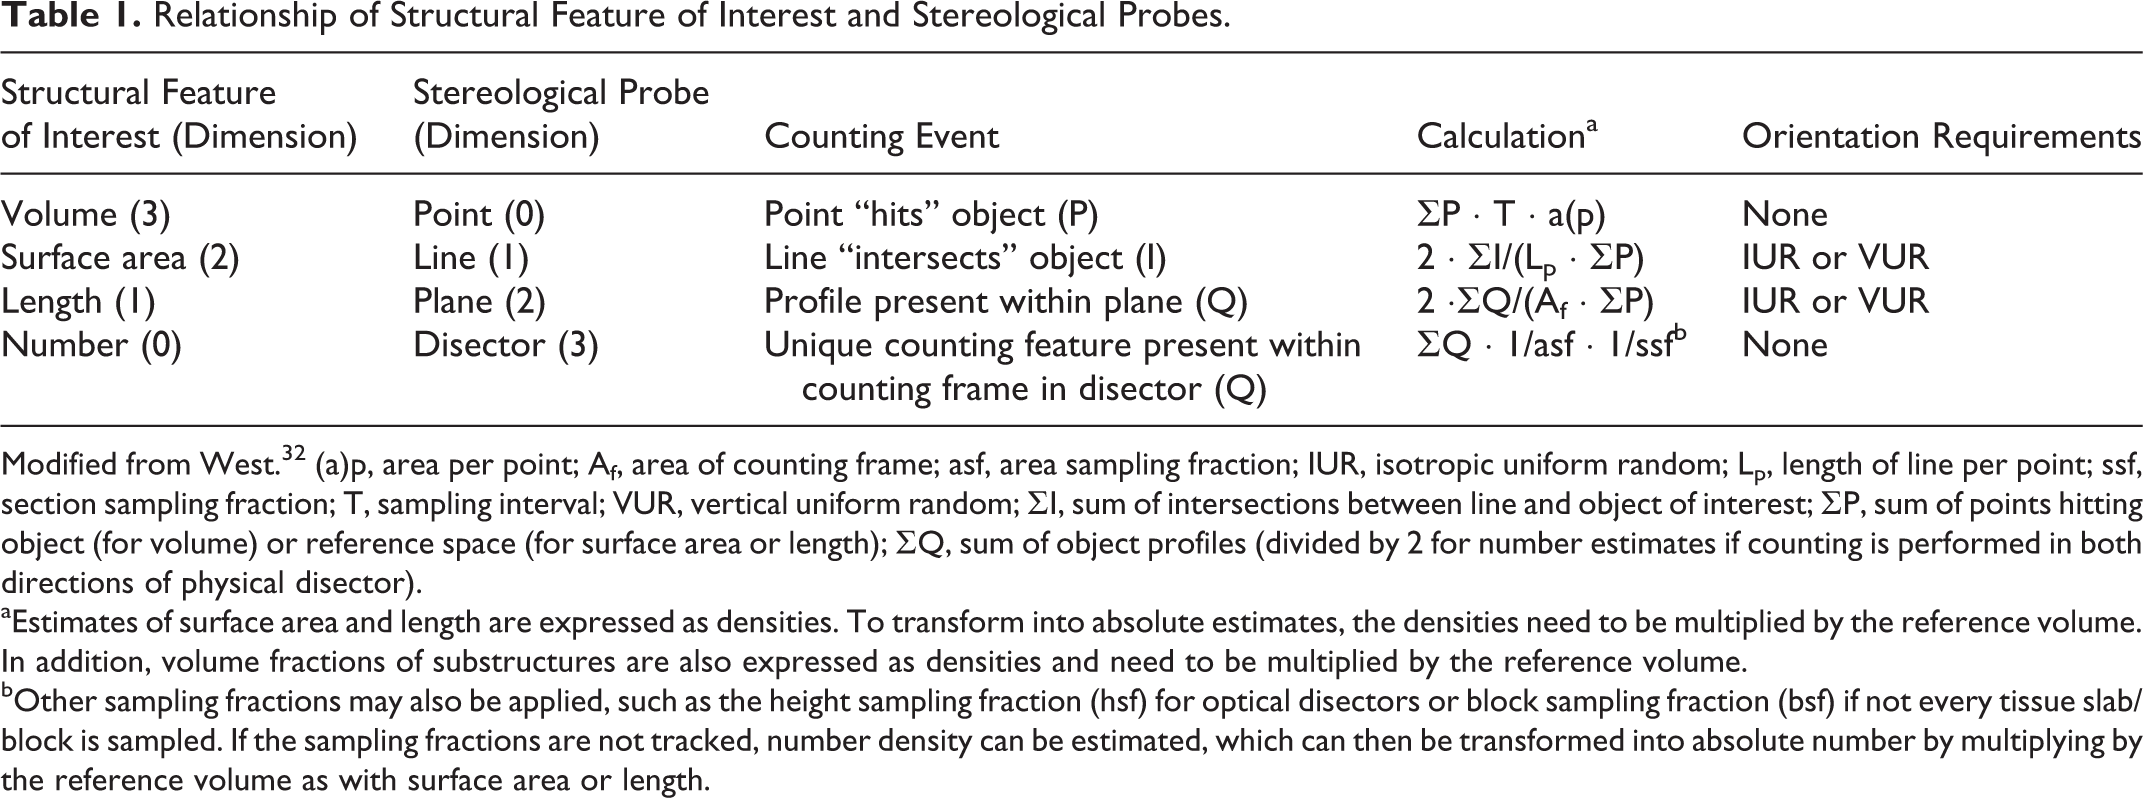
Modified from West. 32 (a)p, area per point; Af, area of counting frame; asf, area sampling fraction; IUR, isotropic uniform random; Lp, length of line per point; ssf, section sampling fraction; T, sampling interval; VUR, vertical uniform random; ΣI, sum of intersections between line and object of interest; ΣP, sum of points hitting object (for volume) or reference space (for surface area or length); ΣQ, sum of object profiles (divided by 2 for number estimates if counting is performed in both directions of physical disector).
aEstimates of surface area and length are expressed as densities. To transform into absolute estimates, the densities need to be multiplied by the reference volume. In addition, volume fractions of substructures are also expressed as densities and need to be multiplied by the reference volume.
bOther sampling fractions may also be applied, such as the height sampling fraction (hsf) for optical disectors or block sampling fraction (bsf) if not every tissue slab/block is sampled. If the sampling fractions are not tracked, number density can be estimated, which can then be transformed into absolute number by multiplying by the reference volume as with surface area or length.
After 8 to 10 tissue sections have been obtained, sampling is performed within those tissue sections (usually via a computer software program) to capture microscopic fields of view. The most common method for capturing fields of view is the fractionator, in which fields of view are captured by SURS sampling of a user-defined percentage of the tissue (Fig. 2a). A more efficient method for capturing microscopic fields of view is Proportionator sampling. Proportionator uses nonuniform random sampling guided by automated image analysis. 6,7 The sampling fields are chosen based on the probability of having a positive count, which greatly increases the efficiency of the sampling (Fig. 2b). To obtain 100 to 200 positive counting events (the goal in most stereology studies), far fewer microscopic fields of view are needed compared with fractionator sampling. Example 1 walks through the use of Proportionator sampling for cell number estimation.
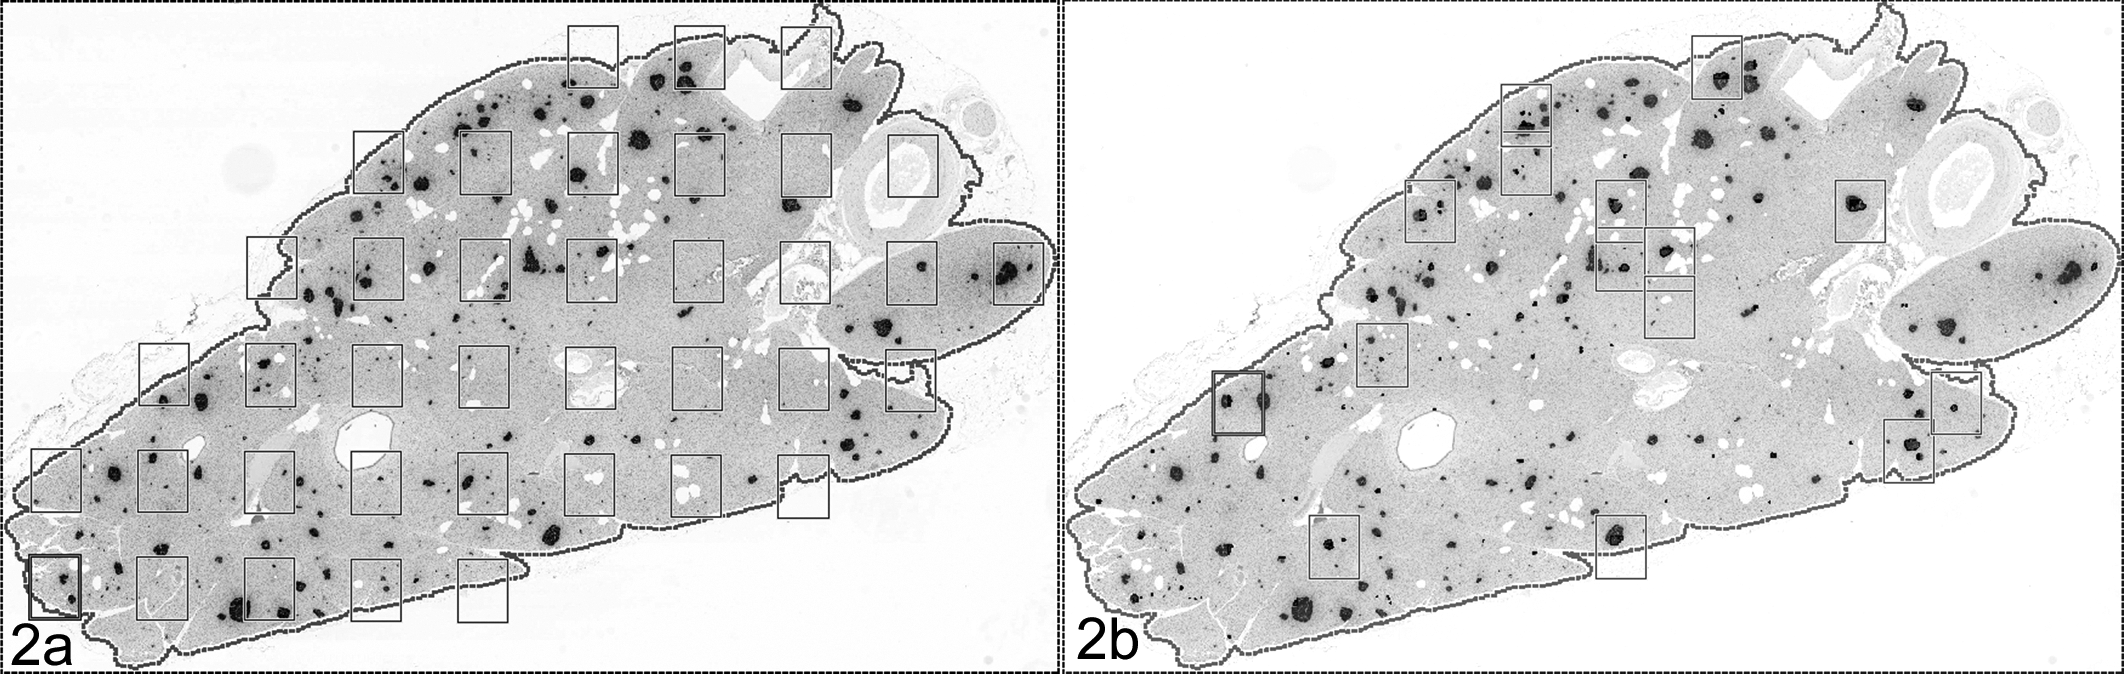
Stereological sampling of a nonhuman primate pancreas section, immunohistochemically stained for insulin and glucagon (dark areas). (a) Fractionator sampling. Rectangular sampling fields are chosen at regular intervals, with a random start, using systematic uniform random sampling (SURS). (b) Proportionator sampling. Sampling fields are chosen according to an image analysis algorithm, yielding more fields centered over areas of positive immunohistochemical staining (dark areas).
Once the microscopic fields of view are sampled, stereologic probes or test systems are positioned at random over the sampling fields, and interactions between the objects of interest and the probe/test system are counted. The type of probe chosen depends on the dimensions of the geometrical feature of interest; the sum of dimensions of the probe and the feature of interest is always 3 (Table 1). Therefore, if volume is the feature of interest, a dimensionless point probe is applied to the microscopic fields of view, and the number of points hitting the structure of interest is counted in each field. If surface area estimation is desired, which is 2D, a 1-dimensional line probe is applied and the intersections between the line and the feature of interest (ie, alveolar septal tissue) are counted. If length of an object (ie, renal tubules) is the desired end point, 2D section planes are applied (ie, the histologic sections). If number is the feature of interest, a 3D probe, called the disector, must be applied, which is described in more detail below.
Estimation of Object Number
For estimation of number of cells or other objects, a unique probe, called the disector, must be used. Unlike the other stereological probes, the disector is applied at the time of tissue sectioning. There are 2 types of disectors, optical disectors and physical disectors. The disector ensures that objects are sampled according to their number rather than their size, shape, and orientation, as would be the case with single sections obtained for 2D morphometric analysis.
The procedure of counting in physical disectors is further outlined in Examples 1 and 3, and the procedure of counting in optical disectors is further outlined in Example 4. These examples all use the Fractionator, in which the fraction of the tissue being sampled is recorded and used in the final equation to obtain the absolute number estimate.
In addition to cell number estimates, disectors can also be used to estimate the number of bone trabeculae, capillaries, or pulmonary alveoli by estimating connectivity through use of the Euler number. 13,18,28 This specific estimate will not be detailed in this article, and readers are referred to the above references for further information.
Other Applications of Stereology
Common stereology end points aside from number include volume, surface area, and length estimates. More than one geometric feature can be estimated in a single sampling, as illustrated in several examples below, again increasing the efficiency of the analysis.
Several estimators require estimation of the reference space volume to be transformed from densities to absolute values. This includes surface area and length estimates. Estimation of total tissue volume or other reference volume uses the Cavalieri method, in which the volume equals the sum of all cross-sectional areas multiplied by the distance between the sections, which is the sampling interval or T. 14,16 The surface area or length density estimates are multiplied by the reference volume to obtain absolute surface area or length estimates, as illustrated in Example 2. In addition to total tissue volume, the volume fraction of a particular region of the tissue (ie, parenchymal volume in the lung or glomerular volume in the kidney) can also be estimated, as in Example 3. This also results in a density estimate, which then needs to be multiplied by the reference volume to obtain the total volume of the object or subregion. If cell or object number is not estimated by the Fractionator (described previously), it too results in a density estimate that must then be multiplied by the reference volume to obtain an absolute estimate.
As mentioned earlier, estimation of surface area is achieved through the use of line probes (see Example 2), and length estimates are obtained by applying plane probes to the tissue sections. A plane probe is basically a microscopic field of view on a 2D histologic section with the application of an unbiased counting frame. It is similar to that used for number estimation, without the requirement of a disector. An example of length estimate is not included in this review, and readers are directed to Gundersen, 10 Howard and Reed, 16 and Gokhale 9 for examples of this estimator.
In addition to tissue or compartment volume estimation by the Cavalieri method, cell volume can also be estimated using nucleator or rotator probes as in Example 4. 12,21
Last, any of the above estimates can be applied at the ultrastructural level as well. 28 The probes are applied to photomicrographs captured by the electron microscope. The application of the disector at the ultrastructural level is a bit tricky but can be done. In addition, the estimates can be applied to in vivo imaging techniques such as computed tomography (CT) and magnetic resonance imaging (MRI). 17
Example 1: Use of Physical Disectors and Proportionator Sampling in a Mouse Model for Parkinson Disease
The 1-methyl-4-phenyl-1,2,3,6-tetrahydropyridine (MPTP) treated mouse is a recognized animal model of Parkinson disease with characteristic loss of dopaminergic neurons in the substantia nigra. 20 In this study, C57BL/6 J mice were treated with 10 mg/kg MPTP by intraperitoneal injection every 2 hours for a total of 4 doses, and animals were necropsied on study day 8. Mice were perfused with paraformaldehyde and whole brains were removed and fixed in 10% neutral-buffered formalin (NBF). After fixation, the midbrain was dissected free to isolate the substantia nigra, the thickness of the dissected section of midbrain was measured with a Vernier caliper, and it was processed and embedded in paraffin en toto. All procedures were conducted in conformance with the National Research Council’s Guide for the Care and Use of Laboratory Animals and a study protocol approved by WIL Research’s Institutional Animal Care and Use Committee.
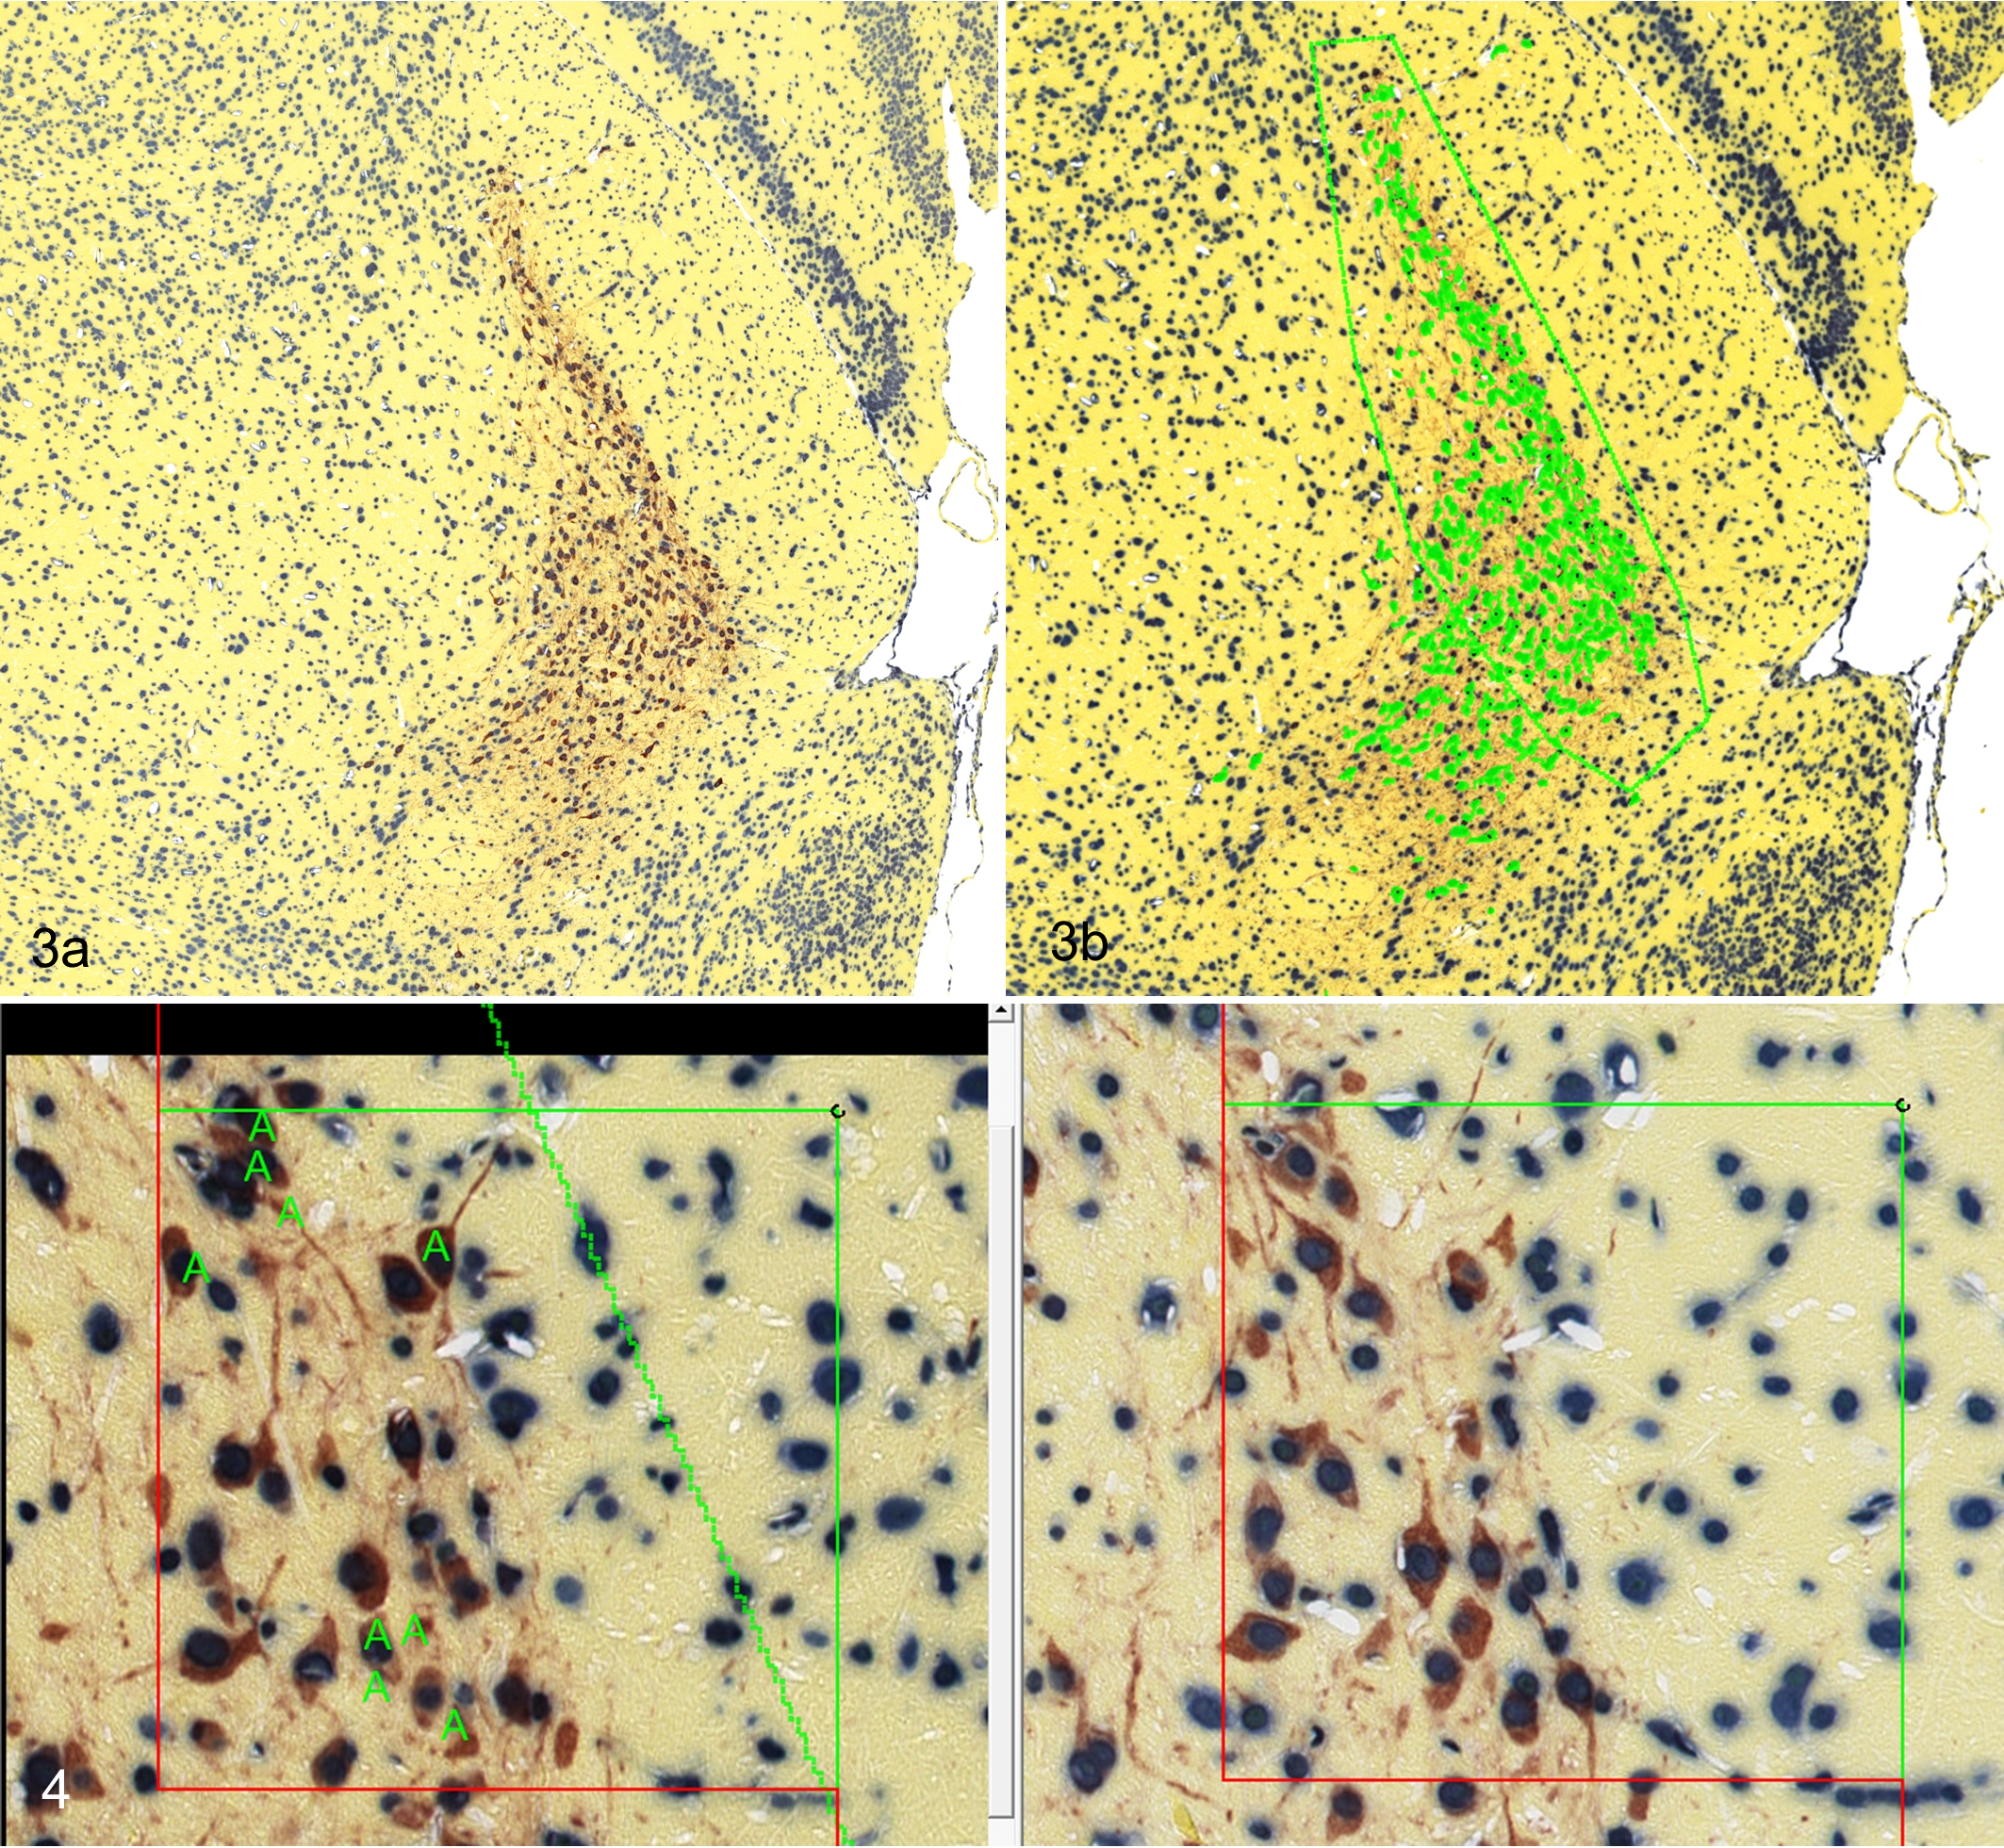
The midbrain was exhaustively sectioned at microtomy using the physical Fractionator (physical disectors collected via SURS, with the sampling fraction tracked) with a goal of obtaining 8 to 10 physical disectors per animal. To obtain physical disectors, consecutive thin (3 μm thick) sections were captured at each sampling interval (in this study, the interval was 120 μm) and were placed side by side on the microscope slide, thus yielding a section sampling fraction (ssf) of 1/40 (every 40th section was taken for stereological analysis). A random start between 1 and 40 was chosen for each animal using a random number table, and section pairs were collected uniformly across the tissue thereafter. Sections were double-immunostained for tyrosine hydroxylase to identify dopaminergic neurons and histone H4 as a general nuclear marker (Fig. 3a) and were counterstained with mentanil yellow.
Physical disectors were chosen for this study because they bear the advantage of being thin enough to apply typical staining methods as well as the ability to use a whole-slide scanner to create virtual slides. These digital files can then be imported into a stereology software system, and analysis can be performed directly on the virtual file, without the aid of a live microscope. Certain software platforms (such as the AutoDisector; Visiopharm, Hørsholm, Denmark) have the ability to automatically capture matching microscopic fields of view from both of the sections and display them side by side for counting. One section is typically termed the “reference” section, and the other is termed the “look-up” section. 16 Cells are counted when a unique counting feature (such as the nucleus or nucleolus) is present on one section and not the other. These technological advances have made use of the physical disector both practical and efficient.
Stained slides were scanned and virtual slides were imported into the Visiopharm stereology software. An image analysis algorithm was created by the user to identify the tyrosine hydroxylase-positive neurons and guide Proportionator sampling (Fig. 3b), which uses image analysis to assign a “weight” to each sampling field (corresponding to the amount of positive staining as detected by the algorithm) and use that to calculate the probability of a positive count within that sampling field. The software then samples according to this probability.
The sampled fields of view were then viewed by the user, and tyrosine hydroxylase-positive neurons were counted if they were within the unbiased counting frame and the unique counting feature (the nucleus) was present on one side of the disector but not on the other (Fig. 4). The unbiased counting frame contains 2 “inclusion” lines and 2 “exclusion” lines. Cells are only counted when they are within the counting frame or touching the inclusion lines and not when they are touching the exclusion lines (Fig. 4). This ensures that if 2 counting frames are placed side by side on a tissue, an object will only be counted once. Weighted counts were calculated by the software by multiplying the raw count by the inverse of the probability of having a positive count within each field of view. The weighted counts were summed across all disector pairs for each sampling per animal, and the total number of dopaminergic neurons in the substantia nigra was estimated by the following equation: N = ΣQw/2 · 1/ssf, where ΣQw was the sum of the weighted counts (divided by 2 because counts were performed in both directions of the disector) and ssf was the section sampling fraction, as noted above. Counting can be performed in both directions of the disector (counting an object if it is on one side and not the other, regardless of which side it is on) to increase efficiency in the study, as long as it is taken into account in the final equation.
The precision of the sampling was estimated by calculating the CE, according to Gardi et al, 6 using the following equation: CE = SD(est1, est2, est3)/(√3 × mean), where SD is the standard deviation of all the estimates from all 3 independent samplings and mean is the mean of all 3 samplings.
When judging the precision of Proportionator sampling, it is also important to look at a graphical representation of how well the image analysis algorithm performs in detecting the objects of interest. This can be accomplished by constructing a point vs weight graph (Suppl. Fig. S2). If there is a large spread of points around the tendency lines on the graph, the staining or image analysis algorithm may require further optimization.
The results of this study are illustrated in Table 2. The percentage of dopaminergic neuron loss in treated animals at study day 8 (44%) was similar to previous publications. 8,22
Estimated Number of Dopaminergic Neurons in the Substantia Nigra of MPTP-Treated Mice by Proportionator Sampling.
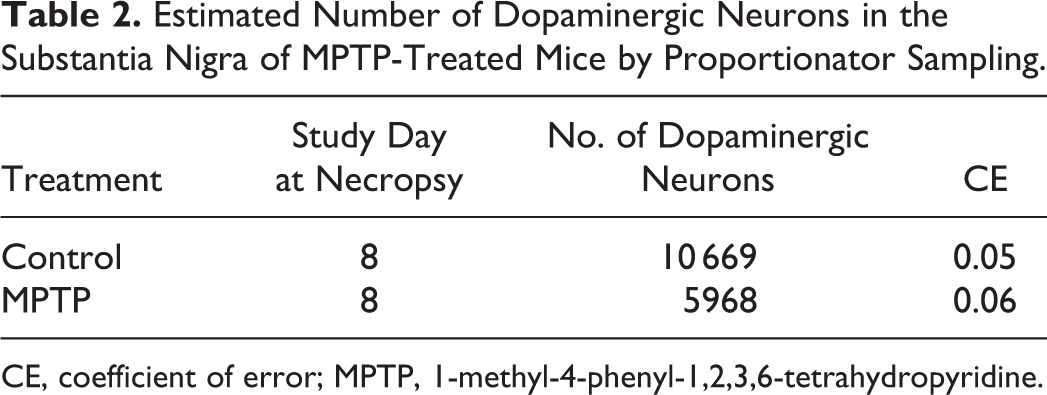
CE, coefficient of error; MPTP, 1-methyl-4-phenyl-1,2,3,6-tetrahydropyridine.
Example 2: Estimation of Alveolar Surface Area in a Mouse Model of Emphysema
Mouse lungs were fixed by instillation of fixative under controlled pressure fixation (25 cm H2O above the highest point of the lung) to ensure uniform inflation of the alveolar spaces within and between animals, as described in Fehrenbach and Ochs. 5 The fixative used was 2.5% glutaraldehyde buffered with HEPES to a pH of 7.4, as recommended by the American Thoracic Society and European Respiratory Society. 17
Following fixation, lungs were embedded whole in hot agar and sectioned into IUR slabs (with a goal of 8–10 slabs per animal) using the orientator technique (Suppl. Fig. S3). Briefly, the agar mold containing the lung was placed on an equiangular clock, and an angle for cutting was chosen randomly. A section was made in the agar adjacent to, but not including, the tissue. The cut side was then placed down on a cosine-weighted clock, a second random angle was chosen, and a second cut was made into the agar (again avoiding cutting the tissue). This second cut side was placed against the end of the tissue slicer, hot agar was poured into the slicer and allowed to harden, and the tissue was sectioned into slabs. Excess agar was then removed from each tissue slab and the tissues were processed and embedded in glycol methacrylate. Several sections were embedded into 1 block for time and cost efficiency, being careful to maintain the correct IUR orientation of the tissue. Glycol methacrylate was chosen as the embedding medium of choice for this study to minimize tissue shrinkage and because IHC was not required. However, as some references have shown that tissue shrinkage can occur in lungs with simple glycol methacrylate embedding, it is recommended to pretreat the tissues with osmium tetroxide and uranyl acetate first. 29
Physical disectors were obtained from the first full face of each block and were stained with HE. Slides were scanned and imported into the Visiopharm software and the total lung parenchymal volume was calculated according to the Cavalieri method. 14,16 This was accomplished by applying a point probe to the scanned lung sections at low magnification and counting the total points intersecting the lung parenchyma (Fig. 5). The total volume was calculated using the following equation: V = ∑P × T × a(p), where ∑P was the sum of all points hitting the tissue, T was the distance between the sections (3 mm in this study), and a(p) was the area of the tissue covered by each point (supplied by the software; see Fig. 5). CE for lung volume was calculated according to Løkkegaard. 23
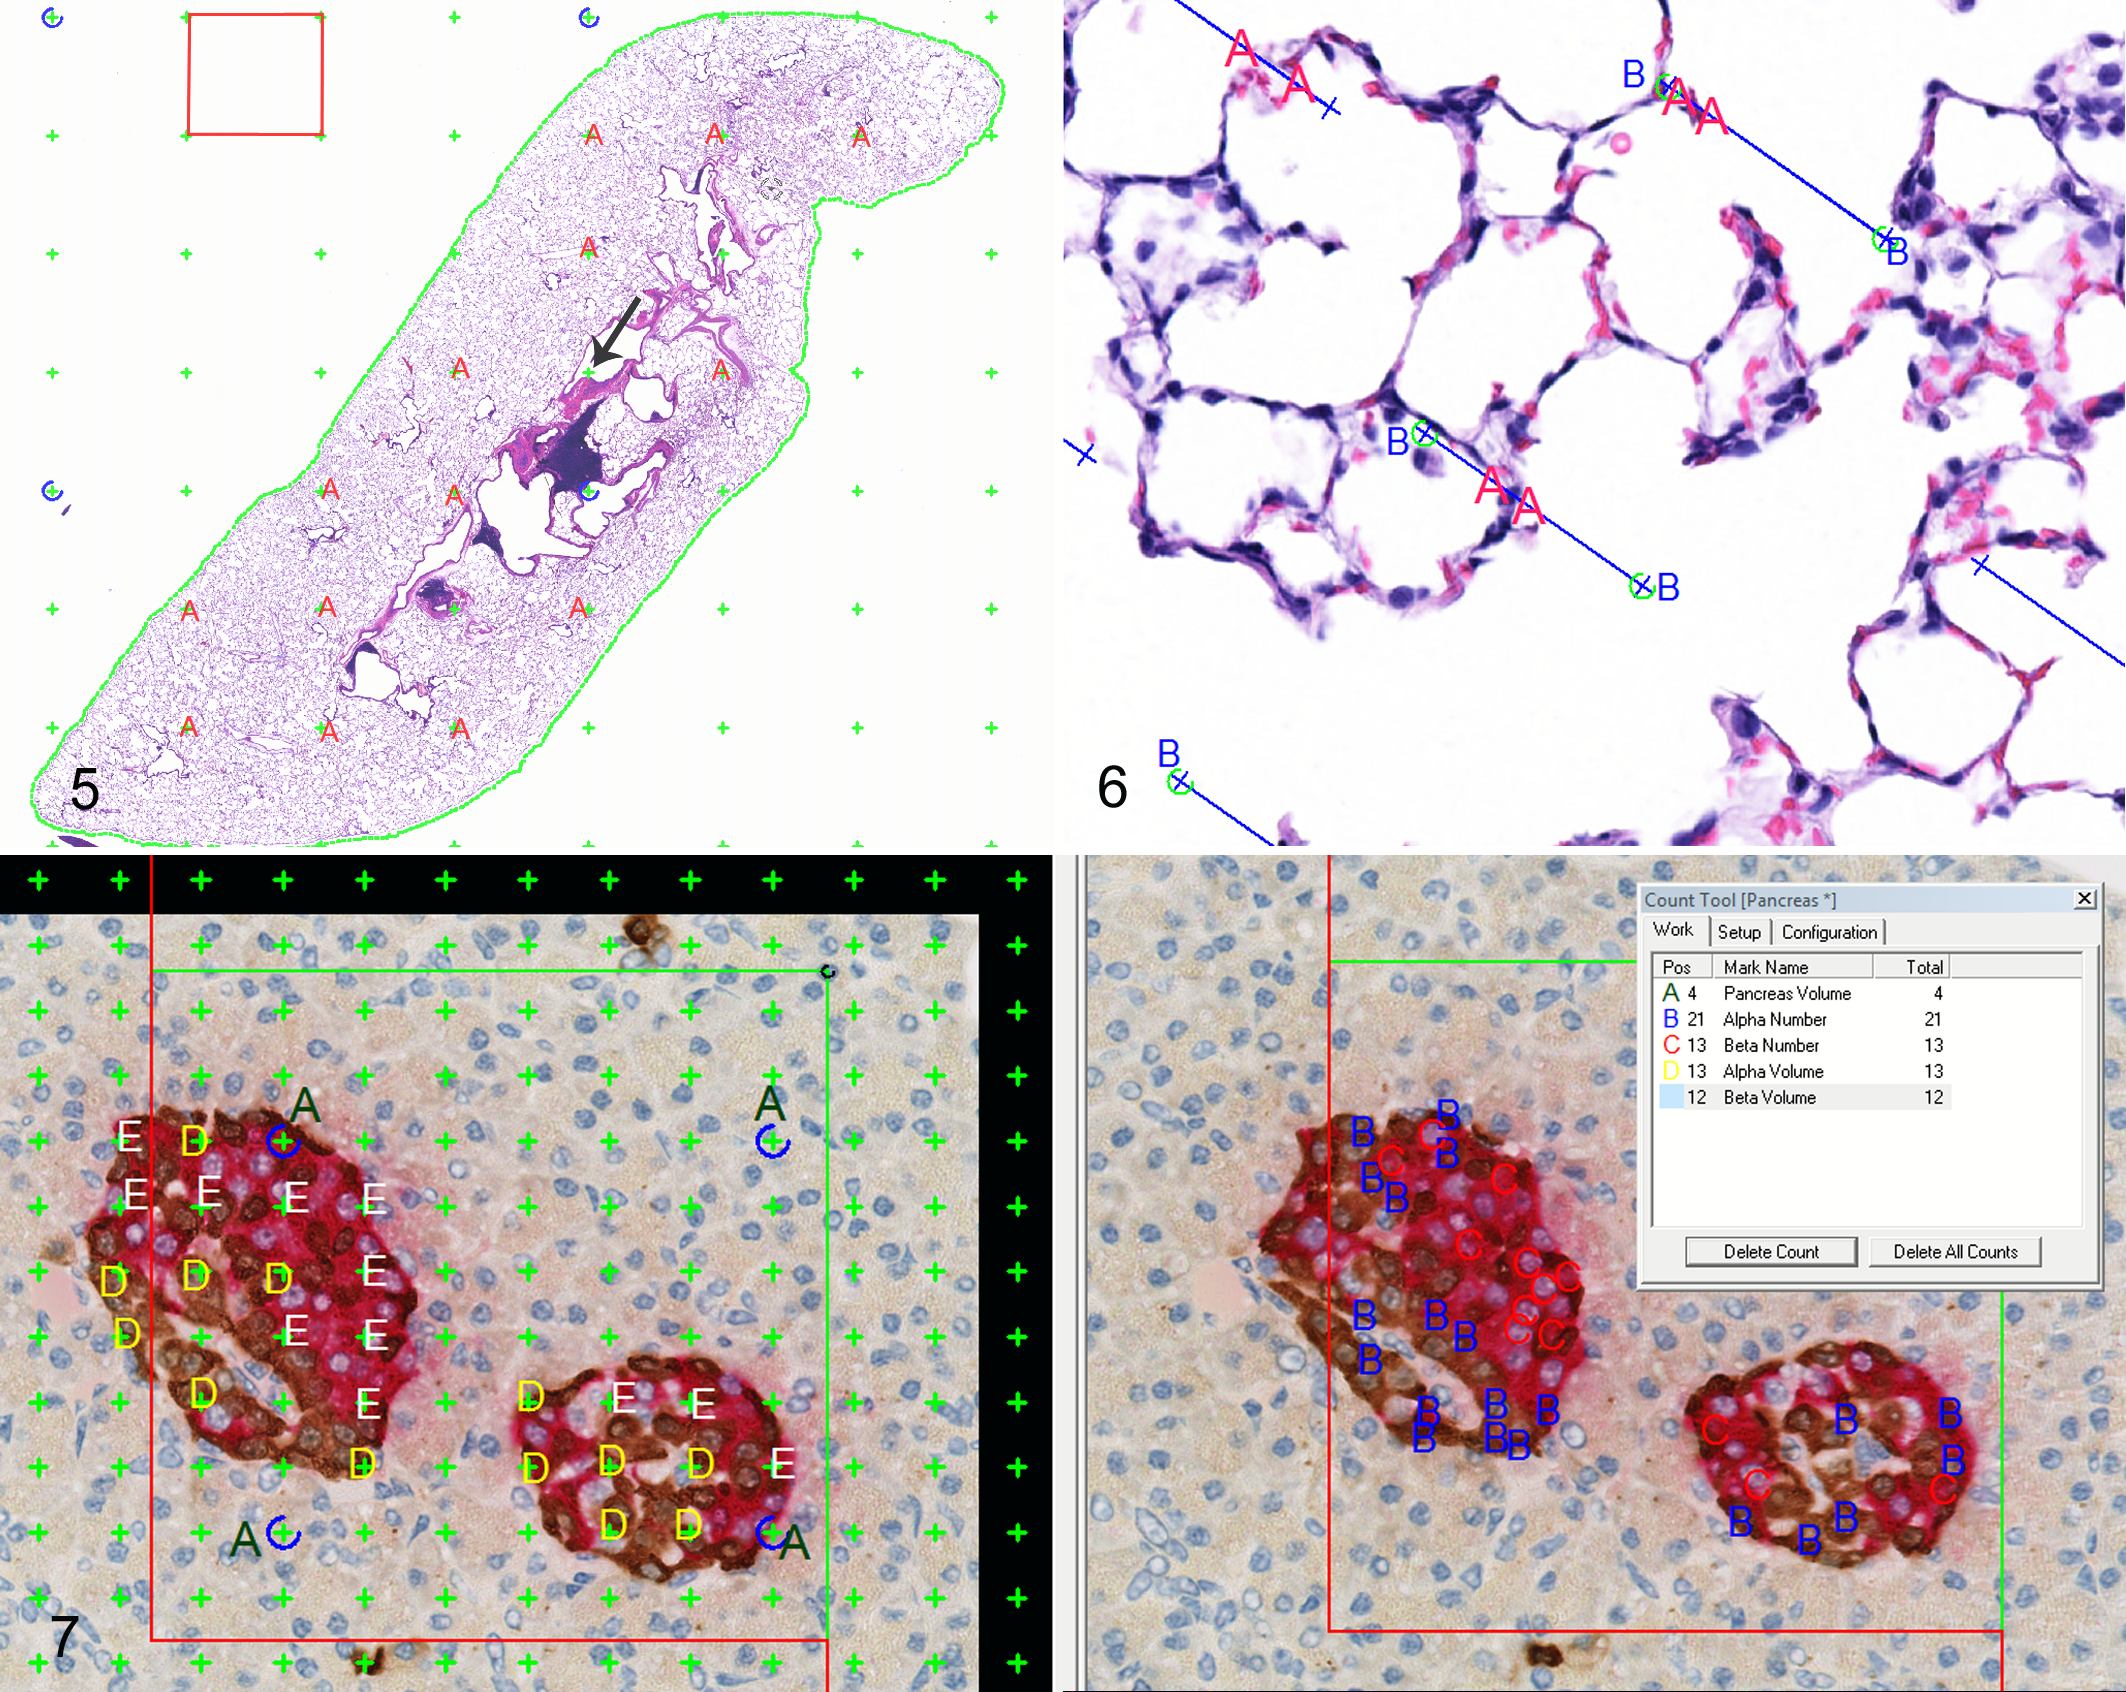
SURS was then used to capture 20× magnification fields of view, and a line probe was placed on each field of view to estimate alveolar surface area. The intersections between the lines and the alveolar septal tissue were tagged and summed (Fig. 6). Points at the end of each line hitting the reference space (lung parenchyma) were also counted and summed. It should be noted that it is critical to capture high-magnification (20× or higher) fields of view for surface area estimates so that surface area irregularities can be visualized at a high enough resolution.
Total alveolar surface area density was calculated by the following equation: Sv = 2 × [∑I/(Lp × ∑P)], where Sv was the surface area density, ΣI was the number of intersections between the lines and the alveolar septal tissue, Lp was the length of line associated with a point (supplied by the software), and ΣP was the number of points hitting the reference space. The surface area density was then converted to absolute surface area by multiplying it by the total lung volume, which was obtained through Cavalieri estimation as outlined above. The CE was calculated according to the following equation: CE = 1/√ΣI.
Example 3: Nonhuman Primate Pancreas Study for Evaluation of α and β Cell Number and Volume
The entire pancreas from cynomolgus monkeys was removed, placed flat on a piece of cardboard, fixed in 10% neutral-buffered formalin for approximately 1 week, and weighed (Wfix). Each pancreas was processed whole in paraffin and weighed again (Wpar), and the distance along the long axis was measured to calculate the sampling interval. The tissue was processed whole so that the final SURS sectioning step would take place after tissue shrinkage occurred. If the final tissue sectioning step were performed prior to tissue shrinkage, the sampling interval would no longer be accurate. As volume estimates were part of this study and paraffin processing induces profound tissue shrinkage, the 3D global shrinkage was calculated for each pancreas according to the following equation: 1 – Wfix/Wpar.
Each pancreas was embedded whole in paraffin using a large mold and sectioned every 8 mm into slabs using a mini hack saw and miter box (Suppl. Fig. S4). The slabs were reembedded into paraffin and physical disectors were captured from each slab. Disectors were double immunostained for insulin and glucagon, scanned, and imported into the Visiopharm system.
The entire pancreas was sampled at low magnification, and the tissue volume was calculated as in Example 2. The total volume was then corrected for shrinkage using the following equation: V(corrected) = V/(1 – 3D global shrinkage).
Matching 40× magnification fields were then sampled by Fractionator sampling, using an area sampling fraction of 0.7%. An unbiased counting frame was applied to each sampling field and the number of α and β cells was estimated using the nucleus as the unique counting feature (Fig. 7). The total number of α and β cells was calculated using the following Fractionator equation: N = ∑Q/2 × 1/ssf × 1/asf, where N was the total estimated number; ∑Q was the total counts within the fields of view, divided by 2 because counting was performed in both directions of the disector; ssf was the section sampling fraction (section thickness divided by distance between sections); and asf was the area sampling fraction (percentage of the tissue sampled). The CE for α and β cell number was calculated according to Løkkegaard. 23
A double-point probe was also applied to each sampling field and the number of points hitting α and β cells, as well as the number of encircled points hitting the pancreatic parenchyma, were counted and summed across all sampling fields (Fig. 7). The sums were used to calculate the volume fraction of α and β cells to total pancreatic tissue using the following equation: (ΣPx · A(p)x)/(ΣPt · A(p)t), where ΣPx was the sum of points hitting the objects of interest (α or β cells), A(p)x was the area per point for the objects of interest (supplied by the software), ΣPt was the sum of points hitting the tissue, and A(p)t was the area per point for the tissue. The total volume for each was then obtained by multiplying the volume fraction by the total tissue volume obtained above (Cavalieri estimate).
Example 4: Use of Optical Disectors for Neuron Size and Number in Dorsal Root Ganglion
Left and right L5 dorsal root ganglia from cynomolgus monkeys were isolated, trimmed free of excess tissue, and fixed in 10% neutral-buffered formalin. Fixed ganglia were then dehydrated and processed in glycol methacrylate (GMA), and the largest diameter perpendicular to the long axis was measured by a Vernier caliper to calculate the sampling interval. The ganglion was then randomly rotated around its long axis and placed into an embedding mold longitudinally to obtain vertical (VUR) sections.
The tissue was exhaustively sectioned by SURS, and approximately 30-μm-thick optical disectors (single thick sections) were obtained at each sampling interval (every 210 μm), yielding a section sampling fraction (ssf) of 1/7 (every seventh section was taken for stereological analysis). Sections from multiple sampling intervals were placed on the same slide in the same orientation to create the fewest number of slides possible for analysis.
Optical disectors were stained with cresyl violet acetate to outline the Nissl substance within neurons. Because optical disectors are thick sections and require evaluation under high-magnification oil objective, slides cannot be scanned and imported into the software. Instead, sections were evaluated within the Visiopharm stereology software system connected to an Olympus BX51 microscope equipped with a DP72 camera (Olympus Corporation, Tokyo, Japan), motorized stage (Prior Scientific, Rockland, MA), and length gauge (Heidenhain Corporation, Schaumburg, IL) (Fig. 8). Proportionator sampling was used to guide the sampling, using the cresyl violet–positive Nissl substance as the feature of interest.
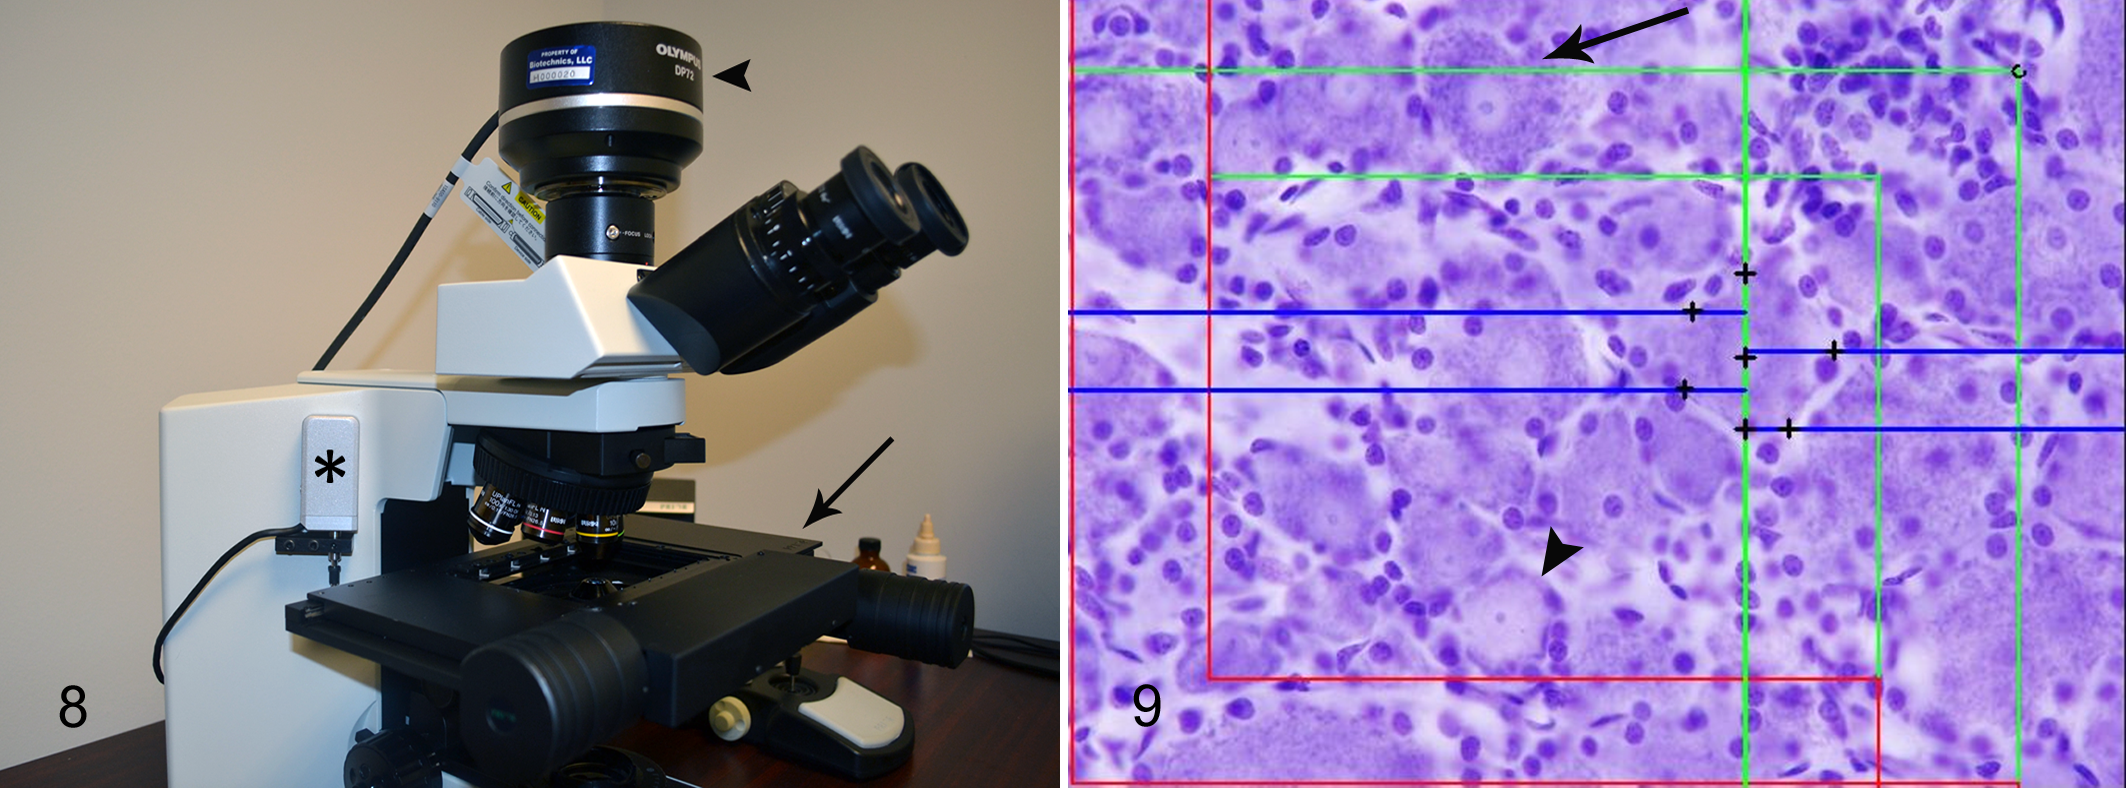
When evaluating optical disectors, the user focuses down through the section at each sampling field using a high-magnification oil objective and counts cells as a unique feature (often the nucleus or nucleolus) comes into focus. For this study, A and B neurons within the dorsal root ganglion were counted. Two unbiased counting frames were used, one half the size of the other; A neurons were counted within the larger counting frame, and B neurons were counted within the smaller counting frame. A and B neurons were differentiated based on size, staining, and nuclear criteria, as in Tandrup. 30 A neurons were larger, had a single prominent nucleolus, and had well-defined islands of Nissl substance against a light cytoplasm, whereas B neurons were smaller and had multiple nucleoli, and the cytoplasm was darker and more homogeneous (Fig. 9).
At each sampling field, the top of the section was brought into focus and the z-distance (depth into the tissue section) was zeroed. The investigator focused down through the section, logging A and B neurons as the unique counting feature (nucleolus for A neurons and nucleus for B neurons) was brought into focus. When the bottom of the section was reached, the z-distance (section thickness) was logged for each sampling field.
Optical disectors may be required for some software systems or certain study designs but are more time-consuming and technically challenging than physical disectors. Immunohistochemical staining can be particularly challenging due to the section thickness, and attention has to be paid as to whether the stain penetrates through the section adequately. This is determined by creating a z-distribution graph, which plots the depth of each positive counting event within the section (z-axis location). This graph is usually created in a pilot study to determine whether staining is adequate. The goal is to have approximately equal distribution of counting events throughout the thickness of the section (Suppl. Fig. S5a). Tapering off of cell counts as the section depth increases indicates a lack of adequate stain penetration through the section, and further stain optimization is needed (Suppl. Fig. S5b). Another important use of the z-distribution graph is to determine the guard zones, which are areas at the upper and lower boundaries of the section in which pronounced loss of cell nuclei and tissue shrinkage (or other types of deformation) can occur. 1,4 The size of the guard zones depends on the tissue type and preparation methods and is usually determined in a pilot study. For this particular study, the upper guard zone was set at 3 μm, and neurons were counted within a disector height of 15 μm.
Once all of the sampling fields were counted, the total number of A and B neurons were estimated using the following equation: N = ΣQw · 1/ssf · 1/hsf · 1/cf, where ΣQw was the sum of the weighted counts and ssf was the section sampling fraction, similar to that in Example 1. The variable cf was the size of the counting frame relative to the entire weighted field of view. For A neurons, in which the largest counting frame was used, the cf was 1. For B neurons, the cf was 0.5, as the counting frame size was half that of the A neurons. The additional variable hsf was the height sampling fraction, which is only applicable to studies using optical disectors. The height sampling fraction was calculated by the following equation: hsf = h(dis)/[Σ(Qw · t)/ΣQw], where h(dis) was the height of the disector (15 μm in this study), Σ(Qw · t) was the sum of the weighted count multiplied by the section thickness for each sampling field, and ΣQw was the total sum of the weighted counts. The CE for each animal was calculated as in Example 1, according to Gardi et al. 6
For estimation of A and B neuron size, the direction of the vertical axis (longitudinal axis of the ganglion) was inputted into the software system by the investigator, and rotator probes were applied to counted neurons in each sampling field. The rotator probe was applied by indicating when the core of the neuron (middle of the nucleus for A neurons and nucleolus for B neurons) was in crisp focus. At that time, the software created a vertical line through the core. The boundaries of the neuron and the line were denoted by the investigator, and perpendicular half-lines were created by the software. The boundaries of the neuron and these half-lines were indicated, and the final cell volume measurement was logged (Fig. 9), as described in Jensen and Gundersen. 21
Caveats of Stereology and Conclusions
Although stereology provides unbiased, 3D information about 2D tissue sections, it also carries some caveats. The most important is that it cannot be performed retrospectively. This is because the entire tissue or region of interest needs to be available for sampling according to the principle of SURS. In addition, stereology often requires specialized computer software for analysis and may require specialized equipment in certain circumstances (ie, a microscope equipped with a camera and motorized stage for optical disectors). Although this can be cost-limiting for some laboratories, free or low-cost alternatives available can allow those with limited financial resources to perform these types of studies. For example, a free online tool is available called the STEPanizer that can be used to apply stereological test systems to digital photomicrographs or other images. 31 Most important and unavoidable, trained technical staff is important, as the sections produced for stereology should be as artifact free as possible. However, this is also the case for other quantitative assessments, such as 2D histomorphometry.
Another important consideration for stereology studies is the inclusion of additional animals for a pilot study. This is extremely important to determine the optimal tissue sampling procedure, sectioning interval, staining protocol, and how to best sample fields of view and apply stereological test systems/probes. A pilot cohort can also supply information regarding biological variation and precision.
Although stereology studies require more technical expertise and may be more labor intensive, the data obtained from these studies are unbiased and reliable, and they represent an absolute 3D estimate of the tissue or region of interest. The pathologist should play a key role in the conduct of these studies, from the initial study design to analysis of the data.
Footnotes
Acknowledgements
I thank Rogely Boyce for her input and advice on this manuscript, Hans J. G. Gundersen for his guidance with study design on many of the examples, and Cynthia Swanson for her assistance with figure preparation.
Declaration of Conflicting Interests
The author(s) declared no potential conflicts of interest with respect to the research, authorship, and/or publication of this article.
Funding
The author(s) received no financial support for the research, authorship, and/or publication of this article.
References
Supplementary Material
Please find the following supplemental material available below.
For Open Access articles published under a Creative Commons License, all supplemental material carries the same license as the article it is associated with.
For non-Open Access articles published, all supplemental material carries a non-exclusive license, and permission requests for re-use of supplemental material or any part of supplemental material shall be sent directly to the copyright owner as specified in the copyright notice associated with the article.