
Abstract
Chronic kidney disease is a major cause of morbidity and mortality in cats. Transglutaminase 2 (TG2) is a calcium-dependent enzyme proposed to mediate tubulointerstitial fibrosis in the kidney by cross-linking collagen fibrils. Postmortem kidney tissue was obtained from primary renal azotemic (n = 10) and nonazotemic (n = 5) cats (14 domestic short hair, 1 Burmese; aged 9–23.7 years). Extracellular matrix protein deposition was determined by Masson’s trichrome staining and collagen immunofluorescence. Total kidney transglutaminase (TG) enzyme activity and TG2 protein were measured in tissue homogenates by putrescine incorporation and Western blotting. Extracellular TG enzyme activity and TG2 protein were determined in situ by immunofluorescence, quantified by multiphase image analysis. Results were compared using the unpaired Student’s t-test with Welch’s correction. Elevated plasma creatinine, urea, and phosphate concentrations were associated with tubulointerstitial fibrosis but not glomerular fibrosis. Kidney homogenates from azotemic cats showed a 3-fold higher total TG enzyme activity and TG2 protein compared with kidneys from nonazotemic cats. Immunofluorescent studies performed in situ confirmed a 3-fold higher extracellular TG enzyme activity and TG2 protein in cats with azotemia. Tubulointerstitial TG2 showed a positive linear correlation with both renal function and tubulointerstitial fibrosis. In conclusion, for cats with azotemia, both filtration failure and tubulointerstitial fibrosis were associated with the upregulation of TG2, a collagen cross-linking enzyme and the major isoform of transglutaminase in the kidney. TG2 may provide a new therapeutic target for drugs designed to slow the progression of feline chronic kidney disease.
Chronic kidney disease (CKD) is an important issue in small animal medicine. 3 CKD is defined by a progressive deterioration in the structure and function of the kidney, resulting in electrolyte imbalance and the retention of metabolic waste products. 9 CKD is a syndrome commonly seen in aged cats, 8,35 the origin of which is often not apparent by the time it is recognized clinically. The syndrome has a heterogeneous etiology and may be initiated following partial recovery from acquired renal disease, be a congenital condition, or be part of the aging process. 1,4 In cats, both tubulointerstitial fibrosis (TIF) and, less frequently, glomerulosclerosis have been described, 47,52 and a retrospective study in the United States recently reported the incidence of CKD in randomly selected cats to be as high as 50%. 36 The development of TIF may be a consequence of tubular interstitial inflammation 12 and peritubular capillary loss, 11,54 predisposing the kidney to hypoxic conditions together with sustained oxidative stress. 39 Chronic oxygen deprivation may contribute to the scarring process by activating fibroblasts, with the subsequent deposition of collagen in the extracellular matrix. 41 In cats with azotemic CKD, interstitial fibrosis was the lesion best correlated with the severity of azotemia, hyperphosphatemia, and anemia. 10
A causal link has recently been established between the development of renal fibrosis and the upregulation of a group of cross-linking enzymes, the transglutaminases (TGs). 20,24,44 The TGs are calcium-dependent enzymes able to cross-link collagen proteins through the generation of an ∊-(γ-glutamyl)-lysine dipeptide bond, making them highly resistant to proteolytic degradation. 33,49 The cross-link reaction is triggered following calcium activation when TG is exported into the extracellular space. 49,50 Transglutaminase (TG2) is expressed by infiltrating macrophages 19 together with a number of resident renal cell types, including endothelial, mesangial, 15 and tubular cells. 25 TG2 transcription may be stimulated by stress factors such as hypoxia, acidosis, oxidative stress, hyperglycemia, or inflammatory cytokines. 22,45,49
The aim of this study was to determine whether TG is expressed in the feline kidney and whether its expression is associated with reduced renal function and pathological fibrosis. To address these questions, kidneys were obtained from cats with varying degrees of renal dysfunction and pathological fibrosis at postmortem. Total TG enzyme activity and total TG2 protein expression were measured in kidney homogenates, and extracellular TG enzyme activity and TG2 protein expression were determined in situ by immunofluorescence.
Material and Methods
Clinical History
Kidney tissue was obtained for 15 cats from a biorepository bank of cat tissue stored (–80°C) with owner-informed consent postmortem following euthanasia (Royal Veterinary College, London, UK). Clinical histories are shown in Table 1. Fourteen of 15 cats were of domestic shorthair varieties; 1 of 15 was a Burmese. The average age at euthanasia was 16.2 years (range, 9–23.7 years). An essential inclusion criterion was the presence of a plasma biochemical profile obtained a maximum of 2 months prior to euthanasia. The following normal ranges were employed: plasma creatinine, 0.6 to 1.9 mg/dL; plasma urea, 18 to 62 mg/dL; plasma phosphate, <4.5 mg/dL; urinary-specific gravity, >1.035; and urinary protein creatinine ratio (UPC): nonproteinuric, <0.2; borderline proteinuric, 0.2 to 0.4; and proteinuric, >0.4.
Clinical History.
ACE, angiotensin-converting enzyme inhibitor; CCB, calcium channel blocker; CKD, chronic kidney disease; DHS, domestic short hair; y, Age is displayed in years at death.
The International Renal Interest Society (IRIS) staging scheme 14 divides CKD in cats into 4 stages, according to their plasma creatinine (stage 2, 2.0–2.8 mg/dl; stage 3, 2.9–5.0 mg/dl; and stage 4, >5.0 mg/dl). Cats were divided into a nonazotemic control group (n = 5), where plasma creatinine was within the normal range, and those with primary renal azotemia (stage 2, n = 3; stage 3, n = 3; stage 4, n = 4; n = 10 in total). Plasma analysis was performed by Idexx Laboratories (Wetherby, UK). Urine protein and creatinine were measured using pyrogallol red and picric acid methods, respectively.
Kidney Fibrosis
Stereology
Kidneys were fixed in 10% neutral-buffered formalin and evaluated by a specialist veterinary pathologist (C.A.B.) without previous knowledge of any clinical pathology. Paraffin-embedded sections (3 μM) were stained with periodic acid–Schiff and hematoxylin. Cortical interstitial fibrosis was scored from 0 to 3, in 0.5 intervals, 10 as follows: score 0, no fibrosis/inflammation or rare small foci; 1, mild or scattered multifocal areas of fibrosis/inflammation affecting less than 25% of the tissue section; 2, moderate fibrosis/inflammation affecting 25% to 50% of the section; and 3, diffuse or coalescing fibrosis/inflammation affecting more than 50% of the section. Glomerulosclerosis was scored from 0 to 3 21 for 25 glomeruli per sample (600×): score 0, matrix encircling no more than 1 nucleus (no fibrotic tuft); 1, matrix could surround several nuclei but not extended to the peripheral capillary loops (between 1% and 25% fibrotic); 2, moderate matrix expansion involving peripheral capillary loops affecting less than 50% of the glomerulus (between 26% and 50% fibrotic tuft); and 3, moderate matrix expansion affecting more than 51% of the glomerulus. The score for each glomerulus was averaged and divided by the number of glomeruli measured.
Image analysis
Paraffin-embedded kidney sections (5 μM) were stained with Masson’s trichrome (MT). 24 Twelve cortical fields were acquired from each section for the tubulointerstitium (200×) and the intraglomerular mesangial area (IGMA) (400×) using a CC-12 digital camera (Soft Imaging Systems, Muenster, Germany). The IGMA was assessed by centering a squared frame on the glomerular tuft, excluding glomerular parietal epithelial cells and Bowman’s capsule. Both tubulointerstitial and IGMA blue areas were measured by multiphase image analysis (Cell F software, Olympus, Germany). The area of positive stain was expressed as a percentage of the total field.
Kidney cryostat sections (8 μM) were incubated with 5% bovine serum albumin in 0.01% Triton (room temperature, 10 minutes), followed by incubation with a mouse monoclonal collagen I antibody (1:20, Ab 6308; Abcam, Cambridge, MA) or a goat polyclonal collagen III antibody (1:150; 1330-01; SouthernBiotech, Birmingham, AL) (4°C, overnight), then washed and fixed in cold acetone. Collagen I was revealed using a secondary antibody labeled with Alexa red: a goat anti–mouse IgG (1:50, sc-362277; Santa Cruz Biotechnology, Santa Cruz, CA). Collagen III was revealed using a secondary antibody labeled with FITC: a rabbit anti–goat IgG (1:150, FI5000; Vector Laboratories, Burlingame, CA). 20 Sections were washed and mounted using MOWIOL-DAPI mounting media. Twelve cortical fields 200× (tubulointerstitial) and 400× (IGMA) were captured using an F-View II camera (Soft Imaging Systems) and subjected to multiphase image analysis. The area of fluorescence (Alexa red) was expressed as a percentage of the field.
Transglutaminase Enzyme Activity
Total TG enzyme activity
Total transglutaminase activity was measured in kidney homogenates by 3H putrescine incorporation into N,N′-dimethylcasein. 32 Kidney homogenates (10% w/v) in STE buffer (0.25 M sucrose, 0.03 M Tris, 0.05 M EDTA) and protease inhibitors (Free EDTA Complete Protease Inhibitor Cocktail Tablets; Roche, Indianapolis, IN) were incubated (37°C) with 60 mM 3H putrescine (65 Ci/mmol), 40 mM dithiothreitol (DTT), 25 mg/ml N,N′-dimethylcasein, and 25 mM CaCl2 in a final volume of 50 μl. Homogenate protein concentration was determined using a colorimetric assay (DC Protein Assay, 500-0120; Bio-Rad, Hemel Hempstead,UK). Recombinant rat TG2 1:1000 (T038; Zedira, Darmstadt, Germany) was used as the positive control. Negative controls were obtained using either the TG inhibitor 1, 3-dimethyl-2[(oxopropyl)thio]-imidazolium chloride (50 μM, D003; Zedira) or 100 mM EDTA. Then, 10 μl of the mixture was spotted onto 3-mm filter paper at 0, 5, 10, 20, and 60 minutes and precipitated with cold 10% trichloroacetic acid. The precipitated protein was determined by scintillation counting. EDTA controls were subtracted from the samples values. One unit of TG activity was equivalent to 1 nmol of putrescine incorporated per hour at 37°C. The results were expressed per milligram of protein. For in vitro studies, the nonselective TG inhibitor NTU 281 (100 μM) and the selective TG2 neutralizing monoclonal antibody BB7 (3.3 nM) were employed.
Extracellular TG enzyme activity
Cryostat kidney sections (8 μM) were blocked in 5% goat serum, 10 mM EDTA, and streptavidin 5-mg/mL protease inhibitors (Complete Protease Inhibitor Cocktail Tablets; Roche) in Triton 0.01% and incubated (1 hour, 37°C) with 0.5 mM biotin cadaverin (Molecular Probes, Invitrogen, Carlsbad, CA), 5 mM DTT, and 5 mM CaCl2, and extracellular TG activity was determined in situ. 25 Controls were incubated with 10 mM EDTA (calcium chelator), 100 μM TG inhibitor using 1, 3-dimethyl-2[(oxopropyl)thio]-imidazolium chloride (D003; Zedira), or anti-TG2 mouse monoclonal (CUB7402; Abcam). Sections were washed, fixed with cold acetone, air dried, and blocked with 3% bovine serum albumin (BSA) (4°C, overnight). Sections were probed with streptavidin Alexa red (1:300, Alexa Fluor 594; Invitrogen) in 3% BSA, incubated (2 hours, 37°C), washed, and mounted using MOWIOL-DAPI mounting media. Twelve cortical fields acquired at 200× (tubulointerstitial) and 400× (IGMA) were subjected to multiphase image analysis and quantified using the percentage area of Alexa red fluorescence per field.
Transglutaminase 2 Protein
Total kidney TG2 protein
Cat kidney homogenates (10% w/v) in STE buffer were separated on a 10% polyacrylamide gel (27 μg protein/lane), 28 transferred to a PVDF membrane (Immobilon-P; Millipore, Billerica, MA), and blocked with 10% skimmed milk. Human recombinant TG2 (1:250, T002; Zedira) and guinea pig TG2 (1:200, T006; Zedira) were used as positive controls. Whole rabbit serum (1:2000; Santa Cruz Biotechnology) and rabbit IgG (Vector Laboratories) were used as negative controls. The blot was probed with a primary rabbit polyclonal TG2 antibody (1:2000, Ab421; Abcam) and revealed by using a secondary polyclonal goat anti–rabbit horseradish peroxidase antibody (1:10 000; P0448, DAKO, Carpinteria, CA). Chemiluminescent blots were captured by a ChemiDoc MP Image System (170-8280; Bio-Rad). Determination of molecular weight was by comparison to bands obtained with Precision Plus Protein dual-color molecular weight markers (16-03-64; Bio-Rad) using the ChemiDoc Image System Software. Volume density measurements are shown for the TG2 band at 75 kDa.
Extracellular kidney TG2 protein
Kidney cryostat sections (8 μM) were incubated with 5% BSA in 0.01% Triton (room temperature, 10 minutes), followed by incubation with a rabbit polyclonal TG2 antibody (1:100, Ab421; Abcam) (4°C, overnight), then washed and fixed in cold acetone. TG2 was revealed by using a secondary goat anti–rabbit IgG labeled with Alexa red (1:400, Alexa Fluor 594; Invitrogen). 20 Sections were washed and mounted using MOWIOL-DAPI mounting media. Twelve cortical fields 200× (tubulointerstitial) and 400× (IGMA) were subjected to multiphase image analysis. The percentage area of fluorescence (Alexa red) was quantified by image analysis and expressed as a percentage of the field.
Statistical Analysis
Data analysis and presentation were performed using Prism 5 software (GraphPad Software, La Jolla, CA). The cross-sectional data were analyzed by unpaired 2-tailed Student’s t-test with Welch’s correction. To evaluate group correlations, we calculated r 2 by linear regression analysis. The statistical significant level was defined as P < .05.
Results
Kidney Function
Azotemic cats were selected for their higher plasma creatinine (3.9-fold) compared with the nonazotemic controls, in which plasma creatinine concentrations were within the normal range. Measurements of kidney function are shown in Table 2. Cats with azotemia also had a significantly higher plasma urea (2.9-fold) and plasma phosphate (2.2-fold), but the higher mean values of systolic blood pressure and urinary protein/creatinine ratio did not reach statistical significance. Seven of 10 cats with azotemia were proteinuric compared with 1 of 3 for the nonazotemic controls. Urine-specific gravity was not significantly different between nonazotemic (1.014–1.046) and azotemic (1.011–1.024) animals. One cat (cat No. 2) included within the nonazotemic group had a normal serum creatinine but elevated UPC, with a history of recurrent urinary tract infection.
Renal Function.
Results are expressed as mean ± SEM. Number of samples assayed is shown in parentheses.
a P < .01.
b P < .005.
c P < .05.
Kidney Fibrosis
Stereology
Interstitial fibrosis and glomerular fibrosis scores were determined for each cat (Table 3). The interstitial fibrosis score showed a positive linear correlation with tubulointerstitial collagen I (r 2 = 0.38, P < .02). The interstitial fibrosis score also paralleled the stage of CKD, giving a positive linear correlation with plasma creatinine (r 2 = 0.56, P < .01), plasma urea (r 2= 0.48, P < .01), and plasma phosphate (r 2 = 0.45, P < .01). One cat (cat No. 10) was diagnosed with papillary necrosis. A weak positive linear correlation was also obtained between interstitial fibrosis determined by stereology and tubulointerstitial scarring assessed from staining with Masson’s trichrome (r 2 = 0.28, P < .05).
Renal Histopathology.
Masson’s trichrome
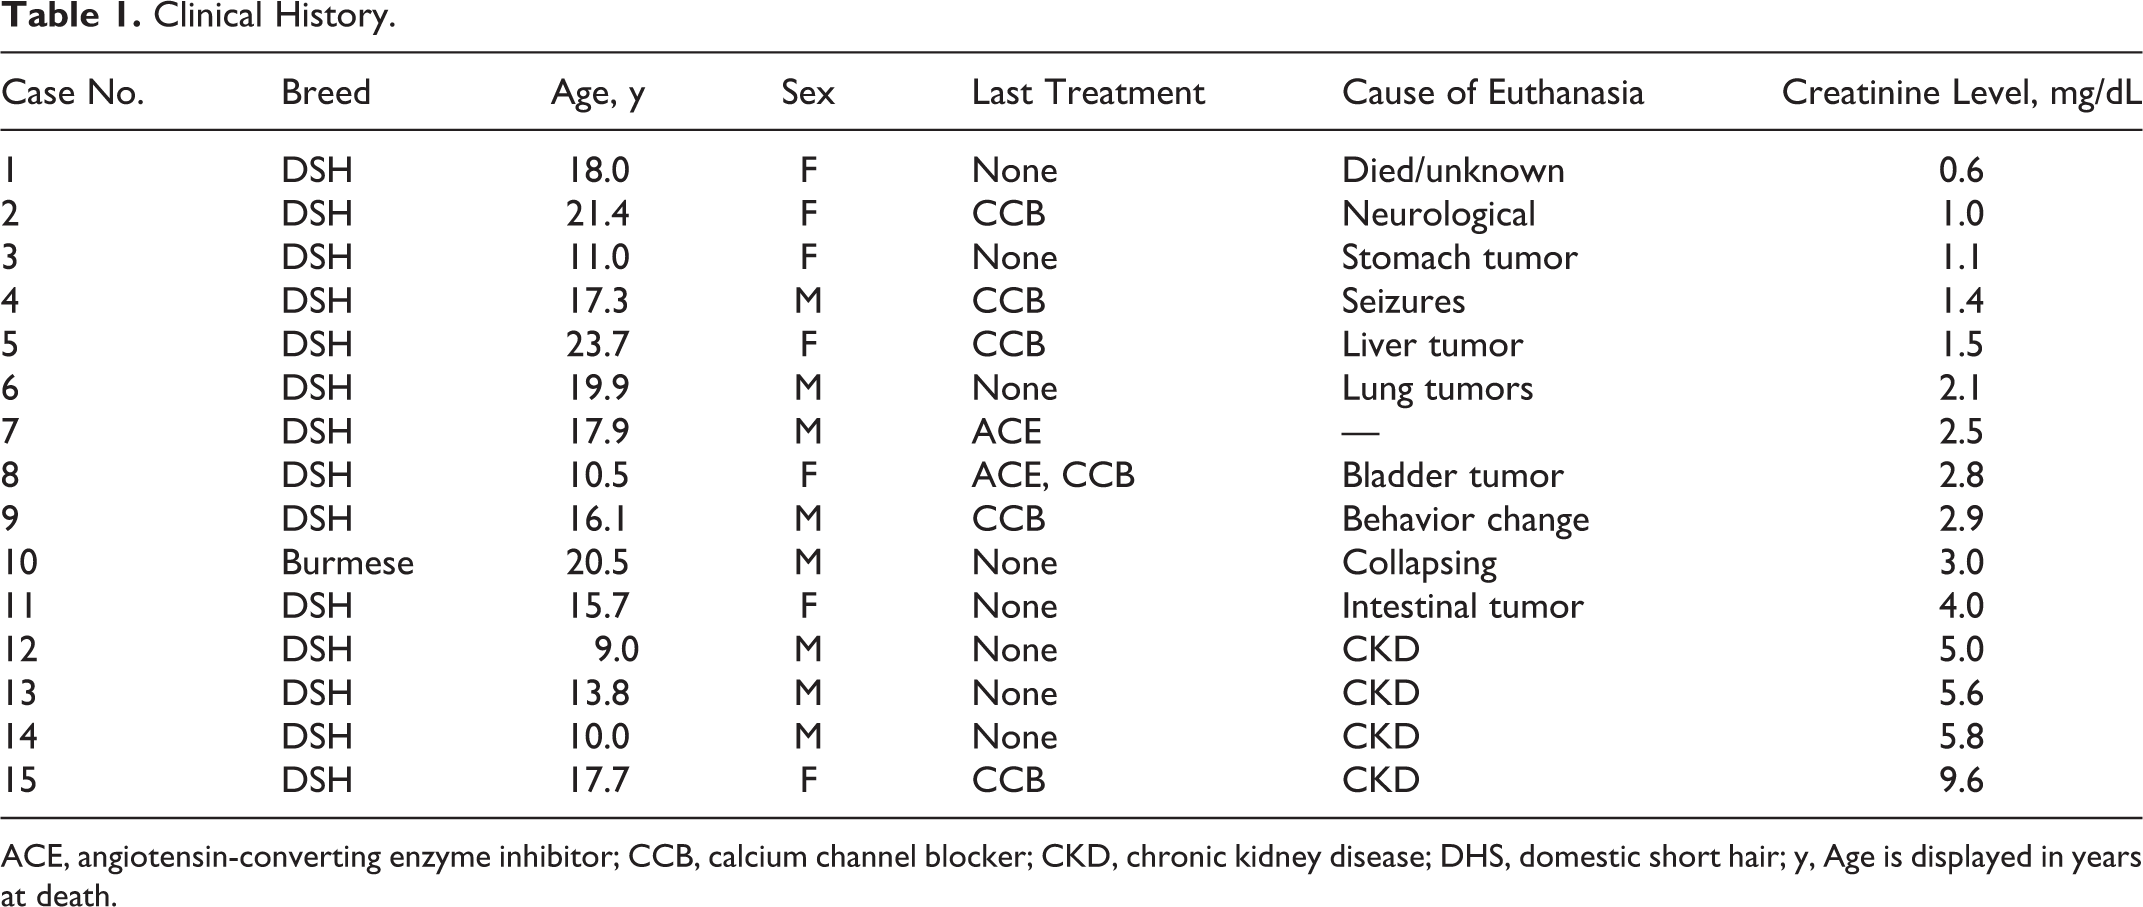
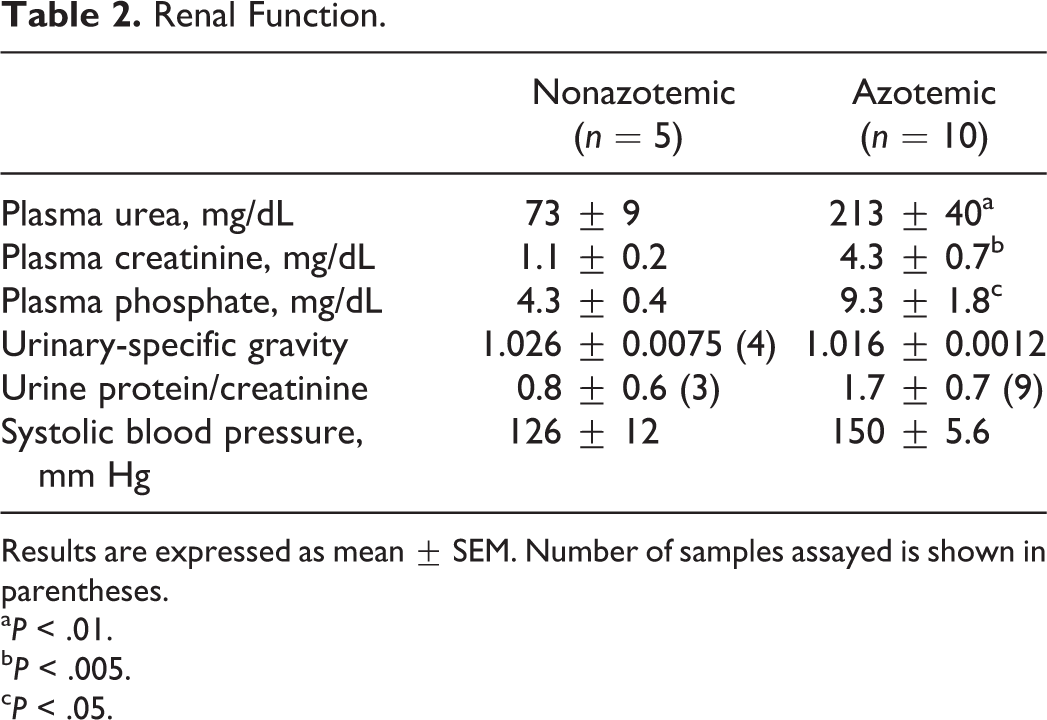
A representative kidney section from a nonazotemic cat showed discrete staining for Masson’s trichrome within the tubular basement membrane (Fig. 1). In contrast, a representative kidney section from an azotemic cat showed thicker staining for Masson’s trichrome in the tubular basement membrane and within the expanded interstitial compartment (Fig. 2). A group comparison of tubulointerstitial scarring between azotemic and nonazotemic cats is shown in Fig. 5. A 2.7-fold higher extent of tubulointerstitial fibrosis was apparent in cats with azotemia (5.5 ± 0.9 vs 1.9 ± 0.5 area %, P < .005) while glomerular fibrosis remained unchanged (4.7 ± 1.8 vs 5.7± 2.4 area %, P = not significant [NS]).
Nonazotemic, kidney cortex; cat No. 1. Normal histology with no tubular dilatation and minimal extracellular matrix (blue). Masson’s trichrome stain.
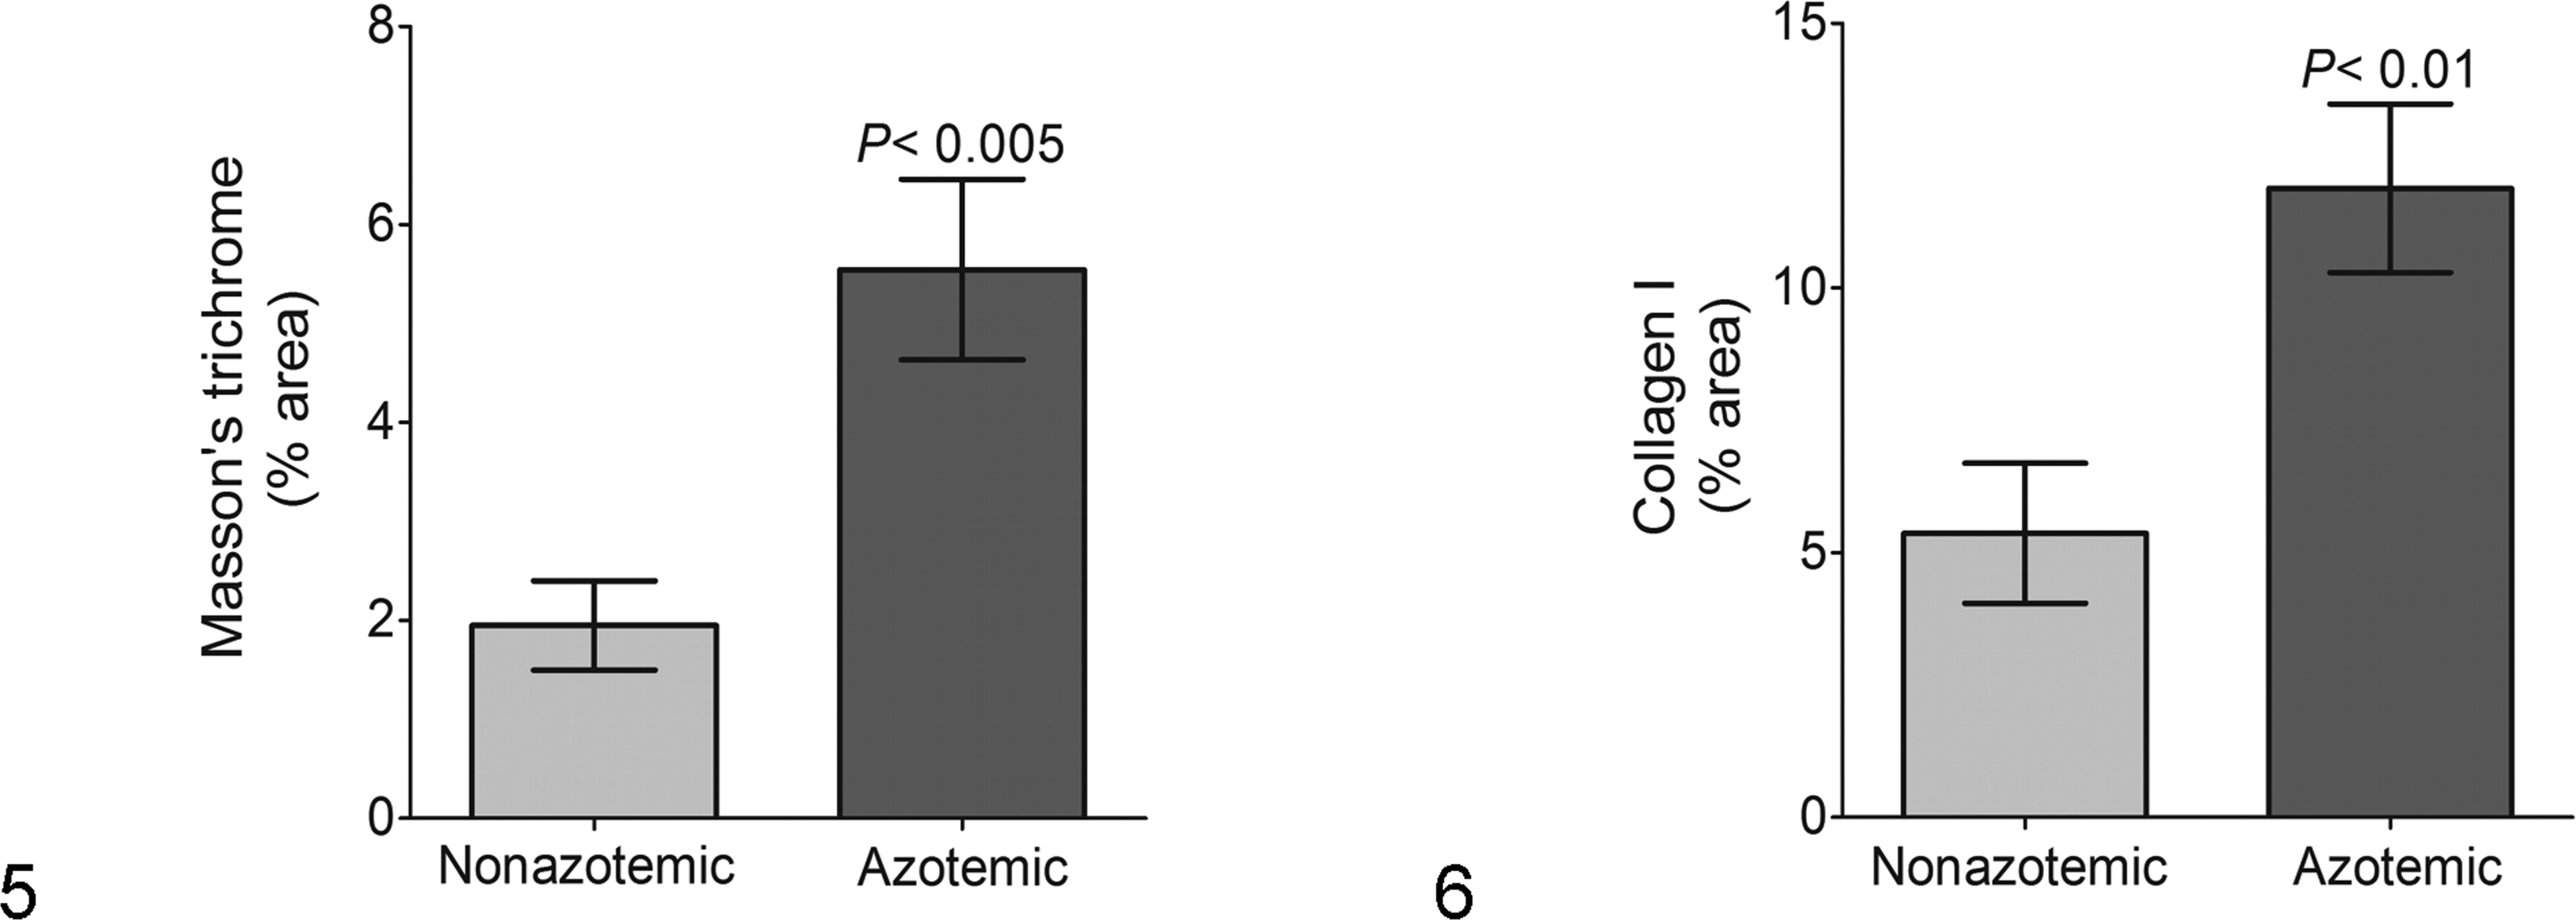
Significantly greater extracellular matrix deposition in kidney cortex from azotemic cats (n = 10) compared with nonazotemic cats (n = 5), determined from Masson’s trichrome staining. Vertical lines on columns are ± SEM.
Collagen I and collagen III
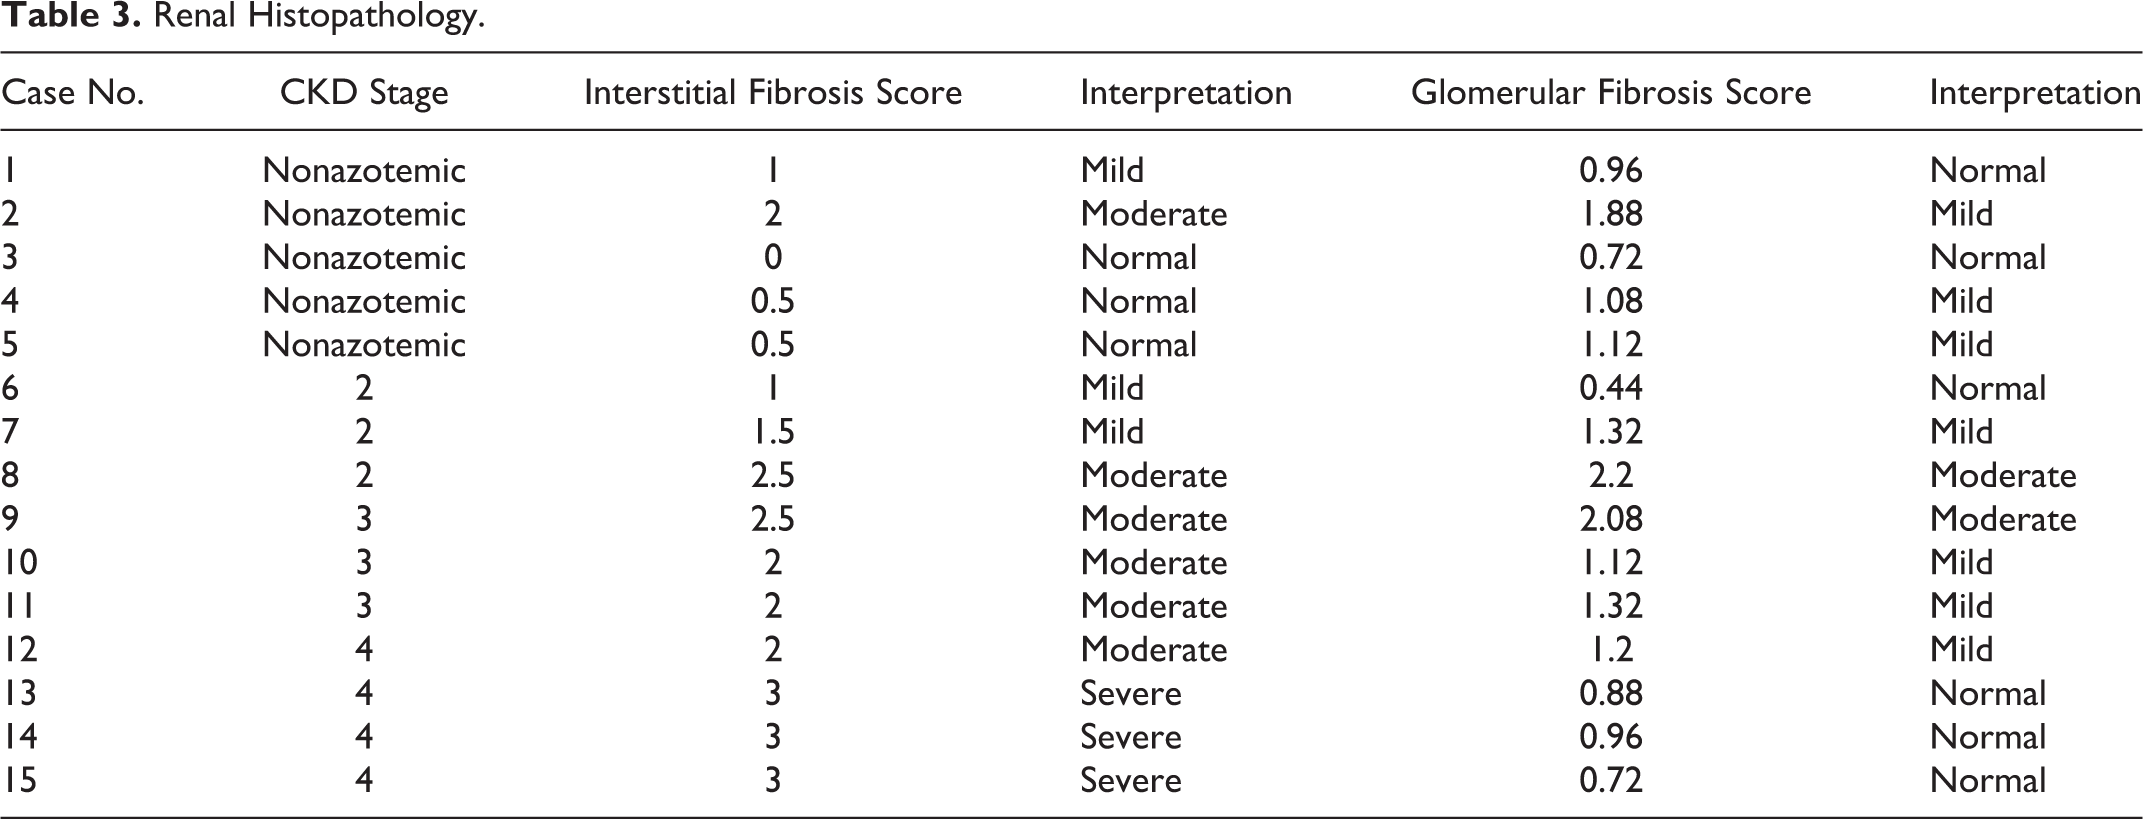
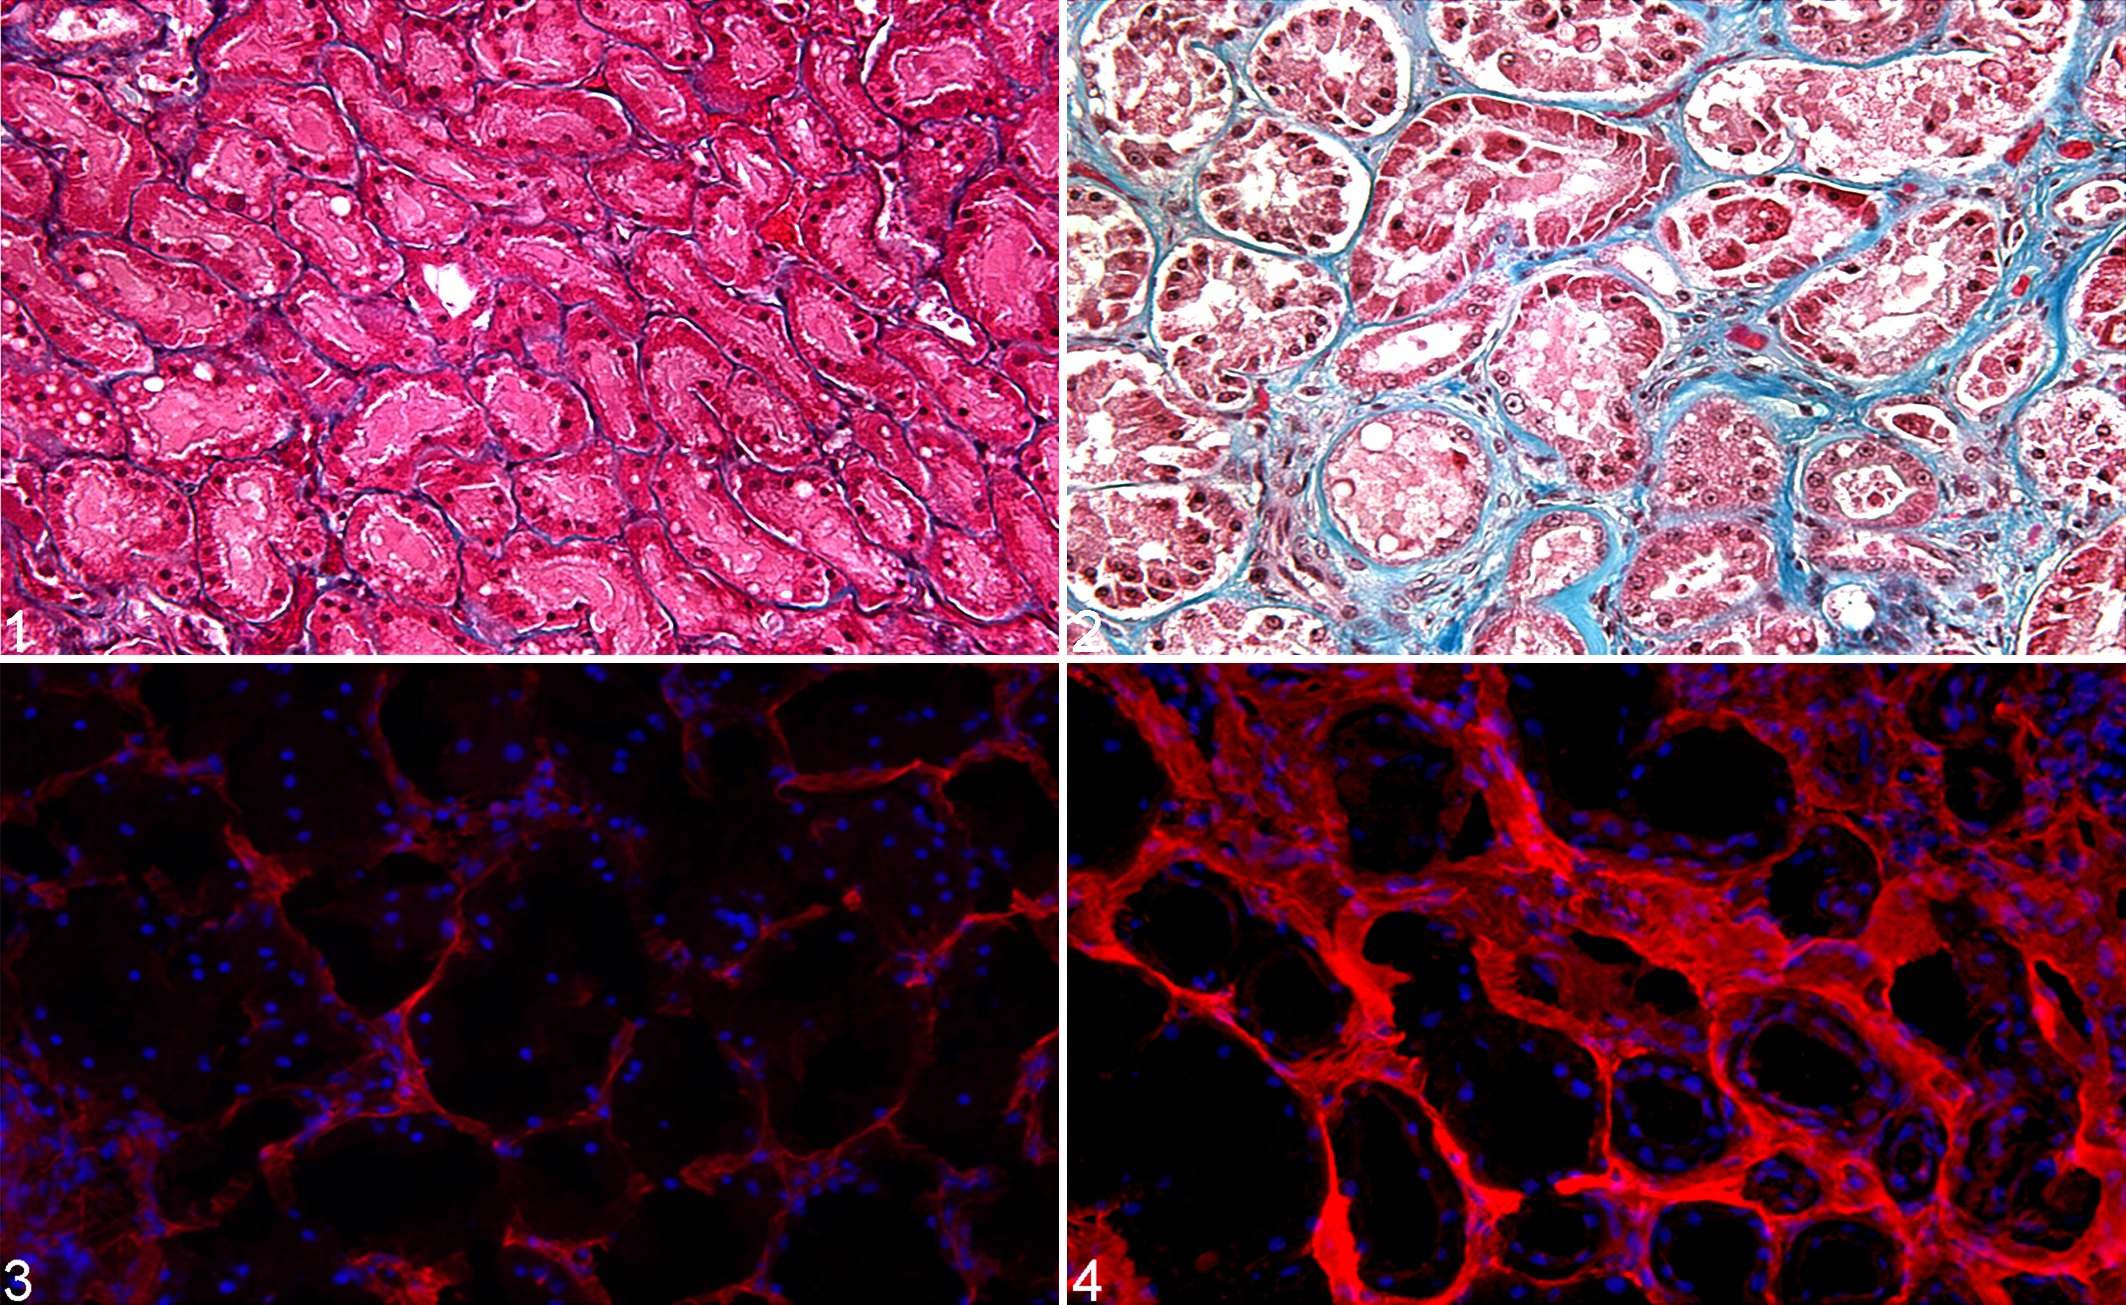
Representative examples of fluorescent staining (Alexa red) for tubulointerstitial collagen I are shown for a nonazotemic cat (Fig. 3) and an azotemic cat (Fig. 4). Cell nuclei detected by DAPI are shown in blue. Cats with azotemia were associated with a 2.2-fold greater area of tubulointerstitial staining for collagen I (11.9 ± 1.6 vs 5.4 ± 1.3 area %, P < .01) (Fig. 6) but with no difference in fluorescent staining for tubulointerstitial collagen III (8.6 ± 1.3 vs 7.3 ± 1.9 area %, P = NS). No difference in either glomerular collagen I or III was detected.
Total Kidney Transglutaminase
Total TG enzyme activity was 3-fold higher in kidney homogenates obtained from cats with azotemia (37.2 ± 8.1 vs 10.9 ± 2.3 nmol putrescine per hour at 37°C, P < .02) (Fig. 9). A representative Western blot of total TG2 protein in the kidney is shown for nonazotemic cats (n = 5) or azotemic cats (n = 10) (Fig. 7). Recombinant human TG2 (positive control) gave a single band at 78 kDa. Cat kidney homogenates (27 μg protein/lane) gave 2 bands at 75 kDa (TG2) and 83 kDa. The mean volume density of the 75-kDa band obtained from cats with azotemia was approximately 3-fold higher than that from nonazotemic cats (60 300 ± 14 870 vs 21 270 ± 4046 OD mm2/µg protein, P < .05) (Fig. 8). A strong positive linear correlation was obtained between total TG2 protein, measured by Western blotting, and total TG enzyme activity, measured by putrescine incorporation, in tissue homogenates from cat kidneys (Fig. 10).
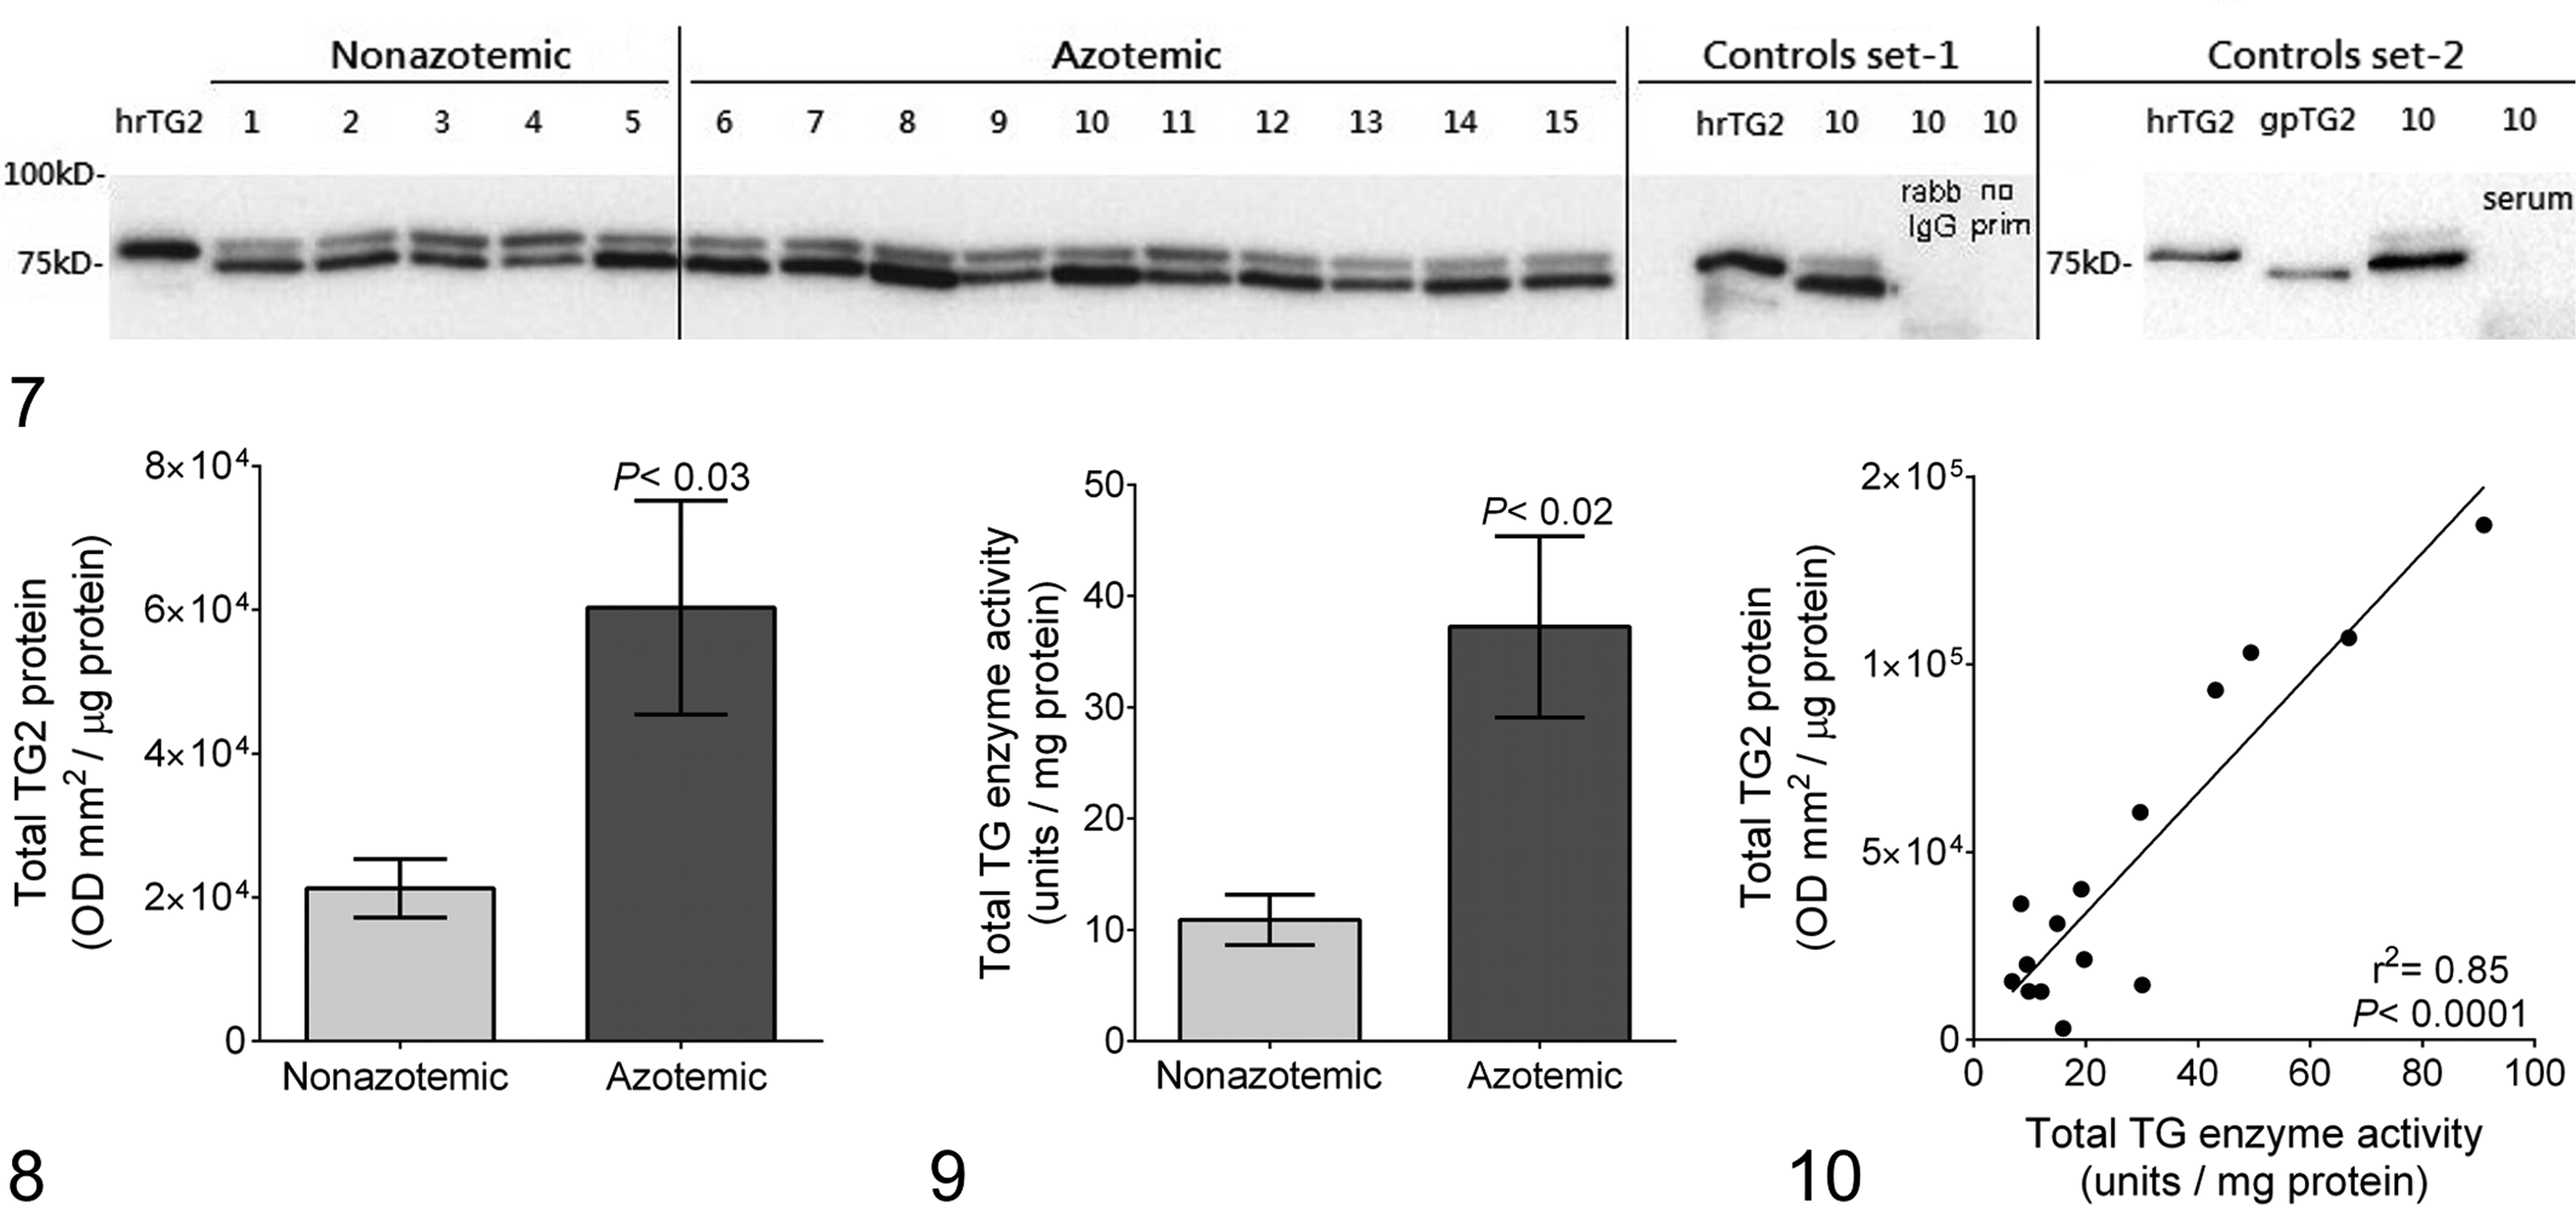
Western blot for cat kidney transglutaminase 2 (TG2) from nonazotemic (cat Nos. 1–5) and azotemic animals (cat Nos. 6–15). Kidney homogenates were immunoprobed with a rabbit polyclonal TG2 antibody (rpTG2). Human recombinant TG2 (hrTG2) was employed as a positive control (78 kDa). Kidney homogenates gave 2 bands at 75 kDa (TG2) and 83 kDa. Control set 1: hrTG2 and kidney homogenate (cat No. 10) were immunoprobed with rpTG2 antibody (first 2 lanes). Kidney homogenate (cat No. 10) was probed with or without rabbit IgG (second 2 lanes). Control set 2: hrTG2, guinea pig TG2, and kidney homogenate (cat No. 10) were probed with rpTG2 antibody and rabbit serum (last lane).
Extracellular Kidney Transglutaminase
Representative examples of kidney TG enzyme activity determined in situ are shown for a nonazotemic cat (Fig. 11) and for a cat with azotemia (Fig. 12). Intense fluorescence (red) was detected extracellularly in both the peritubular and interstitial space, quantified by image analysis. Significantly higher values (3.8-fold) were obtained for kidney tissue from cats with azotemia (30.1 ± 3.1 vs 7.9 ± 2.1 area %, P < .0001) (Fig. 15). Interstitial TG enzyme activity gave positive linear correlations with both a marker of renal function (plasma creatinine, r 2 = 0.30, P < .05) and a marker of matrix deposition (collagen I, r 2 = 0.35, P < .05). No significant difference in extracellular TG enzyme activity was detected in glomeruli (31.4 ± 7.9 vs 44.1 ± 4.3 area %, P = NS) obtained from azotemic and nonazotemic cats.
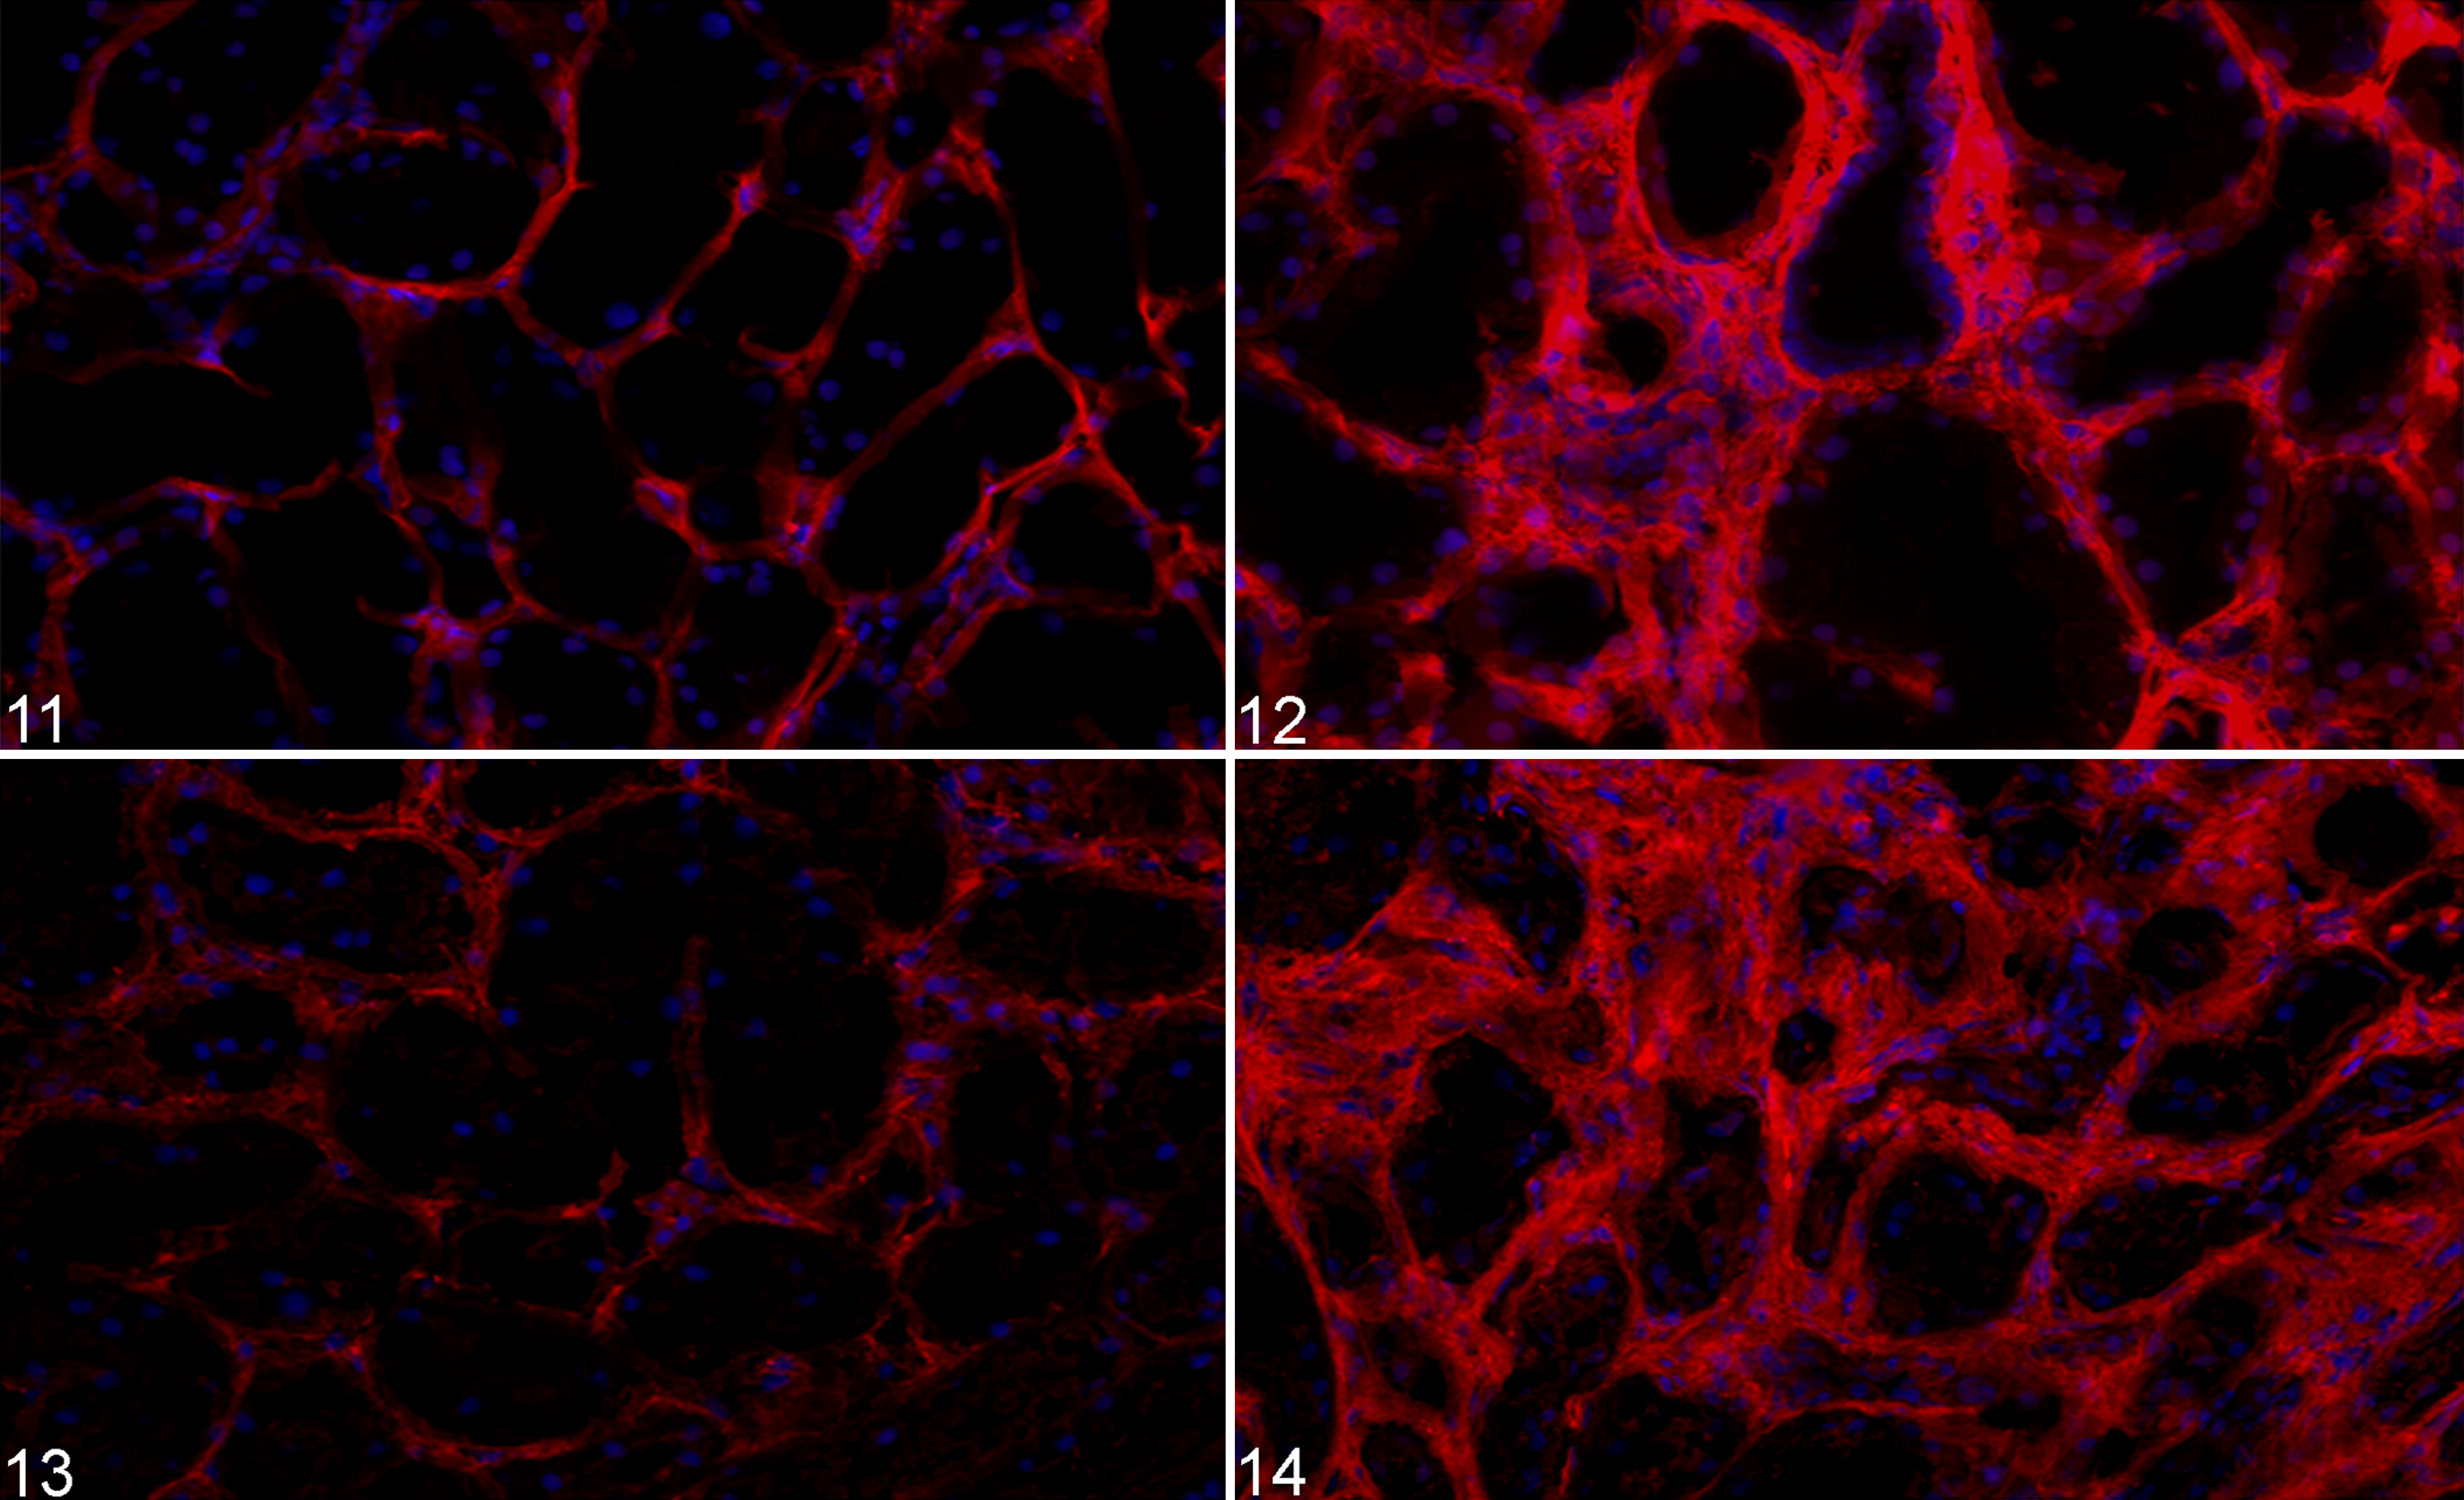
Nonazotemic, kidney cortex; cat No. 2. Minimal staining for extracellular transglutaminase (TG) enzyme activity (red); cell nuclei are shown in blue.
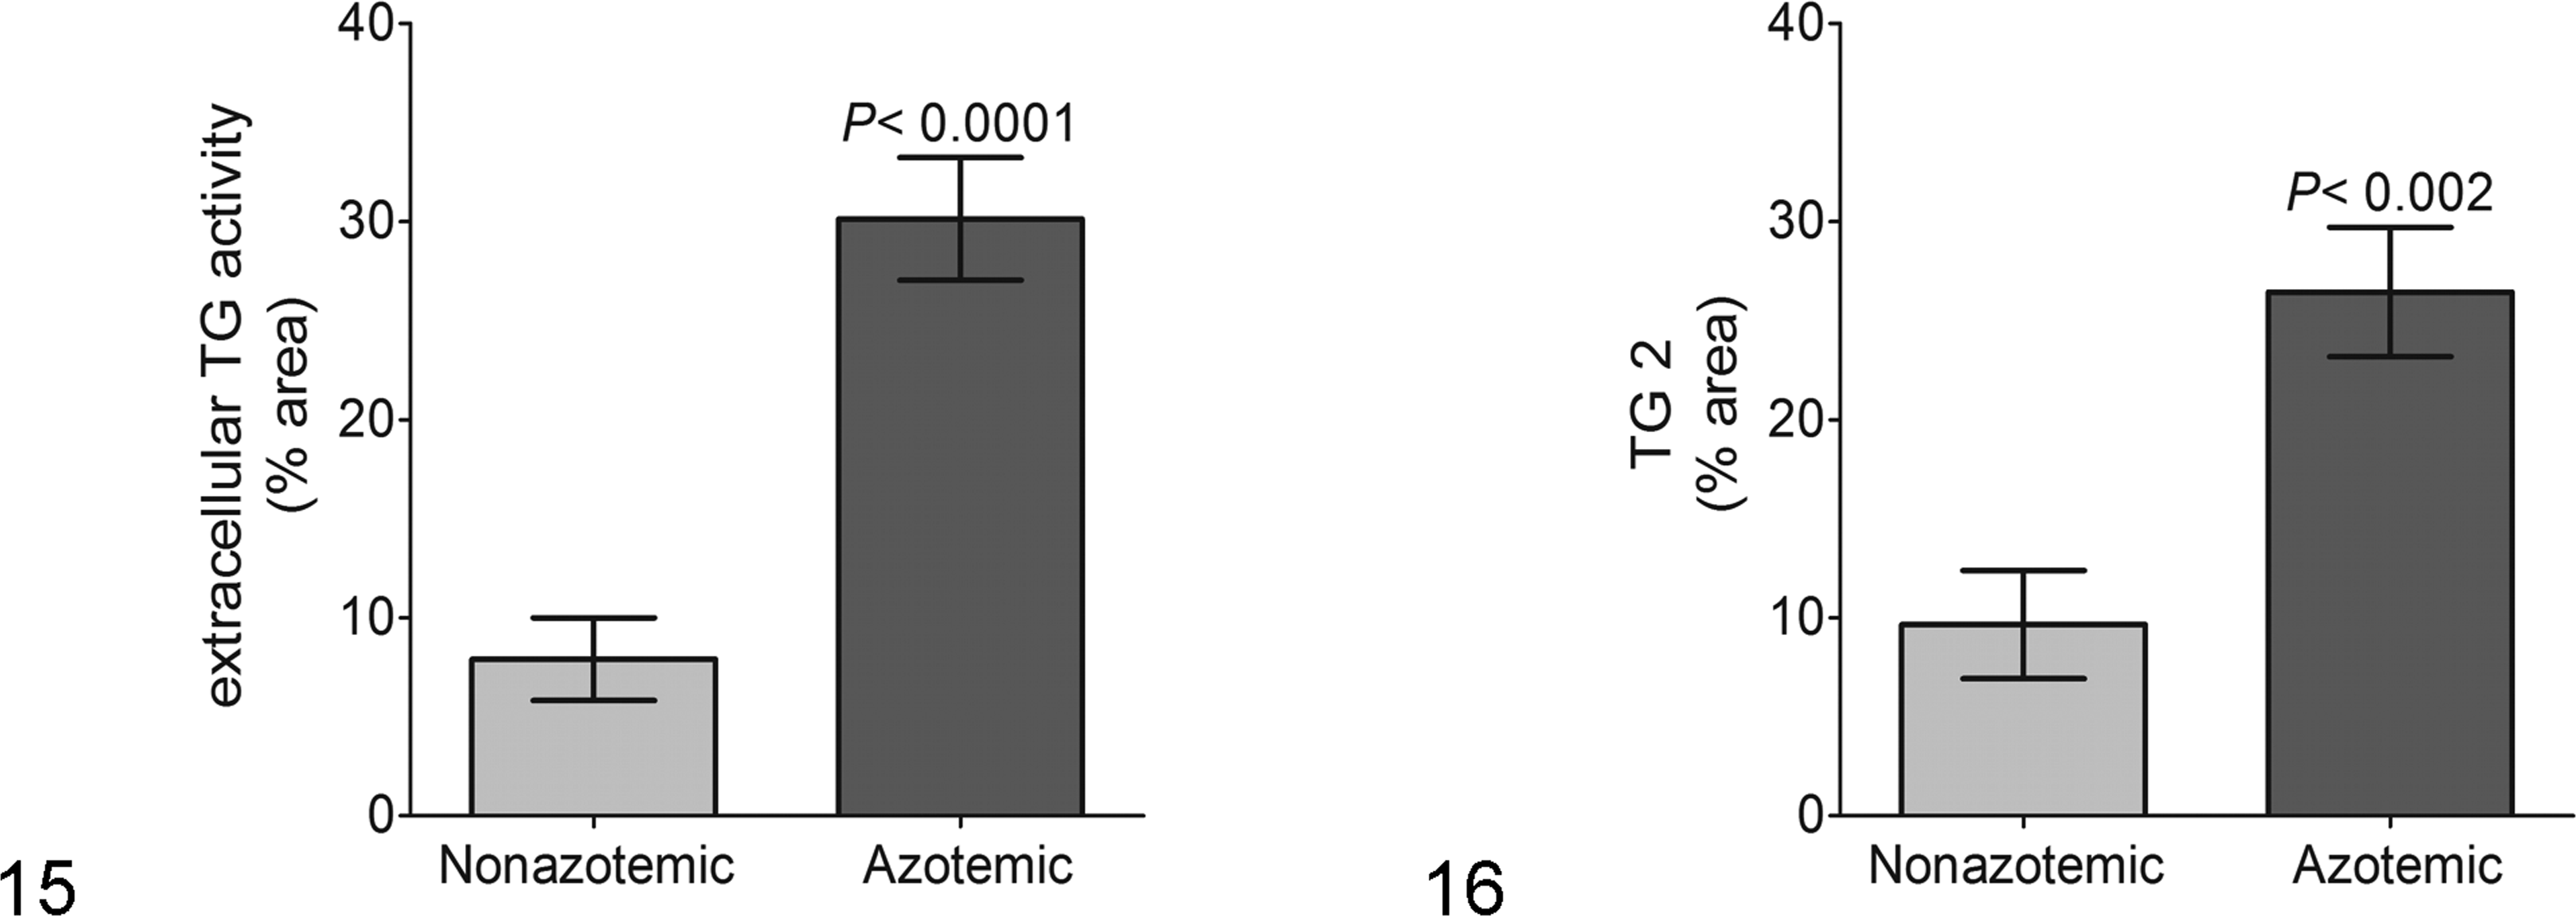
Significantly higher extracellular transglutaminase (TG) enzyme activity in the tubulointerstitium of cat kidneys obtained from azotemic (n = 10) compared with nonazotemic animals (n = 5). Vertical lines on columns are ± SEM.
Representative examples of cat kidney TG2 protein determined in situ by immunofluorescence are shown from a nonazotemic cat (Fig. 13) and from an azotemic cat (Fig. 14). Intense fluorescence was detected in the extracellular space of the tubulointerstitium. Significantly higher values (2.7-fold) were obtained for kidney tissue from azotemic cats compared with nonazotemic cats (26.4 ± 3.3 vs 9.7 ± 2.7 area %, P < .005), quantified by image analysis (Fig. 16). Extracellular TG2 protein in the tubulointerstitium showed a highly significant positive linear correlation with plasma creatinine (r 2 = 0.75, P < .0001) (Fig. 17), plasma urea (r 2 = 0.81, P < .0001), and plasma phosphate (r 2 = 0.76, P < .0001). Significant positive linear correlations could also be demonstrated with markers of matrix deposition, including Masson’s trichrome and collagen I (r 2 = 0.39 and 0.38, respectively, P < .05) (Figs. 18, 19). A significant positive linear correlation was also obtained between extracellular TG2 protein in the tubulointerstitium and extracellular TG enzyme activity (r 2 = 0.41, P < .02). No significant difference in extracellular TG2 protein was detected in glomeruli obtained from azotemic and nonazotemic cats (3.3 ± 1.5 vs 5.1 ± 1.7 area %, P = NS).
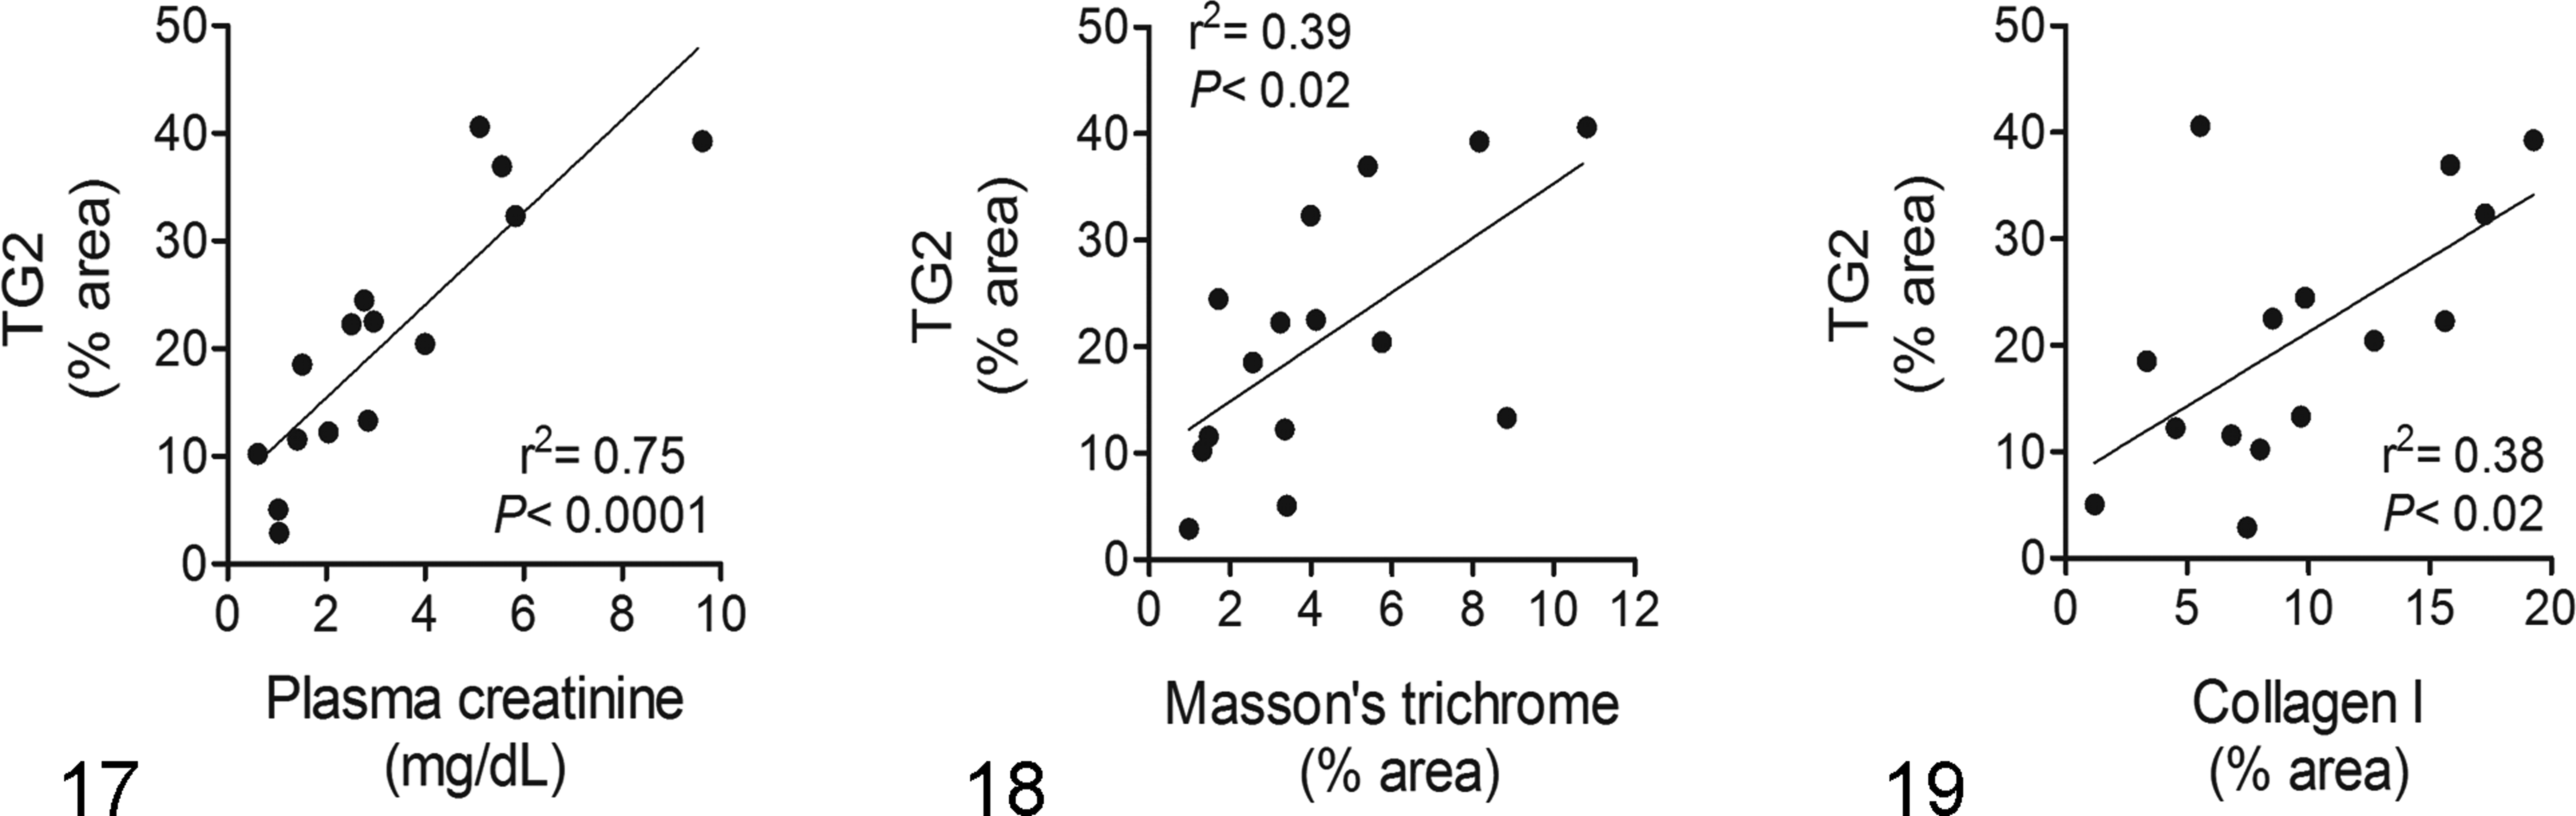
Positive linear correlation between plasma creatinine and extracellular transglutaminase 2 (TG2) protein in the tubulointerstitium of kidneys from nonazotemic and azotemic cats (n = 15).
Inhibition of TG Enzyme Activity In Vitro in Cat Kidney Homogenates
The effect of a nonspecific, small molecular weight TG inhibitor (NTU281) on TG enzyme activity in cat kidney homogenates is compared with a TG2-selective mouse monoclonal antibody (BB7) in Fig. 20. Both agents produced a high degree of enzyme inhibition in the cat kidney in vitro.
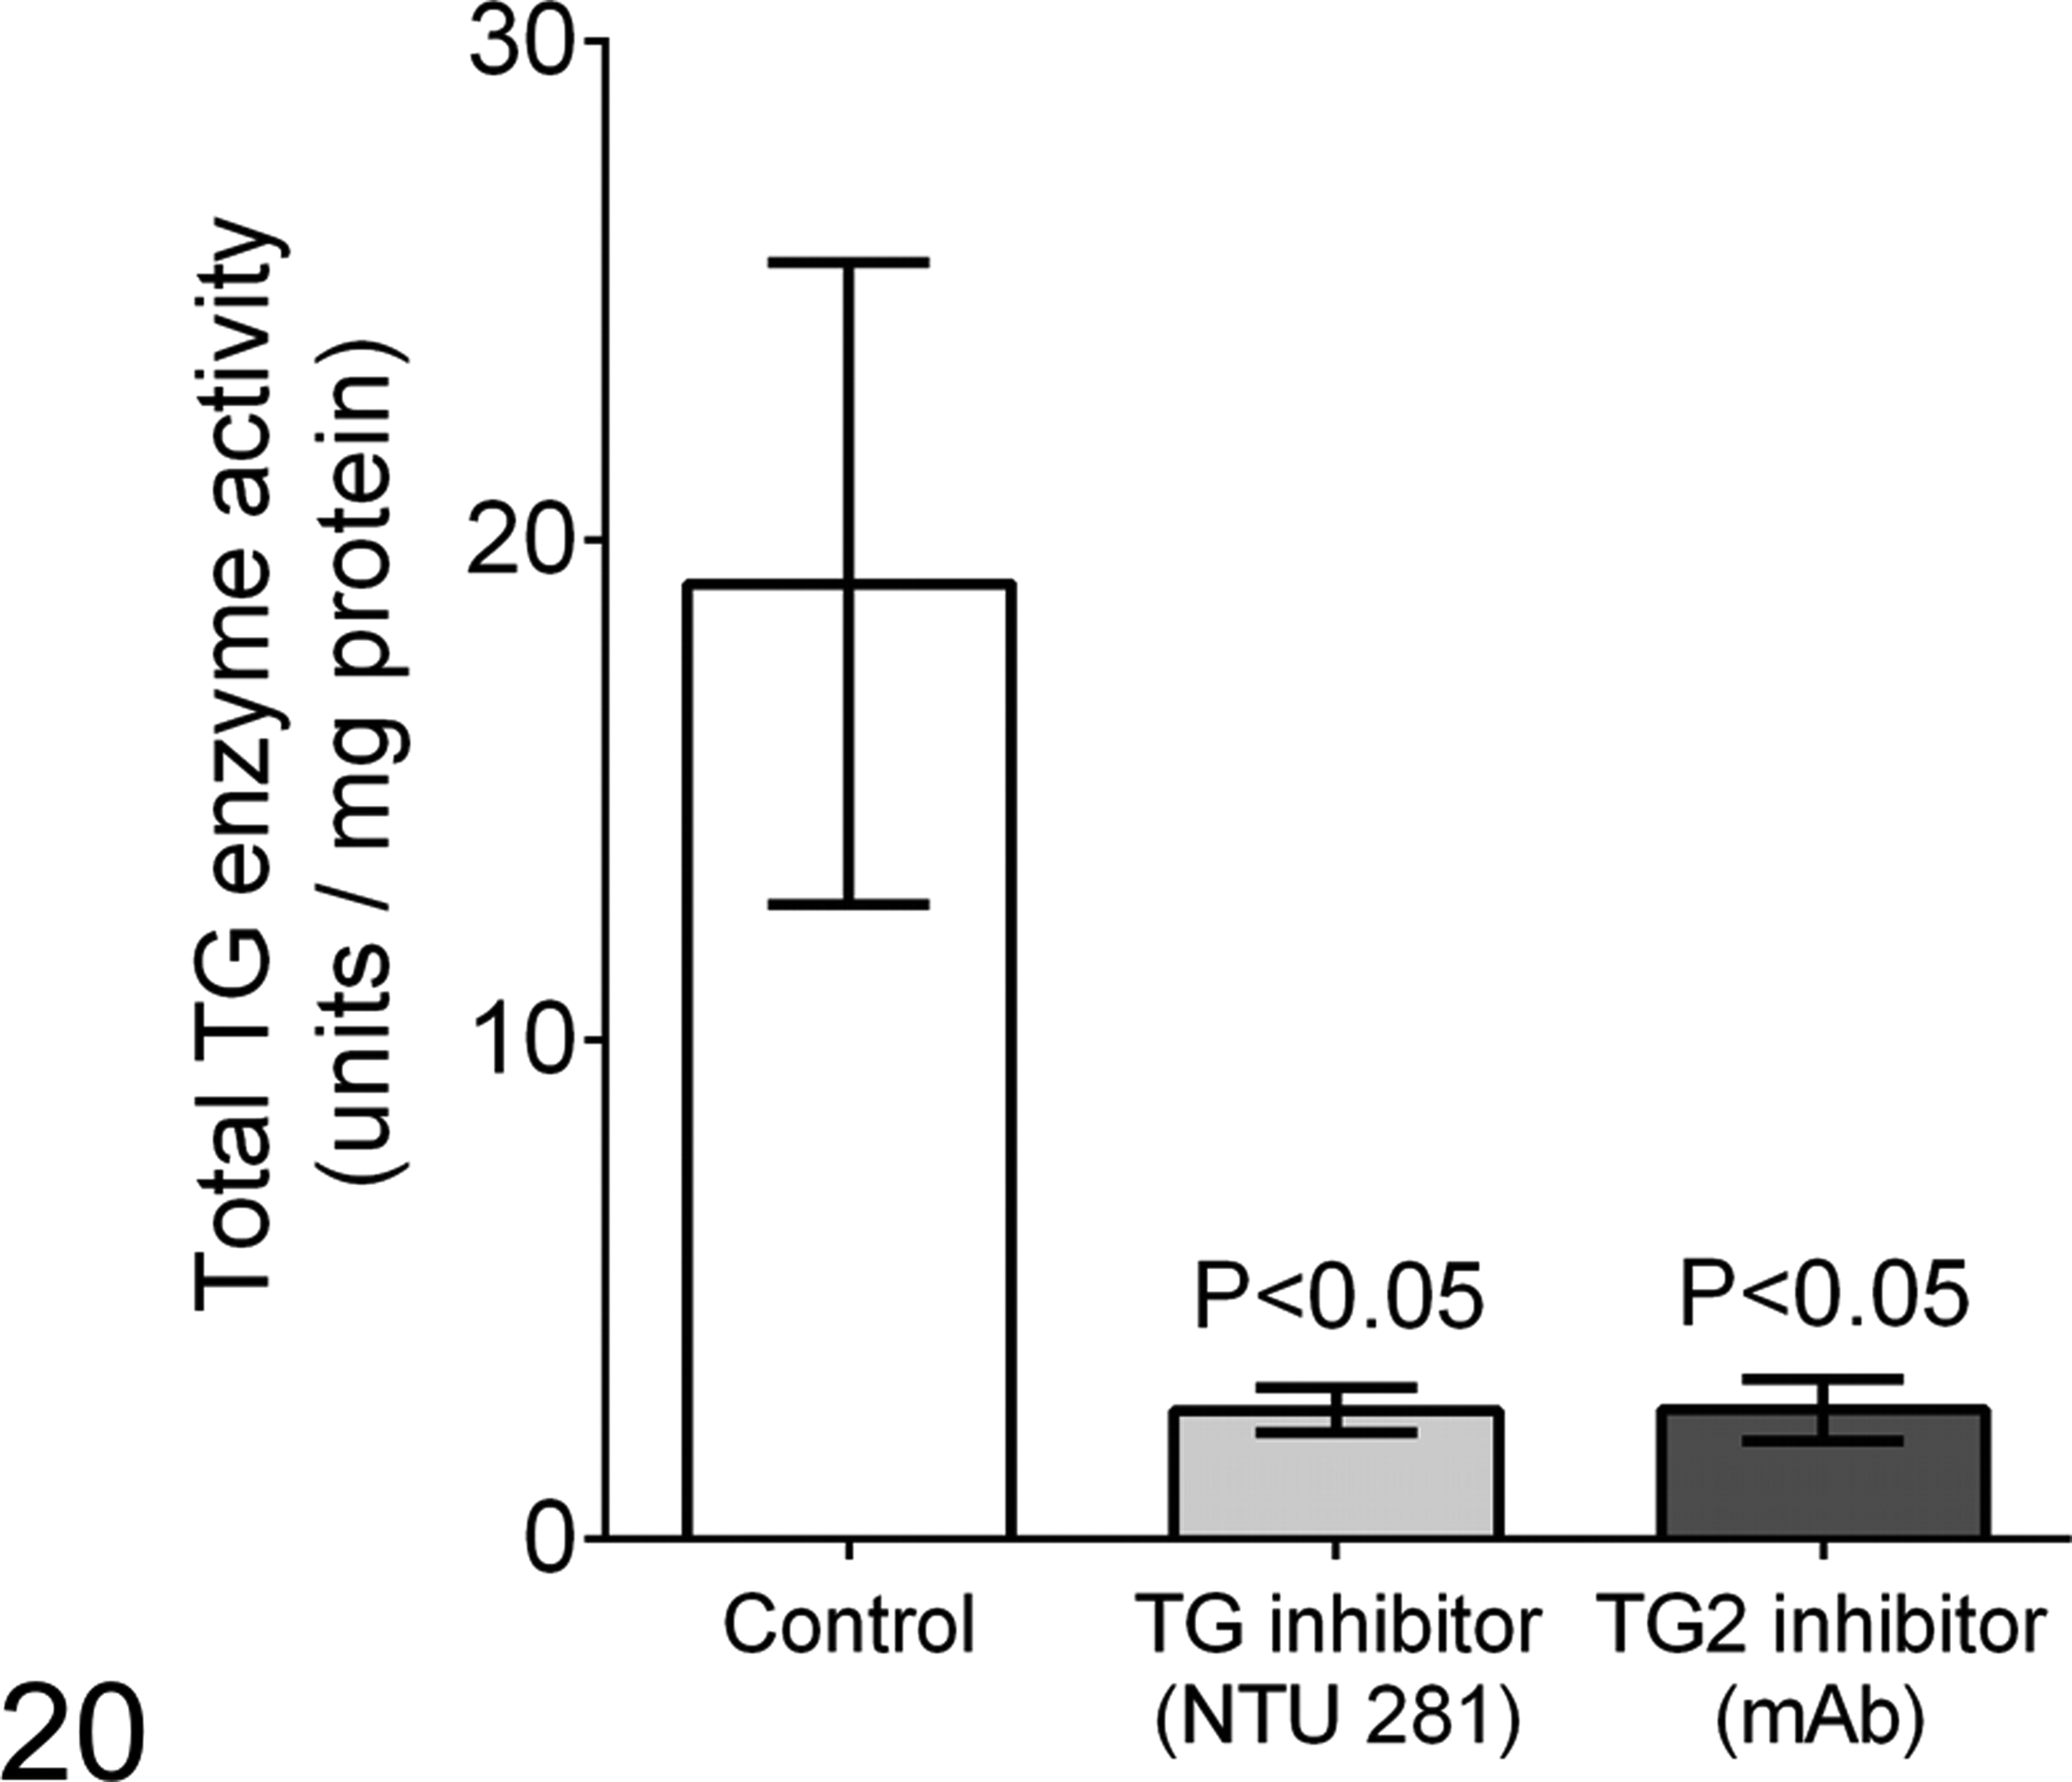
Inhibition of total transglutaminase (TG) enzyme activity in cat kidney tissue by a low MW, nonselective TG inhibitor (NTU 281) and a TG2-selective mouse monoclonal antibody (mAb) in vitro. Kidney homogenates were prepared from azotemic cat Nos. 6, 7, 8, 10, 12, and 15. Vertical lines on columns are ± SEM (n = 6).
Discussion
Postmortem kidney tissue was obtained from primary renal azotemic cats, with a wide range of renal dysfunction (IRIS scores; stage 2–4 CKD), and from nonazotemic cats of similar body weight, age, sex, and drug treatment. The presence of renal fibrosis was determined independently by a veterinary pathologist (masked to the clinical history) and by staining for matrix deposition, quantified by multiphase image analysis. Kidneys from nonazotemic cats, euthanized primarily due to neurological conditions and nonrenal cancers, showed no major histologic changes. On the basis of the plasma creatinine concentrations, these nonazotemic cats appeared to have normal excretory renal function, although, since plasma creatinine is an insensitive early marker of renal dysfunction, we cannot rule out the presence of mild kidney dysfunction. Cats with azotemia showed the presence of tubulointerstitial fibrosis with enhanced extracellular matrix and collagen I deposition. Kidney collagen I gave a strong positive linear correlation with plasma creatinine, the major marker of glomerular filtration. The absence of elevated collagen III deposition in kidneys from azotemic cats supported the presence of a mature form of renal fibrosis since collagen III, a scaffold for collagen I, is the predominant isoform of collagen only when deposited in the early stages of renal fibrosis. 29,53 Cats with azotemia showed little evidence of glomerular fibrosis. Glomerulosclerosis is thought to be a less consistent feature of CKD in the cat than in either the dog or humans, 13,34,37,52 although more recently, mild forms have been reported. 10 In humans, a strong correlation between tubulointerstitial fibrosis and renal function has been documented, independent of glomerulosclerosis. 7 As reported previously, 10 renal dysfunction seen in azotemic cats with CKD is related most clearly to tubulointerstitial damage rather than glomerular injury, perhaps suggesting that progressive fibrosis drives progressive deterioration in renal function.
Kidney homogenate studies showed a 3-fold higher total TG enzyme activity in cats with azotemia. Western blotting, with a rabbit polyclonal TG2 antibody, detected the presence of 2 bands at 75 kDa (TG2) and 83 kDa. Volume density measurements of the 75-kDa band (TG2) showed a 2.8-fold increase in cats with azotemia. Total TG2 protein gave a strong linear correlation with total TG enzyme activity. Human recombinant TG2, the positive control, gave a single band at 78 kDa. Recombinant human TG2 is N-terminally fused with a hexahistidine tag and contains 687 amino acids (total amino acids = 693). Cat TG2 has a 90% homology with human TG2 protein, with the secreted protein (protein ID ENSFCAP00000004444) containing 687 amino acids. 16 While no evidence is available to determine whether cat TG2 is a glycoprotein, the identification of potential Asn-glycosylation sites on the TG protein derived from guinea pig liver 23 initially suggested the 83-kDa band detected in cat kidney homogenates could represent a glycosylated form of the enzyme. However, the absence of any detectable carbohydrate in guinea pig liver TG 17 would indicate such a possibility to be unlikely.
Following its export from the cell, TG2 requires activation by extracellular calcium to cross-link proteins and enhance matrix deposition. In situ studies showed an approximately 3-fold increase in both extracellular TG enzyme activity and extracellular TG2 protein. Extracellular TG2 protein was detected in situ with the same rabbit polyclonal antibody used for Western blotting. In vitro studies using cat kidney homogenates demonstrated significant inhibition of total TG enzyme activity with a neutralizing mouse monoclonal TG2 antibody. Therefore, as in the rat and humans, TG2 would appear to be the major isoform of TG in the cat kidney. Importantly, extracellular TG enzyme activity and TG2 protein showed a significant linear correlation with markers of both renal function, including plasma creatinine, urea, and phosphate, and with tubulointerstitial fibrosis, including the deposition of matrix protein and collagen I.
A strong linear correlation between plasma phosphate and extracellular kidney TG2 could also be demonstrated. An imbalance in calcium and phosphate homeostasis is a common feature of CKD, 2 requiring the use of phosphate binders. Hyperphosphatemia in the cat has been associated with high morbidity and low survival; it has also been identified as an independent predictor for CKD progression. 18 Hyperphosphatemia stimulates parathyroid hormone production, indirectly suppressing renal vitamin D3 metabolism. 40 A similar phenomenon has been reported in cats with CKD. 2 Vitamin D analogues are known to have renoprotective effects, 31 while the induction of CKD in vitamin D receptor knockout mice has been associated with increased expression for both renin and transforming growth factor–β (TGF-β), 55 and vitamin D receptor knockout fibroblasts show upregulation of nuclear factor–κβ (NF-κβ). 46 A role for TG2 in this pathway has been proposed since the upregulation of TG2 is also associated with upregulation of both TGF-β 26,42,43 and NF-κβ, 27 factors associated with inflammation and renal fibrosis. 38 Upregulation of NF-κβ following ischemia reperfusion injury could not be demonstrated in the TG2 knockout mouse. 27 Renal hypoxia and excess urea generate reactive oxygen species 39,48 and systemic acidosis, all potential triggers for TG2 activation. 30 As far as we are aware, no previous studies concerning TG2 and CKD have been reported for the cat, although TG2 has been shown to be overexpressed in feline and canine mammary carcinoma. 51
Importantly, a causal link between TG and tubulointerstitial fibrosis has now been established in experimental rat models of CKD by using interventional pharmacology, supported by studies in TG2 knockout mice. 44 TG inhibitors, selective for the extracellular space, are effective in reducing renal fibrosis in rat models of CKD. 20,24 The evidence provided for the upregulation of the kidney TG pathway in the azotemic cat indicates that inhibition of the TG pathway could slow the development of renal progression. Since the TG2 protein has an extracellular site of action, the development of a therapeutic antibody could be an effective approach. Recombinant DNA antibody engineering could be implemented to generate either a chimeric antibody or a full inhibitory monoclonal antibody to inhibit TG2 in the cat kidney.
Limitations of this study include the possibility of kidney tissue degradation either in the cat during the period between euthanasia and postmortem tissue harvest (a period of 6 hours) or during storage of kidney tissue at –80°C, prior to analysis. Rapid cold preservation of tissue after euthanasia is necessary to avoid degradation by natural proteases. Matrix metalloproteinases are a group of enzymes responsible for extracellular matrix degradation. 6 Membrane type 1 matrix metalloproteinase (MT1-MMP), a membrane activator of the secretory MMP-2, is involved in the proteolysis of TG2 at 3 different cleavage sites, preventing its enzyme activity. 5 Some degree of tissue degradation might, for example, be responsible for the lower correlation of renal function with TG activity than with TG2 protein in tissue homogenates. A second possible limitation of this study may have been the presence of blood within stored cat kidney samples containing factor XIIIa, the circulating isoform of transglutaminase. Cat factor XIIIa has a molecular weight of 83 to 84 kDa, and an 83-kDa band was detected in cat kidney homogenates on Western blotting using a rabbit polyclonal TG2 antibody (protein ID ENSFCAP00000014378). 16 The 83-kDa band was therefore considered an artifact, with no difference between azotemic and nonazotemic animals. Although the same rabbit polyclonal TG2 antibody was used for extracellular TG2 analysis in situ, factor XIIIa would be removed during the processing of cryostat tissue sections. Renal TG2, in contrast, is bound into the extracellular matrix. In addition to the above limitations, the early development of CKD in the nonazotemic cat group cannot be excluded. Their old age (11–23.7 years), a low urine-specific gravity (particularly in cat Nos. 2 and 5), and other health issues might have affected either renal structure or function indirectly.
In conclusion, kidneys from cats with azotemia showed evidence of tubulointerstitial fibrosis, not glomerular fibrosis, associated with upregulation of the transglutaminase pathway. Both total kidney TG enzyme activity and TG2 protein were correlated with the severity of renal dysfunction and renal fibrosis, while in situ studies showed both TG enzyme activity and TG2 protein to be upregulated in the extracellular space with strong linear correlations to renal function, including plasma creatinine, urea, and phosphate. The renal TG pathway may represent an important new therapeutic target site to delay the development of tubulointerstitial fibrosis and fall in renal function of cats with CKD or following acute renal injury.
Footnotes
Declaration of Conflicting Interests
The author(s) declared no potential conflicts of interest with respect to the research, authorship, and/or publication of this article.
Funding
The author(s) received no financial support for the research, authorship, and/or publication of this article.