
Abstract
Fourier transform infrared imaging spectroscopy is a powerful technique that provides molecular and spatial information at the single-cell level. We report on the progress of this technology in the field of cancer research, focusing on human cervical cancer because of the inherent difficulty in grading this type of cancer and as a model for venereal cancers in dogs. Using a suite of multivariate imaging processing techniques, we demonstrate the potential of this technique to identify histologic features in the normal epithelium and cervical intraepithelial neoplasia stages I and III. We highlight the advantages and detail the barriers that need to be overcome before implementation of this technology in the clinical environment.
In terms of mortality, cancers are the most important range of diseases where rapid and/or early diagnosis would be the most beneficial. Consequently, vibrational spectroscopic techniques have been widely applied to the diagnosis and screening of human cancers for a number of years and show much promise as rapid, automatable techniques in this arena. 23 While these methods have been used to examine human neoplasias fairly extensively over the past 20 years, veterinary species have been almost completely neglected. Twenty-five percent of dogs greater than 2 years of age will die of cancer, and the prevalence is increasing. In the United States, 1 million to 6 million companion dogs are diagnosed with cancer annually. 53 Globally, pharmaceutical research and development, as well as sales for companion animal drugs, rival that of the human sector. 11 “One medicine” refers to the most recent understanding that many human and animal diseases share a pathogenic basis, and although veterinary species most certainly need advances in biomedical research in their own right, one can consider that the dog is an excellent comparative model for human disease. 11 Comparative oncology allows investigation of veterinary neoplasias to improve animal health while advancing general studies of cancer biology that will have impacts on human health and treatments. Many cancers in dogs share striking similarities with their human counterparts, including histologic appearance, genetic mutations, sensitivity to particular chemotherapies, and metastatic behavior. 53
Human cancers have been extensively studied using infrared spectroscopy, and the knowledge and techniques developed in this large body of work can be readily transferred to any tissue analysis and would be well suited to the veterinary clinic. Human cervical cancer and canine transmissible venereal cancer are both transmitted through sexual intercourse, with the human disease spread virally and with the canine disease spread by direct transfer of cancer cells, in the same manner as Tasmanian devil facial tumor disease. 10 Like human cervical cancer, canine transmissible venereal tumor (TVT) is difficult to diagnose, and the techniques developed for the former should be transferable to study of the latter. Definitive diagnosis of TVT is based on physical examination and cytologic findings from exfoliated cells obtained by swabs, fine needle aspirations, or tumor imprints. 49 TVT displays histologic resemblance to other round cell tumors, including canine cutaneous histiocytomas and mast cell tumors, thus making pathologic differentiation difficult. 55 Here we review the application of Fourier transform infrared (FTIR) spectroscopy applied to cervical cancer and relate this work to future work on canine transmissible venereal cancer.
In this article, we provide a background to the technique and report on the progress of applying FTIR imaging to cervical tissue analysis using some case examples, which we compare directly to stained sections from cervical biopsies. We discuss barriers that need to be overcome before installation of this technology into the clinical environment, and we highlight the advantages that this technology has for cancer diagnosis in general.
Cervical Cancer
In 2008 cervical cancer was the third-most commonly diagnosed cancer in women, with 529 800 new cases estimated worldwide each year, and it is the fourth-leading cause of death among females. 30 To date, the early diagnosis of cervical cancer has been achieved through screening programs, using the cervical smear (Pap test) to detect dysplastic lesions. Cervical disease is classified using the 2-tier Bethesda system for Pap smears (low- and high-grade squamous intraepithelial lesions) and the 3-tier cervical intraepithelial neoplasia system for surgical samples (CIN I, II, and III). 61 Samples diagnosed as CIN II and CIN III have a higher risk of proceeding to carcinoma in situ. Reported false-negative rates for the Pap smear vary widely: from as low as 1% to as high as 93%. 21,28 The Pap smear has often been criticized because its sensitivity and specificity depend on a number of subjective factors, including the skill of the observer in recognizing and classifying a variety of cellular abnormalities; the low number of abnormal cells in a sample; poor sample collection techniques by many doctors; a gradual transition of cells from a normal morphology to an abnormal morphology; the presence of biological contaminants, such as blood and infectious organisms; and variability in sample preparation. 60 Consequently, molecular approaches have become more successful for early cervical cancer diagnosis. These molecular techniques detect human papilloma virus (HPV) DNA sequences by DNA hybridization, 20 polymerase chain reaction–restriction fragment length polymorphism, 12,46 hybrid capture 40 and reverse line blot systems. 35 The drawback with these methods is that they cannot determine whether the HPV infection is active, latent, or persistent. 29 Thus, immunologic techniques such as Western blot and ELISA have been designed to follow the immune response against the virus, and they can be used to identify the stage of the infection. 29
HPV DNA has been detected in 99.7% of cervical cancer cases, thus confirming HPV as an causal factor for the disease. 67 The presence of HPV in virtually all cervical cancers implies the highest worldwide attributable fraction so far reported for a specific cause of any major human cancer. 67 All known HPV types are classified according to similarity of their genome to 5 genera (alpha, beta, gamma, mu, and nu) and 33 species. The alpha genus is clinically the most important, and many of these types infect the mucosal epithelium, with a subset of 10 to 15 HPV types being associated with lesions that can progress to cancer. 57 The clinically most important high-risk HPVs are HPV-16 and HPV-18, found in 50% to 65% and in 7% to 20% of cases of cervical cancer, respectively. 57 Classical virology techniques, including electron microscopy and immunohistochemistry, lack the sensitivity as well as specificity for the routine detection of HPV. 57 Serologic assays for the detection of anti-HPV antibodies have limited accuracy; consequently, their role in the clinical environment is under review. At present all commercial HPV tests in diagnostic use rely on the detection of HPV nucleic acids in clinical specimens.
In pursuit of a new diagnostic for venereal related cancers, we have been trialing FTIR microspectroscopic imaging as an independent modality to diagnose CIN and carcinoma in situ. Our initial work focused on applying FTIR microspectroscopy on exfoliated cervical cells collected using an Ayre spatula and cytobrush. However, the inherent problems associated with diagnosis based on the Pap smear led us to develop a method to map and image cervical tissue to compare our results directly with the cervical biopsy gold standard. 77 The predictive value of a biopsy is higher than that of the Pap test because the anatomic arrangement of the tissue is preserved, allowing evaluation of pathologic features in relation to histologic architecture.
Introduction to FTIR Spectroscopy
Traditionally, FTIR spectroscopy remained in the domain of chemists to characterize the molecular structure of small molecules. The infrared spectrum provides information on the functional groups of molecules. For a molecule (or functional group) to be infrared active, there must be a change in dipole moment during the vibration. If there is a change in dipole moment and the frequency (or wavenumber value) of the vibrating atoms exactly matches that of an incoming photon, then the molecule (or functional group) will absorb that photon and be promoted to an excited vibrational state. The wavenumber value for the absorbed photons can be detected and assigned to specific vibrational modes of the vibrating atoms.
The spectrum is in essence a molecular fingerprint providing a measure of absorbance versus wavenumber value. The absorbance is directly proportional to the concentration of the analyte under certain conditions and is related by the Beer-Lambert law:

where
The wavenumber value (

Typically, a midinfrared spectrum is recorded between 4000 and 400 cm-1 or 2.5 and 25 μm.
Band Assignment in Cells and Macromolecules
Figure 1 depicts an FTIR spectrum of an ectocervical cell, along with spectra of the main macromolecules that constitute a typical cell, including glycogen, lipid, DNA, RNA, and protein. Figure 2 shows a fully labeled spectrum of a typical cell. The spectrum of an ectocervical cell is essentially a superposition of the macromolecule spectra. The strongest bands in the spectra are from the protein modes, including the amide I mode, which appears at ∼1650 cm-1, depending on the secondary structure of the protein. This mode is made up of a set of complex vibrations involving the stretching of the carbonyl group coupled to the NH2 in-plane bending vibrations from the peptide moiety. The position of this band is sensitive to the secondary structure of proteins and appears at ∼1665 cm-1 for random coil and β-turns, 1650 to 1655 cm-1 for α-helical structures, and at ∼1635 cm-1 for β-pleated structures. The second-strongest mode appears at ∼1544 cm-1, is assigned to the amide II mode, and is also from proteins. It is principally NH2 in-plane bending coupled to the C-N stretching of the peptide group. Other modes from protein that are observed in the FTIR spectrum include the methyl/methylene bending modes at 1450 cm-1 and the carboxylate stretch group at 1400 cm-1. The amide III mode appears at ∼1305 cm-1 and is principally from NH2 in-plane bending vibrations coupled to CH2 deformations of aliphatic amino acids. 22
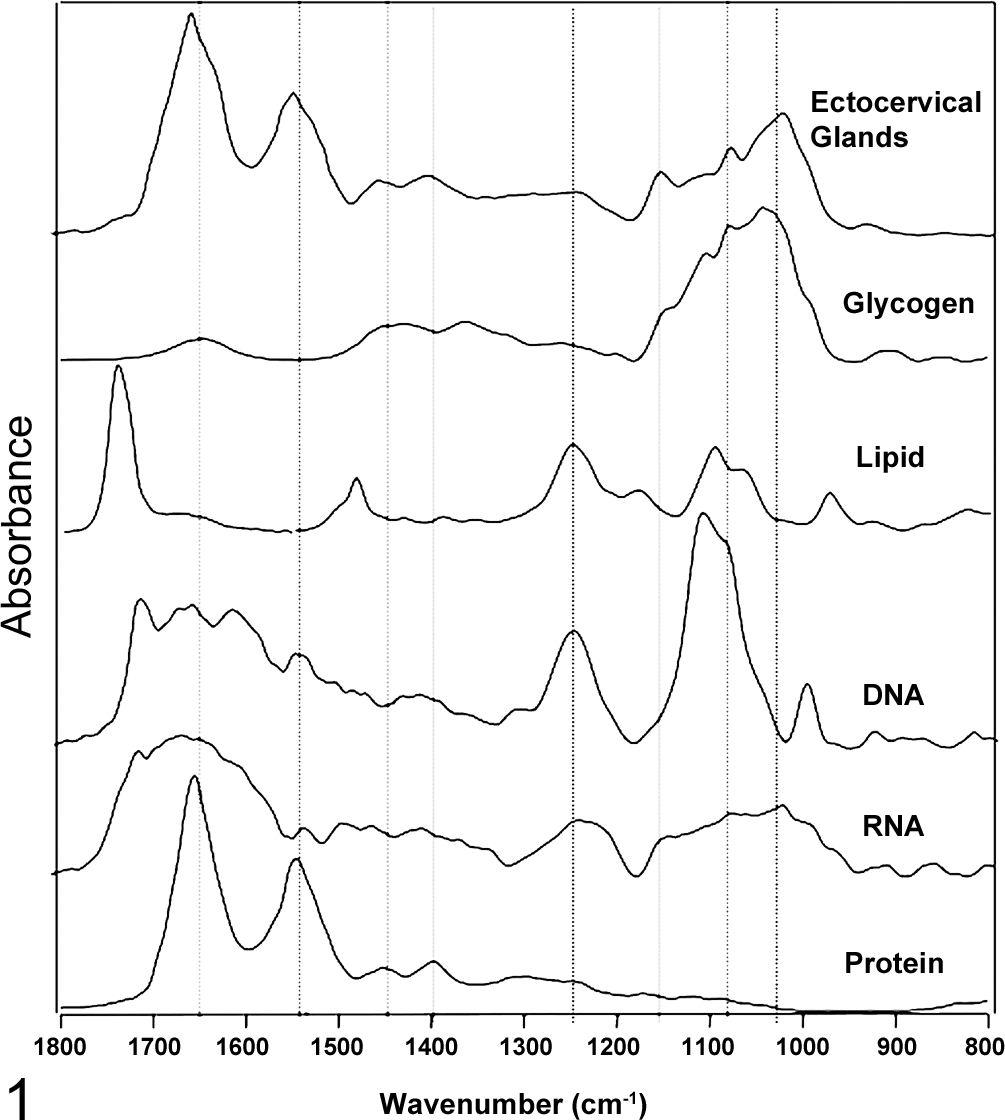
A Fourier transform infrared (FTIR) spectrum of a typical superficial ectocervical cell, compared to spectra of all the major macromolecules that compose the cell spectrum.
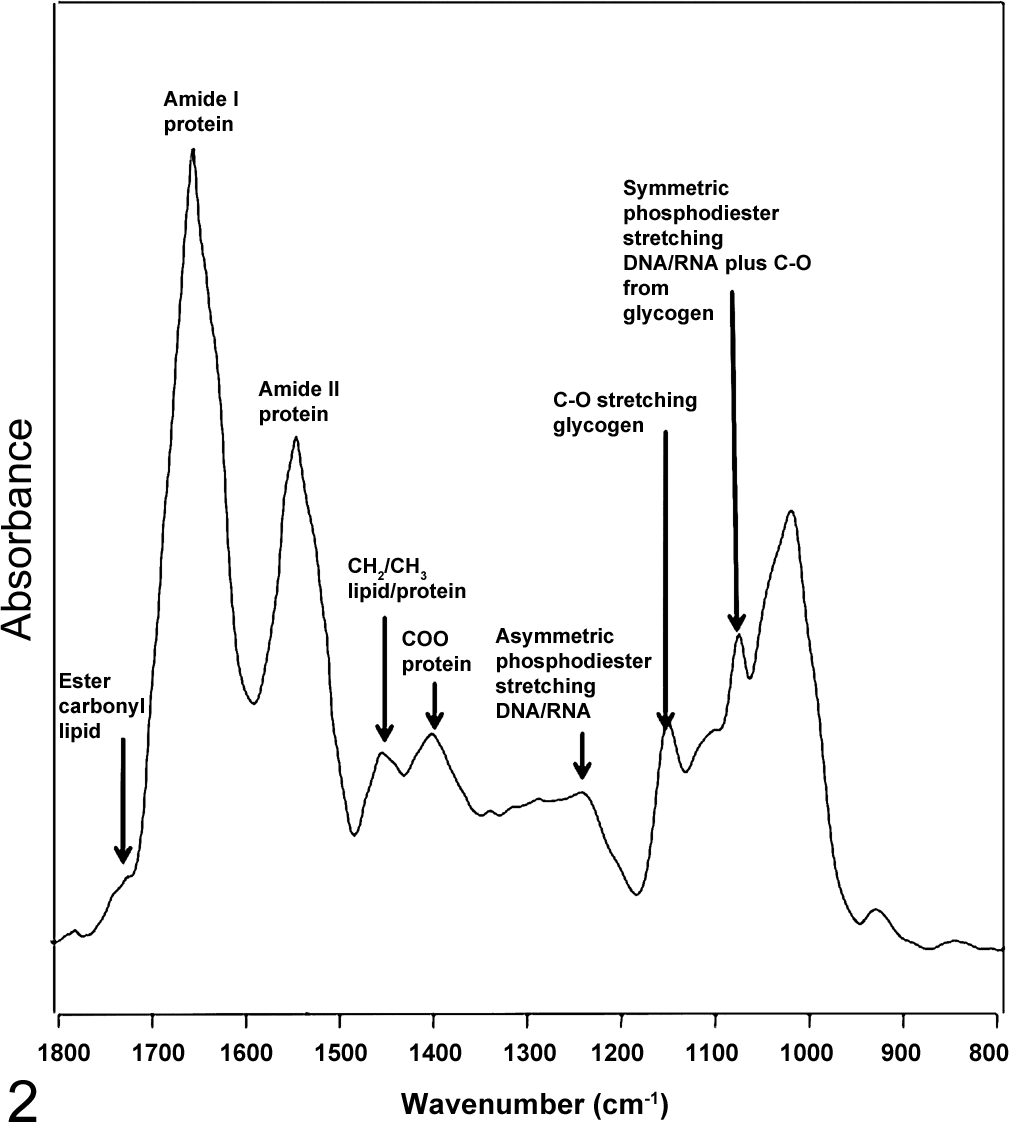
A labeled spectrum of an ectocervical cell showing the major band assignments.
Ectocervical cells are rich in glycogen; hence, the spectrum is also dominated by modes from this molecule, which appear at approximately 1055, 1080, and 1150 cm-1 and are assigned to the stretching motion of C-O groups from the glycogen moiety.
Lipids have a characteristic band at ∼1735 cm-1, which is assigned to the ester carbonyl stretching vibration. Because the ectocervical cells were extensively washed and fixed in ethanol, some of the lipids have dissolved; thus, this mode appears weak in the spectrum. Other lipid modes appear between 3000 and 2800 cm-1 and are assigned to the CH stretching vibrations from methyl/methylene stretching modes, while the bending modes of these functional groups appear around 1400 cm-1.
The main nucleic acid vibrations appear at ∼1244 cm-1 and 1080 cm-1 and are assigned to the phosphodiester asymmetric and symmetric stretching vibrations, respectively, from the nucleic acid phosphodiester backbone. The position of the asymmetric phosphodiester stretching vibration is dependent on the conformation of the DNA. In the A-DNA conformation, which is the case for all dehydrated cells and tissues, the band appears at ∼1244 cm-1, while in the B-DNA conformation, which is the case for live and hydrated cells, it appears at ∼1225 cm-1. 70 The intensity of the symmetric phosphate band is hydration sensitive, and it appears much stronger in the spectra of hydrated cells and tissues compared to fixed or dehydrated samples. In fact, it has been shown that a spectrum of an air-dried enucleated human erythrocyte is almost identical to a spectrum of an air-dried nucleated avian erythrocyte in the phosphodiester region. 45 It is only when the avian erythrocyte is hydrated that one clearly observes the DNA bands, and in this state, they can actually be accurately quantified in intact simple cells. 70,71 In general, these modes appear as broad bands in fixed cervical tissue, which are often overlapped by signals from glycogen, collagen, phosphorylated proteins, and phosphodiester groups associated with lipids and fatty acids.
Instrumentation
The apparatus used to collect the spectrum is known as a FTIR spectrometer. The essential piece of apparatus used to generate the spectrum was developed by Michelson-Morley in 1887 to investigate the mystical “luminiferous aether” that was thought to act as the medium to propagate light.
44
Michelson-Morley proved that light could be propagated in a vacuum and, in the process, debunked the aether theory and subsequently developed the Michelson-Morley interferometer, which could separate out individual frequencies of light from a blackbody source of infrared photons. The advantage of the Michelson-Morley interferometer was that it enabled all individual frequencies of light to impinge on a sample simultaneously, known as the multiplex advantage. It achieved this using a beamsplitter and a mirror configuration whereby the incident beam was split into 2 wavetrains. One wavetrain is reflected off a moving mirror that moves along incremental distances set by the output of a HeNe laser, and another wavetrain bounces off the stationary mirror. The 2 wavetrains recombine at the beam splitter and go in and out of phase, leading to the generation of an interferogram of light that impinges on the sample. The resulting interferogram, which is a plot of the intensity of the recombined light as a function of optical path difference, can be transformed into the wavenumber domain by taking the Fourier transformation of the interferogram. To obtain the absorbance information, one measures the intensity information of the initial light over transmitted light at each wavelength. Thus, equation 4 allows the infrared signal to be directly related to the concentration of analytes via equation 1.

where I 0 is the intensity of the incident light and I is the intensity of the transmitted light after it passes through the sample.
The Perkin-Elmer Corporation developed the first commercial infrared microscope in 1954, but the first FTIR microscope that made use of the Michelson-Morley interferometer was not developed until the early 1980s by Digilab (now subsumed in the Agilent corporation). Instead of glass lenses, like conventional optical microscopes, these infrared microscopes make use of a Cassegrain mirror system. The advantage of such a mirror configuration is that it enables both the infrared light and the visible light to be focused at the same focal point, and the mirrors, unlike glass lenses, do not absorb infrared radiation.
The major advance leading to the development of infrared-based pathology came with the advent of focal plane array (FPA) technology that combined thousands of small mercury–cadmium–telluride detectors to enable the simultaneous capture of thousands of spectra from a specified region. 34,39 Originally developed as heat-seeking devices in Javelin antitank missiles, the latest purpose-designed rapid-readout detectors have now become the powerhouse of FTIR imaging. With the now common 128 × 128 FPA, it is possible to record 16384 spectra simultaneously in minutes from an area of ∼700 μm2 with a projected pixel size of 5.5 μm and a spatial resolution of ∼20 μm2, depending on the wavelength. Moreover, these images can be recorded in a mosaic mode enabling large areas of tissue to be imaged, with the only real limitation being the CPU time required by the image analysis software. Note that it is possible to achieve a higher spatial resolution using attenuated total reflection (ATR) FTIR imaging, especially with the incorporation of hemispherical lens for both reflection and transmission measurements. 31 However, compared to transreflection or transmission measurements, ATR imaging is difficult to perform on large tissue sections, and papers showing the technique applied to clinically relevant numbers of tissue sections in cancer research are few and far between. 32,54,58,63,64,79 The ATR technique, especially with the incorporation of a hemispherical lens, has the added advantage of reducing the effects of light dispersion and chromatic aberration, but these effects are minimal in evenly sectioned tissues and more pronounced in single-cell measurements. The ATR technique requires good contact with the sample. This can compress and/or damage the tissue, making it difficult to perform poststaining and repeat spectroscopic measurements; nonetheless, it is possible to achieve high-quality FTIR images if care is taken to reduce pressure at the contact point. 31,52
Sample Preparation
Sample preparation and choice of substrate have become a hot topic in the biospectroscopy community. Traditionally, cells and tissues were placed on infrared transparent nonhygroscopic calcium fluoride or barium fluoride crystal windows, and a transmission measurement was recorded. These substrates have excellent transmission in the infrared and the visible, easily enabling location of cells and the possibility of subsequent staining. However, the cost of such substrates, US$20 to US$100 depending on the size, excludes them as routine substrates for the clinical environment. They also can be degraded by some bases and are not often reusable.
At the start of the decade, a new substrate came onto the market produced by Kevley Technologies (OK) that incorporated a reflective coating of silver doped with titanium on a conventional glass slide. These transreflection slides had the advantage of being cheap (US$2 a slide) and are ideal for the clinical environment because, like standard glass and quartz microscope slides, they can be placed in tissue-processing machines and cell-depositing centrifuges such as Cytospin. They also have the advantage of achieving a higher absorbance due to a double pass through the sample, approximately doubling the effective path length. However, recent studies have questioned the validity of the information that can be obtained by such substrates. It has been demonstrated that the spectrum at any point is a weighted sum of the sample reflection and transmission and that the dominance of the reflection spectrum in optically dense regions can account for some of the spectral distortions previously attributed to dispersion artifacts. 4 It has recently been pointed out that an electric-field standing wave is produced in a transreflection measurement, which causes a nonlinear change in absorbance with sample thickness. 7,27 This can be overcome to some degree in tissue, where the refractive index is essentially the same across the specimen, by having even tissue section depths and by using second-derivative spectra, which are sensitive to changes in band profiles and not solely reliant on direct absorbance.
In general, for tissue measurements, the samples are treated as they are for normal histopathologic preparation (ie, formalin fixation, paraffin embedding, followed by sectioning [4–6 μm]), but instead of floating the samples onto a microscope slide, they are floated onto a transreflection slide (Kevley Technologies, Chesterland, Ohio). Usually, a biospectroscopist would totally remove the paraffin by washing 3 times in clean xylene (Sigma Aldrich, St Louis, MO), but this step is not necessary if the spectroscopic information is not in the same region as the bands due to paraffin, which appear in the 3000–2800 cm-1 and 1450–1400 cm-1 regions. An adjacent section is usually cut for direct histologic comparison. The normal cervical tissue section (Fig. 3) was imaged using a 16-tile mosaic image (4 × 4) with a pixel spatial resolution of 5.5 μm. The final mosaic image has dimensions of 256 × 256 pixels and covers an area of 1.4 × 1.4 mm. This FTIR image comprises 65 536 individual spectra. These maps were acquired in transreflection mode using a Stingray FTIR microscope system (Agilent Technologies, Wood Dale, IL) equipped with a 64 × 64 pixel FPA mercury–cadmium–telluride detector using a 15× Cassegrain objective. Spectra were recorded at a resolution of 6 cm-1 over the range of 4000 to 950 cm-1 for the cervical tissue. The image took 10 minutes to collect and 10 minutes to process.
The maps presented in Figures 4 and 5 were recorded by raster mapping using a single-point detector, as opposed to an FPA, and consequently took far longer to collect. For these maps, spectra were collected with a Bruker IRscope II microscope (Bruker Optics Inc., Billerica, MA) equipped with a liquid nitrogen–cooled mercury–cadmium–telluride detector and a 36× infrared objective. Data collection was carried out using Bruker’s proprietary OPUS software (version 3.0). The IRScope II and FTIR spectrometer were continually purged with dry air from self-contained air purifiers (Whatman, Kent, England). Note that gaseous water has extremely intense sharp features that cover the 1800–1600 cm-1 region; thus, a water-free environment or postprocessing to remove these features is mandatory for FTIR mapping. The rectangular microscope aperture was set at 20 × 20 μm2 (accurate to about ±3 μm). These settings provided good signal to noise while maintaining excellent spatial resolution. The infrared mapping data were collected in reflection mode by scanning the computer-controlled microscope stage in a raster pattern in increments of 10 μm. Interferograms were collected double sided at a resolution of 6 cm-1. The time taken to record the image in the mapping configuration was approximately 10 hours.
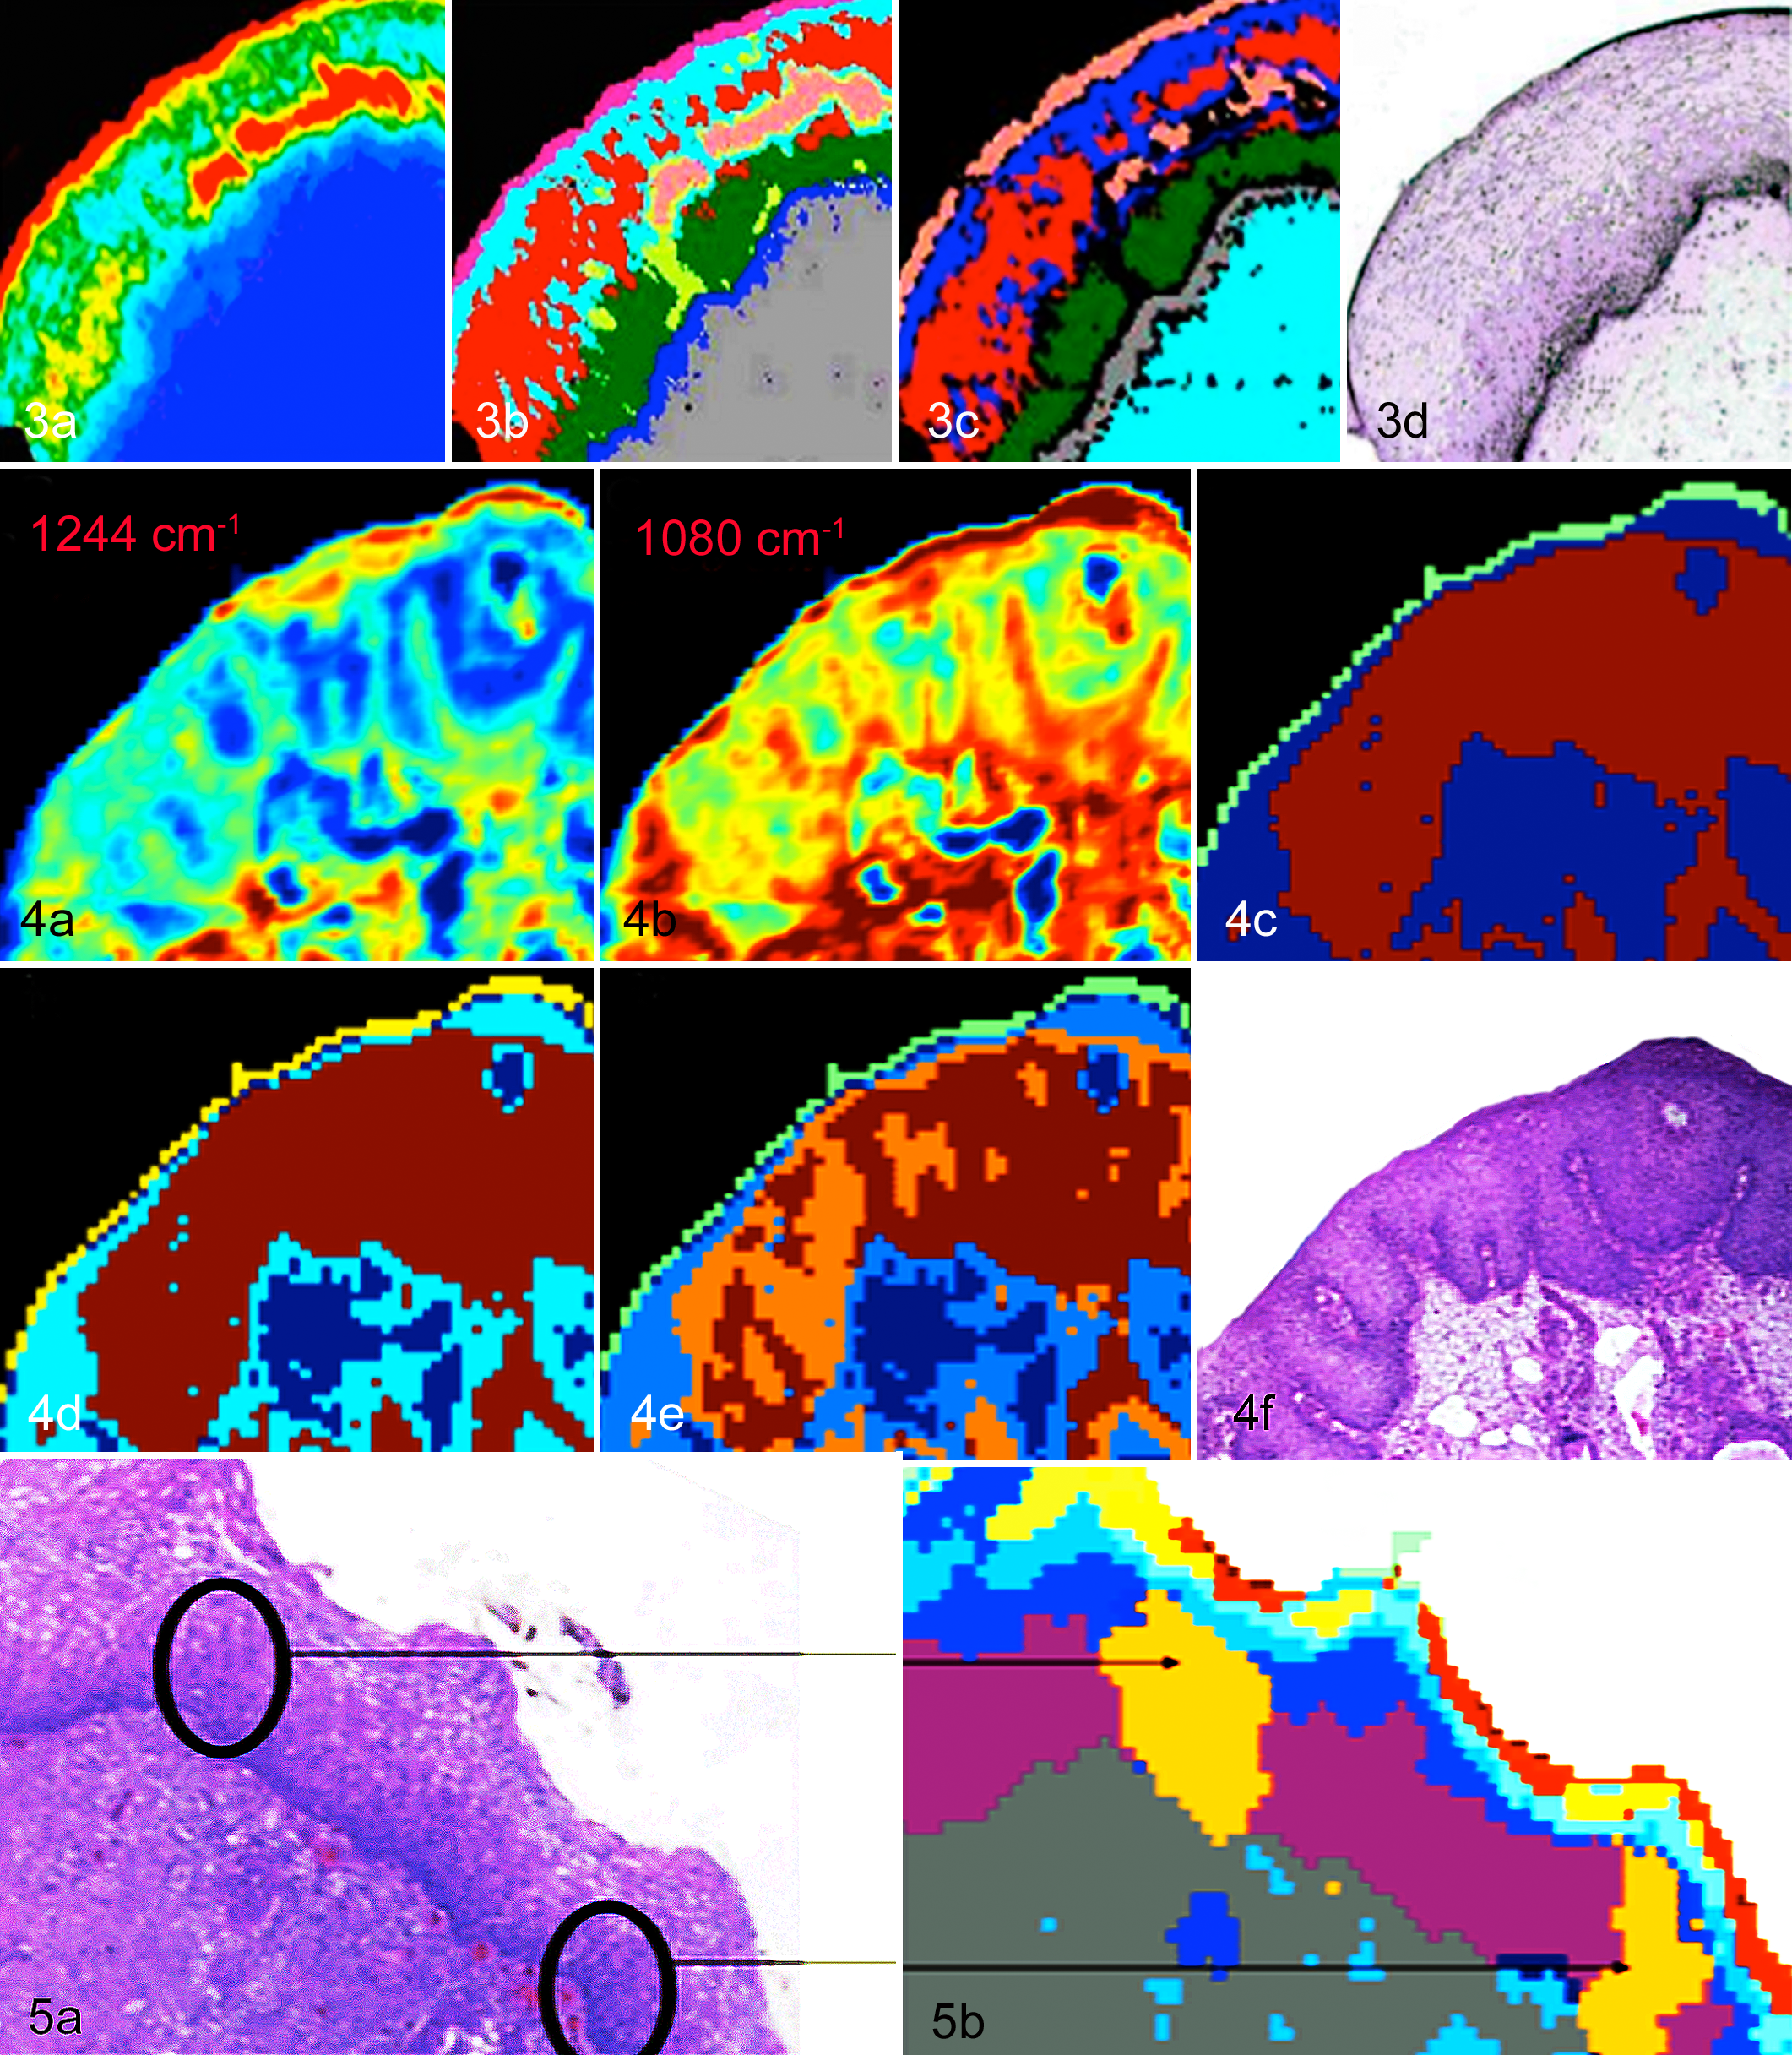
Cervix, human, normal epithelium. (a) FTIR image produced by integrating the area under the glycogen bands (1150–1000 cm-1). The highest concentration designated red, followed by yellow, green, light blue, and midblue (the lowest content). (b) Unsupervised hierarchical cluster analysis (UHCA) map produced using the 1800–950 cm-1 region. The colors correlate very well with the major tissue layers, including the outer superficial layer (pink), intermediate layer (light blue and red), parabasal layer (dark green), and basal layer (midblue); the intense glycogen region even has its own distinct cluster (salmon). (c) A neural network image generated by training a neural network with FTIR spectra from the various regions of the tissue, including the superficial, intermediate, parabasal, basal, and connective tissue layers. The high regions of

Cervix, human, normal cervical epithelium. Spectra of the cervical epithelium (a) before and (b) after resonant Mie extended multiplicative scatter correction (RMIe-EMSC). It is clear that post-RMie-EMSC, the baselines are improved. (c) FTIR image of the human cervical epithelium generated by integrating the region under the amide I mode (1700–1570 cm-1). (d) An image generated from a neural network analysis performed on the uncorrected spectra. (e) RMie-EMSC neural network image data. The outer exfoliating cell layer appears olive/gold; the superficial layer of squamous epithelium is dark green; the intermediate layer is pink and blue; the parabasal layer is orange; the basal layer is yellow; and the stroma is light blue and slate blue. In the uncorrected image (d), the superficial layer of the epithelium has been resolved into a light blue and thin orange cluster. There is an additional (light green) cluster identified in the stroma. Nonetheless, the images are similar, indicating that RMie-EMSC is not necessary as a preprocessing step for tissue data. (f) The adjacent HE section of the human cervical normal epithelium (c–e). The numbers correspond to (1) the superficial layer, (2) the intermediate layer, (3) the parabasal layer, (4) the basal layer, (5) connective tissue, and (6) the tissue boundary.
Data Processing
Spectral data require preprocessing before statistical or image analysis. The aim of data processing is essentially to remove the spectral components due to physical effects from the chemical component in the spectrum. The major physical effects take the form of light scattering from objects approaching the size of infrared wavelengths (2.5–25 μm) and dispersion effects from changes in the refractive index of particles within the cell or tissue relative to the background measurement. In general, we adopt a number of preprocessing steps prior to image reconstruction that are aimed at reducing baseline effects and removing the scatter component from the spectrum. Needless to say, ensuring precise sectioning to avoid thickness and orientation artifacts, using a nitrogen gas–purged microscope and instrument cabinets to avoid water vapor, and having a consistent approach to removing paraffin and a general standardized procedure is necessary to achieve excellent quality spectra in the first place.
“Resonant Mie scattering” correction, as coined by the Gardner group, 3–6 is an extension of extended multiplicative scatter correction (EMSC) developed by Martens et al, 43 who proposed that the EMSC approach could be employed to provide a correction model that includes the wavelength dependence of light scattering. Kohler et al 36 refined this model to describe an EMSC-based scheme for estimating and correcting for the Mie scattering contribution to FTIR spectra. In this scheme (Mie-EMSC), the Mie scatter component of the recorded spectra is corrected for by utilizing a principal component analysis approach to summarize the large number of theoretically expected Mie contributions as a computationally manageable number of principal components.
While the Mie-EMSC scheme proved to be successful at removing simple Mie scatter 3–6,8 effects from FTIR spectra of biological samples, it was of limited effectiveness when the spectra exhibited stronger distortions from scattering, the so-called dispersion artifact that results from the varying refractive index in the tissue or cell relative to the background. In resonant Mie EMSC (RMie-EMSC), the particle size and changes in the wavelength-dependent refractive index of the sample are modeled. These effects manifest as derivative shape features on extremely strong absorptions, such as the amide I (∼1700 cm-1), and cause the actual position and intensity of the bands to change. The spectral baseline distortions are more often observed in spectra of isolated single cells rather than in tissue sections but can appear at the edges of tissue and at the tissue boundaries. Nowadays, it is common to take the second derivative of the spectrum and then perform RMie-EMSC according to the algorithm developed by Bassan et al, 6 using an averaged second-derivative spectrum from the entire data set as the reference spectrum in the model. Before the development of RMie-EMSC, we would take the second derivative of the sample spectrum, vector normalize the output, and perform the unsupervised hierarchical cluster analysis (UHCA) directly on this data set. The images shown in Figure 4 were produced using this approach while Figure 6 compares the two approaches.
Multivariate Image Processing
The data generated from the FPA is in the form of a spectral data “hypercube,” with each pixel containing spectral and spatial information. The data cubes for a 64 × 64 FPA often contain over 50 Mbit of data, depending on the spectral parameters and size of the mosaic. These large data sets require high-end 64-bit processors or, better still, parallel computing for the image reconstruction. There are 3 main ways to present FTIR spectral data—namely, univariate (chemimages), multivariate, and pattern recognition. Univariate methods are typically based on the absolute intensity of a band, the ratio of 2 bands, and the integrated area of a band calculated between 2 baseline points. These maps provide quantitative information on macromolecules in a cell or tissue sample but are generally not diagnostically useful. Multivariate methods make use of spectral similarity to generate false-color maps. UHCA is a proven technique for image reconstruction with FTIR data. 26,37,38 In cluster analysis, a matrix is calculated that expresses the similarity, or “distance,” between each spectrum and all other spectra in the data set. For 2 spectra S (spectrum) and R (reference) in the data hypercube, this distance is defined as the correlation coefficient. For 2 similar spectra, the correlation coefficient approaches 1, whereas for more dissimilar the spectra, this value approaches 0. Subsequently, the 2 most similar spectra in the hypercube are merged into a “cluster,” and a new distance matrix column is calculated for the new cluster and all existing spectra. The process of merging spectra or clusters into new clusters is repeated, and the correlation coefficient is recalculated until all spectra have been combined into a few clusters. This process combines the most similar spectra into the same cluster while keeping track of which spectra have been incorporated into each cluster. Assigning a color to each spectral cluster and displaying this color at the coordinates at which each spectrum was collected creates a pseudocolor map based on cluster analysis. The mean spectra were extracted for all clusters and used for the interpretation of the chemical or biochemical differences between clusters. The cluster number was adjusted such that good correspondence with the pathological images was obtained.
Four-dimensional univariate images can be derived by simply stacking sections color coded for absorbance at a particular wavenumber (chemimages) vertically in a block. The 4 dimensions come from have 3 spatial domains, with the fourth being the spectral domain. These blocks can then be cut vertically or horizontally to interrogate the tissue architecture. Moreover, one can digitally remove areas of nondiagnostic tissue, such as connective tissue, and focus on inflammation and diseased cells. These crude 3-dimensional images can be useful for determining the extent of pathologic structure, but further manipulation is required to provide multivariate based images with diagnostic information. Using 4 adjacent sections from a sample of an adenocarcinoma-diagnosed sample, we demonstrated the potential of 4-dimensional imaging. 75
Neural Network Image Processing
Neural networks or artificial intelligent systems model for nonlinear responses in the data set and can be trained to learn various classes of spectra. Once trained, these neural networks have the advantage of speed compared to the more traditional multivariate methods such as UHCA. Most neural networks make use of a back propagation algorithm and utilize multiple layers of weight-sum units of the type
FTIR Spectroscopy Applied to Cervical Tissues
The emergence of FTIR spectroscopy to the analysis of tissue sections and single cells really began in the early 1990s with a seminal paper by Wong et al 74 on the application of FTIR spectroscopy to diagnose cervical cancer form exfoliated cells collected by a cytobrush and Ayre spatula. The spectra showed clear differences in the phosphodiester and glycogen region (1300–950 cm-1) among normal, dysplastic, and carcinoma in situ–graded cells. A number of studies have since investigated the potential of FTIR spectroscopy to diagnose cervical cancer from exfoliated cells collected from the transformation zone of the cervix.16, 18, 19, 33, 41, 42, 48, 50, 51, 68, 69, 80 An early study by Morris et al 48 performed on 25 cervicovaginal lavage specimens from women referred for colposcopy showed that in the case of CIN III samples, an additional peak at 972 cm-1 was observed. The authors suggested that this band could be a key indicator for malignancy. However, this band does appear in any cell type that has a high concentration of nucleic acids, and this feature alone cannot be diagnostic for CIN III. Wood et al 76 combined FTIR spectroscopy with principal component analysis to differentiate normal from dysplastic cervical cells.
Most of the above-cited studies primarily utilize absorbance differences in the important nucleic acid vibrational modes to discern normal from dysplasia-diagnosed samples, usually incorporating some multivariate approach to make the classification. Independent studies indicated that the spectral changes observed may not be related to the number and molecular composition of dysplastic cells per se but other factors, such as inflammation, the number of dividing versus nondividing cells, 15,78 as well as the cells’ overall divisional activity. 16 For instance, lymphocytes—which, like cancerous cells, have a large nucleus and scanty amount of cytoplasm—gave a similar type of spectral profile to cancer cells. 78 Other cell types and cervical debris were found to confound spectral diagnosis. 16,17,73,78 Because the spectral profiles for different cells can be similar, multivariate approaches were applied to resolve “hidden” structure within the data. These techniques enable spectra to be classified according to spectral variance and showed the potential for nonsubjective diagnosis, removed from the bias of human interpretation. 76 The inherent problem with correlating cytologic diagnosis with FTIR spectroscopy is the large number of false-positive and false-negative results associated with the Pap smear. 1,24,47,65,66 For this reason, it is better to confirm diagnosis using the gold standard biopsy and compare these results with FTIR analysis. Chiriboga et al 17 were the first to apply FTIR spectroscopy to cervical biopsies. They demonstrated that different spectral profiles could be obtained for the different cell types throughout the tissue section. With the advent of FTIR mapping and imaging, it became possible to map and image large tissue sections. 2,9,14,56,62,75,77 By utilizing multivariate image-processing techniques such as UHCA, it became possible to generate false-color maps that could be directly correlated with hematoxylin and eosin (HE). The following section describes the approach and diagnostic images generated by combining FTIR mapping and imaging with UHCA. For details about the methodologies and schematics of instrumentation, see to the excellent book chapter by John Chalmers. 13
Normal Epithelium
Figure 3 shows an FTIR image of a section of normal cervical epithelial tissue processed with a univariate, multivariate, and a neural network approach for data processing, which is compared to an adjacent HE-stained section (Fig. 3d). The glycogen map (Fig. 3a), which was produced by integrating the area under the glycogen bands between 1150 and 1000 cm-1, shows regions of highest to lowest glycogen content, with the highest concentration designated red, followed by yellow, green, light blue, and midblue (the lowest content). The highest levels of glycogen are found in the superficial layers, while the lowest levels are found in the stroma, as expected. While these maps provide some information on macromolecular concentration of a specific macromolecule, they are not that diagnostically useful and cannot be directly correlated with the tissue architecture. Figure 3b shows a UHCA map produced using the 1800–950 cm-1 region of the spectrum. The map was preprocessed by taking the second derivative, followed by normalization, then UHCA. The resultant false-color map correlates well with the major tissue layers, as observed in the HE-stained section in Figure 3d, including the outer superficial layer (pink), intermediate layer (light blue and red), parabasal layer (dark green), basal layer (midblue), and the intense glycogen region, which has its own distinct cluster (salmon). UHCA produces maps that correlate well with histology, but the time taken to process these large maps (10 minutes with a conventional CPU) is unsuitable for the clinical environment. Figure 3c shows a neural network image produced by training a neural network with spectra from the various regions of the tissue. In this case, 30 spectra (1800–950 cm-1) from each tissue layer were used as inputs into the neural network. The network had 6 input nodes, 3 hidden nodes, and 6 output nodes. The map shows an excellent correlation with the histology and took less than a minute to generate. The high regions of glycogen are associated with the salmon color and correlate well with the high glycogen (red) region in the glycogen map and with the superficial layer identified in Figure 3a, as expected. The other layers also correspond well—that is, intermediate layer (red and blue), parabasal layer (green), basal layer (gray), and the connective tissue (light blue). The combination of using a FPA imaging infrared spectrometer with an artificial neural network or UHCA provides a platform to rapidly differentiate the important cell types in a tissue section, but the question is, can this technology be applied to detect dysplasia and carcinoma in the tissue matrix?
Cervical Intraepithelial Neoplasia III
Figure 4 shows FTIR maps of CIN III–diagnosed cervical tissue, including univariate maps of glycogen (Fig. 4a) and nucleic acid (Fig. 4b) and UHCA maps for 3 clusters (Fig. 4c), 4 clusters (Fig. 4d), and 5 clusters (Fig. 4e), and the adjacent HE section (Fig. 4f). The univariate maps, generated by integrating the area underneath the glycogen and asymmetric phosphodiester stretching vibration band from nucleic acids at ∼1240 cm-1, do not reveal any diagnostic information. However, by applying UHCA, the cancerous cells are immediately delineated from the normal tissue (blue cluster) as the brown cluster using only 3 clusters. The 4-cluster map resolves more detail in the connective tissue (light and dark blue clusters), while the 5-cluster map separates out clusters within the cancerous tissue. In the case of CIN III tumors, the extracted spectra are similar from tumor to tumor and patient to patient. All generally show decreased glycogen levels, increased nucleic acid and protein contributions, and small amounts of lipids. Some variance arises depending on the number of mitotic figures and the size of the nucleus relative to the cytoplasm; thus, the spectral profile could be used in the future to grade tumors, but more work is required to correlate the mitotic indices to the spectral profiles.
Cervical Intraepithelial Neoplasia I
A study involving over 100 patients demonstrated that the FTIR technique could detect dysplastic cells diagnosed by pathology as CIN I in a tissue section. 77 Figure 5a shows a HE section diagnosed by 2 pathologists as CIN I, along with the corresponding UHCA cluster map (Fig. 5b) based on 10 clusters. 77 The outer superficial cells are rich in glycogen and appear as red and yellow in the cluster map; cells from the intermediate layer appear light and midblue; cells from the extended basal layer, purple; and the orange clusters show foci of dysplasia where close inspection revealed a higher number of mitotic figures (ie, cells in the process of division). The technique consequently shows potential to assist the pathologist in making the difficult diagnosis of early dysplasia; however, the question remained regarding the nature of spectral bands and, hence, the molecular changes important in discriminating the clusters.
Resonance Mie–Extended Multiplicative Scatter Correction
By extracting the average spectra from each cluster, it is possible to determine what bands are important in discerning cancerous from normal tissue. It became apparent that the position and intensity of the amide I mode greatly influenced the clustering. The best clustering was achieved when the amide I and II bands (1700–1500 cm-1) were included in the analysis. It was later discovered that the optical density of the tissue appeared to dramatically alter the position of the amide I mode. Consequently, the high-quality UHCA maps produced were not based solely on chemical differences between the tissue types but were rather physicochemical maps based on a combination of chemical differences and light dispersion differences due to changes in the refractive index of the tissue. To correct for this effect, the modified RMie-EMSC algorithm developed by Bassan et al 6 was employed. Figure 6a shows uncorrected raw spectra selected from regions containing superficial exfoliating cells (yellow), intermediate epithelium (pink), basal layer (yellow), and stroma (blue). Figure 6b shows spectra selected from the same regions after RMie-EMSC. The corrected spectra are devoid of undulating baseline, and the positions and intensities of the amide I mode are in the expected range for these particular cell types. Figure 6c shows another example of an FTIR image of the human cervical epithelium generated by integrating the region under the amide I mode (1700–1570 cm-1) showing protein concentration. Figure 6d shows a map derived from a neural network analysis performed on the uncorrected spectra, while Figure 6e shows the same map after RMie-EMSC has been applied. Figure 6f shows the adjacent HE-stained section. The UHCA map produced from the resonant Mie scattering–corrected FTIR image is similar to the uncorrected image. The stromal tissue is described by 3 clusters in the uncorrected UHCA map but only 2 clusters in the corrected UHCA map. The stroma is relatively homogeneous in terms of chemical content, so the stroma being described by fewer clusters correlates more satisfactorily with the known properties of stromal tissue. It was also noted that successful demarcation of tissue features could not be achieved from UHCA of uncorrected “raw” (ie, nonderivative) spectra, whereas for resonant Mie scattering–corrected raw spectra, all the major tissue features were eventually found for cluster maps containing 15 or more clusters. These observations demonstrate that preprocessing FTIR image spectra with the resonant Mie scattering correction before performing UHCA does not affect the diagnostic capability, provided that normalized second derivatives are used in the preprocessing. Second-derivative spectra are often used as inputs for various multivariate analyses based on the argument that second-derivative preprocessing suppresses baseline influence on the results. Even after baseline correction with RMie-EMSC, the UHCA performed on second-derivative spectra still gave the best demarcation of tissue features in fewer clusters, presumably because second-derivative preprocessing also enhances the resolution of overlapping band features in the spectra.
Outlook
FTIR spectroscopy offers enormous potential to assist in pathologic diagnosis; however, a number of barriers need to be overcome before this technology can be introduced into the clinical laboratory. One of the most important hurdles is to improve on the morphologic gold standard, which is the cervical biopsy. Because the chemical changes observed by spectroscopy can precede the morphologic or symptomatic manifestation of the pathology, the only real way to test the efficacy of the technique is to follow the outcome of the patient, which in humans can take a number of years. Consequently, the efficacy of this technology would be better tested in the veterinary environment, where the life spans are more conducive to determining diagnostic capability.
Another barrier to implementation is standardization of the methodology and instrumental parameters. At present, every laboratory working on FTIR imaging of tissue sections has its own method of sample preparation and uses its own instrumental parameters. These methods need to be standardized so that a measurement recorded in Australia on one section would yield a similar result to the same section prepared and measured in the United States.
The inability to detect strong contributions from A-DNA in fixed tissue sections is a vexing problem, especially if one wants to apply the technology to detect mitotic figures, which is one of a suite of indicators that a pathologist would use to diagnose dysplasia. While it may be possible to develop a fixative to fix B-DNA and resolve these bands more clearly, at present the only way to preserve B-DNA is to keep the sample in a hydrated state, which is not conducive for FTIR tissue analysis. In a recent study, the Diem group 60 was able to discern HPV-infected cells from noninfected cells using FTIR microscopy based on changes in amide I and II modes, indicating that there is a consistent structural modification to the cell in response to the virus. It also appears that protein synthesis could be an early diagnostic marker for dysplasia, which could in part explain the excellent cluster demarcation between cancer and normal tissue observed when one uses solely the amide I and II mode in the cluster analysis. More work utilizing immunohistochemistry and other biochemical assays is required to determine the origin of the spectral changes associated with viral and dysplasia-affected cells.
The contribution of light dispersion to the clear demarcation of cancer versus noncancer in the CIN III sections cannot be underestimated. The question at present is, do we correct for this light dispersion by performing RMie-EMSC or leave the dispersive component in the spectrum because it too is diagnostically useful? The other important consideration is choice of substrate given the inherent standing wave effect generated by infrared transreflection slides. This effect can be reduced, in the case of tissue, if each section is evenly cut and a second derivative calculated before image processing. The second derivative highlights band shifts and inflection points in the spectrum and does not rely on linear absorbance directly. In the case of fixed exfoliated cells, which vary in size and thickness, the wavelength-dependent scattering is exacerbated and more difficult to correct. It appears that infrared transparent windows are the only solution to negate the standing wave effect in the case of fixed exfoliated or cultured cells. Because of the standing wave effect, the technology is more suited to the analysis of tissue, as opposed to exfoliated cells, unless the cells are of a similar thickness. A second problem that arises in diagnosing abnormal cervical cells in an exfoliated smear preparation is the inherently large false-negative and false-positive results generated by cytologic analysis of Pap smears. Consequently, it is difficult to compare the diagnostic sensitivity of FTIR with the Pap smear. A third problem is that without a synchrotron or an ATR system, it is not possible to achieve the single-cell resolution required for an exfoliated cell preparation. It is much easier to pick out a small group of abnormal cells in a tissue section than a similar number spread over a smear preparation.
The application of FTIR imaging spectroscopy to cancer pathogenesis and biomarker identification in dogs can be more extensively investigated and followed due to increased flexibility in study designs (dog owners willing to participate in clinical trials in lieu of euthanasia), with accelerated timelines (due to shorter overall life spans), as well as more access to tissue samples. Whereas serial sampling is often unacceptable in human trials, serial biopsies from target and nontarget lesions and repeated collection of body fluid (serum, whole blood, and urine) from the same dog is fairly easily acquired. Serial sampling allows for more thorough examinations of biomarkers and/or therapeutic responses. 53 The availability of purebred dogs with increased incidence of particular cancers (eg, greyhounds developing osteosarcoma) and well-documented pedigrees allows for more targeted genetic investigations. 53 The histopathology, behavior, and prognosis of human osteosarcoma are almost identical in dogs 53,72 ; in human and canine cases, subclinical metastases are present at the time of diagnosis in the majority of cases. Biomarkers that could detect the neoplasia before metastasis are certainly required to improve survival rates. 25 Cancer grading by light microscopy is subjective and highly dependent on the training and experience of the pathologist examining the tissues, as well as the sample quality and quantity. Many neoplasias require ancillary diagnostics (eg, immunohistochemistry, flow cytometry, polymerase chain reaction) to further characterize their cell origin, clonality and/or malignant risk, and these tests are often time-consuming, laborious, and costly. It would seem logical that atypical cells in dogs would have similar spectral signatures in humans, provided that the cell morphology is similar, but more work is required to really confirm this hypothesis. Given the ease with which infrared spectroscopy can be performed on small tissue or cell samples with high precision and minimal preparation, an infrared parameter that relates to cellular biosynthetic activity may be valuable as a prognostic indicator, particularly in cases where the current “gold standards” are lacking in sufficient reliability.
Footnotes
Acknowledgements
We are grateful to Professor Michael Quinn of the Department of Obstetrics and Gynecology, Royal Women’s Hospital, Parkville, Victoria, Australia, for the cervical transformation zone biopsy samples; Mr Finlay Shanks, for instrument support; and Professor Max Diem of Northeastern University, Boston, Massachusetts, for the opportunity to work in his former laboratory at Hunter College (City University of New York) and to record the maps presented in Figures 4 and ![]() . An Australian Research Council Discovery Project Grant (DP0878464) financially supported this work.
. An Australian Research Council Discovery Project Grant (DP0878464) financially supported this work.
Declaration of Conflicting Interests
The author(s) declared no potential conflicts of interest with respect to the research, authorship, and/or publication of this article.
Funding
The author(s) received no financial support for the research, authorship, and/or publication of this article.