
Abstract
Patterns of change of endogenous metabolites may closely reflect systemic and organ-specific toxic changes. The authors examined the metabolic effects of the cyanobacterial (blue-green algal) toxin microcystin-LR by 1H-nuclear magnetic resonance (NMR) analysis of urinary endogenous metabolites. Rats were treated with a single sublethal dose, either 20 or 80 µg/kg intraperitoneally, and sacrificed at 2 or 7 days post dosing. Changes in the high-dose, 2-day sacrifice group included centrilobular hepatic necrosis and congestion, accompanied in some animals by regeneration and neovascularization. By 7 days, animals had recovered, the necrotizing process had ended, and the centrilobular areas had been replaced by regenerative, usually hypertrophic hepatocytes. There was considerable interanimal variation in the histologic process and severity, which correlated with the changes in patterns of endogenous metabolites in the urine, thus providing additional validation of the biomarker and biochemical changes. Similarity of the shape of the metabolic trajectories suggests that the mechanisms of toxic effects and recovery are similar among the individual animals, albeit that the magnitude and timing are different for the individual animals. Initial decreases in urinary citrate, 2-oxoglutarate, succinate, and hippurate concentrations were accompanied by a temporary increase in betaine and taurine, then creatine from 24 to 48 hours. Further changes were an increase in guanidinoacetate, dimethylglycine, urocanic acid, and bile acids. As a tool, urine can be repeatedly and noninvasively sampled and metabonomics utilized to study the onset and recovery after toxicity, thus identifying time points of maximal effect. This can help to employ histopathological examination in a guided and effective fashion.
Keywords
Introduction
Rapid advances in our knowledge of systems biology have been accompanied by new techniques to study the comprehensive array of changes. In this context, metabonomics refers to the study of endogenous body metabolites and, in particular, the time course of dynamic system responses of multiple endogenous body metabolites to a stressor, pathophysiological stimuli, or genetic modification.15,37,38,41,44 In this respect, metabonomics is more similar to clinical chemistry than other omics sciences, as organic analytes are measured in urine or serum and relevant ratios can be calculated. In traditional clinical chemistry, ratios such as sodium to potassium or albumin to globulin are routinely considered. Metabonomics can measure hundreds of analytes simultaneously, including metabolites of unknown chemical structure, and assess their relationship to each other. This approach becomes even more powerful when coupled with pattern recognition (chemometrics) analyses to evaluate the patterns of changes and statistical correlation techniques to identify metabolites whose changes are tightly linked.7,16 A variety of analytical techniques have been used for metabonomic analyses, including 1 H-nuclear magnetic resonance (NMR), high-performance liquid chromatography–mass spectrometry (HPLC-MS), gas chromatography-mass spectrometry (GC–MS), and others. 22 In solid tissues, endogenous metabolites can be analyzed using magic-angle spinning (MAS) NMR spectroscopy.2,31
In a typical toxicology study, urine, serum (or other biofluid), or tissue samples from each animal are collected at different time points and are analyzed to produce a spectrum of peaks, representing the relative concentrations of different metabolites. The spectra can be visually evaluated, but to deal with the multitude of information, measure and compare the patterns of peaks among samples within a study or among studies, and avoid undue focus on the high-concentration metabolites, it is necessary to use chemometric techniques.9,12,13,28,46 These techniques use multivariate analysis to summarize the changes of the various peaks and to extract group, dose, or time characteristics.
Metabonomics has been used for predicting toxic effects of new compounds in the pharmaceutical industry, preliminary evaluation of efficacy, and enhanced understanding of mechanisms of toxicity.12,37 Because collection of urine is noninvasive and can be conducted continuously in metabolic cages, urine metabonomics is particularly useful for identifying trends over time. For example, individual animals may vary as to the time of peak effect, even if they respond to a compound in a similar way. If one uses conventional, preestablished blood-draw or sacrifice dates, the variation in time of peak effect may statistically obscure the results and require larger groups of animals in the experiments.
The Consortium for Metabonomic Toxicology (COMET) was a multi-institutional project to develop and use metabonomics as a predictor of tissue- and mechanism-specific toxicities.32,33 Urinary changes in small molecular endogenous metabolites were determined by 1 H-NMR and pattern recognition analysis and the patterns were compared to a well-designed control set of over 4000 samples. Collectively, the consortium members, consisting of an academic laboratory at Imperial College London and 6 pharmaceutical companies, Pharmacia (now owned by Pfizer), Pfizer, Hoffmann-La Roche, Bristol Myers-Squibb, Eli Lilly & Co., and Novo Nordisk, performed 147 studies using toxins or perturbations, most with specific topologic sites of injury and mechanisms of action. The consortium goal was to build a database and predictive chemometric models that could analyze and compare new compounds of pharmaceutical interest.32,33
In one of these studies, we examined the effects of the cyanobacterial (blue-green algal) toxin microcystin-LR, which is known to cause necrosis of centrilobular hepatocytes. Microcystin-LR is one of the toxins of Microcystis aeruginosa and can present an environmental problem to animal life through algal growth in lakes. 4 Also, raw water supplies and reservoirs can be affected and can potentially lead to exposure of humans through drinking water.14,50 With appropriate water treatment (eg, filtration or adsorption), maximum exposure to total microcystins is expected to be less than 1 μg/liter, according to the World Health Organization Guideline. However, in some countries, water supplies are still treated insufficiently.14,50
Microcystin toxicity is selective to hepatocytes because the toxin is preferentially taken up by Oatp1b2 (also known as Oatp4, Lst-1, and Slco1b2), a hepatocellular organic anion transporter that normally transports bile acids, 17 and Oatp1b2-null mice are completely protected from microcystin-LR toxicity. 34 The distribution of injury to the centrilobular zones is because these transporters are more abundant in centrilobular hepatocytes. 6 Microcystin-LR inhibits protein phosphatase 1 and 2A activity, resulting in hyperphosphorylation of cytoskeletal proteins, which leads to microtubule and actin disassembly.35,42,48,53 This explains one of the earliest morphologic changes, architectural disturbance and rounding of hepatocytes.24,25 The change in hepatocyte shape also allows increased pooling of blood within the space of Disse. In terminal cases of microcystin-LR toxicosis, the common lesion is massive hepatic necrosis, although centrilobular necrosis is seen in sublethal cases.20,21,25,52
Here, we report the multiple metabolic changes induced by microcystin-LR in rats. Among individual animals, the metabolic changes correlated with the histopathologic changes, thus providing additional validation to the metabonomic technology platform.
Materials and Methods
Animals
Thirty 6- to 8-week-old male Sprague-Dawley rats (CRL: CD(SD)IGS BR) (Charles River Laboratories, Portage, Michigan) weighing 225 to 250 grams were used for this study. Animal care was in accordance with the NIH “Guide for the Care and Use of Laboratory Animals” and was authorized by the Pharmacia Animal Care and Use Committee. The animals were fed Purina Lab Certified Rodent Diet #5002 ad libitum and were allowed to acclimate for a period of 7 days before they were placed into metabolic cages for 2 days before treatment. Urine was collected into vials that contained 1 ml of 0.1% sodium azide and were surrounded by wet ice. Room temperatures remained within 19°C to 23°C, daily relative humidity remained within 45% to 65%, and fluorescent lighting was provided on a 12 hour on, 12 hour off cycle, using a cycle of light during the daytime and darkness at night.
Rats were dosed intraperitoneally (ip) with microcystin-LR (Sigma Chemical Co.) in 0.9% sodium chloride. The 10 animals in the high-dose group received 80 µg/kg, the 10 animals in the low-dose group received 20 µg/kg, and the 10 control animals received injections of saline vehicle alone. In each treatment group, 5 animals were sacrificed 48 hours after dosing and 5 were sacrificed 168 hours (7 days) after dosing. One animal (rat No. 28) that received the high dose and was intended for sacrifice at 168 hours died 24 hours after dosing. The other rats were euthanized by exsanguination following isoflurane anesthesia.
Clinical Chemistry and Histology
Urine samples were collected from 24 to 8 hours and 8 to 0 hours before treatment, 0 to 8 hours and 8 to 24 hours after treatment, and then for every 24-hour period until the time of euthanasia. Urine volume, pH, osmolality, protein, and glucose were measured. Blood samples were taken by tail vein from all of the animals 24 hours after dosing and then again at the time of euthanasia, either 48 or 168 hours after dosing. Serum clinical chemistry consisted of creatinine, blood urea nitrogen, alanine aminotransferase, aspartate aminotransferase, alkaline phosphatase, γ glutamyl transferase, glucose, sodium, potassium, calcium, inorganic phosphorus, albumin, total protein, and total bilirubin. Gross necropsy was performed and portions of the liver and kidneys were fixed by immersion in 10% buffered formalin. Liver, kidney, brain, and total body weights were recorded. The tissues were embedded in paraffin, routinely processed, and stained with hematoxylin and eosin. Severity of the lesions were scored as minimal, mild, moderate, marked, or severe.
1 H-NMR Spectroscopic Analysis of Urine
Following centrifugation at 800 × g to remove particulate material, aliquots of urine were stored at –75°C and then shipped on dry ice to Imperial College London for analysis. Samples were prepared for NMR spectroscopy into covered 96 well plates using the Bruker SampleTrack system and a Gilson 215 Prep robot. An aliquot of 400 µl of urine was mixed with 200 µl of buffer (0.2 M Na2HPO4/0.04 M NaH2PO4 in H2O/D2O (80:20), pH 7.4, 3 mM sodium azide, and 1 mM 3-trimethylsilyl-1-[2,2,3,3- 2 H4] propionate (TSP) as an internal standard). The plates were centrifuged at 4000 rpm for 5 minutes to remove any insoluble material and then positioned in a BEST™ system for further NMR analysis. Five hundred μl of each sample were automatically injected into a 5 mm flow-injection probehead with z-gradient attached to a Bruker Avance 600 spectrometer operating at 600 MHz 1 H observation frequency (Bruker Biospin, Karlsruhe, Germany). 1 H NMR spectra of the samples were acquired using a standard pulse sequence with irradiation during a 2 second relaxation delay and also during the 100 ms interpulse mixing time to suppress the water resonance. For each sample 64 transients were collected into 32 768 data points using a spectral width of 20.036 ppm. The total acquisition time was ~4 minutes per sample. Prior to Fourier transformation, an exponential line-broadening factor of 1 Hz was applied to each free induction decay. The spectra were phased, baseline corrected, and referenced to TSP (δ 0.0) automatically using an in-house routine written in MATLAB 7.8.0 (The MathWorks, Natick, Massachusetts).
Statistics
Clinical chemistry data were compared using Fisher’s least significant difference test, as calculated by the statistical package in the Xybion Path/Tox System, version 4.2.2. 18 Every NMR spectrum consists of a large number of peaks that can be referred to individual metabolites. To facilitate the analysis of the NMR spectra, the spectral features were aligned using recursive segment-wise peak alignment 45 to reduce the impact of small variations in chemical shift due to, for example, variation in pH or ionic strength. Then, normalization was performed using probabilistic quotient normalization 11 to adjust for urinary concentration differences among individual animals. The high spectral information of 32 768 data points per spectrum was then reduced by selecting a spectral area from 0.4 to 10.0 ppm, and the region of the remaining water signal (δ 4.50-6.2) was excluded prior to analysis.
Using the remaining 14 365 variables of the fully resolved urine spectra, it is possible to describe in multivariate space the reaction of individual animals in the time course of the study after dosing of different concentrations of a compound. Calculation of the magnitude of posttreatment changes compared to predose spectra (0 hour samples) was used to describe the intensity of metabolic effects (equation 1). The magnitude at a particular timepoint (M(t)) was calculated using the total intensity at each spectral data point xi:
27
Metabolite assignment of identified peak patterns was performed using in-house databases, HMDB, 49 Amix v3.9.8/SBase (Bruker, Germany), 2D-NMR acquisitions, and spiking experiments.
Results
Histopathology and Clinical Chemistry, Liver
Sublethal injection of 80 µg/kg ip of microcystin-LR caused moderate to severe centrilobular necrosis in the liver at 2 days post dosing (pd) in 5 out of 5 rats (Table 1). At 7 days pd, the lesions were essentially resolved (Table 1). The principal lesions 2 days pd were centrilobular congestion and necrosis (Figs. 1–3). In rat No. 21, the necrotic centrilobular areas were distinct (Fig. 1). In other animals, such as rat No. 22, the necrotic centrilobular and mid-zonal areas were confluent, isolating the periportal and portal areas (Fig. 2). In the non-necrotic areas of 4 out of 5 animals, the hepatocytes were rounded and in disarray. One rat (No. 28, originally scheduled to be sacrificed 7 days pd) was moribund 24 hours pd and was sacrificed. In this animal, the hepatic architecture was nearly effaced by confluent centrilobular and mid-zonal necrosis, congestion, and hemorrhage, and only small periportal areas were spared.
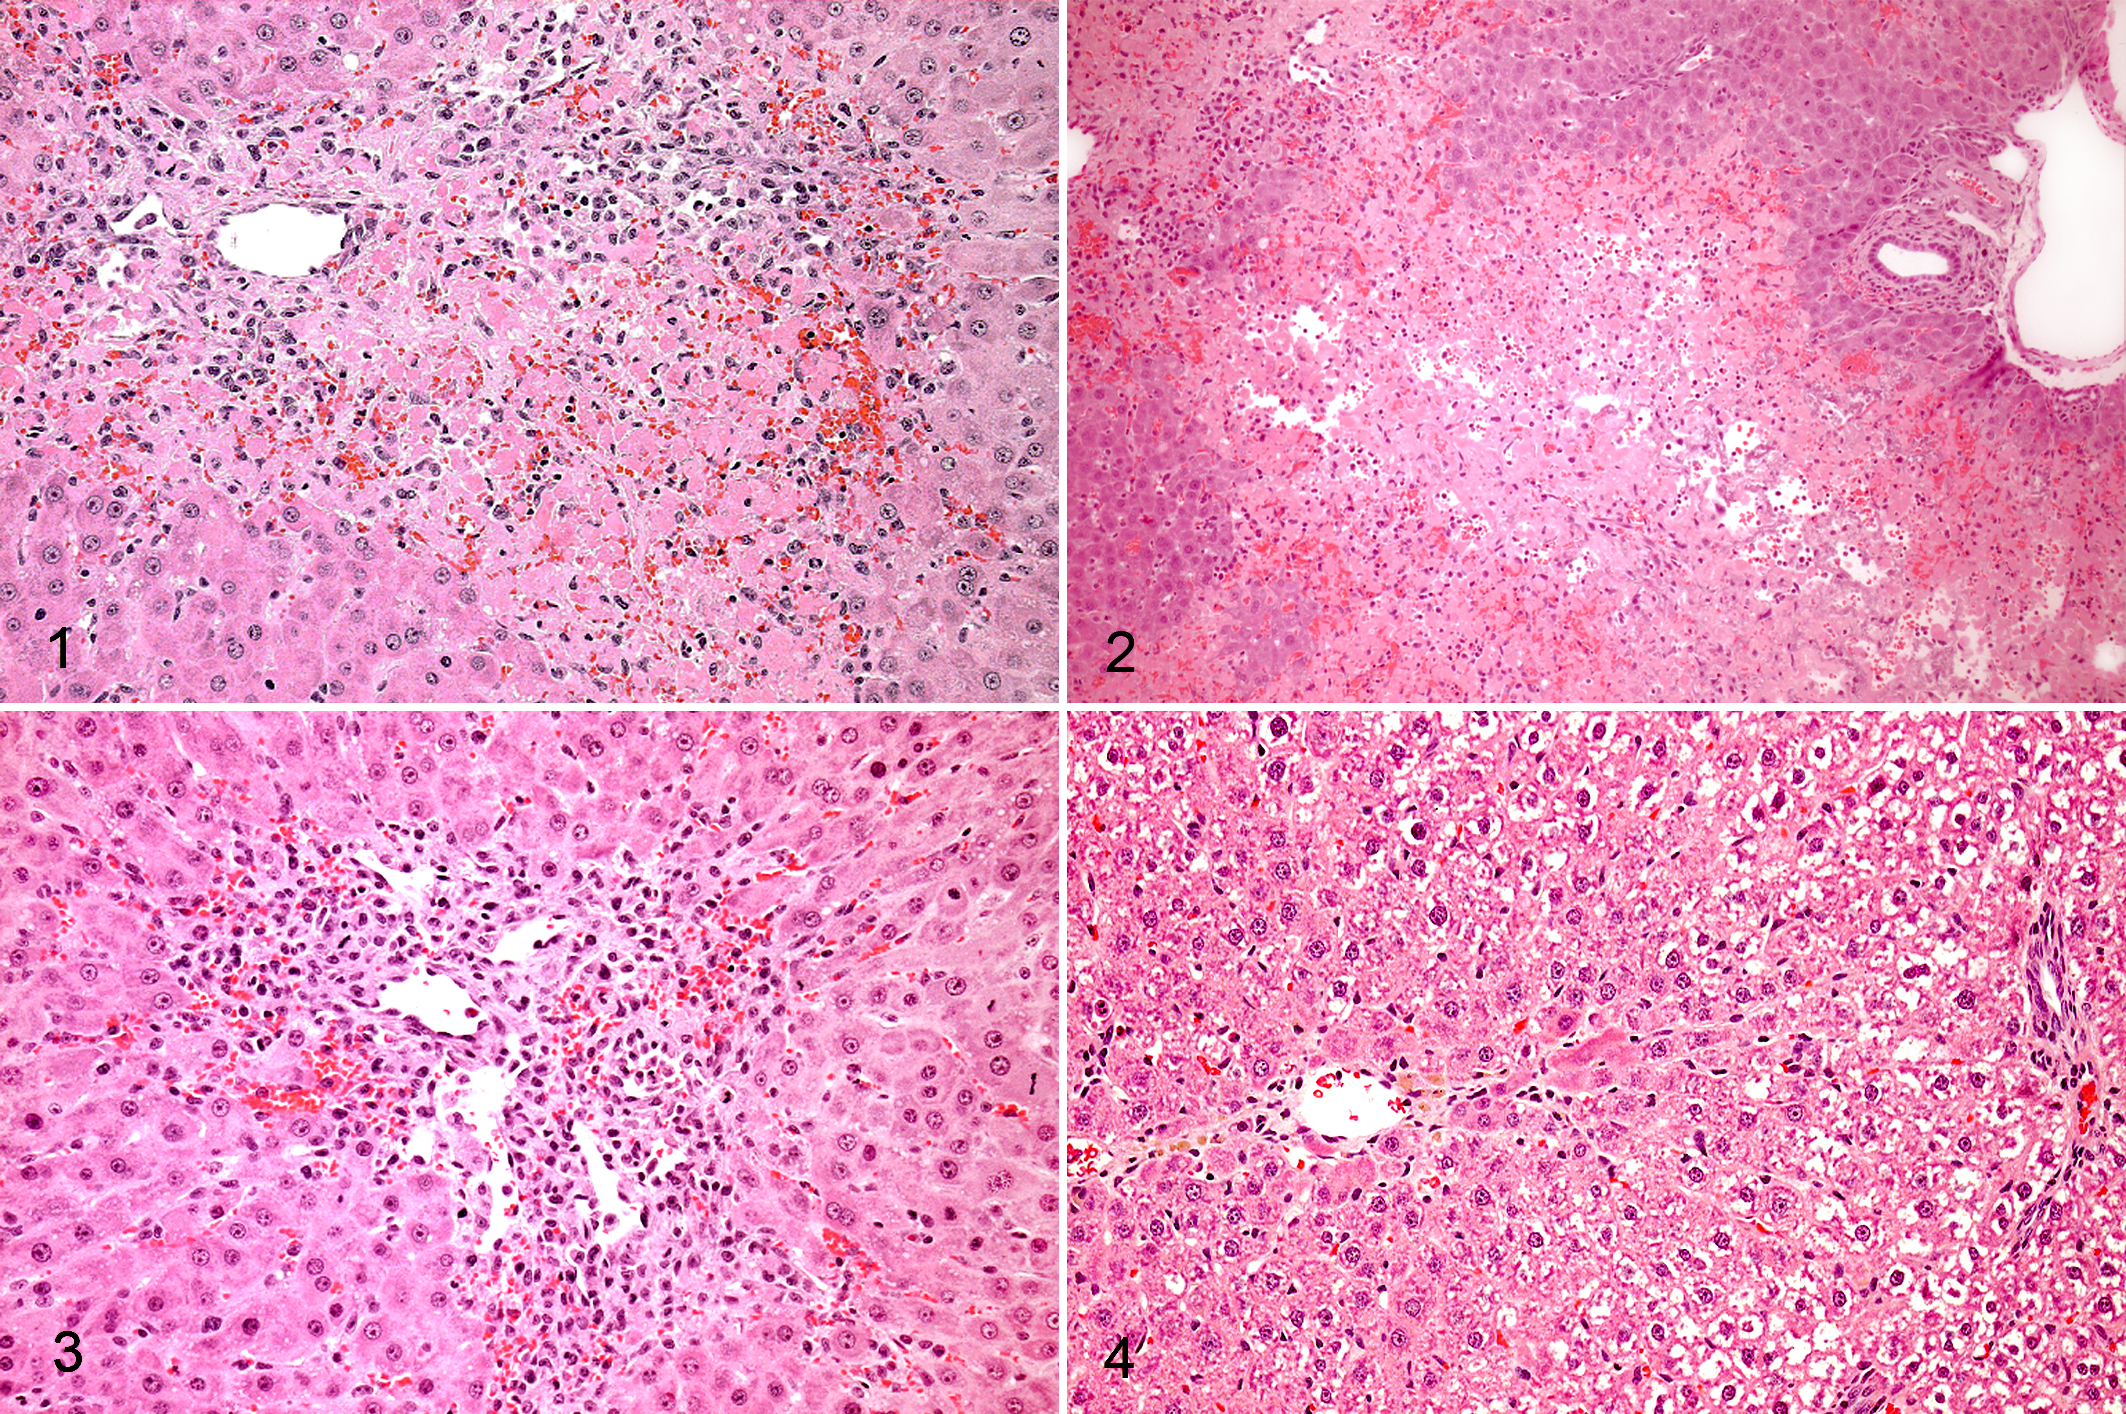
Summary of histopathology results, liver.
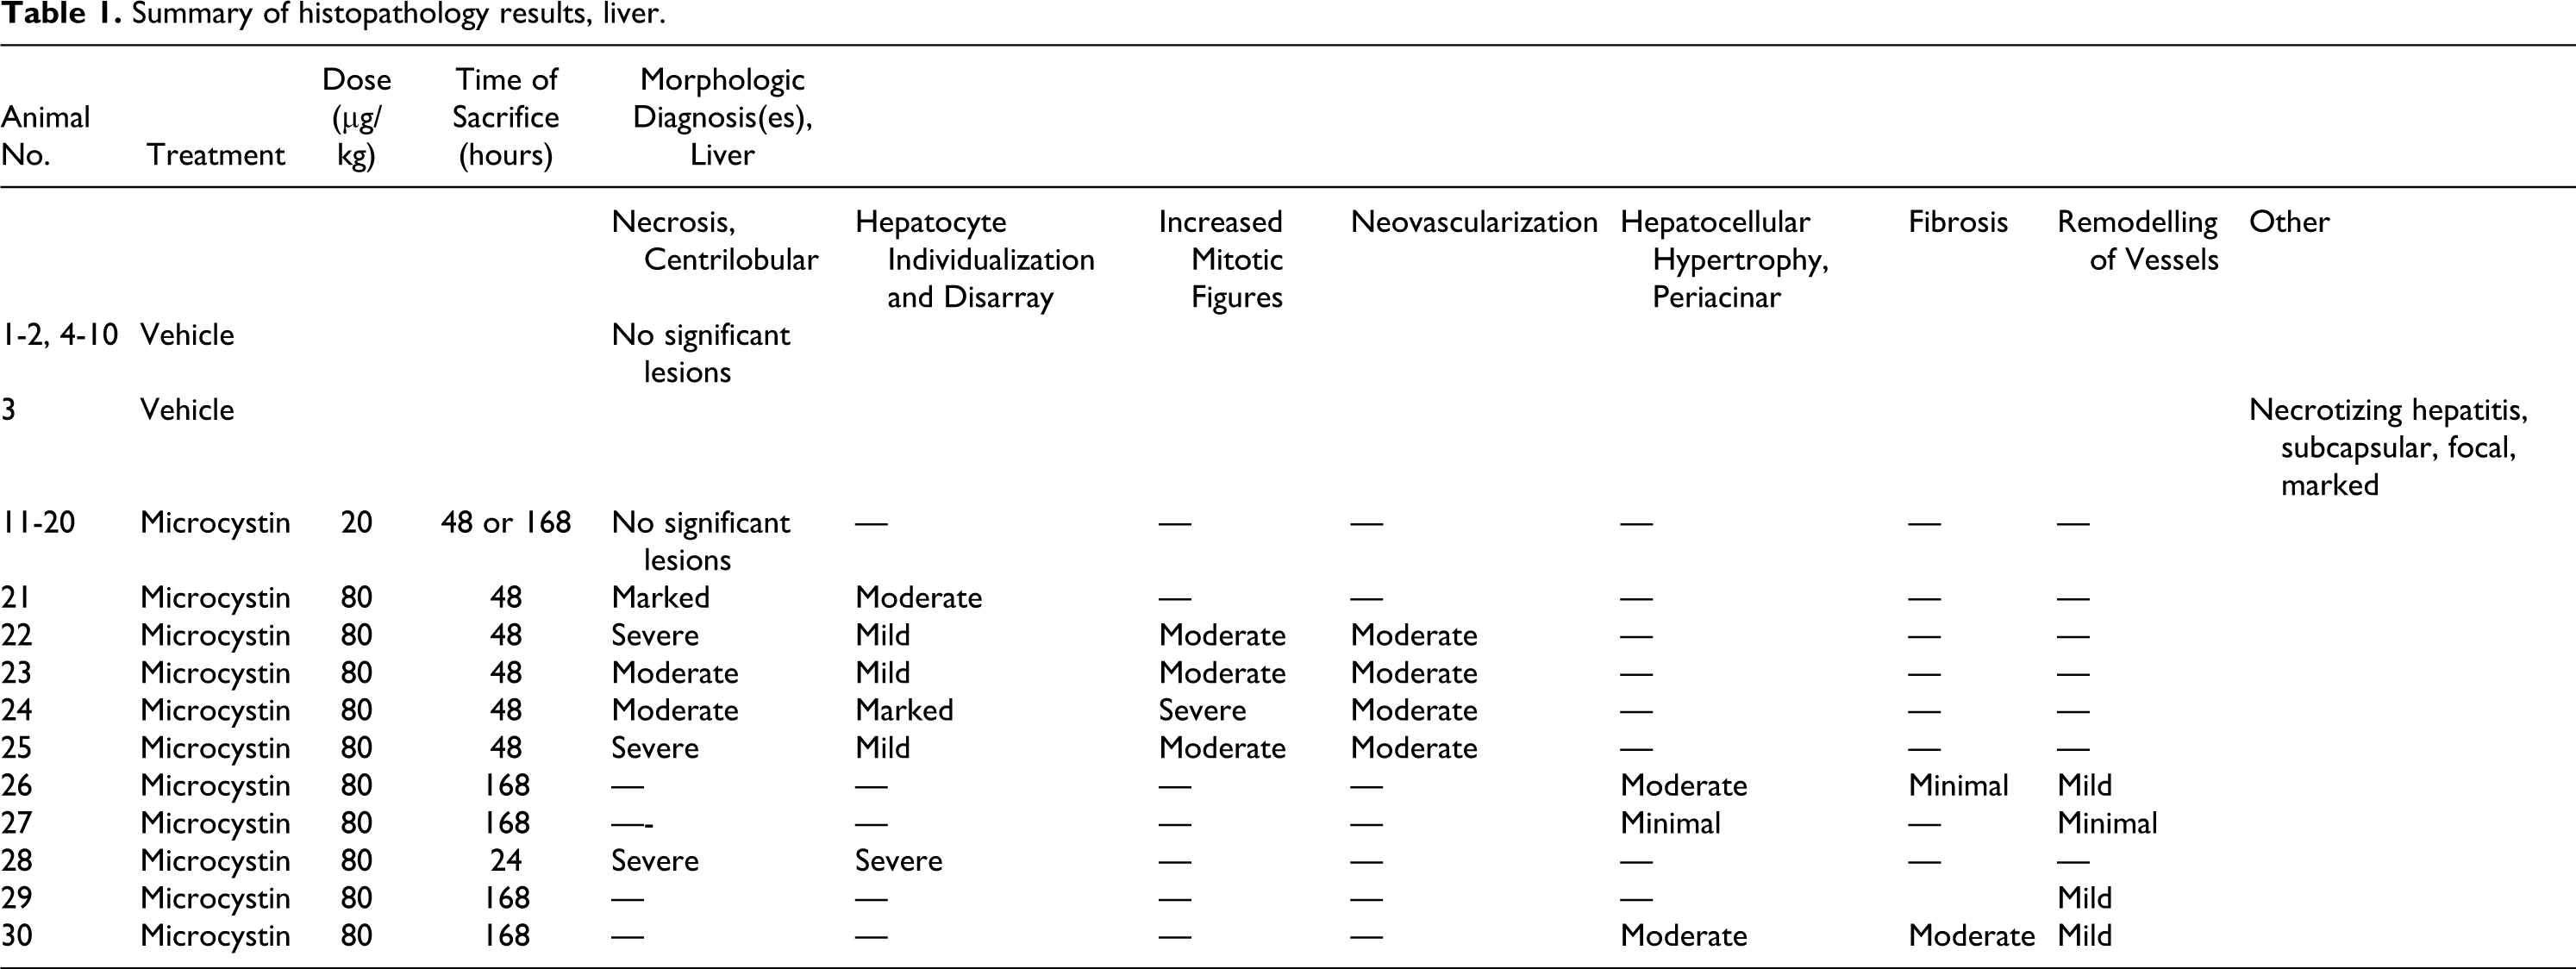
In some rats, centrilobular regeneration had already begun 2 days pd. In rat No. 23, there was extensive proliferation of oval cells and also development of many new centrilobular blood vessels (Fig. 3). Changes were similar in rat No. 24, but additionally the hepatocytes in the regenerative areas had a markedly increased mitotic rate.
At 7 days pd, necrotic changes were absent and were replaced by regenerative changes. In 2 of the 4 rats, centrilobular hepatocytes were moderately hypertrophied. In rat No. 30, there was moderate centrilobular fibrosis and in rat No. 26, there was minimal centrilobular fibrosis (Fig. 4). This was accompanied in both rats Nos. 26 and 30 by mild remodeling of the centrilobular blood vessels (Fig. 4). Rats Nos. 27 and 29 had no significant changes. No compound-related histopathologic effects were seen in the rats Nos. 11-20, dosed with 20 µg/kg of microcystin-LR.
Clinical chemistry data were consistent with the histopathology results (Table 2). In the rats dosed with 80 µg/kg, the liver enzymes AST, ALT, and ALP were markedly elevated 24 hours and 48 hours pd, but returned to normal levels at 168 hours pd. The only exceptions were rats Nos. 27 and 29, the individuals with no histopathologic lesions, in which AST, ALT, and ALP were within control range. At 24 hours, rat No. 27 had AST 105 and ALT 38; rat No. 29 had AST 101 and ALT 43 U/L.
Selected clinical pathology parameters, group means.a
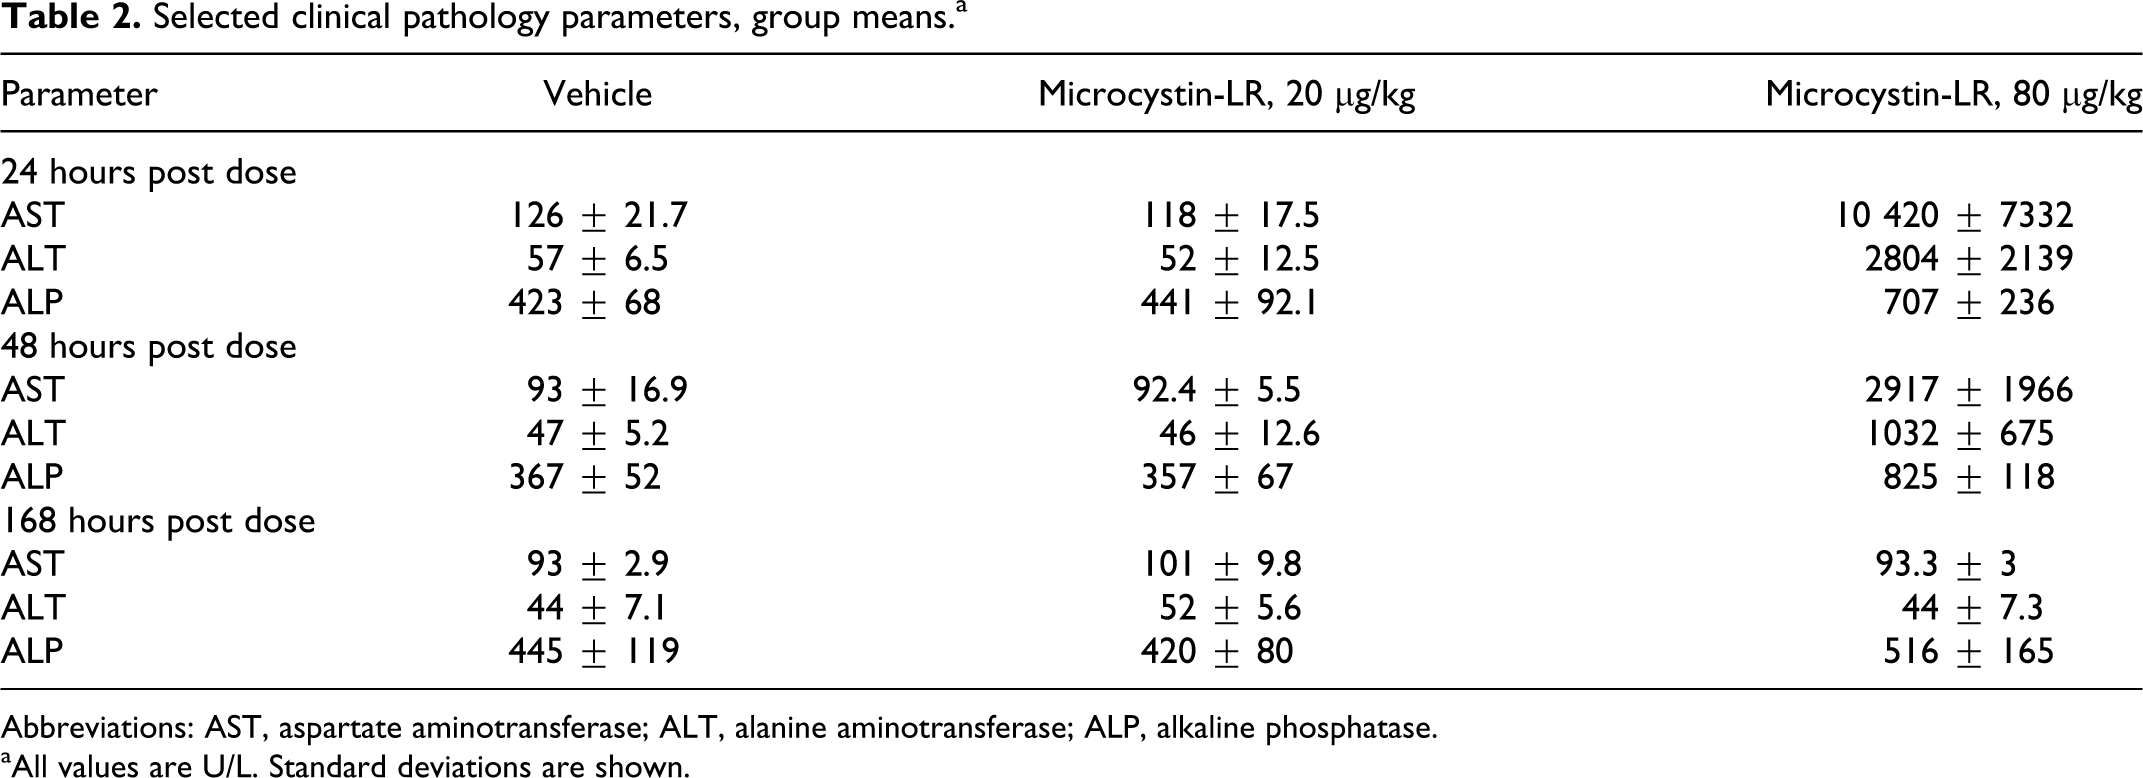
Abbreviations: AST, aspartate aminotransferase; ALT, alanine aminotransferase; ALP, alkaline phosphatase.
aAll values are U/L. Standard deviations are shown.
Renal Histopathology and Clinical Chemistry
In the animals treated with 80 µg/kg, 5 out of 5 of the animals sacrificed at 48 hours pd had glomerular changes that were marked in 3 animals and minimal in 2 animals. Similarly, the high-dose animal that was moribund and sacrificed at 24 hours pd (rat No. 28) had moderate glomerular changes. In contrast, in the high-dose animals sacrificed at 7 days pd, only 1 out of 4 had glomerular changes and it was mild. The change consisted of multiple deposits of pink-staining, homogeneous, or faintly fibrillar material within glomeruli. Characterization and cause of this renal lesion is unknown, but deposition of fibrin within glomeruli is one possibility that was considered.
Urinary total protein increased in the high-dose animals in urine collected between 8 and 24 hours pd and 24 to 48 hours pd, consistent with glomerular injury and leakage. However, renal tubular function was still adequate, as indicated by lack of significant elevation of BUN and creatinine at 24 or 48 hours pd.
Histopathology, Other Findings
Non–treatment-related findings included acute, multifocal moderate suppurative nephritis with intralesional bacterial cocci in one high-dose animal (rat No. 23); multifocal, moderate myocardial granulomas in one high-dose animal (rat No. 30); and thymic hemorrhage in one animal (rat No. 23). One animal (rat No. 29) had a single focus of neutrophilic infiltration of one portal area of the liver.
Urinalysis
In the period 8 to 48 hours pd, protein and glucose concentrations were increased in the high-dose group, while pH was decreased. After 48 hours pd, these parameters returned to normal. Rats Nos. 27 and 29 did not show any effect. No effects in the low-dose group were observed.
Urinary Metabonomics
The NMR-spectroscopic analysis of urine samples revealed clear differences in the metabolic profile over the time course of the study (Fig. 5). The main biochemical changes detected in the high-dose group were a decrease in hippurate, citrate, 2-oxoglutarate, and trans-aconitate, while betaine, taurine, and creatine increased at the same time. From about 144 to 168 hours pd, endogenous metabolite concentrations returned back to values near pretreatment profiles, indicating recovery. Further observations were an increase in guanidinoacetate and dimethylglycine at 24 to 48 hours, and in several animals a temporary elevation of hypotaurine at 24 hours pd.
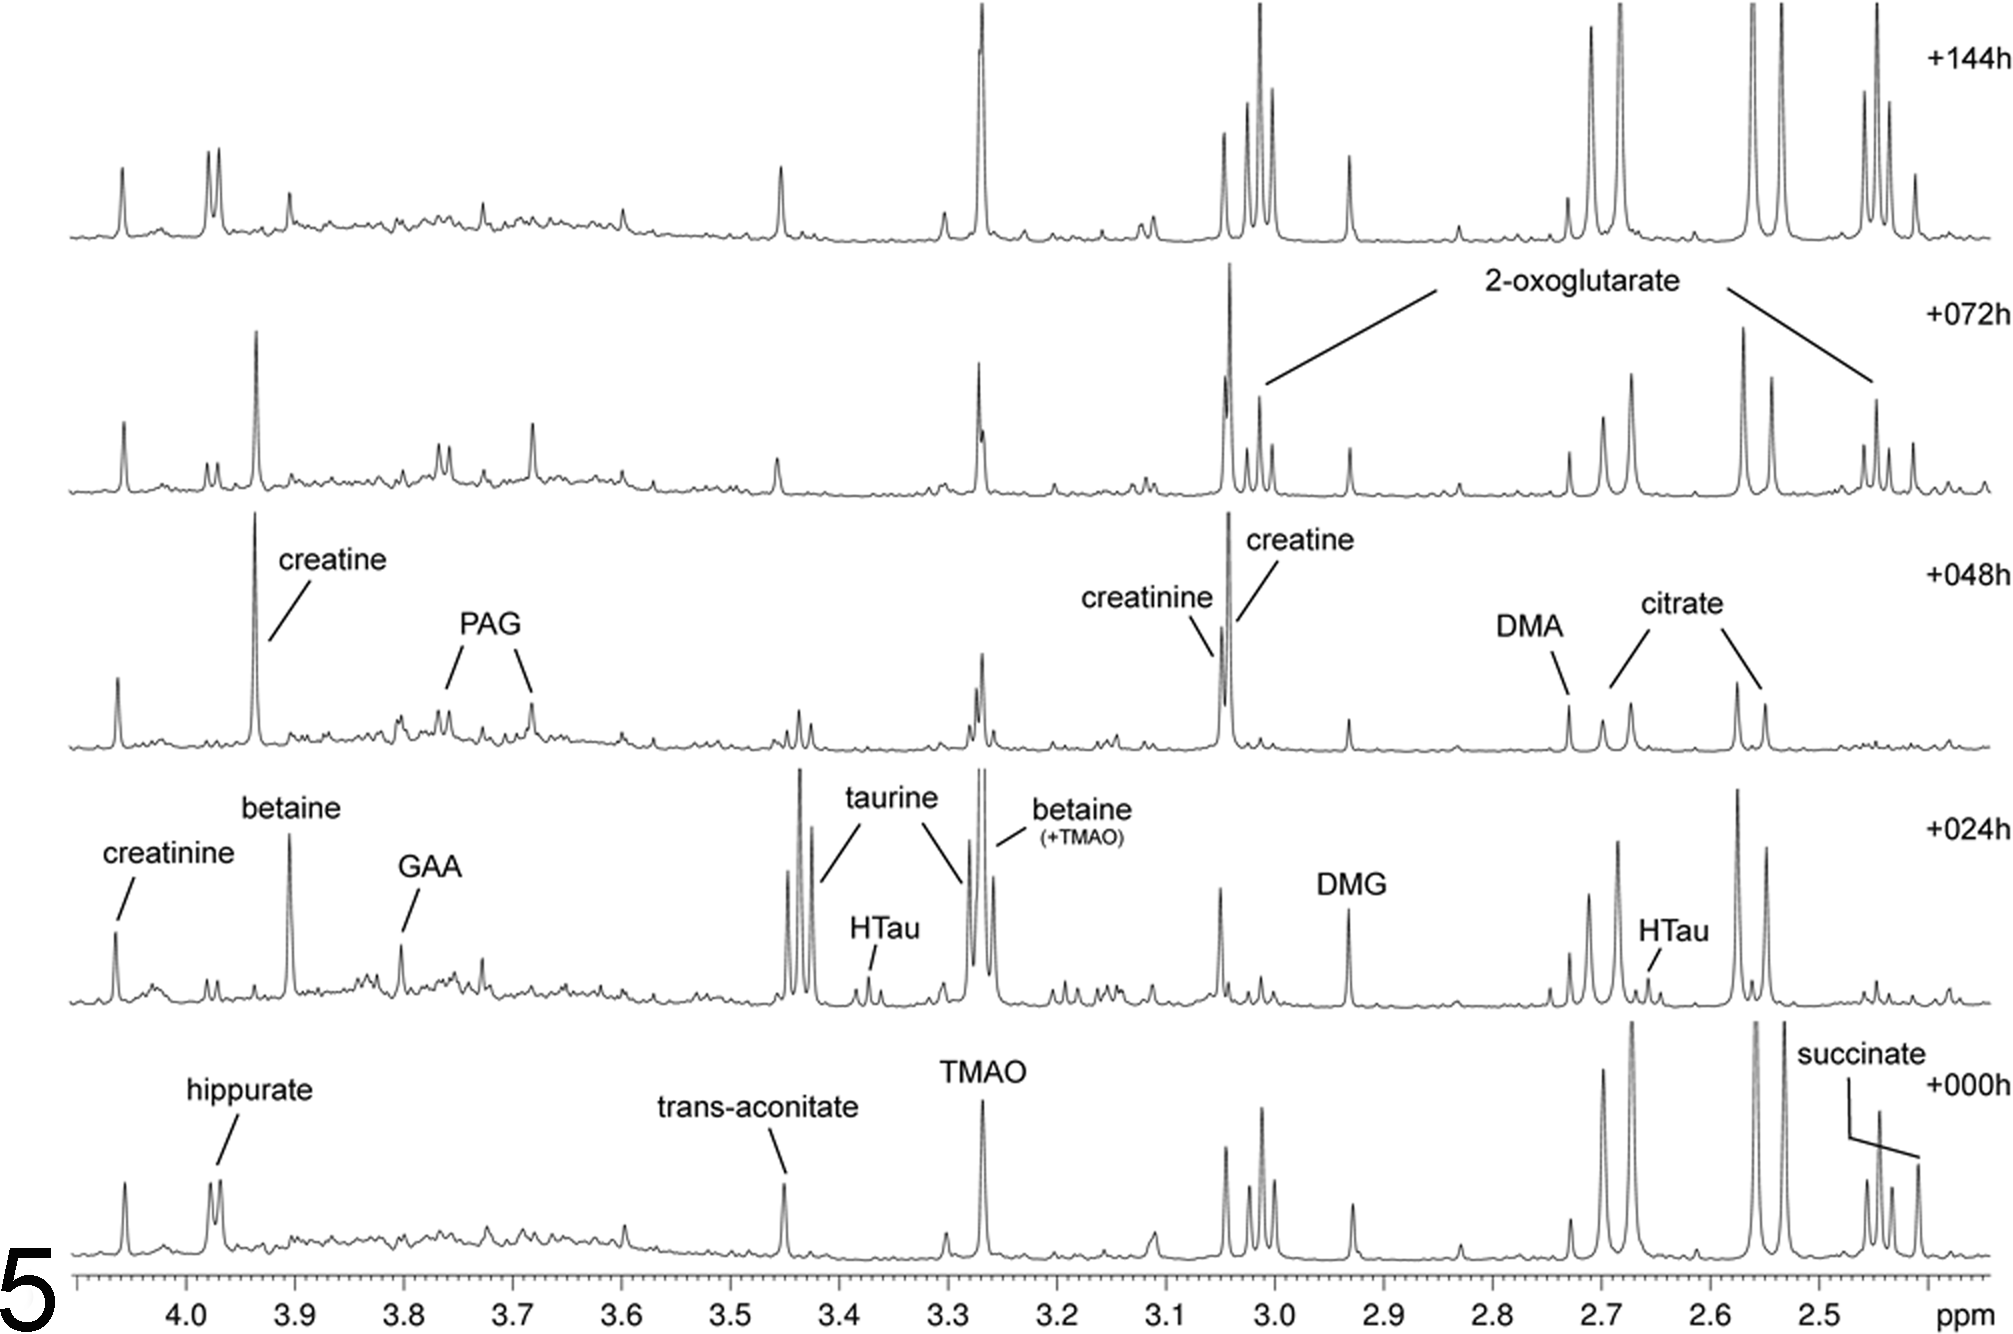
NMR spectra of urine samples from rat 30 at different timepoints. The spectra show the increase of liver toxicity markers taurine and betaine in urine collected from 8 to 24 hours post dosing (labeled +024 h) and an increase of creatine in urine collected from 24 to 48 hours post dosing (labeled +048 h). At these two timepoints, 2-oxoglutarate and hippurate signals decrease. The x-axis shows the chemical shift in ppm of each peak in the NMR spectra; the y-axis shows relative normalized intensity of each peak. TMAO, trimethylamine N-oxide; DMG, dimethylglycine; DMA, dimethylamine; PAG, phenylacetyl glycine; GAA, guanidinoacetate; HTau, hypotaurine.
Principal components analysis of the metabonomic data sets showed a strong effect at the earlier time points in the high-dose group according to the principal component PC1 versus PC2 plot (Fig. 6). The high-dose urine samples collected from 8 to 24 hours pd and 24 to 48 hours pd were outside of the control range of the experiment. By 48 to 72 hours pd, the urine profiles of the high-dose rats mapped with the controls. Analytes that contributed to the separation in the PC1 versus PC2 analysis included betaine and taurine, which both increased after dosing. Conversely, citrate and 2-oxoglutarate levels decreased. The animals in the low-dose group did not show a separation from controls. The only exception was rat No. 20.
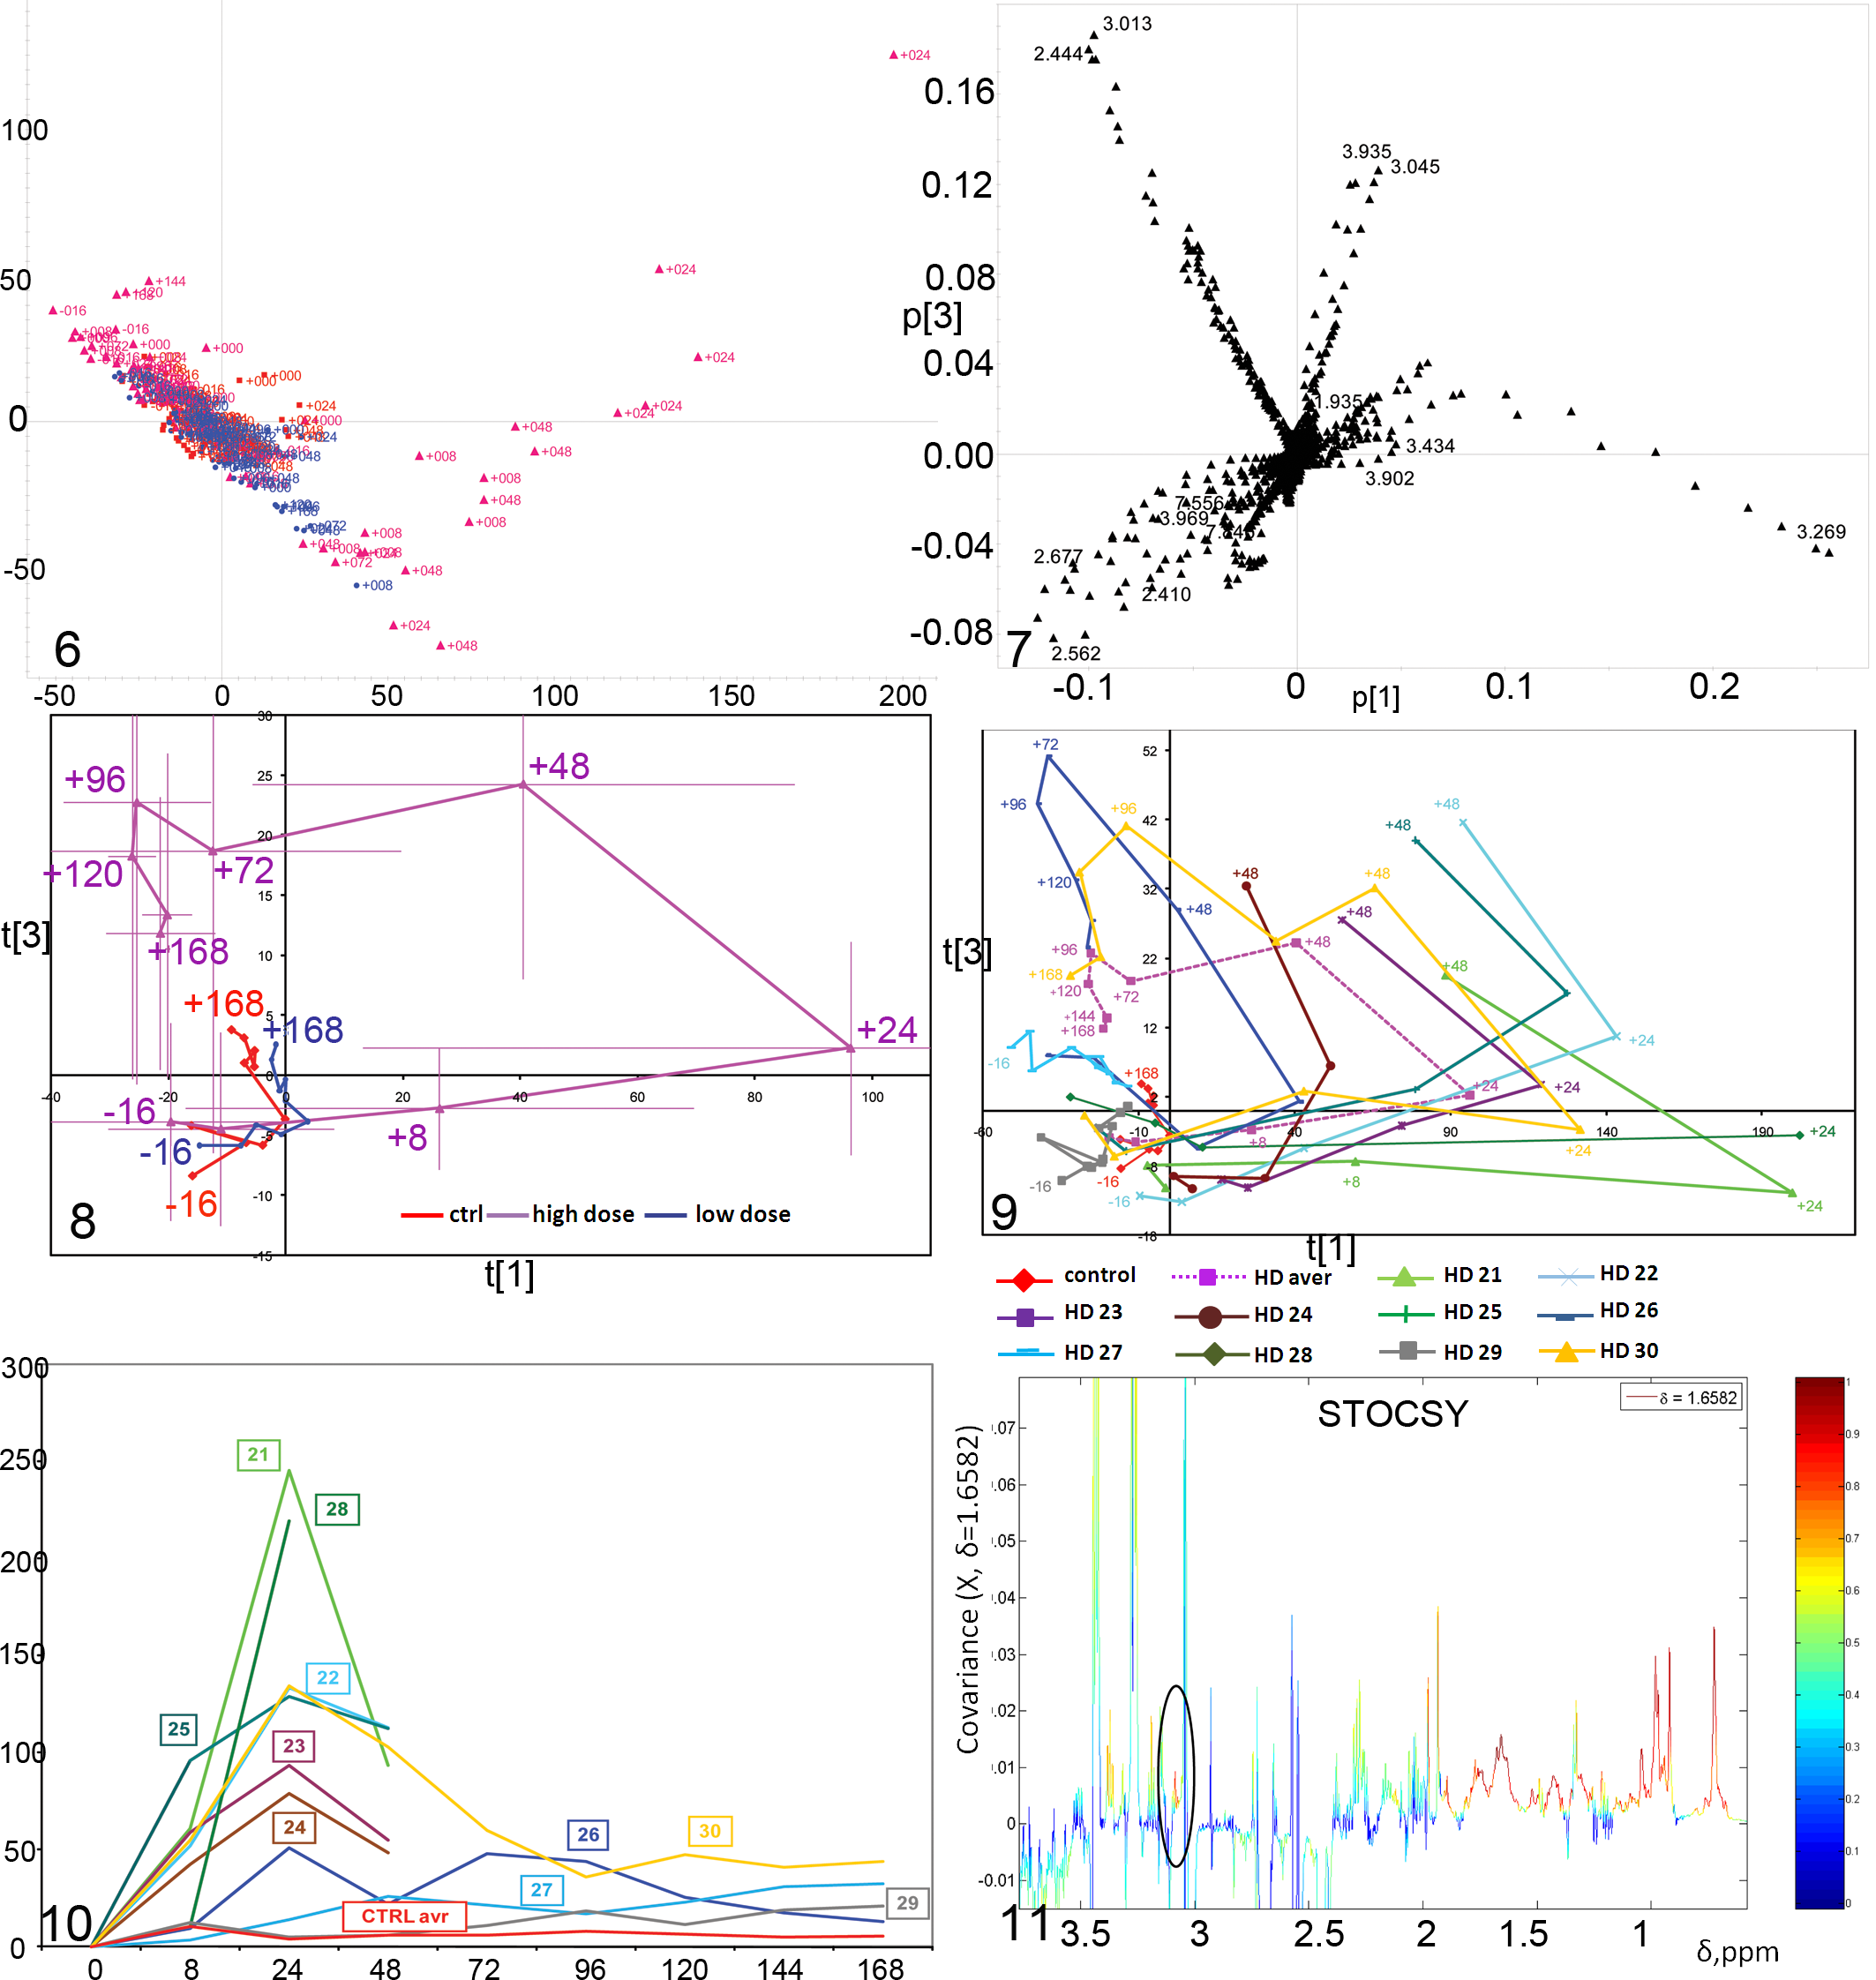
Additionally, the scores plot for PC1 versus PC3 was also analyzed to look for further contributions from metabolites. The plot gave a more detailed description of the changes in the urinary excretion profile over a longer time course for the high-dose samples. In Fig. 8, the mean PCA scores at each time of collection were plotted for PC1 and PC3 to show the trajectory of change. PC1 scores values increased until 24 hours pd, mainly due to increased betaine and taurine and decreased citrate, 2-oxoglutarate, and hippurate. Between 24 and 48 hours pd, PC3 scores increased, while PC1 scores decreased slightly. Fig. 7 represents the so called loadings responsible for the separation of the samples at different time points. For example, δ3.269 and 3.434 on the right side of the figure are the contributions of the taurine and betaine (at δ3.249 and 3.902) peaks to the separation of samples collected 8 to 48 hours from samples taken at 0 hours or at the later time points. Numbers in the direction of the separation indicate elevation in metabolite concentration, while those in the opposite direction show a decrease in metabolite concentration. The increase along PC3 was mainly due to increased creatine (δ3.935 and 3.045) and 2-oxoglutarate (2.444 and 3.013 ppm) and a decrease in hippurate (δ3.969, 7.556, and 7.846), citrate (δ2.677 and 2.562), and succinate (2.410 ppm). Between 48 and 96 hours pd, PC3 was constant, while the scores along PC1 returned to normal by 72 hours pd and were slightly decreased at later times. In this period, 2-oxoglutarate, citrate, and hippurate increased to the baseline level, while betaine decreased to baseline and creatine started to decrease to baseline. For the 120- and 168-hour pd samples, PC3 scores gradually decreased toward the control value. The PC1 versus PC3 plot was chosen as it highlights more of the changes of the samples. Large error bars for the high-dose group reflected the fact that the time points for rats Nos. 27 and 29 remained within the control group range and did not show any effect at all. The animals treated with the low-dose of 20 µg/kg did not show an effect and were within the control range of the overall analysis.
Trajectories for individual animals in the high-dose group can be plotted and this is shown in the plot of PC1 versus PC3 (Fig. 9). Here, the varying response of animals becomes very clear: Although 5 animals had been sacrificed earlier at 48 hours, their urinary excretion profiles across time, up to this time point, were very similar to the ones who were sacrificed at 168 hours. The similarity of the shape of the trajectories suggests that the mechanisms of toxic effects, detoxification, and recovery are likely the same among the individual animals. However, the magnitude and timing of these changes differs among individuals. Rats Nos. 24 and 26 had a lower magnitude in response than the other animals. Rats Nos. 27 and 29 showed no response at all. The PC1 versus PC3 visualization points out the complexity of biochemical processes in response to a toxic insult. A way of summarizing these is to plot the overall magnitude of change (M) as defined in equation 1 from predose samples. Figure 10 shows this change in magnitude per time interval of urine collection for the animals from the high-dose group. The strongest effect was at 24 hours post dose. At this time, rats Nos. 21 and 28 had the strongest effects while rat No. 24 and rat No. 26 had the weakest effects. Rats Nos. 27 and 29 showed no effect. Furthermore, rat No. 25 had a stronger response at 8 hours than the average of the other animals at this time point. On the other hand, rats Nos. 28 and 26 showed hardly any response at 8 hours post dose. At this time point, taurine concentration was the discriminator and was more elevated in the urine of rat No. 25.
The fact that the major urinary effect is at 24 hours suggests that by 48 hours pd, when animals were sacrificed and histopathology was performed, the time of strongest toxic effect had passed and tissue repair and recovery had already begun.
Additional Findings
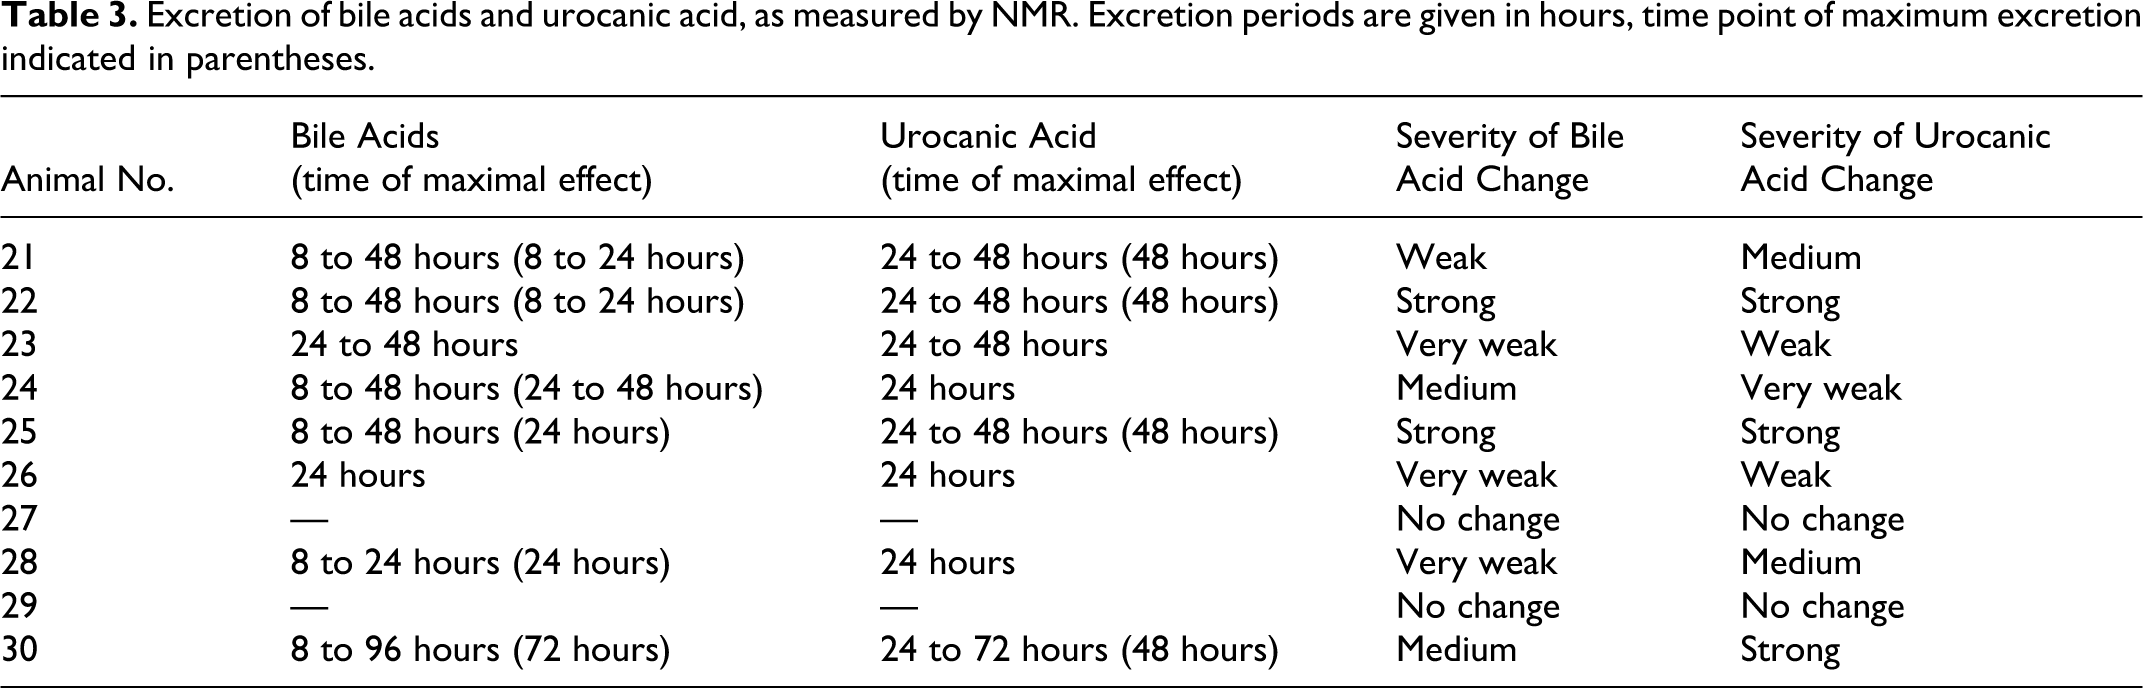
Besides the main changes identified by NMR and chemometric analysis, signals of additional analytes were detected in the urine samples. Most of the rats in the high-dose group excreted bile acids in the time interval 8 to 48 hours and trans-urocanic acid in the interval 24 to 48 hours (Table 3, Figs. 11–13). The cis- form of urocanic acid was not detected. The NMR signals of these bile acids were most similar to those of glycocholic and taurocholic acid when compared to spectra of the standards. The methyl resonances of the bile acids and of other protons in the same molecules show characteristic chemical shifts (Fig. 12), and there are additional signals in the area 3.0 to 4.0 ppm that cannot be easily distinguished. Statistical TOtal Correlation SpectroscopY (STOCSY) analysis 9 indicated the presence of at least some taurocholic acid. This identification was supported by the additionally highlighted triplet at 3.08 ppm (Fig. 11). Rat No. 30 was the only animal excreting these substances over a longer time period. None of the analytes were found for rats Nos. 27 and 29. The highest concentrations of bile acids and urocanic acid were found in the urine of rats Nos. 22 and 25; rat No. 30 showed high excretion of urocanic acid only.
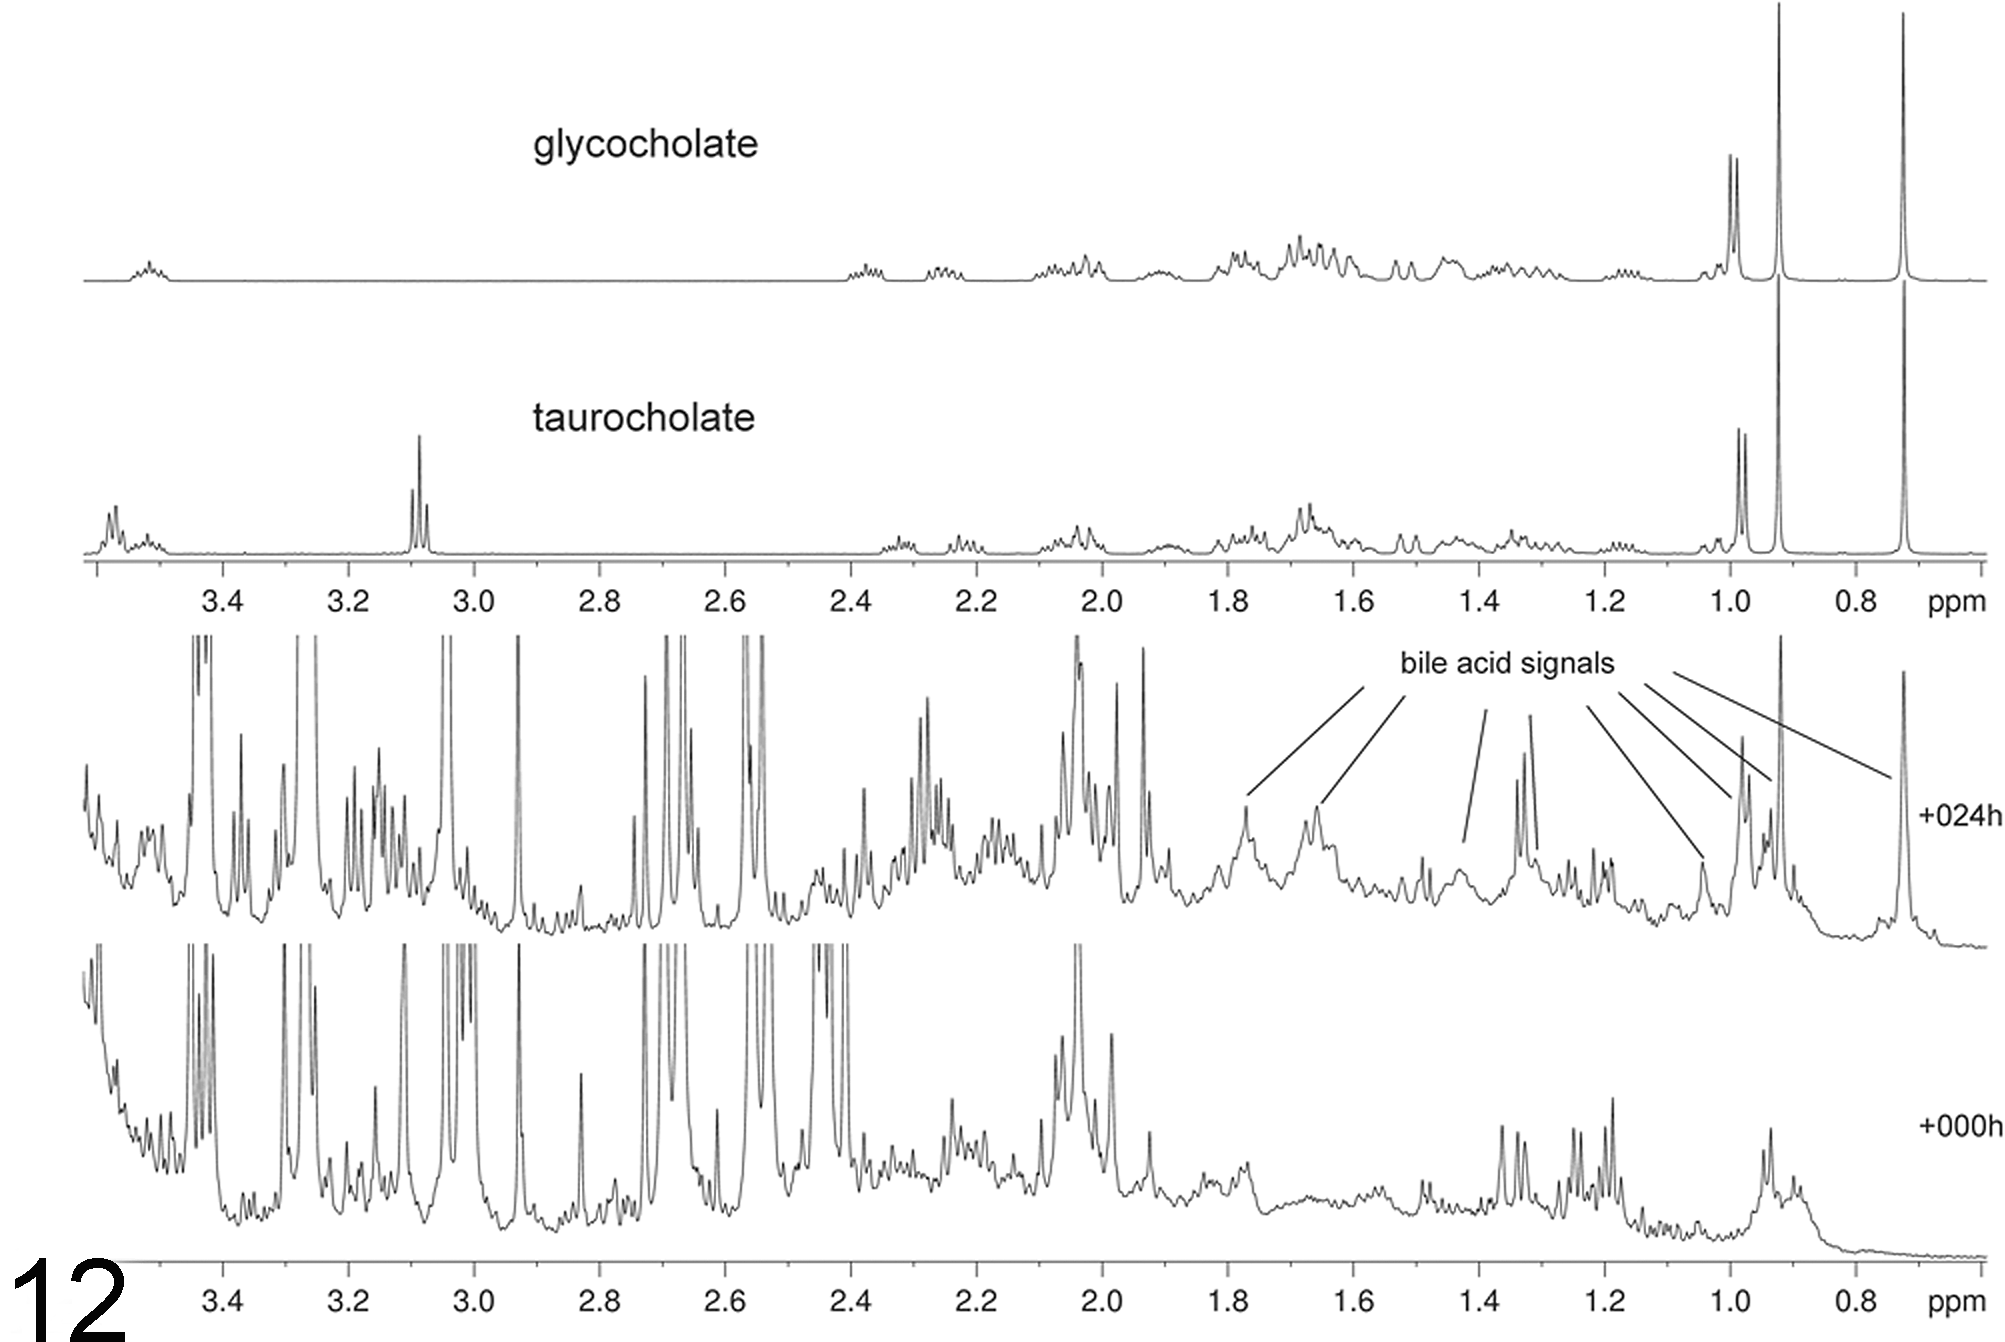
Excretion of bile acids in urine. NMR spectrum from high-dose treated rat No. 25 at 0 and 24 hours. This is a portion of the spectrum and the spectral positions are indicated by their chemical shifts in ppm. The chemical shifts of the excreted bile acids resemble those of standards of taurocholate and glycocholate measured in phosphate buffer (above).
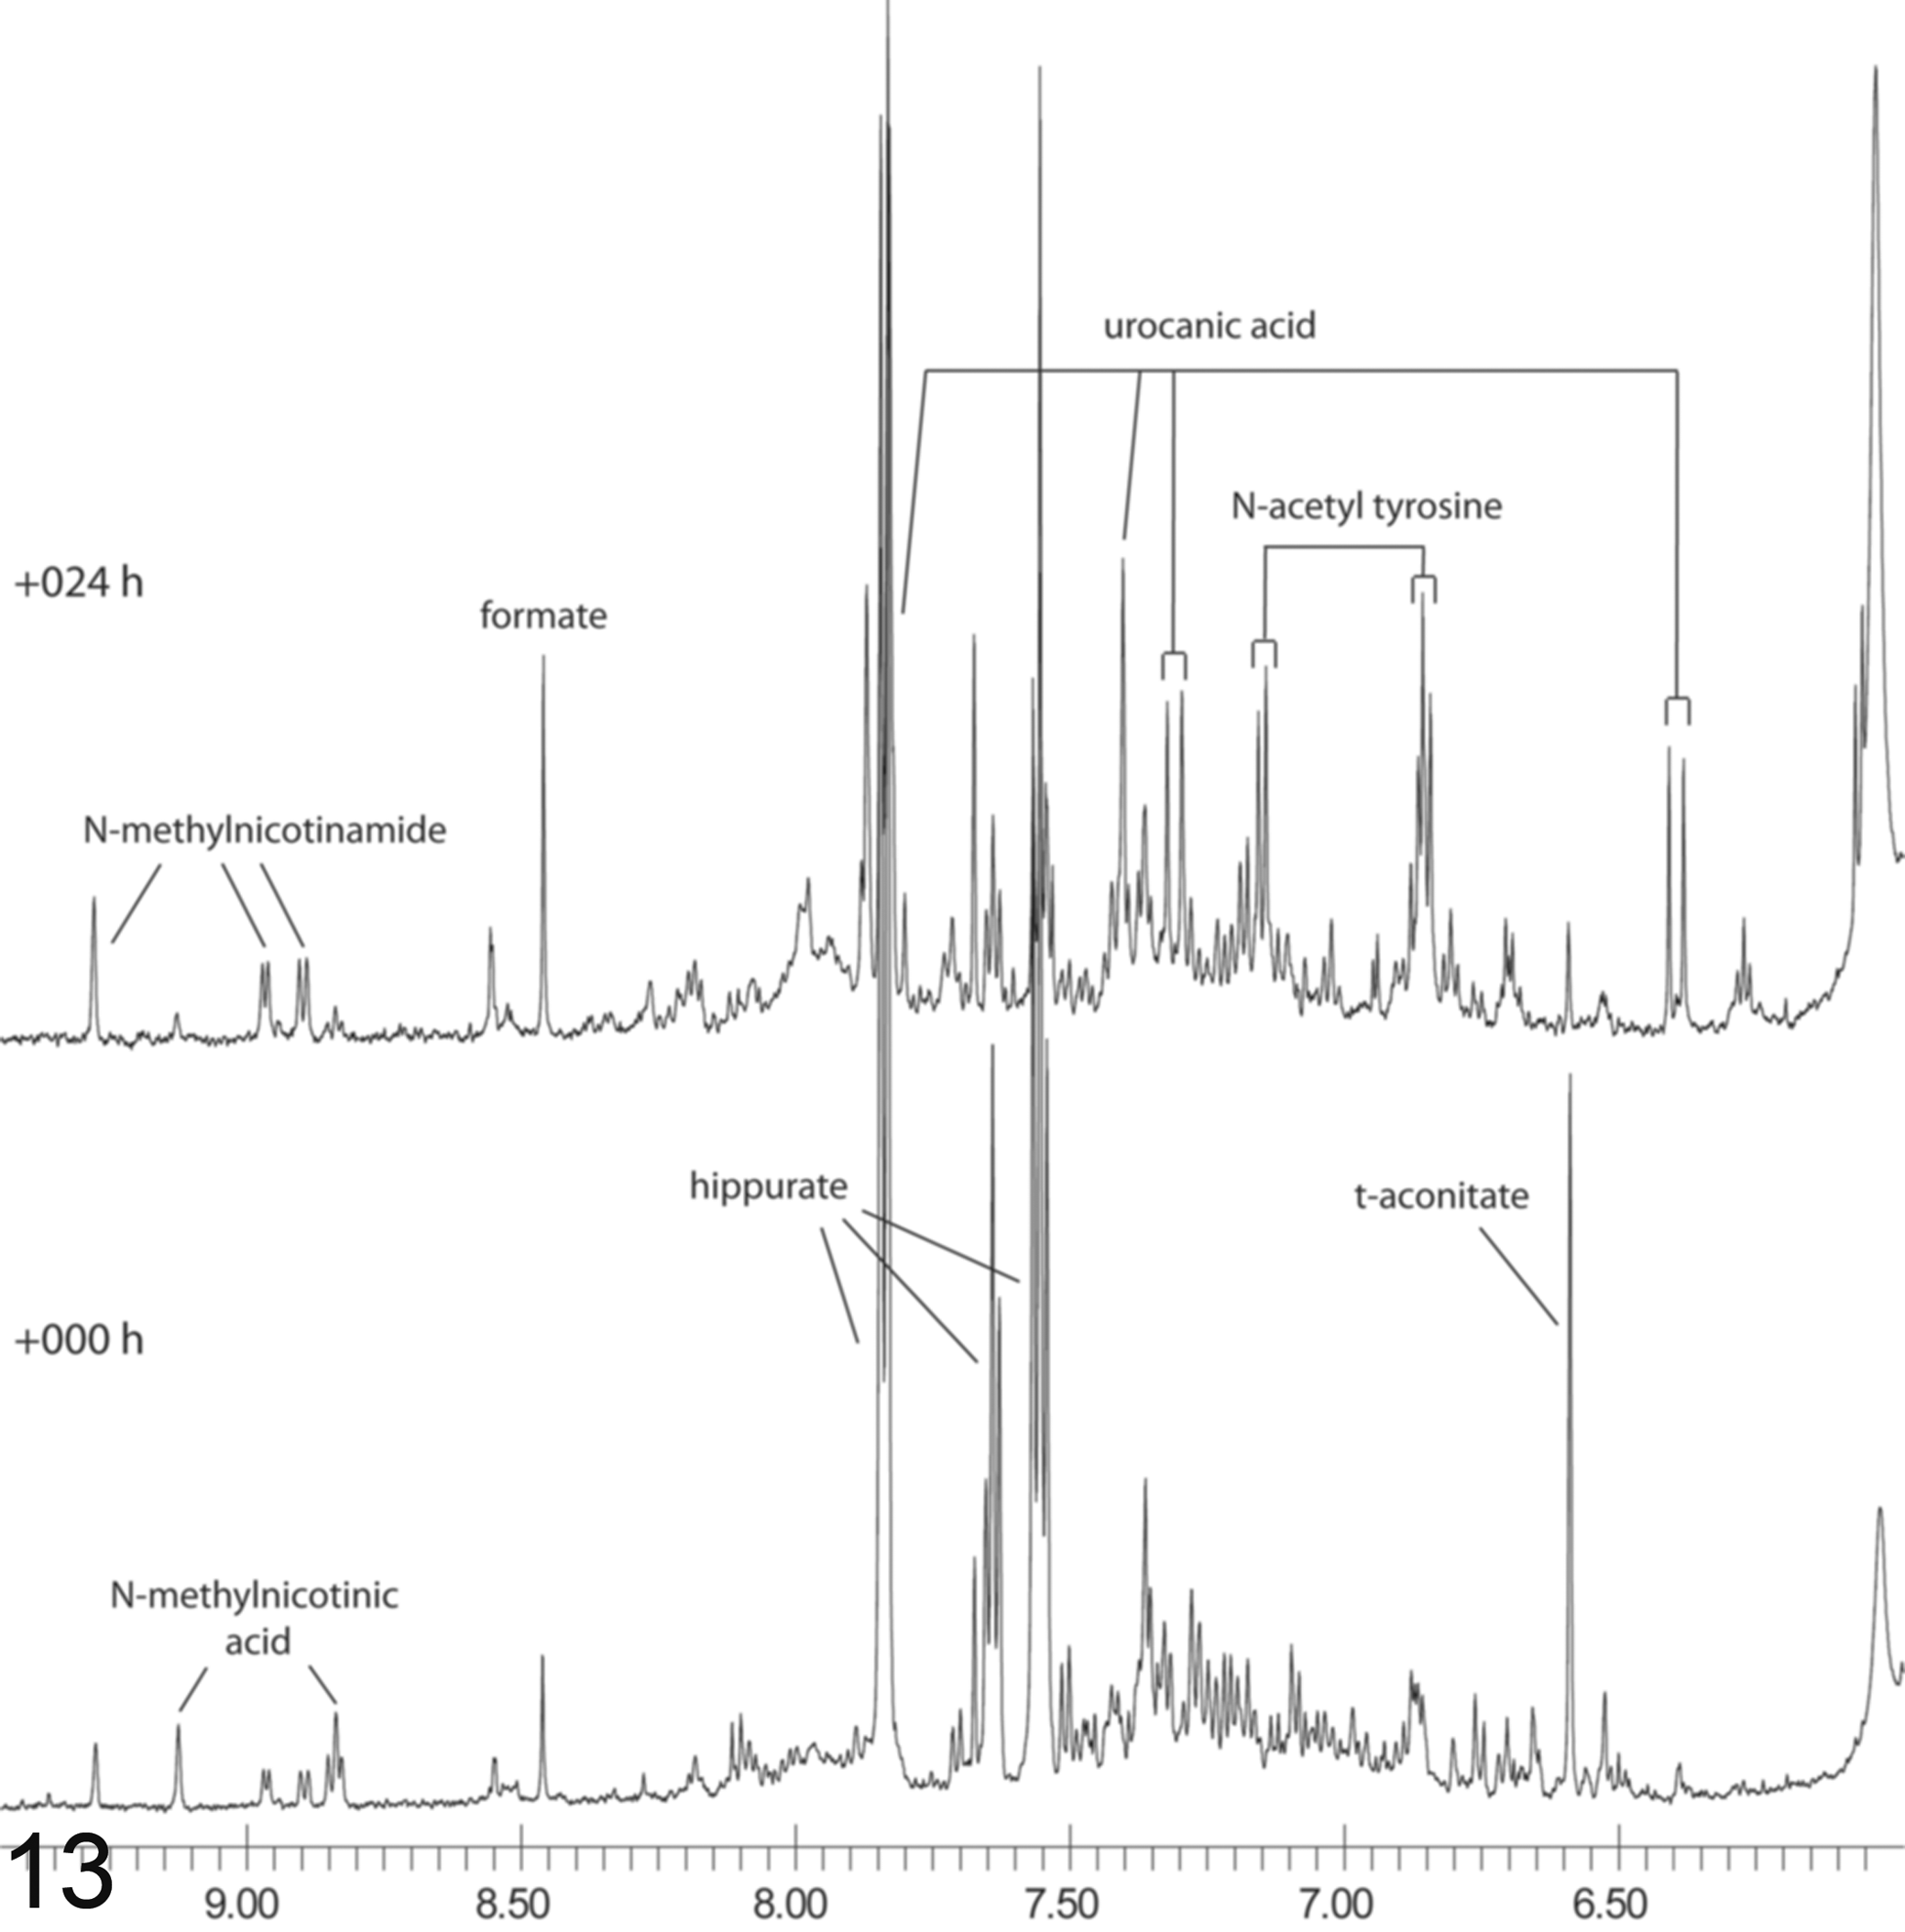
Excretion of urocanic acid in urine. NMR spectrum from high-dose treated rat No. 25 at 0 and 24 hours. This is a portion of the spectrum; the spectral positions indicate the chemical shift in ppm.
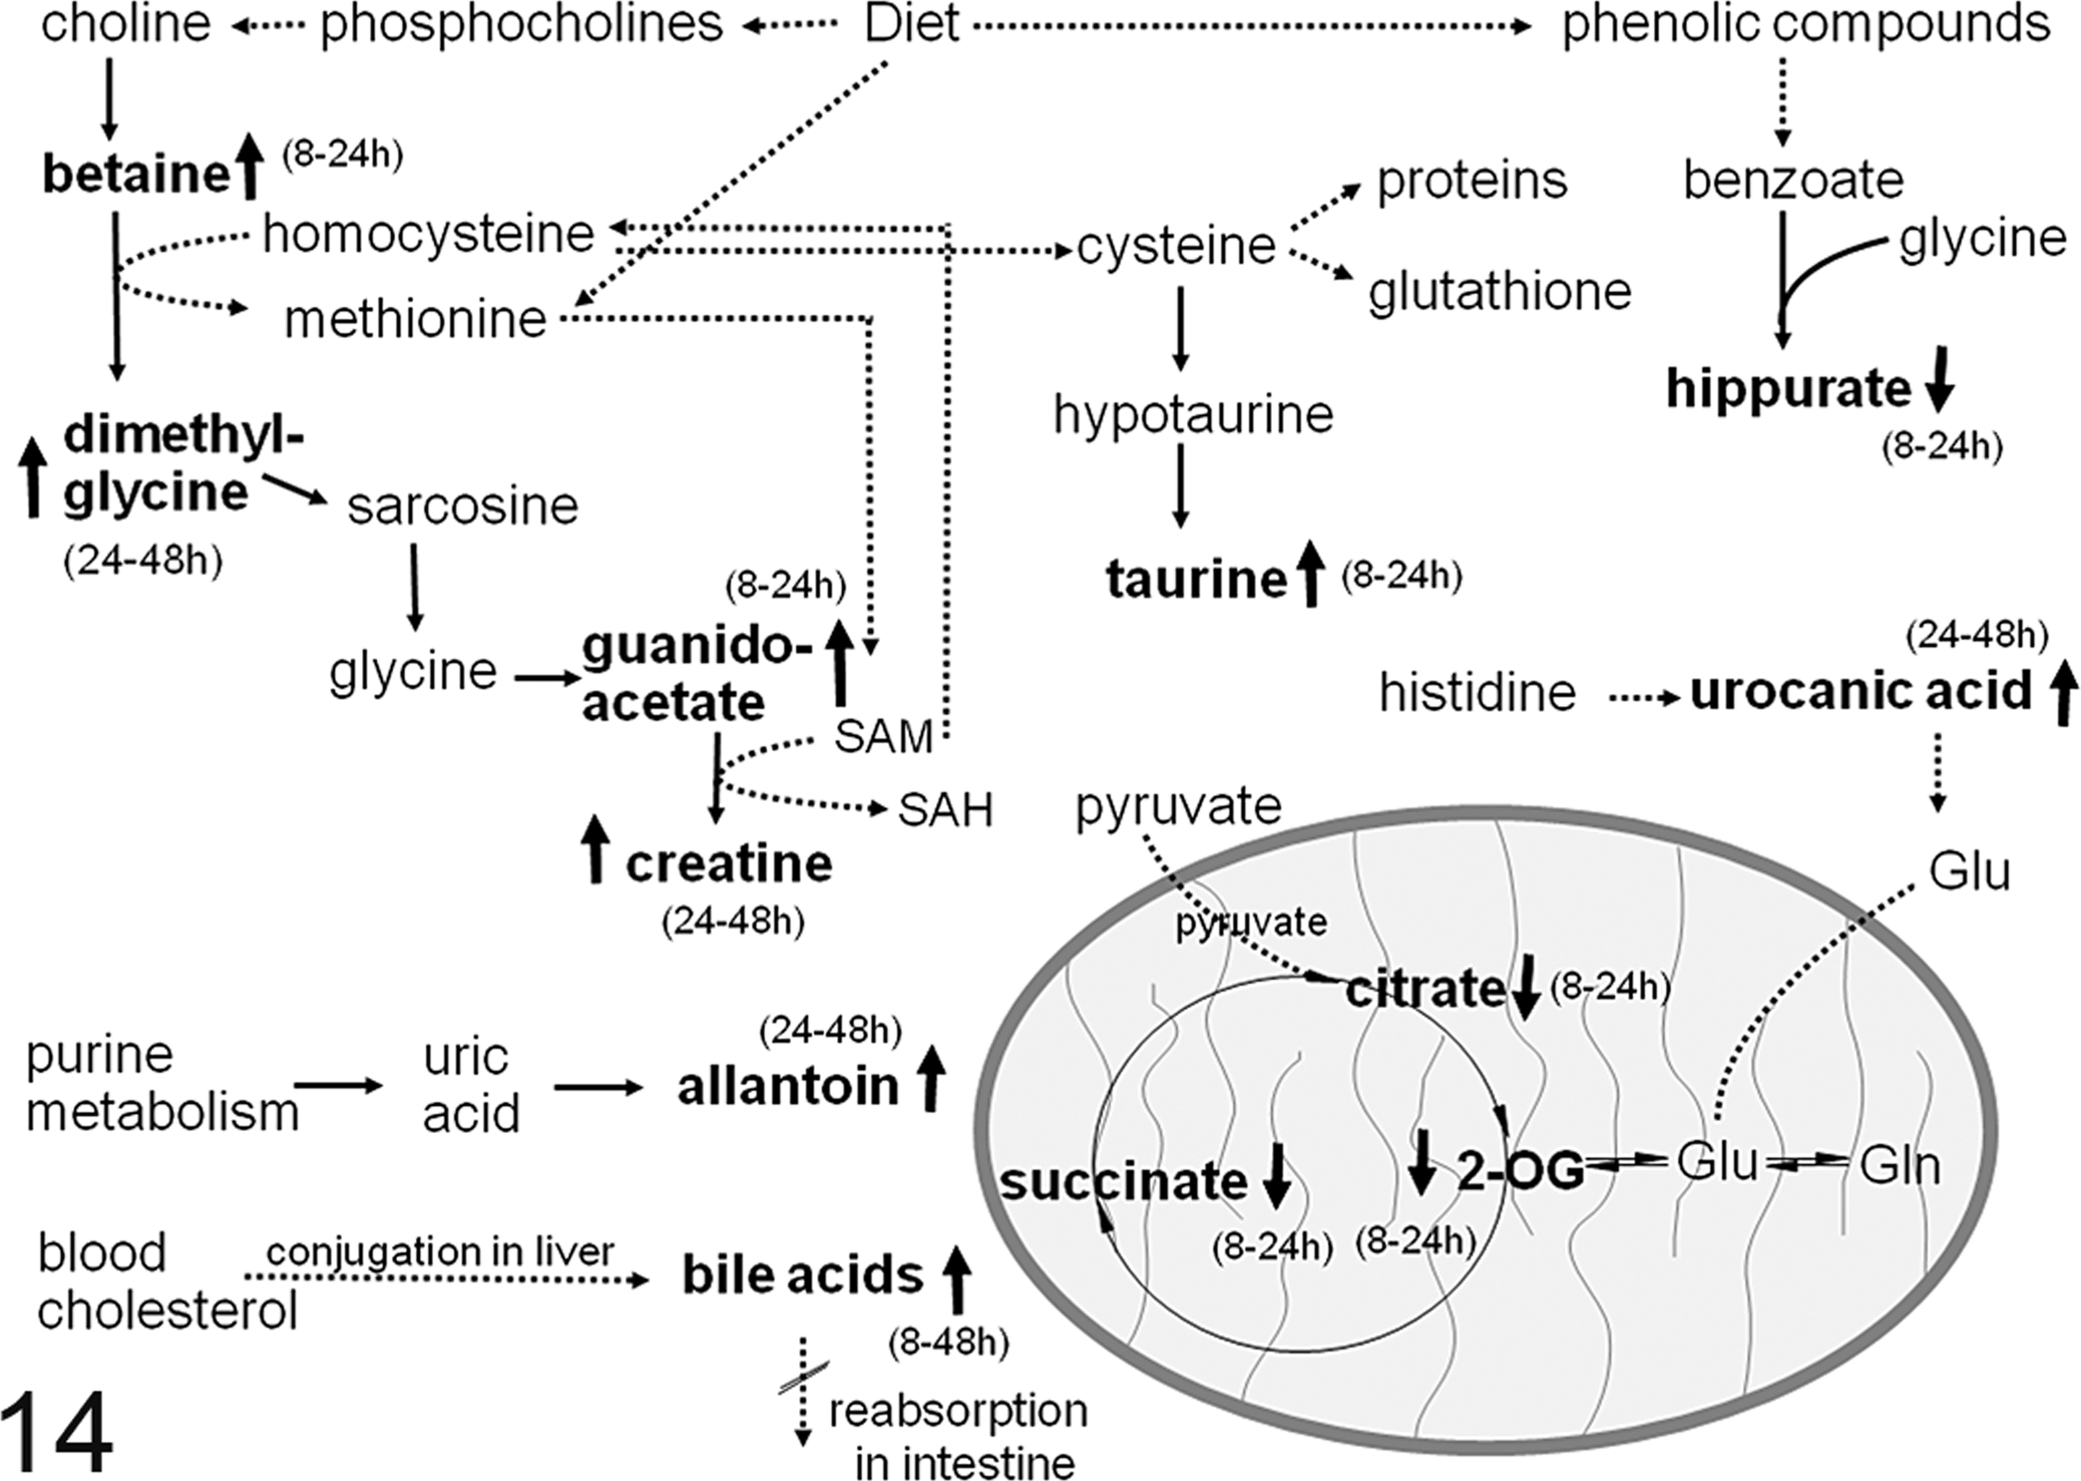
Diagram of metabolic pathways. Metabolites that are increased are shown with an upward arrow and those that decreased are shown with a downward arrow. The time of the effect is summarized in parentheses. Solid arrows show direct metabolic transformations; dotted arrows show metabolic reactions that occur in several steps. The oval represents a mitochondrion and the metabolites within the oval are generated by the mitochondrial tricarboxylic acid (TCA) cycle. Abbreviations: 2-OG, 2-oxoglutarate; Glu, glutamate; Gln, glutamine; SAH, S-adenosylhomocysteine; SAM, S-adenosylmethionine.
Excretion of bile acids and urocanic acid, as measured by NMR. Excretion periods are given in hours, time point of maximum excretion indicated in parentheses.
Correlation Between Histopathologic and Metabonomic Changes
The concept of metabolic trajectories was introduced to study the onset and recovery, as well as magnitude of effect in toxicity studies.1,23,27 Fig. 9 shows the PC1 versus PC3 trajectory of each individual animal as the endogenous metabolite patterns change with time. Interestingly, even though the time course and scale vary, the shape of the trajectories from each of the individual high-dose animals is strikingly similar, suggesting a similar biochemical process. Exceptions are the two animals, No. 27 and No. 29, with no clinical chemical or histopathologic changes. In contrast, even though the shape of the trajectories is similar, the scale of the trajectories is quite different. The magnitude of changes at different times was plotted to simplify the interpretation (Fig. 10). Among the animals, the magnitude at 24 hours pd varies about 17-fold, and at 48 hours it varies about 5.2-fold. The magnitude of effects varies more among individual animals at 24 hours than at 48 hours.
There is a positive correlation between the nature and severity of the individual histopathologic lesions and the individual animals’ trajectories of metabonomic changes with time. When the animals sacrificed at 48 hours pd are compared, rat No. 21 has marked centrilobular necrosis and congestion, without evidence of regeneration (Figs. 1 and 10). The magnitude of global metabolic change compared to the predose spectrum is 94 at 48 hours. In contrast, in rat No. 22, necrosis is severe and bridges from one centrilobular area to another, and in some areas, spares only small, isolated periportal areas, also without evidence of regeneration (Fig. 2). The magnitude of metabolic change is 113. Similarly, necrosis is severe and bridging in rat No. 25 at 48 hours and the magnitude of change is 113. Rat No. 28 died 24 hours pd. This rat had a very high magnitude of metabolic change (220) at 24 hours and the most severe hepatic necrosis. Magnitude analysis of the metabonomic data also reveals for rat No. 21 that in addition to its similarity with animals 22 and 25 at 48 hours, it had a much stronger effect at 24 hours.
In contrast, in rat No. 23, in which there is moderate to marked centrilobular regeneration and neovascularization (Fig. 3), the magnitude at 48 hours is lower, 54.9. Rat No. 24, in which there is much more centrilobular regeneration and neovascularization, along with increased mitotic figures, has an even lower magnitude of 48.7 at 48 hours pd. In both rats Nos. 23 and No. 24, necrosis was only moderate. The differences between these two animals are also reflected in the clinical chemistry data: ALT, AST, ALP were 255, 464, and 754 IU/L for rat No. 24 and 826, 2273, and 781 IU/L in rat No. 23. This is in contrast to the values for rat No. 25, which were much higher: 1867, 4895, and 1000 IU/L. Rat No. 28 died before the 24-hour serum sample could be obtained.
In the rats sacrificed at 7 days pd with evidence of clinical chemical lesions, there was nearly complete resolution of the hepatic lesions. In these animals, the magnitude of changes in the urine continued to decrease from 24 to 168 hours. The magnitude of the urinary metabonomic effect in rat No. 30 over the whole time course is much larger (Fig. 10), and this is reflected in the histopathologic findings. Fibrosis was moderate in rat 30 at 168 hours as compared to the minimal effect in rat No. 26. This suggests more robust repair after a stronger lesion at an earlier time.
The additional biochemical finding of urocanic acid excretion into the urine roughly correlates with the severity of hepatic necrosis. Rats Nos. 22 and 25, which had the most severe hepatic necrosis, had strong urocanic acid elevation at 48 hours (Table 3). Rat No. 21, which had marked hepatic necrosis, had medium urocanic elevation; Rats Nos. 23 and 24, which had moderate hepatic necrosis, had weak and very weak urocanic acid elevation, respectively. Rat No. 30, which was sacrificed at 168 hours, also had strong urocanic acid elevation at 48 hours. Of the rats sacrificed at 168 hours, Rat No. 30 had the most hepatic fibrosis. Rat No. 28, which died 24 hours after dosing and had the most severe necrosis, had only medium elevation of urocanic acid, but since the time of maximal urocanic acid elevation was 48 hours for the other rats, it is possible that urocanic acid would have gone up further with time. The two rats without histopathologic lesions (Nos. 27 and 29) had no elevation in urinary urocanic acid. N-acetyl tyrosine gave a similarly time-dependent excretion pattern to the one for urocanic acid (Fig. 13).
The excretion of bile acids into the urine did not show a clear correlation with the histopathological grades. Rat No. 28, which died 24 hours after dosing due to the most severe effects, had only a very weak urinary bile acid excretion. Similarly, rat No. 21, which showed a major metabonomic effect at 24 hours, had only weak bile acid excretion. However, these endogenous metabolites were only found in the urine of those animals in which there were histopathologic lesions. Rats Nos. 27 and 29 did not show any histopathological lesion or metabonomic effect and also did not reveal any signs of bile excretion.
The only possible signs of renal toxicity as described by metabonomics were an increase in lactate and in some cases (rat No. 21 and rat No. 23) a slight increase in alanine. An increase in alanine and lactate has been observed in other studies after treatment with different S3 proximal tubular nephrotoxins or with the renal papillary toxin 2-bromoethanamine (BEA).23,44 In those studies, however, the increases were always accompanied by more complex excretion patterns, such as an additional increase in urinary glucose seen in BEA toxicity, or an increase in a further set of different amino acids and osmolytes in the case of proximal tubular toxicity.19,23,39,44 The difference between the metabonomic changes in the present study (lactate and alanine) and the classic nephrotoxins studied previously may be because the injury in this study was glomerular rather than tubular. Metabonomic changes suggestive of renal inflammation were not identified in rat No. 23, which had acute, moderate, multifocal, suppurative glomerulonephritis with bacteria.
Discussion
Metabonomics is increasingly a more widely used tool in toxicology.37,41 Necessarily, efforts have been underway to validate the technology analytically by demonstrating reproducible results among split samples run at different sites and biologically by correlating metabonomics results with pathologic changes for a wide range of toxins. 33 This study extends these efforts further by showing that the metabonomics results correlate with the pathologic changes on an individual animal level, thus further establishing the validity of metabonomics, at least for certain categories of disease processes. Here, we show that despite the similar pattern of individual animal metabolic trajectory, the scale differed considerably among individual animals. Changes in scale correlated well with severity of necrosis, onset of regenerative change, and the completeness of the reparative process. Furthermore, metabonomics proved useful in the identification of the time point of maximum effect, information that can be important in toxicology studies to choose the best times for histopathology and clinical chemistry sampling.
Seven out of 10 of the animals treated with the high dose of microcystin-LR had similarly shaped metabolic trajectory patterns. One of the animals died 24 hours pd. Its initial biochemical changes were similar to the other 7 animals during the time urine was collected. Two of the 10 animals did not show any metabolic changes. Exactly consistent with that result, these 2 animals did not have any abnormalities in urinalysis, clinical chemistry, or histopathology, suggesting that they may not have been exposed to microcystin-LR, perhaps due to inadvertent misdosing. Pharmacokinetic analyses to determine exposure of microcystin-LR were not done.
It was the intention of this study to use a nonlethal dose of microcystin-LR to induce centrilobular hepatic lesions but not the multitude of changes that are sometimes seen in moribund animals. The doses were selected based on literature studies and by preliminary dose rangefinder studies in our laboratory.4,40 Histopathologic changes were similar to those reported in the literature, centrilobular to massive hepatic necrosis.20,21,25,52
Metabonomic analysis showed clearly that the magnitude of effects across the animals after microcystin-LR application was strongest at 24 hours post dose. This magnitude is the result of the overlapping toxic effect and the induced detoxification and tissue repair. Both effects could be seen in the histopathological examination of the liver tissue and also in the metabonomic urinalysis. An initial metabonomic change along PC1 up to 24 hours post dose was followed by an effect in PC3 scores, before animals slowly recovered. Along PC1 the toxic effect was largely reflected in a decrease in tricarboxylic acid (TCA) cycle intermediates such as citrate, 2-oxoglutarate, succinate, and hippurate. Additionally, betaine and taurine increased. Increased taurine has been observed in several liver toxicities such as those induced by galactosamine, butylated hydroxytoluene, allyl formate, or ethionine treatment.3,43,51 Taurine is discussed as having cytoprotective properties.8,36,47 It is used as one of two currently known defense mechanisms that use cysteine as an educt; here, taurine is synthesized from the substrate cysteine instead of being shuttled into glutathione production. 8 Another interesting feature is the increase of betaine concentration up to 24 hours post dose. It is produced in the choline oxidation pathway, and it could be speculated that its increase is also due to the formation and reactivity of reactive oxygen species (ROS).26,30 A strong betaine increase was found in a study after treatment with galactosamine, a drug causing hepatocellular necrosis, but not in studies of other hepatocellular necrosis-inducing toxins. 3 In the current study, an increase in creatine is notable from 24 to 48 hours post dose. Creatine was hypothesized to be produced in the replenishment of cysteine. 8 Cysteine is then further used for synthesis of protein, glutathione, and taurine. 8 Therefore, we can assume that the increase in creatine is a further sign of ongoing repair. Increased creatine concentration has been noted as an effect of several liver toxins.3,8 Recently, the changes in 1-carbon metabolites guanidinoacetate, creatine, betaine, and dimethylglycine were discussed in a model of tissue regeneration. 5 In that study, partial hepatectomy was performed and metabolites were monitored over the course of 168 hours post treatment. A time-dependent shift in metabolite increase from guanidinoacetate to creatine and from betaine to dimethylglycine was observed. 5 Similar changes were observed in our study after microcystin-LR treatment, which could support the interpretation that these markers highlight the onset of tissue repair.
Especially at the earlier time points we noted reductions in succinate, citrate, and 2-oxoglutarate. Reductions in TCA cycle intermediates are believed to be nonspecific biochemical changes, due in part to an elevated energy demand and/or a reduced food intake, rather than relating to tissue-specific toxicity. 5 In rats that were food restricted, citrate and 2-oxoglutarate were depleted after 24 hours of 50%, 75%, and 100% food depletion (unpublished data). However, previous studies of hydrazine toxicity in pair-fed male rats where animals were weight matched resulted in alterations in the levels of citrate, 2-oxoglutarate, hippurate, and creatinine in control rats where food had been restricted, 10 indicating that the changes in these metabolites are not due exclusively to food restriction.
Urinalysis using NMR spectroscopy identified further effects that were not immediately deducible from histopathological analysis. One is the excretion of urocanic acid, which correlated with the severity of hepatic necrosis. It is an intermediate in the catabolism of histidine to glutamate, and this suggests an inhibition at the level of urocanic acid hydratase or an increase in histidine ammonia-lyase.3,7 Increased urinary urocanic acid was also reported in AHNAK knockout mice, where it may be associated with altered fat metabolism and increased histidine. 29 The other effect is the excretion of bile acids in the urine samples. A reason for this could be inhibition of the reuptake of bile acids in the liver or damage to the canalicular system. Although no morphologic changes were seen in the biliary epithelium, it is possible that microcystin-LR, which induces actin disassembly in hepatocytes,35,42,48,53 induces a lower amount of actin disassembly in biliary epithelial cells and perhaps functional impairment of the canalicular system. Alternatively or concurrently, there may be inhibition of the reuptake of bile acids from the portal blood, leading to a disruption of the enterohepatic recirculation and an escape into the systemic circulation. Microcystin is transported into hepatocytes by the bile acid transporter Oatp1b2, 17 and it is possible that the transporter was saturated. This is unlikely, since timing of the increase in bile acids was often later (Table 3). It is also possible that the Oatp1b2-expressing cells were selectively killed, thus inhibiting hepatic uptake of bile acids. The severity of the toxic effects as seen in this study did not clearly correlate with the amount of excretion of bile acids, but nonetheless, bile acids were excreted in the urine of every animal that showed a toxic histopathologic lesion. The identified urinary metabonomic changes in this study, namely, betainuria, bile acid excretion, urocanic acid excretion, and metabolites, which are involved in the conversion of histidine to glutamate, show strong similarities to the effects found after treatment with galactosamine, 3 although the common mechanisms of microcystin-LR and galactosamine injury are not clear. Gene expression changes suggestive of urocanic acid elevation have also been reported in Kupffer cells and hepatocytes in the partial hepatectomy model. 7
The application of metabonomic urinalysis proved to be a valuable tool in the monitoring of the study course after microcystin-LR treatment. Changes in the excretion of endogenous metabolites could be identified in urine and the magnitude of effect correlated with the nature and severity of the histopathologic findings. Metabonomic analysis also identified further metabolites, providing additional information for the understanding of microcystin-LR toxicity. In future, metabonomics will help as a complementary tool in the guidance, prediction, and description of histopathologic examinations in drug toxicity studies.
Footnotes
Author's note
This work was performed as part of the Consortium for Metabonomic Toxicology (COMET). G. H. Cantor and O. Beckonert contributed equally.
Declaration of Conflicting Interests
The authors declared no potential conflicts of interest with respect to the research, authorship, and/or publication of this article.
Funding
The author(s) disclosed receipt of the following financial support for the research, authorship, and/or publication of this article: We acknowledge scientific and financial assistance from Pharmacia, Pfizer, Hoffman-La Roche, Bristol-Myers Squibb, Eli Lilly & Co., and Novo Nordisk to the COMET project.