
Abstract
Microcystin poisoning was diagnosed in a dog exposed to a Microcystis aeruginosa–dominated, freshwater, harmful algal bloom at Milford Lake, Kansas, which occurred during the summer of 2011. Lake water microcystin concentrations were determined at intervals during the summer, using competitive enzyme-linked immunosorbent assays, and indicated extremely high, localized microcystin concentrations of up to 126,000 ng/ml. Multiple extraction and analysis techniques were used in the determination of free and total microcystins in vomitus and liver samples from the poisoned dog. Vomitus and liver contained microcystins, as determined by enzyme-linked immunosorbent assays, and the presence of microcystin-LR was confirmed in vomitus and liver samples using liquid chromatography coupled with tandem mass spectrometry. Major toxic effects in a dog presented for treatment on the day following exposure included fulminant liver failure and coagulopathy. The patient deteriorated rapidly despite aggressive treatment and was euthanized. Postmortem lesions included diffuse, acute, massive hepatic necrosis and hemorrhage, as well as acute necrosis of the renal tubular epithelium. A diagnosis of microcystin poisoning was based on the demonstration of M. aeruginosa and microcystin-LR in the lake water, as well as in vomitus produced early in the course of the poisoning; the presence of microcystin-LR in liver tissue; and a typical clinical course including gastroenteritis and fulminant liver failure.
Introduction
Cyanobacteria are among the most ancient organisms and have adapted to a wide range of marine and terrestrial habitats.1,10 Aquatic cyanobacteria, also known as blue-green algae, are important primary producers in aquatic ecosystems. 17 Such bacteria assimilate organic nutrients, inorganic nutrients, carbon dioxide, and light to produce biomass through oxygenic photosynthesis. 23 Cyanobacteria are present in most aquatic ecosystems, but algal blooms occur when physical-chemical conditions allow rapid growth and reproduction, and populations are not effectively constrained by predation. 19
Hazardous blooms are often referred to as harmful algal blooms or freshwater harmful algal blooms (FHABs) when they occur in freshwaters. 14 Several species of cyanobacteria produce toxins. Microcystins, produced by Planktothrix spp. (Oscillatoria spp.), Microcystis spp., Coelosphaerium spp., and Anabaena spp., are the most commonly found cyanobacterial toxins in FHABs in the Midwestern United States. 11 Microcystins are a family of cyclic heptapeptides, which are potent inhibitors of the serine threonine family of protein phosphatases. 25 Microcystin production and, consequently, poisoning risks during an FHAB are dependent on the bacterial strains involved in the FHAB. 6
Freshwater harmful algal blooms are increasing across the world, and it raises growing concerns about impacts on water use for recreation and commerce, potable water availability, and human and animal disease. 14 The costs incurred due to direct losses and control measures are high. In the United States, for example, the annual costs range between U.S.$2.2 and $4.4 billion. 8 The general public is often ignorant of the occurrence of FHABs or is unaware of the severity of the associated health risks. Continued use of public waters for recreation during FHABs potentially leads to poisoning, such as in the case described herein of acute microcystin poisoning in a dog following ingestion of lake water during an algal bloom containing Microcystis aeruginosa cyanobacteria. Ingestion of an acutely toxic dose of microcystins by dogs typically results in fulminant liver failure.7,21
A 6-year-old, intact female Briard dog, weighing 35.5 kg, was presented to the Veterinary Medical Teaching Hospital (VMTH) at Kansas State University at 12:30
Whole blood and serum samples were submitted to the KSVDL for routine blood cell counts and blood chemistry panels (Table 1). Blood cell counts revealed a mild lymphopenia. The hematocrit, erythrocyte concentration, and hemoglobin concentration were high. The blood plasma was icteric. The prothrombin time and activated partial thromboplastin time were markedly increased. The blood chemistry panel revealed a moderately low blood glucose concentration, mildly elevated creatinine, elevated phosphorus, low bicarbonate, an increased calculated anion gap, markedly elevated alanine transaminase, elevated alkaline phosphatase, elevated creatine kinase, and elevated total bilirubin.
Blood cell counts and blood chemistry from a dog that was exposed to a lethal dose of microcystins, upon presentation for treatment on the day following exposure.*
Numbers in parentheses are reference ranges.
An intravenous catheter was placed, and approximately 400 ml of sodium chloride 0.9% was given as a bolus. Also, given the hypoglycemia, 30 ml of 50% dextrose mixed with 30 ml of saline were bolused upon presentation. Serum glucose increased to 268 mg/dl, hematocrit decreased to 55%, and total solids decreased to 5 g/dl. Following the bolus, intravenous fluid therapy was continued, at twice the maintenance rate (5 ml/kg/hr), using sodium chloride 0.9% supplemented with 2.5% dextrose. Vitamin K1 was administered subcutaneously, at a dose of 5 mg/kg, and 2 ml of vitamin B complex a was added to the first bag of saline. Two hours later, the rate was decreased to maintenance, and a fresh frozen plasma (FFP) transfusion was started after placing a second intravenous catheter. A total of 520 ml FFP (approximately 15 ml/kg) was given over 4 hr, by slowly increasing the rate of administration. At the end of the transfusion, crystalloids were switched from saline to Normosol-R b (supplemented with 15 mEq KCl and 2.5% dextrose), and the rate was increased back to 2 times maintenance. N-acetyl cysteine was administered intravenously at a dose of 140 mg/kg. Intermittent, hemorrhagic diarrhea and intermittent vomiting producing blood-tinged vomitus continued. Dolasetron, a serotonin 5-HT3 receptor antagonist with both central and peripheral antiemetic properties, 18 was administered intravenously at a dose of 0.6 mg/kg to control vomiting.
After 6 hr of fluid therapy, less than 10 ml of urine had been produced. A urinary catheter was placed at 7 hr after presentation, and 120 ml of dark urine was drawn off. A small sample was submitted for complete urinalysis. Urine was dark-yellow and cloudy. Urinalysis showed a specific gravity of 1.027, urine pH of 8.5, 2+ bilirubin with a positive ictotest, 3+ heme, and 3+ protein (>100 mg/dl according to sulfosalicylic acid test). Microscopic examination of the urine sediment revealed 10–50 erythrocytes per high-power field, a few large round epithelial cells, and many amorphous crystals. Intermittent diarrhea and vomiting continued, and another antiemetic (maropitant) was administered subcutaneously at a dose of 1 mg/kg. At 9 hr after presentation, the temperature was 38.3°C, the pulse rate was 124 beats/min, and the respiratory rate was 40 breaths/min. The mucous membranes were slightly icteric, and the capillary refill time was less than 2 sec. The packed cell volume had decreased to 43%, and the blood glucose concentration was at 128 mg/dl. A second dose of N-acetyl cysteine was administered at 70 mg/kg intravenously.
At 11 hr after presentation and 4 hr after placing the urinary catheter, no additional urine had been produced. A brief ultrasound of the caudal abdomen showed a small urinary bladder and a patent urinary catheter, indicating that the patient had been anuric. The rate of fluid administration had been decreased to maintenance, and a second transfusion of FFP was started. Despite the intensive care, the patient’s depressive state continued to deepen. The patient was euthanized at 2:00
Materials and methods
Tissue sampling
A necropsy was performed, and tissue samples (liver, kidney, spleen, lung, myocardium, the mesentery, uterus, stomach and intestines, bladder, skeletal muscle, tonsils, salivary glands, and brain) were fixed in 10% neutral buffered formalin. Tissue sections were processed routinely, embedded in paraffin, and stained with hematoxylin and eosin. The kidney sections were stained by the periodic acid–Schiff (PAS) method, using a hematoxylin counterstain. Samples for toxin analysis, including a fresh liver sample for toxin analysis and an early vomitus sample collected by the dog’s owner, were frozen at −20°C.
Vomitus microscopy
Microscopy was conducted on an unstained, early vomitus sample, using a stereo microscope, c by placing drops of vomitus on a glass slide and covering them with a cover slip. A magnification range from 23× to 184× was used to locate and identify colonies. Illuminating the sample from above assisted in locating colonies under lower magnifications because of their greenish coloration. Higher magnifications were then used for identification.
Bloom characterization
Weekly water samples, from July 18, 2011, to October 10, 2011, were collected from Milford Lake and analyzed for cyanobacteria content according to Standard Method 10200F 4 at 5 constant locations, including Curtis Creek dock (39°05′23″N; 96°57′30″W), Milford Lake State Park beach (39°05′ 40″N; 96°54′16″W), Milford swimming beach (39°10′09″N; 96°54′52″W), Timber Creek ramp (39°12′39″N; 96°58′21″W), and Wakefield beach (39°12′41″N; 97°00′19″W). The water samples were also analyzed for total microcystins using a competitive enzyme-linked immunosorbent assay (ELISA) kit d in duplicate with appropriate dilutions to bring the concentration within the working range of the standard curve. To induce cell lyses and release of toxins into the water prior to analysis, samples were cooled to −30°C overnight and thawed the next day. Microscopy was used to verify that cells were successfully lysed. The 2 water samples collected at the northern end of the lake, on September 12, 2011, and September 20, 2011, in the area of the major inflow into the lake from the Republican River were prepared using 3 freeze–thaw cycles and analyzed by ELISA e with appropriate dilutions to fall within range of the standard curve.
Toxin characterization in vomitus and liver
Free microcystins
One milliliter of vomitus was dispensed into a glass tube and extracted with 10 ml of 75% methanol in 0.1 M acetic acid. A duplicate spiked sample (1 ml) was also prepared by adding 1 µg of microcystin-LR standard to 1 ml of vomitus prior to extraction. Samples were sonicated in a water bath for 30 min to ensure homogenization followed by centrifugation at 1,500 × g for 10 min. The supernatant of the sample and respective spike were collected, and extraction of the pellet was repeated 2 additional times with the acidified methanol solution. The supernatants were pooled and blown to dryness with nitrogen gas at 60°C. Samples were reconstituted in deionized water (18 MΩ/cm), and solid phase extraction (SPE) f was used to clean the sample matrix. The SPE cartridges were conditioned with 100% methanol, equilibrated with 100% deionized water, loaded, washed with 5% methanol, and eluted with 2% formic acid solution in methanol. The elution fraction was blown to dryness and reconstituted in deionized water for analysis. The final extract was analyzed with an indirect competitive ELISA e in duplicate with appropriate dilutions to bring the concentration within the working range of the standard curve.
The liver sample was frozen and lyophilized to dryness at −50°C. g A coffee grinder was used to homogenize the sample to a fine-powdered material. One hundred milligrams of sample was weighed out, with a duplicate spiked sample also prepared (0.1 µg microcystin-LR added to 0.1 g dried sample). Five milliliters of 75% methanol solution in 0.1 M acetic acid was used for the extraction. Samples were sonicated for 30 min in a sonicating bath and centrifuged for 10 min at 1,500 × g. The supernatants were removed, and extraction was repeated on the pellets 2 additional times. The pooled supernatants were blown to dryness and reconstituted in 3 ml of deionized water for subsequent SPE d in the same manner as the vomitus sample. The eluate was blown to dryness and reconstituted in deionized water. The reconstituted eluate was further diluted to bring the concentration within range of the ELISA e standard curve and allow for quantitation within the standard curve model inference range. The spiked sample was analyzed at a concentration of 0.001 g sample/ml solution. The assay was sensitive down to a limit of quantification (LOQ)/limit of detection (LOD) of 0.15 ng/ml for the vomitus sample and 150 ng/g for the liver sample as determined from spike recoveries, dilution factors, and kit sensitivity (0.15 µg/l).
Confirmation of microcystin presence was conducted using liquid chromatography coupled with mass spectrometry (LC-MS) h and tandem mass spectrometry (LC-MS/MS). h A flow rate of 200 µl/min and 2 mobile phases were used. Solvent A consisted of 100% deionized water with 3.6 mM formic acid and 2 mM ammonium formate, and solvent B consisted of 95% (v/v) acetonitrile with 3.6 mM formic acid and 2 mM ammonium formate. Separation was achieved with a Synergi 4-µm Hydro-RP (150 × 2.0 mm) column. i Single-ion monitoring was conducted using the [M+H]+ ions for microcystin-LA (m/z 910.5), microcystin-LR (m/z 995.5), microcystin-RR (m/z 519.5), microcystin-YR (m/z 1045.6), and desmethyl microcystin-LR (m/z 981.5). The LOD and LOQ for each variant were 25 ng/ml and 50 ng/ml, respectively. Selected reaction monitoring was also used for the quantification of microcystin-LR. The [M+H]+ ion for microcystin-LR (m/z 995.5) was fragmented and the major product ions (m/z 599.5 and 553.4) monitored. The microcystin-LR retention time was 15 min. This methodology established an LOD of 10 ng/ml vomitus (10 ng/g liver) and a LOQ of 20 ng/ml vomitus (20 ng/g liver) for microcystin-LR.
Total microcystins
The MMPB (2-methyl-3-(methoxy)-4-phenylbutyric acid) method was used for the determination of total microcystin by analyzing the chemically cleaved Adda (3-amino-9-methoxy-2,6,8-trimethyl-10-phenyldeca-4,6-dienoic acid) group, a common chemical structure in all microcystin variants. 22 The Lemieux oxidation technique for MMPB formation was modified from a previous study, 22 and an extraction method was developed and applied to the vomitus and liver tissue. Theoretically, the MMPB technique can be used to measure both bound and unbound fractions of microcystin. Calculations for MMPB determinations are made based on a 1:1 molar ratio of MMPB formation from microcystins. Since the range of molecular weights of many microcystins is small (910–1,070 g/mol), an estimated calculation can be made by applying a 1,000-g/mol qualifier for all microcystin variants. The molecular weight of MMPB is 208 g/mol; therefore, the theoretical MMPB formation is 0.208 g for every 1 g of microcystin oxidized.
One milliliter of vomitus was dispensed into a glass tube with a duplicate spiked sample prepared with 10 µg of microcystin-LR standard. Samples were oxidized at a pH of 9 with a 5-ml solution of 0.01 M KMnO4 and 0.05 M NaIO4 in 0.2 M KHCO3. Solutions were allowed to react at room temperature for 2.5 hr in the dark. Reactions were finalized with the drop-wise addition of 40% NaHSO3. The samples were then adjusted to a pH <2, with the addition of 10% H2SO4. Liquid-liquid extraction with ethyl acetate was used to extract MMPB from excess reagents. Ten milliliters of ethyl acetate was added, and samples were centrifuged at 20,000 × g for 25 min at 5°C. The organic layer was removed, and extraction on the aqueous layer was repeated with 5 additional ml. The pooled organic (ethyl acetate) layer was blown to dryness with nitrogen gas at 30°C and reconstituted in 5% methanol for SPE. The SPE cartridges were conditioned with 100% methanol, equilibrated with 100% deionized water, loaded, washed with 5% methanol, and eluted with 2% formic acid solution in methanol. The SPE eluate was blown to dryness and reconstituted in 1 ml of 5% methanol. One hundred milligrams of homogenized dried liver sample was weighed out, with a duplicate spiked sample also prepared (1 µg microcystin-LR added to 0.1 g dried sample). Oxidation, liquid-liquid extraction, and SPE were conducted in the same manner as the vomitus sample. The final solution was analyzed at a concentration of 1 g/ml (1:1) with LC-MS/MS.
A polar reverse-phase column h was used for chromatographic separation. The same LC-MS system and mobile phases used in microcystin analysis were used for MMPB analysis. The [M-H]− ion for MMPB (m/z 207) was fragmented and the product ion (m/z 131) monitored. The retention time was 7 min. The established detection limit for this methodology is 10,000 ng/ml (microcystins) or 2,000 ng/ml (MMPB) for the vomitus sample and 10,000 ng/g (microcystins) or 2,000 ng/g (MMPB) for the liver sample.
Results
Pathology
At necropsy, the carcass was mildly icteric. The liver was dark red and congested but otherwise grossly normal. The stomach was filled with reddish-brown fluid. There were extensive hemorrhages on the serosa of the stomach and intestines, but the mucosa of the gastrointestinal tract appeared normal. There was extensive hemorrhage in the mesentery surrounding the pancreas, uterine mucosa, mediastinum, diaphragm, myocardium, and pericardial sac. There was a 2-cm spherical mass in the spleen that oozed blood from the cut surface. The lungs were congested but otherwise grossly normal. There were no gross abnormalities in the pancreas, adrenal glands, thyroid glands, parathyroid glands, urinary tract, or brain.
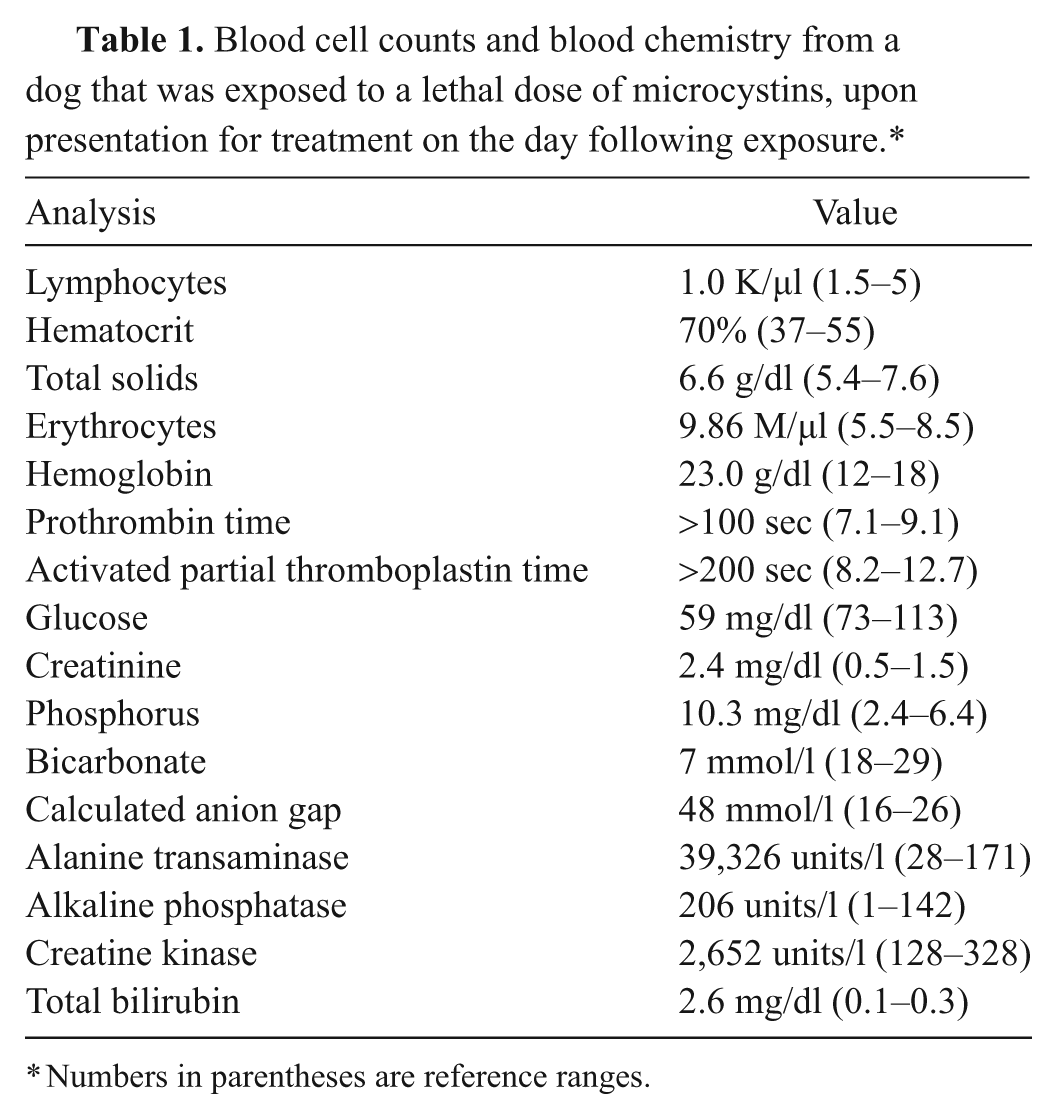
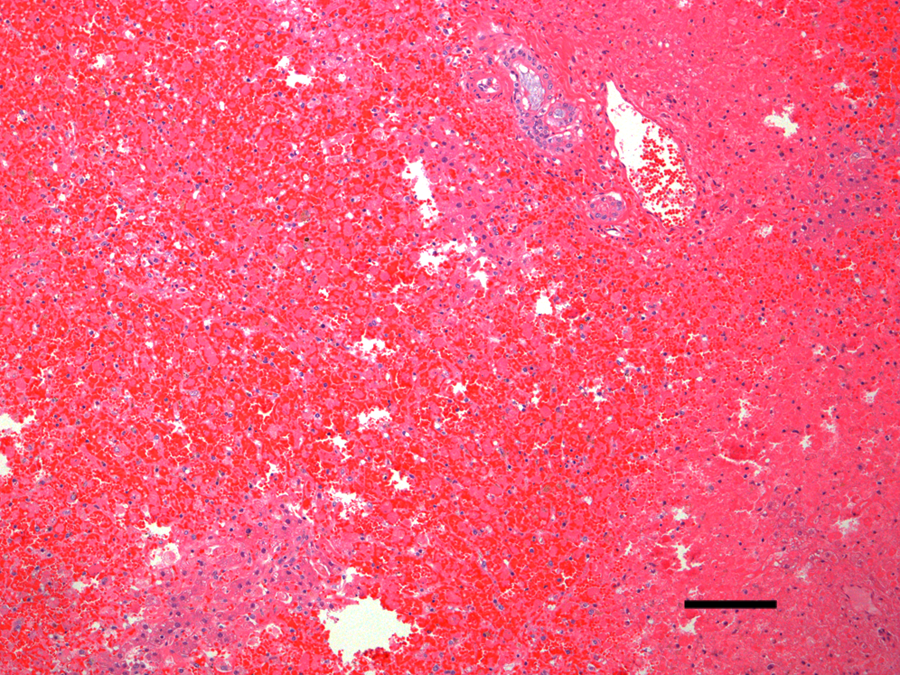
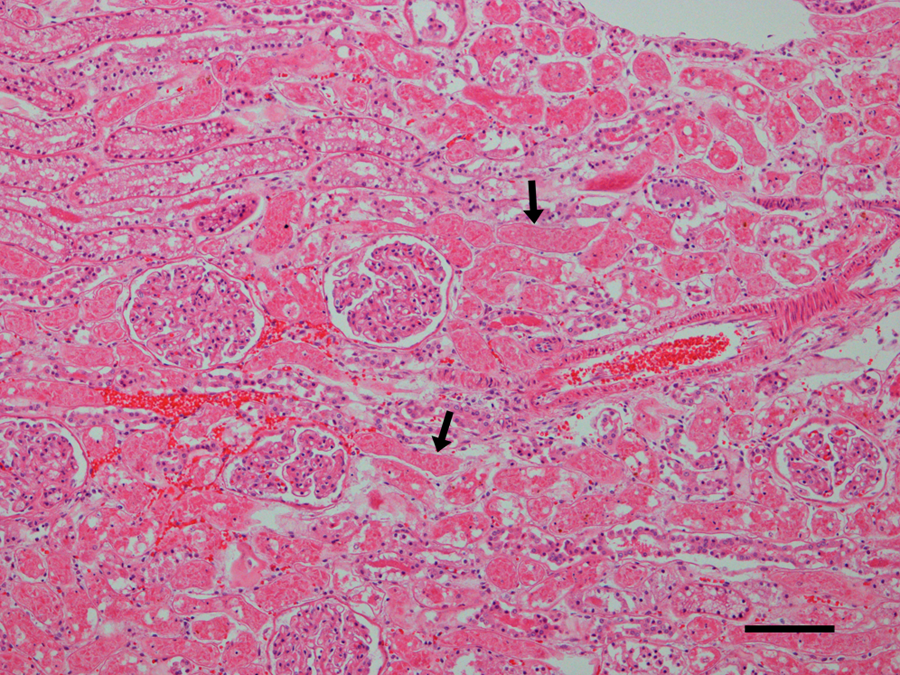
Microscopic examination revealed diffuse, acute, massive hepatic necrosis and hemorrhage. In most lobules, there was a complete loss of viable hepatocytes, or the only remaining viable hepatocytes consisted of small groups or thin layers 1–2 cells thick adjacent to portal tracts (Fig. 1). Throughout the renal cortex were large coalescing areas where the tubular epithelium was brightly eosinophilic, there was loss of individual cell detail, and nuclei were absent or karyorrhectic, which was interpreted as acute coagulative necrosis (Fig. 2). Interspersed between the necrotic tubules were glomeruli and groups of tubules in which the cells were intact and appeared to be viable. There were groups of tubules lined by highly vacuolated cuboidal epithelium and individual tubules lined by shorter, more eosinophilic cuboidal cells that were not vacuolated (Fig. 3). The vacuolated epithelium possessed a PAS-positive brush border, which identified the tubules as proximal convoluted tubules. The shorter, more eosinophilic cells lacked a brush border consistent with distal convoluted tubules. Occasional distal convoluted tubules contained casts of necrotic epithelial cells (Fig. 3). Similar epithelial casts were present in larger numbers in the collecting ducts in the medulla (not shown). The spherical nodule in the spleen was a hematoma. There was diffuse, acute, pulmonary edema. Acute, multifocal hemorrhages were present in the myocardium, mesentery, uterine mucosa, and serosa of the stomach and intestines. No significant microscopic lesions were found in the bladder, skeletal muscle, tonsils, salivary glands, or brain. Microscopic examination of the vomitus obtained from the second vomiting event, collected by the owner during the evening following the dog’s exposure to the lake water, demonstrated multiple M. aeruginosa colonies (Fig. 4).
Dog. Liver in which there is acute, diffuse necrosis and hemorrhage with almost complete loss of hepatocytes. Hematoxy-lin and eosin. Bar = 100 µm.
Dog. Photomicrograph of kidney with multiple groups of acutely necrotic tubules in which the epithelium is brightly eosinophilic and individual cells have lost their nuclei or the nuclei are karyorrhectic (arrows). Note that adjacent to necrotic tubules are tubules with intact epithelium with viable appearing nuclei and that glomeruli are normal and that erythrocytes are still intact and individualized. Hematoxylin and eosin. Bar = 100 µm.
Dog. Photomicrograph of kidney with acutely necrotic tubules in the upper one-third of the photograph. Note the intact, vacuolated proximal convoluted tubular epithelium (arrows) and the intact distal convoluted tubule (arrowhead) that contains a group of sloughed, necrotic epithelial cells. Hematoxylin and eosin. Bar = 25 µm.
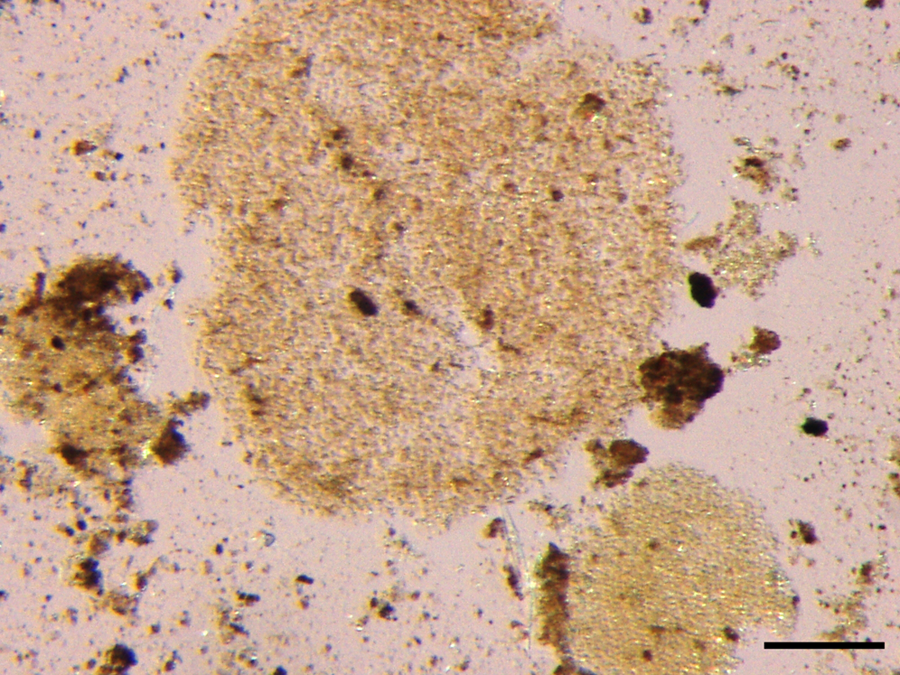
Spherical Microcystis aeruginosa colonies forming roughly circular mats of closely packed individual organisms in vomitus from a dog that ingested lake water during an algal bloom. Unstained. Bar = 100 µm.
Cell counts and microcystin concentrations
Cyanobacteria were identified to the lowest practical taxonomic level based on morphology and toxicological relevance, which was the genus level because morphological characteristics at this taxonomic level are relatively unambiguous, and toxin production potential below the genus level is strain dependent.12,17 The cyanobacterial communities were dominated by M. aeruginosa, whereas lower numbers of Aphanizomenon spp. and Anabaena spp. were present in most samples. The cell counts for M. aeruginosa are summarized in Figure 5. Samples of chalk-green algal scum, which formed continuous, floating mats along some areas of the shoreline at Milford Lake State Park, consisted of 100% M. aeruginosa cells by volume.
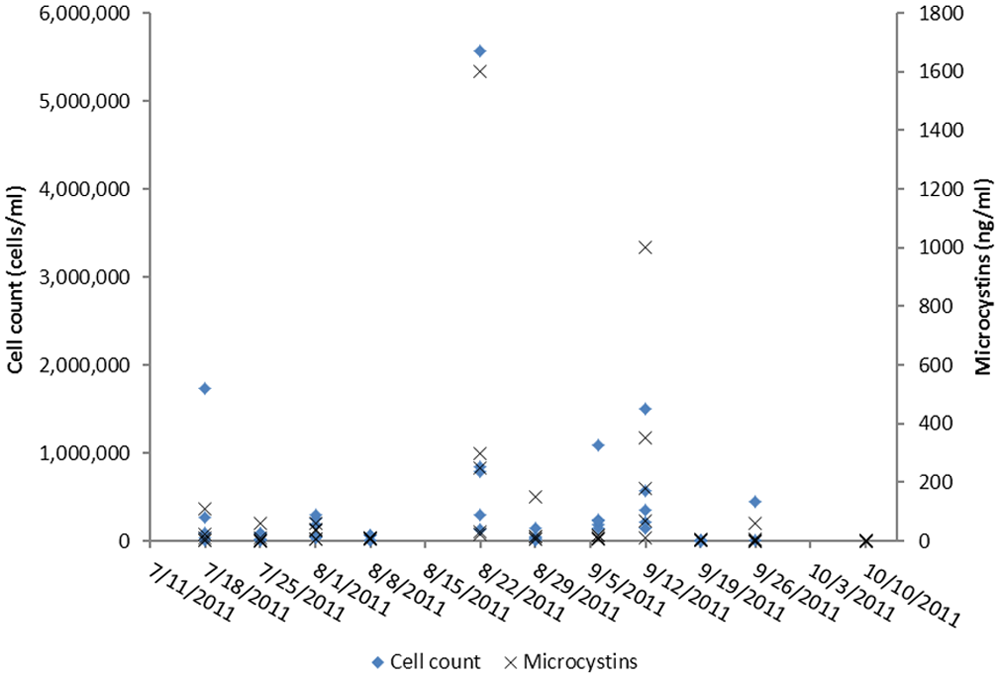
Microcystis spp. cell counts and microcystin concentrations in water samples from Milford Lake, Kansas, during the summer of 2011.
Microcystin concentrations and cell counts were variable between sites and over time. The maximum cell count (5,575,500 cells/ml) and the maximum microcystin concentration (1,600 ng/ml) both occurred at Wakefield beach on August 22, 2011 (Fig. 5). Microcystis aeruginosa cell counts at the site where the dog was exposed were variable and ranged from 61,110 to 787,500 cells/ml. Microcystin concentrations, estimated by ELISA, were also variable and ranged from 0.5 to 250 ng/ml. The last cell counts and microcystin concentrations measured before exposure occurred were on September 19, 2011, and were 8,505 cells/ml and 6 ng/ml, respectively. Microcystin concentration in a water sample collected the day following exposure contained 0.5 ng/ml microcystins.
Linear regression between microcystin concentrations and cell counts, including all data points, resulted in an R2 value of 0.8128 ( y = 0.0003x – 3.085), where y is microcystin concentration (ng/ml), and x is cell count (cells/ml). A Pearson product moment correlation resulted in a correlation coefficient of 0.902 (P < 0.0001). The degree of the correlation was, however, heavily dependent on the high values at Wakefield beach on August 22, 2011. When these peak values were excluded from the analysis, the R2 value of the linear regression declined to 0.4452, and the Pearson product moment correlation resulted in a correlation coefficient of 0.667 (P < 0.0001), indicating that the correlation was weaker at the lower concentrations and cell counts but remained significant. Two water samples collected at the northern end of the lake, on September 12, 2011 and September 20, 2011, in the area of the major inflow into the lake from the Republican River, contained extremely high microcystin-LR concentrations of approximately 28,000 ng/ml and approximately 126,000 ng/ml, respectively.
The results of microcystin analyses in vomitus and liver tissue are summarized in Table 2. Chromatograms of microcystin analyses in liver and vomitus are summarized in Figure 6.
Estimated microcystin concentrations in vomitus and liver samples from a dog that died of microcystin poisoning, analyzed by enzyme-linked immunosorbent assay (ELISA), liquid chromatography coupled with mass spectrometry (LC-MS), and liquid chromatography coupled with tandem mass spectrometry (LC-MS/MS).*
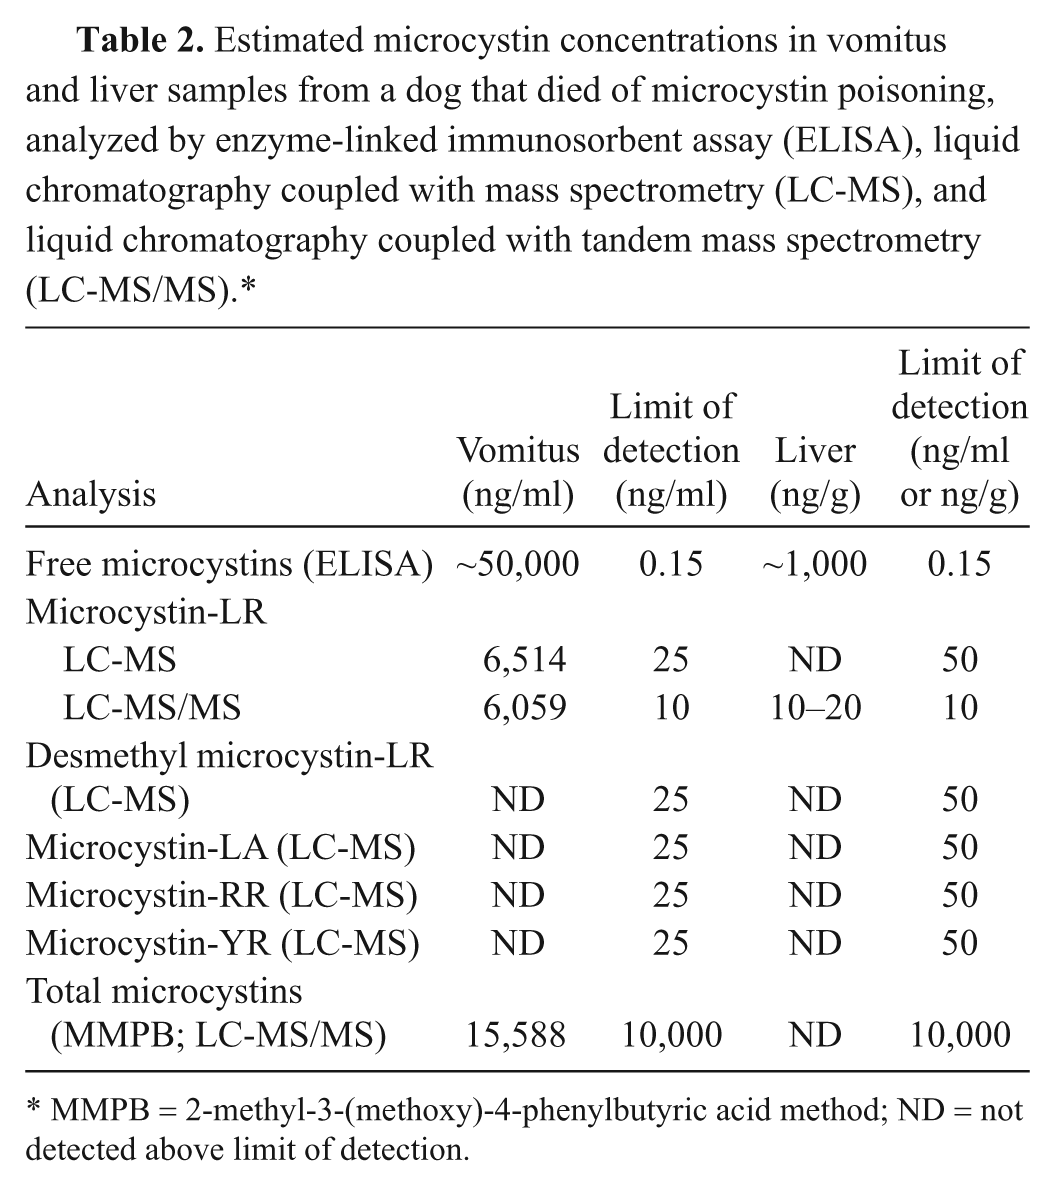
MMPB = 2-methyl-3-(methoxy)-4-phenylbutyric acid method; ND = not detected above limit of detection.
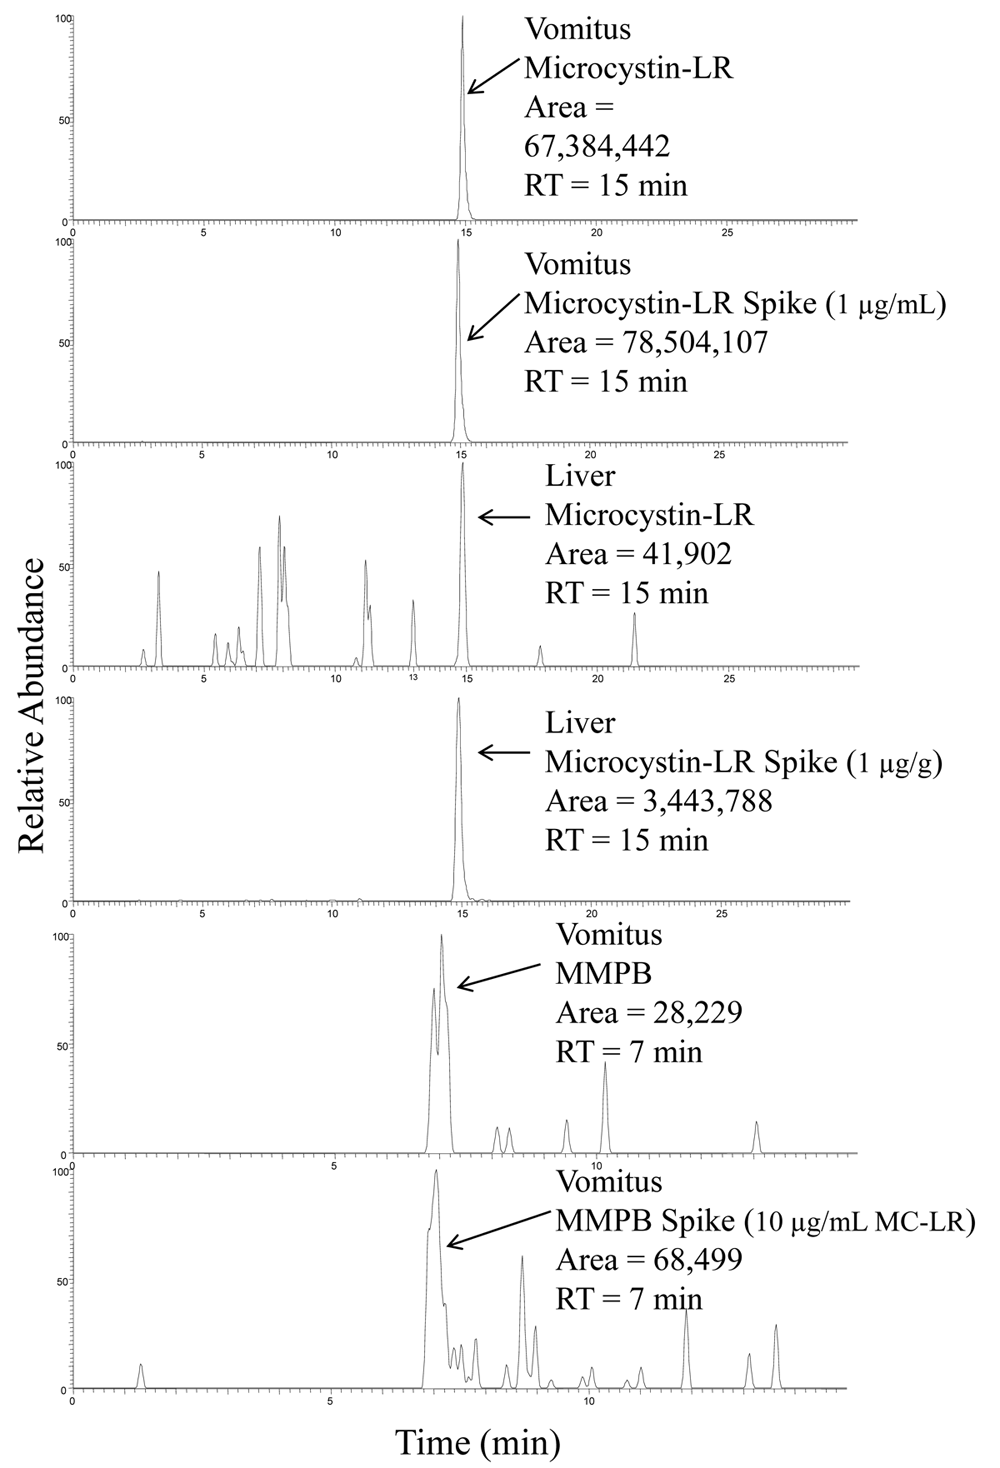
Representative liquid chromatography coupled with tandem mass spectrometry chromatograms of microcystin-LR standards and microcystin-LR in vomitus and liver, as well as an MMPB (2-methyl-3-(methoxy)-4-phenylbutyric acid) standard and MMPB in vomitus. RT = retention time.
Discussion
The occurrence of FHABs remains difficult to predict, and widespread, effective, timely monitoring of freshwaters is difficult to achieve with available resources. The incidence of cyanobacterial blooms is related to environmental factors such as light, temperature, water column stability, lake levels, and water nitrogen and phosphorus loads.11,16,24 The relationships between nutrient availability and toxin production are nonlinear, and current understanding only allows partial prediction of water microcystin concentrations based on nutrient availability.9,11 An inability to accurately predict toxin levels makes effective risk communication more difficult. The problem is further compounded by a lack of understanding of the risks by the general public and by a politically and economically motivated reluctance to close public waters when FHABs occur. This situation often leads to exposure in people and animals when people are unaware of the existence of FHABs, or they are ignorant of the degree of risk associated with water contact during an FHAB. The case described herein is an example of a situation where pet owners made use of a publicly accessible lake with an ongoing FHAB and were apparently unaware of the risks involved. Warnings had been posted at access points to the lake at the time when the exposure occurred, and the FHAB had received an unusually high level of attention in local news media. The poisoned dog’s owners were visitors and unfamiliar with the lake, which may have played a role in their lack of awareness of the risk. Continued public access to lakes during FHABs that produce high levels of toxins inevitably results in continued risks to people and pets despite risk communication strategies employed by state and local authorities. However, closure of public waters is a politically sensitive action that results in economic losses for local businesses, and a complete elimination of risk is therefore not always deemed to be in the public interest.
Multiple extraction and analysis techniques were used in the determination of microcystins in both the vomitus and liver samples. The highest microcystin values were demonstrated using ELISA. This could be due to the congener independent sensitivity of the assay or matrix interactions. The ELISA, although a relatively easy and sensitive tool, has limited applicability for matrices other than water. Biological matrices may interfere with ELISA and can lead to erroneous results and conclusions if interferences are not recognized. It was therefore important to validate positive ELISA values with another analysis technique, such as LC-MS. The LC-MS method for microcystin is very specific but is limited to variants of microcystin with available standards. The presence of free microcystins in the vomitus sample was confirmed using both LC-MS and LC-MS/MS, and the variant microcystin-LR was detected and quantitated. The ELISA data indicated the presence of approximately 1,000 ng/g free microcystins in the liver, and microcystin-LR presence was confirmed using LC-MS/MS.
The MMPB method can reportedly detect all the variants of microcystins equally and has the ability to detect both free and bound microcystins. 22 Microcystins bind reversibly, and irreversibly, to protein/peptide complexes in the body for metabolic uptake and/or depuration. This makes a total microcystin concentration determination difficult because the analyte is not free to react with binding sites in the ELISA kit and does not allow for a direct determination of the compound. MMPB analysis of the vomitus sample resulted in microcystin levels of approximately 16,000 ng/ml. This was higher than the microcystin-LR concentration determination by LC-MS (6,000 ng/ml) but lower than the free microcystin determination by ELISA (50,000 ng/ml). This supports the occurrence of matrix effects on the ELISA and indicates other microcystin variants may be present, but not directly analyzed for, with LC-MS. MMPB was not detected in the liver sample, although it is theorized that the bulk of microcystins present in the liver will be bound. This is most likely due to high detection limits for this analyte (2,000 ng/g MMPB; 10,000 ng/g total microcystins).
The demonstration of M. aeruginosa colonies in vomitus from the second observed vomiting event suggests that collecting early vomitus, or stomach contents collected early during the course of illness, may be helpful in confirming ingestion of cyanobacteria. Microcystin ingestion could also be confirmed by demonstrating the presence of microcystins in vomitus by both ELISA and LC-MS/MS methods. The presence of microcystins in a postmortem liver sample provided evidence that microcystins had distributed to the primary target organ. These findings, together with clinical signs associated with liver failure and gastroenteritis, and associated gross and microscopic postmortem lesions supported a diagnosis of microcystin poisoning.
Variations in wind speed and direction may account, in part, for variations in cell counts and microcystins between locations, and at specific locations over time, observed at Milford Lake in the summer of 2011 (Fig. 5). Buoyant cyanobacteria, such as Microcystis spp., are horizontally transported by wind. 15 Wind direction and velocity therefore influence the distribution of Microcystis spp. in lakes, leading to accumulations of very high densities along downwind shorelines. Taste and odor compounds in algal scums may be attractive to omnivorous scavengers. 5 Mice, for example, have been observed to prefer water containing M. aeruginosa. 20 Such behavior may play a role in the susceptibility of dogs to poisoning by cyanobacterial toxins. 5 The water microcystin concentration from a water sample obtained the day after exposure, from the area where the exposure occurred, was low at 0.5 ng/ml and much lower than the vomitus microcystin concentration (Table 2). However, the M. aeruginosa associated with the FHAB were capable of producing extremely high local microcystin concentrations (up to 126,000 ng/ml). Attraction of the dog to pockets of accumulated algal scums along the shoreline, followed by ingestion of concentrated microcystins, may offer an explanation for the relatively high microcystin concentration detected in the vomitus sample.
In an acute toxicity study, Sprague–Dawley rats were given intraperitoneal doses of microcystin-LR ranging from 20–1,200 µg/kg. 13 Most rats receiving 120–240 µg/kg microcystin died within 2–3 days. Rats that received 400 µg/kg or more microcystin-LR died 6–8 hr following injection. At the higher doses, glomerular capillaries and proximal tubules contained eosinophilic, fibrillar material, and the proximal tubular epithelium was vacuolated. In rats given the highest doses, there was multifocal necrosis of tubular epithelium. In the dog in the current study, eosinophilic material was not found in glomerular capillaries, but there was acute necrosis of tubular epithelium, and the epithelium lining proximal convoluted tubules was vacuolated. The authors of the rat study hypothesized that the tubular necrosis might have been due to direct action of the toxin, but they felt that it was more likely that the acute tubular necrosis associated with microcystin toxicosis was caused by ischemia resulting from shock secondary to massive hepatic necrosis and hemorrhage. That also seems likely in the current case. The dog likely ingested a large amount of toxin, and whether it had a direct effect on the renal epithelium is unknown. Aggressive antemortem therapy likely prolonged life, allowing more time for development of degenerative and/or necrotic renal changes secondary to ischemia. Preexisting renal disease could not be completely excluded but was unlikely because no renal lesions of a chronic nature were observed, and no evidence in the dog’s clinical history suggested preexisting renal disease.
Although creatinine was mildly elevated at the time of admission, it was associated with dehydration and therefore did not indicate renal failure. The urine-specific gravity collected by catheterization 7 hr after the start of fluid therapy also indicated that the patient retained the ability to concentrate urine during this period, which would be inconsistent with renal failure. However, the patient became anuric after this time, with no additional urine production despite the correction of dehydration and continued fluid therapy at twice the maintenance rate. The development of anuria during the latter part of the clinical course could have had a prerenal component associated with decreased renal perfusion. Decreased renal perfusion in microcystin toxicosis has been described in swine 2 and may lead to secondary ischemic lesions. It may also be speculated that the exposure to microcystin-LR in the current case was unusually high, leading to spillover of intact microcystins from the liver, and subsequent distribution to the kidneys, leading to direct nephrotoxic effects.3,13 A clear distinction between the prerenal toxic effects leading to the development of kidney lesions and direct toxin effects on kidney tissues could not be made in the current case.
Footnotes
Acknowledgements
The authors thank the United States Geological Survey Kansas Water Science Center for sharing water samples that were used for microcystin characterization and quantitation. The authors also thank Drs. Lisa Pohlman and Ara Gupta of the Clinical Pathology Section of the Kansas State Veterinary Diagnostic Laboratory for providing interpretations of clinical pathology data.
a.
Vitamin B Complex, Vedco Inc., St. Joseph, MO.
b.
Normosol-R, Abbott Laboratories, Abbott Park, IL.
c.
Olympus SZX16 Research Stereomicroscope, Olympus Corp., Center Valley, NJ.
d.
Quantiplate Kit for Microcystins (EP 022), Envirologix Inc. Portland, ME.
e.
Microcystins and nodularin (ADDA) ELISA kit (PN 520011), Abraxis, Warminster, PA.
f.
Strata X (200 mg), Phenomenex Inc. Torrance, CA.
g.
Thermo Savant Modulyo Freeze Dryer System, Thermo Fisher Scientific, Waltham, MA.
h.
A Thermo Finnigan Surveyor HPLC system coupled with a Thermo Finnigan LCQ h Advantage MS, Thermo Fisher Scientific, Waltham, MA.
i.
Synergi™ 4 µm Polar-RP (150 × 2.0 mm) column, Phenomenex, Torrance, CA.
Declaration of conflicting interests
Two of the authors, M. T. Aubel and A. Foss, are associated with GreenWater Laboratories, which performs commercial testing for cyanobacterial toxins.
Funding
The author(s) disclosed receipt of the following financial support for the research, authorship, and/or publication of this article: Partial financial support was received from K-State Research and Extension (project no. KS418).