
Abstract
Oral melanoma is a common canine cancer with a historically poor prognosis. Recent evidence suggests that a subset of cases may have a more favorable outcome, defined as long-term survival in the absence of intervention other than initial surgery. Traditional histological parameters have had prognostic significance in some studies but not in others, potentially due to interobserver variation. We evaluated the prognostic utility of Ki67 immunohistochemistry in a group of 79 canine oral melanomas using a technique easily applied in a veterinary diagnostic laboratory. A threshold Ki67 value of >19.5 had a sensitivity and specificity of 87.1% and 85.4%, respectively, at predicting death or euthanasia due to melanoma by 1 year postdiagnosis. Threshold values for classical histological parameters were also identified for most cases and were >4 (>30%; sensitivity = 83.9%, specificity = 86.0%) for the nuclear atypia score and >4/10 hpfs (sensitivity = 90.3%, specificity = 84.4%) for the mitotic index. In this study, the percentages correctly classified with respect to death by 1 year postdiagnosis were comparable for Ki67 (86.1%, 68/79), the nuclear atypia score (86.3%, 63/73), and the mitotic index (86.8%, 66/76). High pigmentation (>50%) had a high negative predictive value of 90.9% (18/20), but overall, only 61.0% (47/77) of cases could be correctly classified by this parameter. Based on these results, we recommend a panel of prognostic parameters, including the nuclear atypia score, the mitotic index, Ki67, and pigmentation quantification to more accurately predict the likely outcome of canine oral melanomas.
Canine oral melanoma is reportedly the most common canine oral malignancy. 25 The likelihood of a poor outcome, defined as local invasiveness or metastasis to the lymph nodes and lung, has historically been reported as 80% to 100%. 3,8,18,25,27 Recent evidence suggests that there may be a subset of cases with a more favorable prognosis. 1,5,24,26 In one study, 92% of tumors in a set of canine oral melanocytic neoplasms were originally diagnosed as malignant based on histomorphology; however, only 59% of tumors in this study eventually showed malignant behavior. 26 In another study, only 5% (3/64) of dogs with well-differentiated and heavily pigmented canine oral or lip melanomas died of tumor-related causes. 5 A third study cited a 1-year survival rate of 45.2% (19/42) for a group of canine lip melanomas. 24 These findings support the assertion that a subset of canine oral melanoma may have a favorable clinical course. In addition, they highlight the need for accurate prognostic indicators of clinical behavior.
A variety of histological variables have been evaluated for prognostic value in canine oral melanomas. 1 –3,5,8,9,12,16,18,23 –26,28 Of these, nuclear atypia appears to be the most sensitive, at least when rigorously defined criteria for atypia and a meticulous grading system are applied. Using a grading system separated into deciles, a score of ≥5 (representing ≥40–49% atypical nuclei) was reported to have a sensitivity and specificity of 92.5% and 81.3%, respectively, for predicting malignant behavior in a group of oral canine melanomas. 26 In another study, 95% (61/64) of dogs with oral melanomas that were histologically classified as highly pigmented and well differentiated survived to the end of the follow-up period or died of causes unrelated to the tumor (mean survival, 23.4 months after surgery). 5 Several other studies of mixed oral and cutaneous melanocytic tumors also found nuclear atypia to be significant, although this parameter was not precisely defined. 16,21 Other studies did not identify specific histological features of prognostic value, but these studies did not define criteria of atypia as precisely. 24
Mitotic index (MI) has also been evaluated. 7,8,12,16,18,23,24,26 MI has had a prognostic value in some studies of oral melanoma 23,26 but not in others. 8,18 An MI of ≥3/10 hpf significantly correlated with decreased survival in cutaneous canine melanoma. 12 For oral melanoma, an MI of ≤3/single hpf was statistically associated with a favorable outcome in 1 study. 7 A threshold MI of >3/single hpf was identified empirically and associated with poor outcome in oral melanomas with osteocartilaginous differentiation. 23
In addition to traditional histological assessment, immunohistochemistry can be a useful, semiquantitative, and objective prognostic tool. Immunohistochemistry is increasingly used in addition to histological description in human oncology for its prognostic value. 10 Immunohistochemical labeling differences reflect a biological difference in molecular expression levels and may be more objective than descriptive histology, if appropriate molecular markers can be identified and validated.
Ki67 is a nonhistone nuclear protein expressed in all phases of the cell cycle (G1-M) but not in resting cells (G0). 4 Its expression is considered a measure of tumor growth fraction. The Ki67 index has been used prognostically in human oncology 13 –15 and in canine mast cell tumors. 29 Expression of Ki67 in canine melanomas has only been evaluated to a limited degree. 11,12,16,21 –23 In one study, a Ki67 index of at least 15% (out of 500 neoplastic cells) was predictive of a poor outcome in canine cutaneous melanomas. 12 In another study using computerized quantitative image analysis, Ki67 values greater than the median had a statistically stronger likelihood of death by 1 year postexcision in canine oral and cutaneous melanomas (n = 62). 16 A similar computerized image analysis of a mixed group of oral, nail bed, and cutaneous canine melanomas demonstrated that higher Ki67 labeling correlated with decreased survival time at a 6-month follow-up. 21 In a small case series (n = 10), a Ki67 index of at least 30% (out of 600 neoplastic cells) correlated with recurrence and metastasis by 6 months postdiagnosis in melanomas with osteocartilaginous differentiation. 23 A specific statistically valid Ki67 threshold value for noncomputerized diagnostic immunohistochemistry has not been established for canine oral melanoma. In the current study, we evaluated Ki67 immunohistochemical labeling using standard light microscopy and a manual counting technique that is easily applied in a veterinary diagnostic laboratory setting. We compared this evaluation with nuclear atypia, MI, and pigmentation in a series of 79 canine oral melanomas. In addition, we established a statistically valid threshold or cutoff value for Ki67 index and compared this with similarly obtained threshold values for the other histological parameters.
Methods
Case Populations, Inclusion Criteria, and Follow-up Information
Case materials from three diagnostic centers: the Diagnostic Center for Population and Animal Health (DCPAH) at Michigan State University, Lansing; IDEXX-VS, Sacramento, California; and Animal Reference Pathology Division (ARUP), Salt Lake City, Utah, were used in this study.
Minimum inclusion criteria for materials from all 3 centers were as follows: A definitive diagnosis of canine oral melanoma or oral melanocytoma (the term melanocytoma was included in the search criteria to avoid artificially excluding tumors deemed benign by the original diagnosing pathologist). Sufficient case material was provided for Ki67 analysis in the form of paraffin-embedded, formalin-fixed blocks or hematoxylin-and-eosin (H&E) glass slides (to be destained). Mortality information (alive vs dead) was available at the time of follow-up. A minimum time span of 1-year survival was attained postdiagnosis for dogs that were alive at last follow-up or had died from causes other than melanoma. If the dog was dead at follow-up, what was the approximate date of death (to the nearest day if available, to the first day of the nearest month if approximate)? If the dog had died or been euthanized, was it reasonably likely, based on assessment by the submitting veterinarian, that death or euthanasia were due to melanoma? Dogs had received no therapy (chemotherapy, radiation, therapeutic vaccination) other than surgery. Re-excision was acceptable with the dates noted. One dog in the study had received nonspecific immune-stimulatory therapy (immunoregulin, Proprionibacterium acnes injection). If the dog was dead at follow-up, had it died or been euthanized? For dogs that were alive or had died, had there been a recurrence of the original tumor, and when was this noted? What was the age (at the time of diagnosis) and sex of the patient? What was the site of the tumor within the oral cavity?
Answers to the questions listed below were obtained whenever possible, but the absence of this information did not preclude inclusion if the minimum criteria above were met.
All tissues from these cases had been fixed in 10% neutral buffered formalin, routinely processed, and embedded in paraffin wax. H&E-stained 5-μm sections were evaluated for diagnostic confirmation. Cases in which the diagnosis was in question either on the original biopsy or upon review were excluded.
Of 77 surgical biopsies diagnosed as canine oral melanoma at the DCPAH between December 2006 and January 2007, 15 met the minimum inclusion criteria above after phone conversation with the submitting veterinarian. Reasons for failure to meet the minimum inclusion criteria included unavailability of the submitting veterinarian, lack of sufficient follow-up history, and failure to achieve a minimum follow-up time of 12 months postdiagnosis for the dogs that were alive or had died of competing causes. Of 66 paraffin-embedded blocks from a previous study at ARUP 5 and supplied by a coauthor (D. G. Esplin), 38 were able to be immunostained and met the minimum inclusion criteria. Of 75 H&E-stained sections of canine oral melanomas from a previous study at IDEXX 26 and supplied by a coauthor (W. L. Spangler), 27 cases both met the inclusion criteria and could be successfully decolorized and immunostained. In total, this resulted in a case series of 80 oral melanomas, representing 79 unique cases and 1 recurrence. A supplemental file containing the case set with background, follow-up, and the measured parameters has been placed in online materials (supplement 1).
Histological Analysis
Histological analysis was performed by one board-certified pathologist (I. L. Bergin) without knowledge of the case outcome. Nuclear atypia was semiquantitatively assessed using a previously established histological grading scale based on assessment of nuclei as typical or atypical. 26 This 1–10 grading scale was adapted to a semiquantitative method as follows. One hundred neoplastic cells were counted at 400× magnification and classified as having typical or atypical nuclei with the aid of a differential cell counter. A numeric score was assigned that corresponded to the percentage of cells with atypical nuclei: 0, no atypical nuclei; 1, 1 to 9% atypical nuclei; 2, 10 to 19% atypical nuclei… up to 10, 90 to 100% atypical nuclei. MI was assessed as the number of mitotic figures in ten 400× fields. Pigment was assessed subjectively as none (score 0), mild (score 1), moderate (score 2), or high (score 3). “Mild” pigment represented approximately 1 to 10% cells with pigment, “moderate” represented approximately 10 to 50% pigmented cells, and “high” represented greater than 50% pigmented cells. For nuclear atypia, MI, and pigment only 73, 76, and 77 of the 79 cases were evaluated, respectively, because of either spindle cell morphology precluding assessment or because the block or slide could not be recovered at the time of analysis. Tumor size and completeness of excision were generally not able to be assessed.
Ki67 Immunolabeling
Ki67 immunolabeling and analysis were performed on samples without knowledge of the case outcome. Five-micrometer sections from paraffin-embedded, formalin-fixed blocks were cut, deparaffinized, and rehydrated by standard histological methods. For cases submitted as H&E-stained slides, coverslips were removed and tissues were decolorized prior to immunolabeling. For validation, archival sections of canine melanomas and mast cell tumors were directly immunolabeled with Ki67 or immunolabeled following H&E staining and decolorization. The number of immunolabeled cells was found to be comparable (within 5%) for both methods (data not shown). Ki67 immunolabeling was performed on the Benchmark Automated Staining System (Ventana Medical Systems, Inc., Tucson, AZ) following heat-induced epitope retrieval. Briefly, a mouse monoclonal anti-Ki67 antibody (MIB-1; Dako Cytomation, Carpinteria, CA) at dilution 1:50 was applied and detected using the Enhanced V-Red detection system (Ventana), which used alkaline phosphatase and the chromagen AEC. Negative controls used diluent in place of primary antibody, and positive controls included canine lymph nodes and mast cell tumors. Internal positive controls consisted of nuclear labeling of basal keratinocytes within the test sections.
Evaluation of Ki67 Immunolabeling
Evaluation of Ki67 immunolabeling was performed by 2 board-certified pathologists (I. L. Bergin, R. C. Smedley) without knowledge of the case outcome and following a previously described method. 29 The neoplasms were scanned at low magnification for areas of highest Ki67 labeling. Areas with heavy inflammation or necrosis were avoided because inflammatory cells can be positive for Ki67. Five 400× fields within the areas of heaviest Ki67 labeling were manually assessed with the aid of a 1 mm 2 optical grid reticle and a manual cell counter. Neoplastic cells with nuclear labeling were counted within the grid, and the Ki67 index was calculated as the mean number of labeled neoplastic cells in the 5 grid fields.
Statistical Analysis
Statistical analysis was performed using the program PASW Statistic, version 17.0 (SPSS:IBM, Chicago, IL). Cox regression analysis was also performed in SAS version 9.1 (SAS Institute, Cary, NC). Independent variable comparisons of mean and median values for Ki67 index, nuclear atypia, MI, pigment, sex, and age between the dogs surviving for a minimum of 1 year and dogs that were dead because of melanoma at 1 year were performed by the nonparametric Mann-Whitney U rank-sum test. Univariate and multivariate analyses of Ki67, nuclear atypia, MI, and pigment were performed by a Cox proportional hazards regression model. Threshold or cutoff values for each parameter were determined by receiver operating characteristic (ROC) analysis by the following method. 6,17 Sensitivity and specificity for each candidate threshold value (each coordinate) were determined from the ROC curves. The value that generated the highest sensitivity and specificity was selected as the threshold value, while restricting the minimally acceptable sensitivity and specificity to 75%. Positive and negative predictive values and accuracy (percentage correct classification) for candidate threshold values were calculated from the observed data in this study. To determine the effect of varying disease prevalence on these parameters, additional positive and negative predictive values and accuracy were calculated in hypothetical populations with varying prevalence of disease. An example of these calculations is shown in Table 1 , and the complete calculations are available in online materials (Supplement 2). Threshold values were evaluated with respect to survival by Kaplan-Meyer analysis using Breslow (generalized Wilcoxan) tests for significance. For each statistical comparison, P values of <.05 were considered significant.
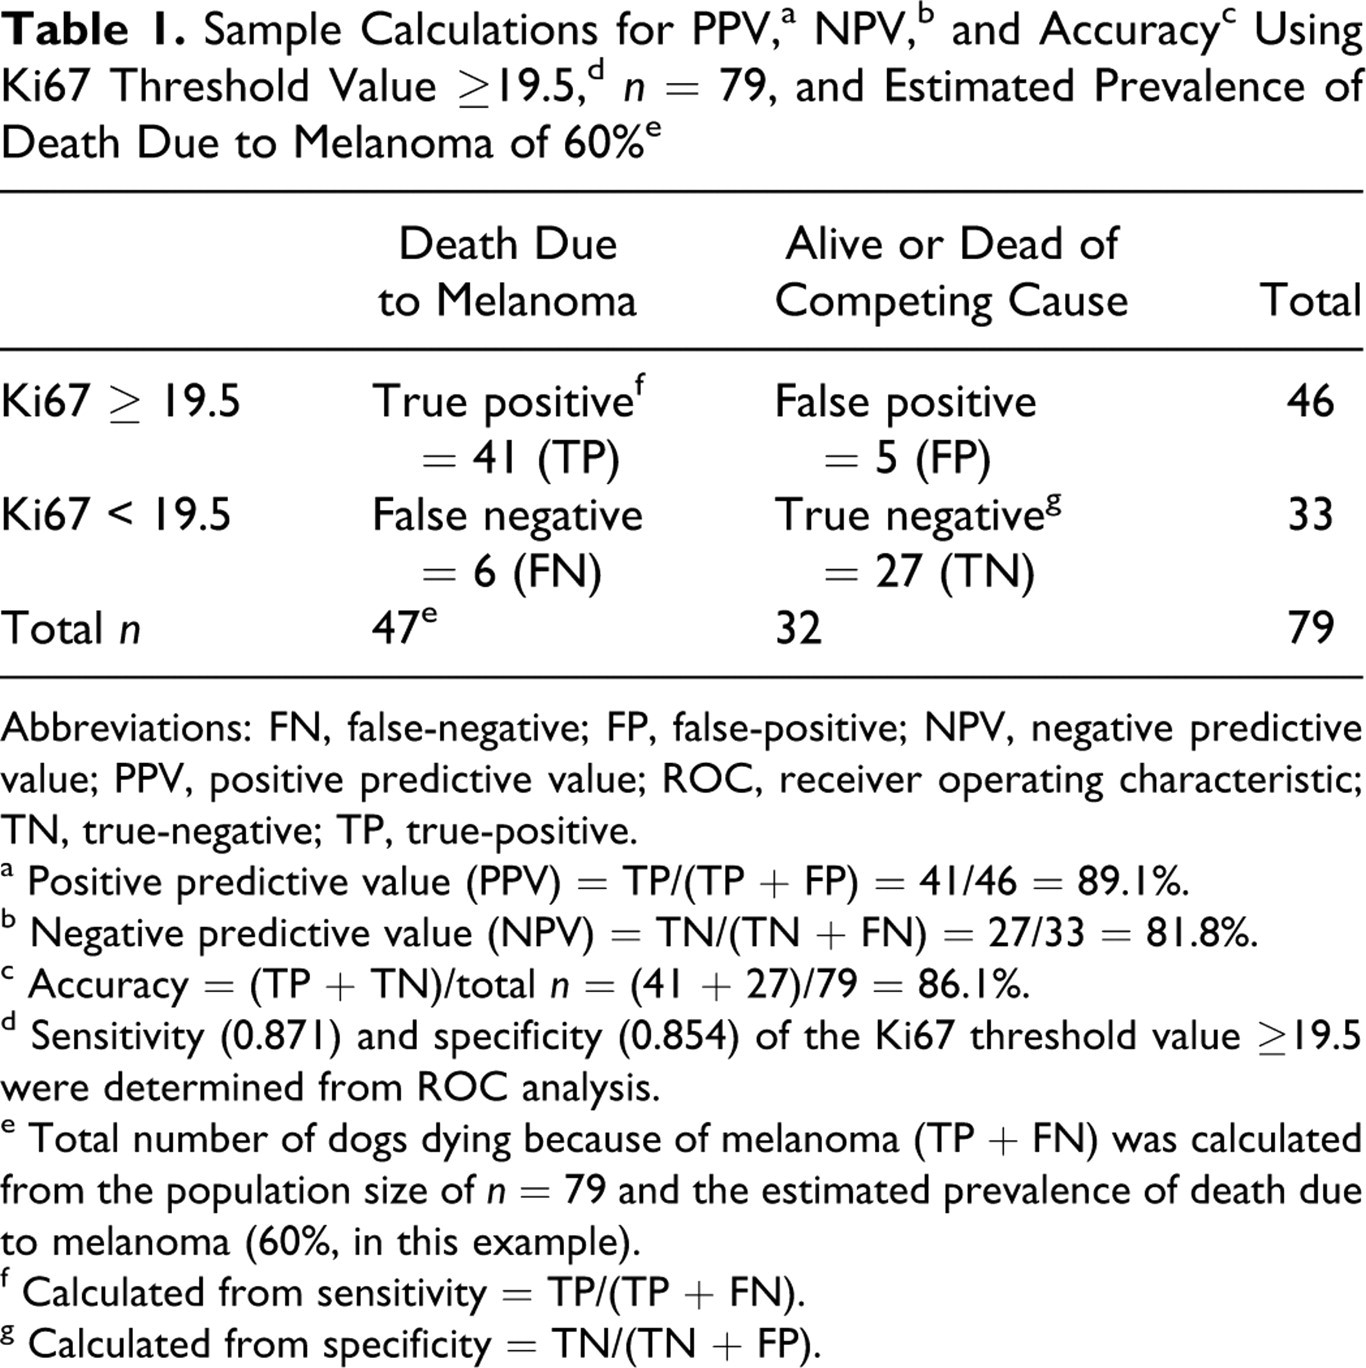
Abbreviations: FN, false-negative; FP, false-positive; NPV, negative predictive value; PPV, positive predictive value; ROC, receiver operating characteristic; TN, true-negative; TP, true-positive.
a Positive predictive value (PPV) = TP/(TP + FP) = 41/46 = 89.1%.
b Negative predictive value (NPV) = TN/(TN + FN) = 27/33 = 81.8%.
c Accuracy = (TP + TN)/total n = (41 + 27)/79 = 86.1%.
d Sensitivity (0.871) and specificity (0.854) of the Ki67 threshold value ≥19.5 were determined from ROC analysis.
e Total number of dogs dying because of melanoma (TP + FN) was calculated from the population size of n = 79 and the estimated prevalence of death due to melanoma (60%, in this example).
f Calculated from sensitivity = TP/(TP + FN).
g Calculated from specificity = TN/(TN + FP).
Results
Descriptive Statistics
Of the 79 unique cases, 48 dogs had survived a minimum of 1 year postdiagnosis, and 31 dogs had died or been euthanized because of melanoma by 1 year postdiagnosis. In the group of 48 dogs that survived at least 1 year, 33 dogs were alive at the last follow-up, 12 eventually died or were euthanized for unrelated causes, and 3 dogs died or were euthanized for melanoma-related causes at 472, 707, and 780 days postsurgery. The one case in which both the original and recurrent tumor were represented was in the group that survived (recurrence at 20 months, reported alive at 29 months postdiagnosis). Mean and median survival times in the dogs that were dead due to melanoma by 1 year were, respectively, 118 and 99 days (95% CImean = 83–153). For dogs that survived a minimum of 1 year, the mean and median survival times (or time to last follow-up) were 753 and 778.5 days (95% CImean = 689–817), respectively.
Ki67 Labeling Index and Other Evaluated Parameters
The mean Ki67 labeling index for the group that died of a melanoma-related cause by 1 year postdiagnosis was 40.8 and was significantly higher than the mean Ki67 labeling index (11.2) for the dogs alive at 1 year postdiagnosis (P < .0001). The distribution of Ki67 values within each group was wide, but the confidence intervals of the mean did not overlap between the outcome groups (Fig. 1). Ki67 in the recurrent case (case 43 in Supplement 1) was 13.6 compared with 15.2 in the original tumor (case 42). Table 2 compares Ki67, nuclear atypia, MI, pigment, and age for dogs that survived a minimum of 1 year postdiagnosis and dogs that died or were euthanized because of melanoma by 1 year postdiagnosis. Ki67, nuclear atypia, MI, and pigment were each statistically significantly different between these 2 outcome groups, while age did not significantly differ. The female:male distribution was 50:50 in the group that survived to 1 year and 55:45 in the group that died by 1 year. Sex distribution did not significantly differ between the groups.
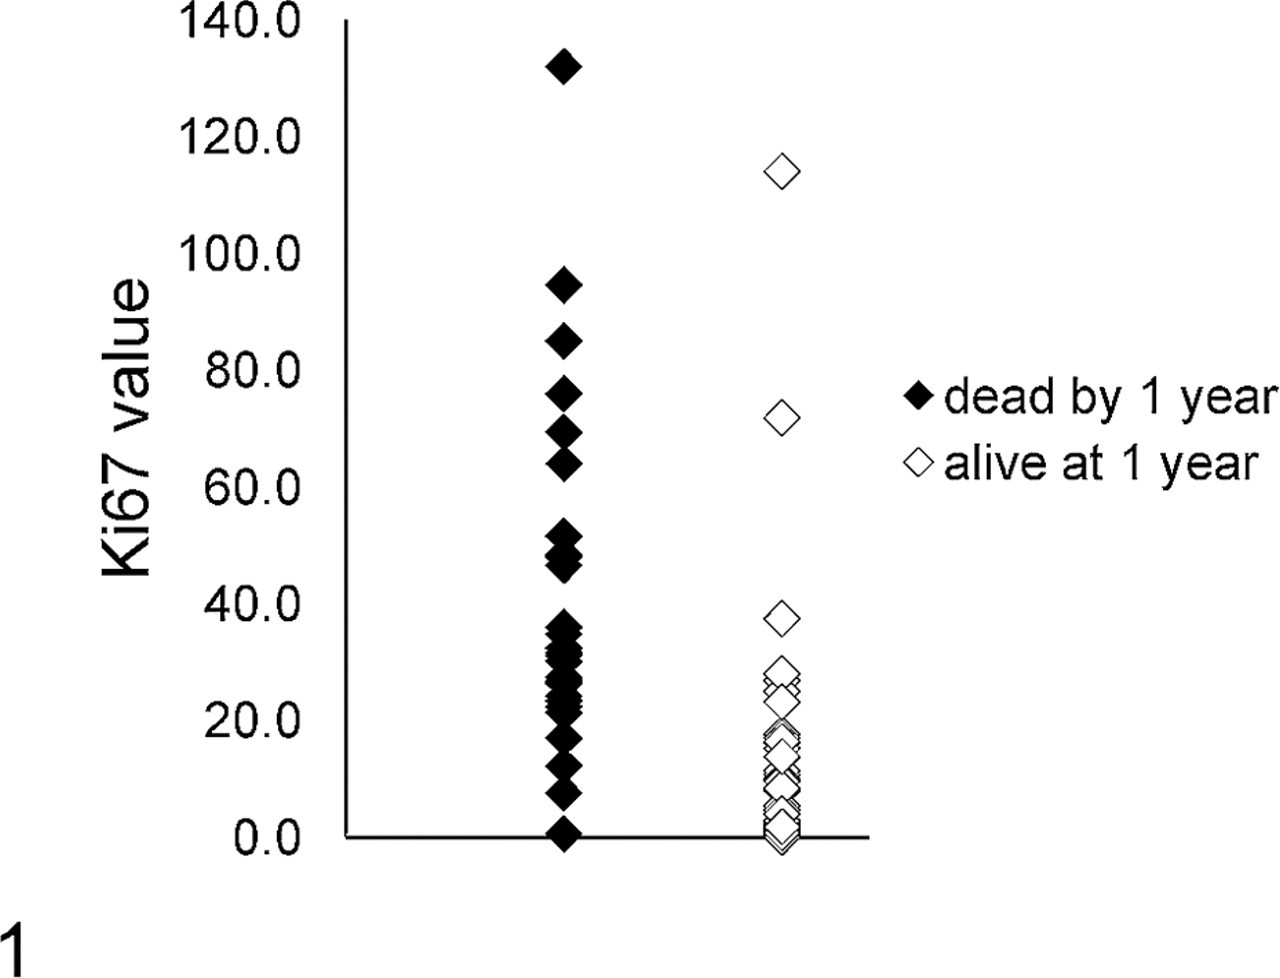
Range of Ki67 index values for biopsies from dogs dead of melanoma by 1 year postdiagnosis (n = 31) and dogs surviving for a minimum of 1 year postdiagnosis (n = 48). The mean for the dogs dead by 1 year postdiagnosis was 40.8 (95% confidence interval [CI] = 31.0–50.5), and the mean for the dogs alive at 1 year postdiagnosis was 11.2 (95% CI = 5.6–16.8). These means were significantly different (P < .0001).
Major Parameters Evaluated for Canine Oral Melanoma
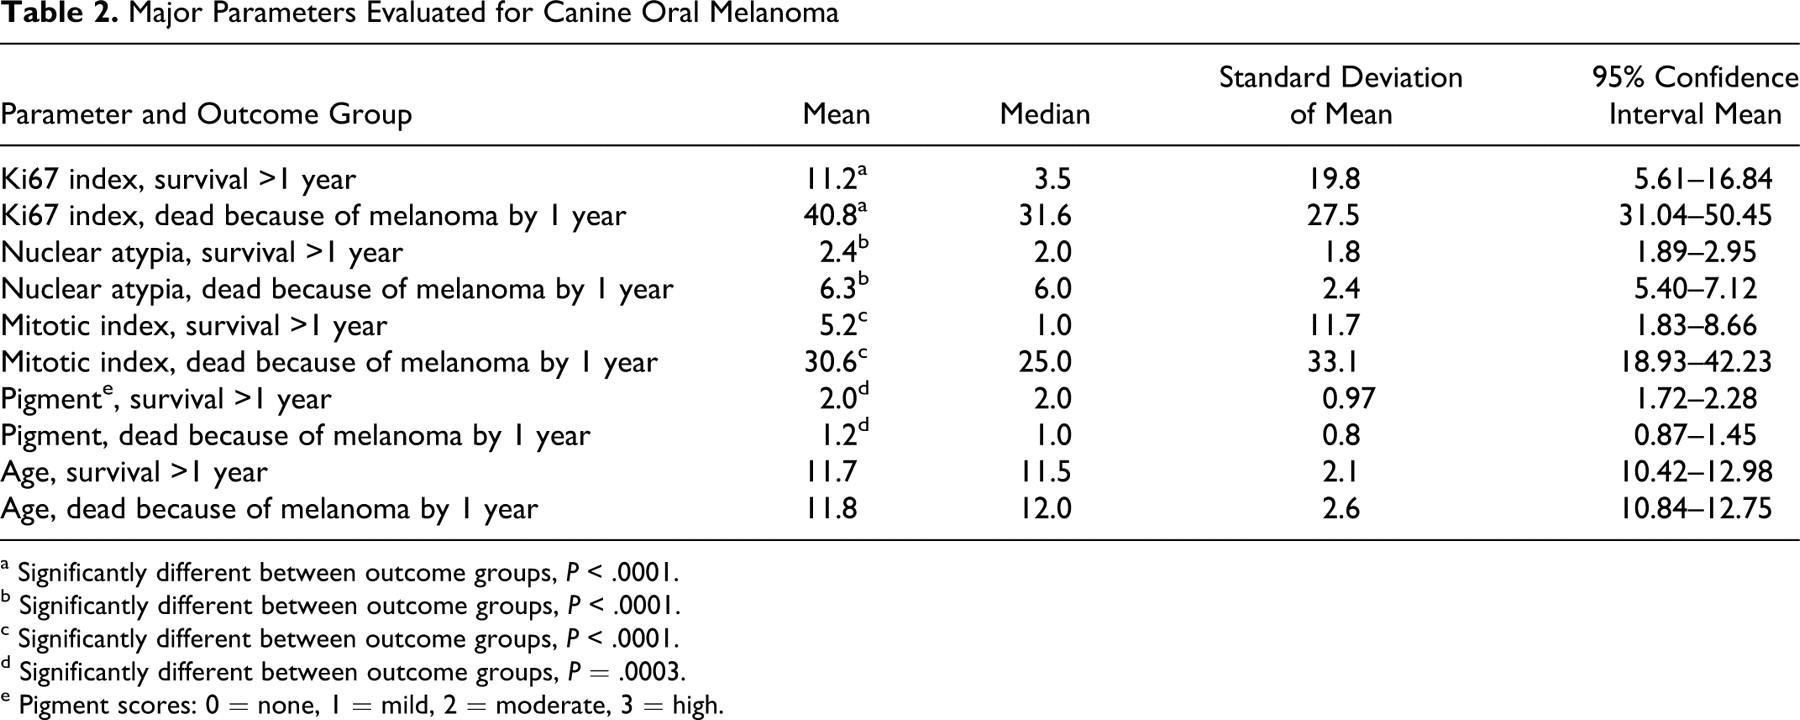
a Significantly different between outcome groups, P < .0001.
b Significantly different between outcome groups, P < .0001.
c Significantly different between outcome groups, P < .0001.
d Significantly different between outcome groups, P = .0003.
e Pigment scores: 0 = none, 1 = mild, 2 = moderate, 3 = high.
For 38 melanomas, the specific site within the oral cavity was known. Twenty-six of these cases were in the group that had died or been euthanized by 1 year postdiagnosis because of melanoma. These included 5 of 9 cases affecting the mandibular gingiva, 5 of 5 affecting the maxillary gingiva, 9 of 13 affecting nonspecified sites in the gingiva, 1 of 4 affecting the lip, 3 of 4 affecting the tongue, and 3 of 3 individual cases affecting the tonsil, soft palate, and pharynx, respectively. No statistically significant survival difference based on site within the oral cavity could be identified in this case set.
Cox Regression Analysis: Hazard Ratios
Ki67 labeling, nuclear atypia, MI, and pigment were assessed individually and as a group for their effects on relative risk of death by 1 year postdiagnosis. When evaluated individually (Table 3 ), each of these factors was significantly associated with an increased relative risk of dying by 1 year postdiagnosis, although the effect for pigment was the smallest. For Ki67, nuclear atypia, and MI, increasing values were associated with increased risk of disease, while for pigment, the risk was inverse (less pigment had increased risk of disease). When a multivariate model was applied, nuclear atypia was the dominant variable (Table 4 ). Disparate results between univariate and multivariate models can be seen when there is high correlation between parameters, that is, the values tend to rise or fall together (or inversely in the case of pigment). Correlation between the 4 parameters was statistically confirmed by Spearman correlation coefficient.
Univariate Cox Proportional Hazards Analysis
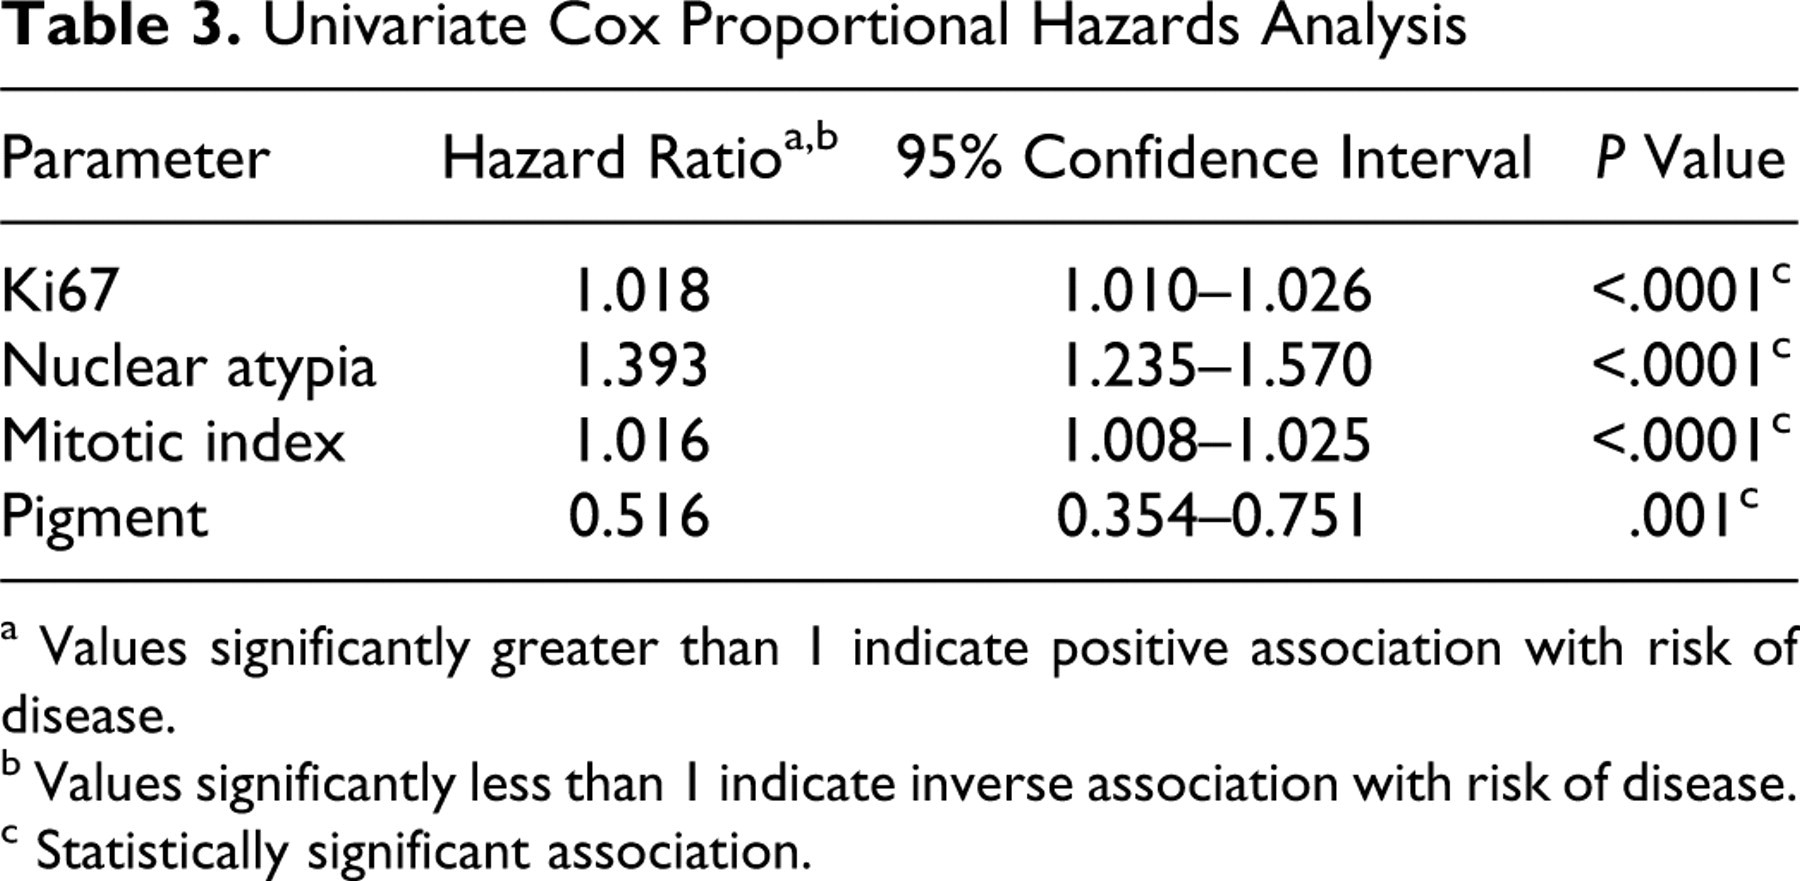
a Values significantly greater than 1 indicate positive association with risk of disease.
b Values significantly less than 1 indicate inverse association with risk of disease.
c Statistically significant association.
Multivariate Cox Proportional Hazards Analysis
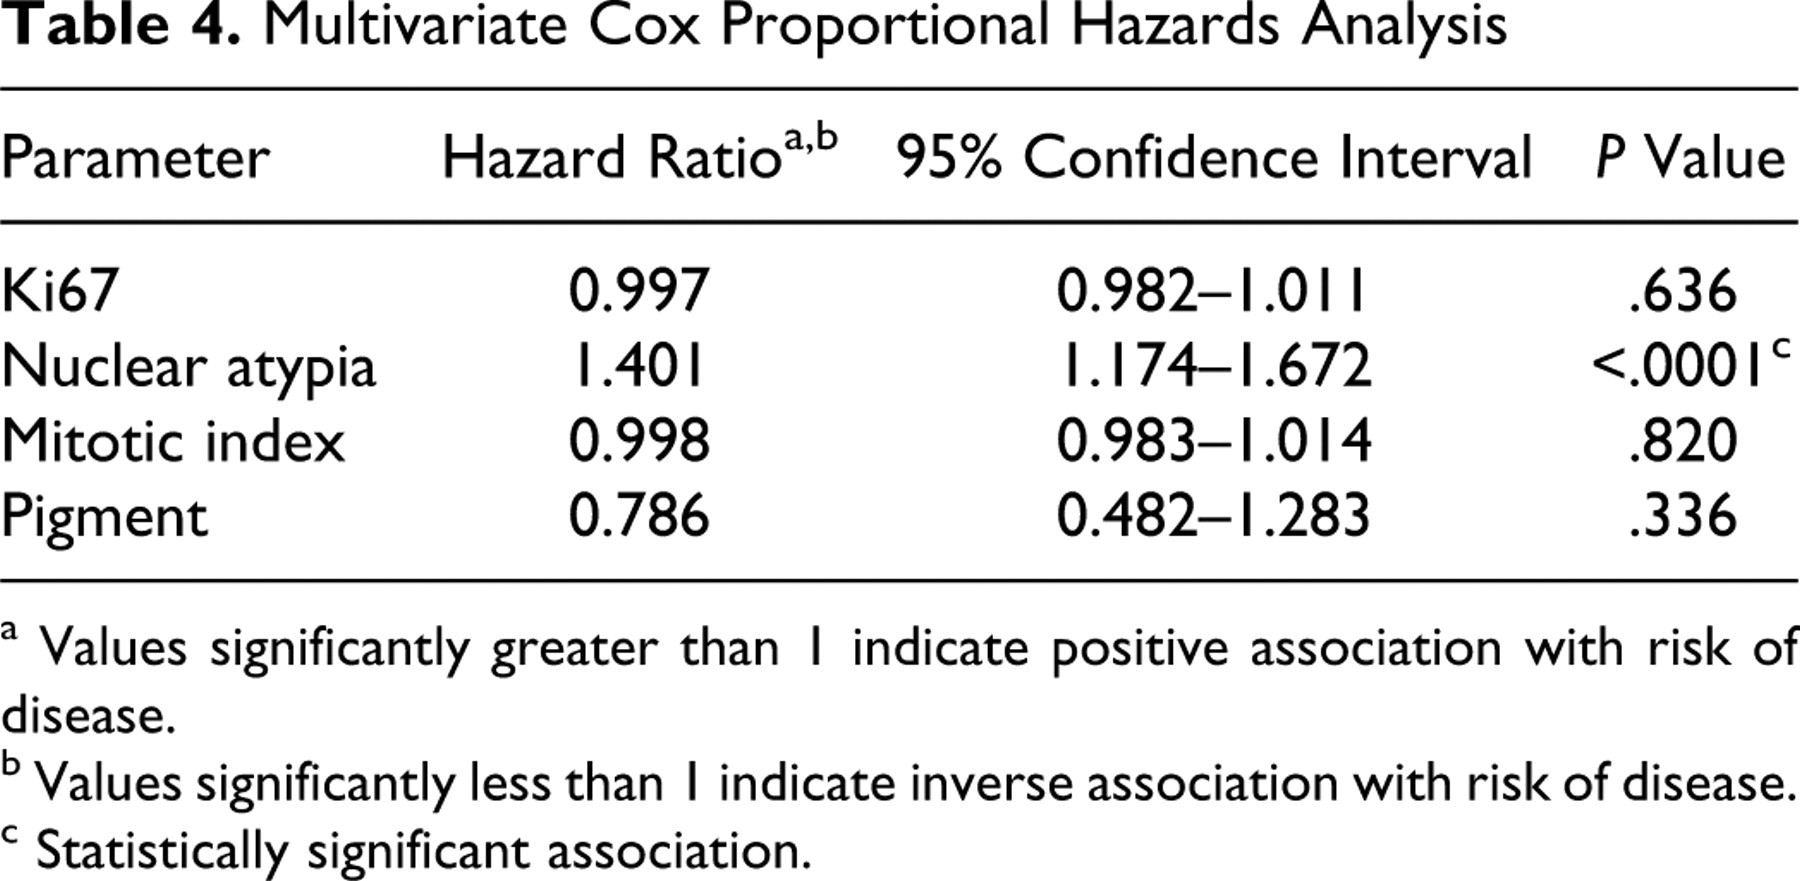
a Values significantly greater than 1 indicate positive association with risk of disease.
b Values significantly less than 1 indicate inverse association with risk of disease.
c Statistically significant association.
Ki67 as a Prognostic Test: ROC Analysis
ROC analysis is a method of comparing true-positives versus false-positives for a diagnostic test across all potential threshold values. 6,17 The area under the generated curve (AUC) represents the prognostic usefulness of the diagnostic test. The ROC curve for an idealized, “perfect” diagnostic test with sensitivity and specificity of 100% transcribes an area of 1, while a test equivalent to chance would have an area of 0.5. Ki67, nuclear atypia, MI, and pigment values were subjected to ROC analysis (Fig. 2). Ki67 index and nuclear atypia had the highest AUC values, indicating the highest sensitivity and specificity over all potential threshold values. MI had somewhat lower AUC, with a wider confidence interval, and pigment had the lowest AUC, although the confidence interval remained above 0.5.
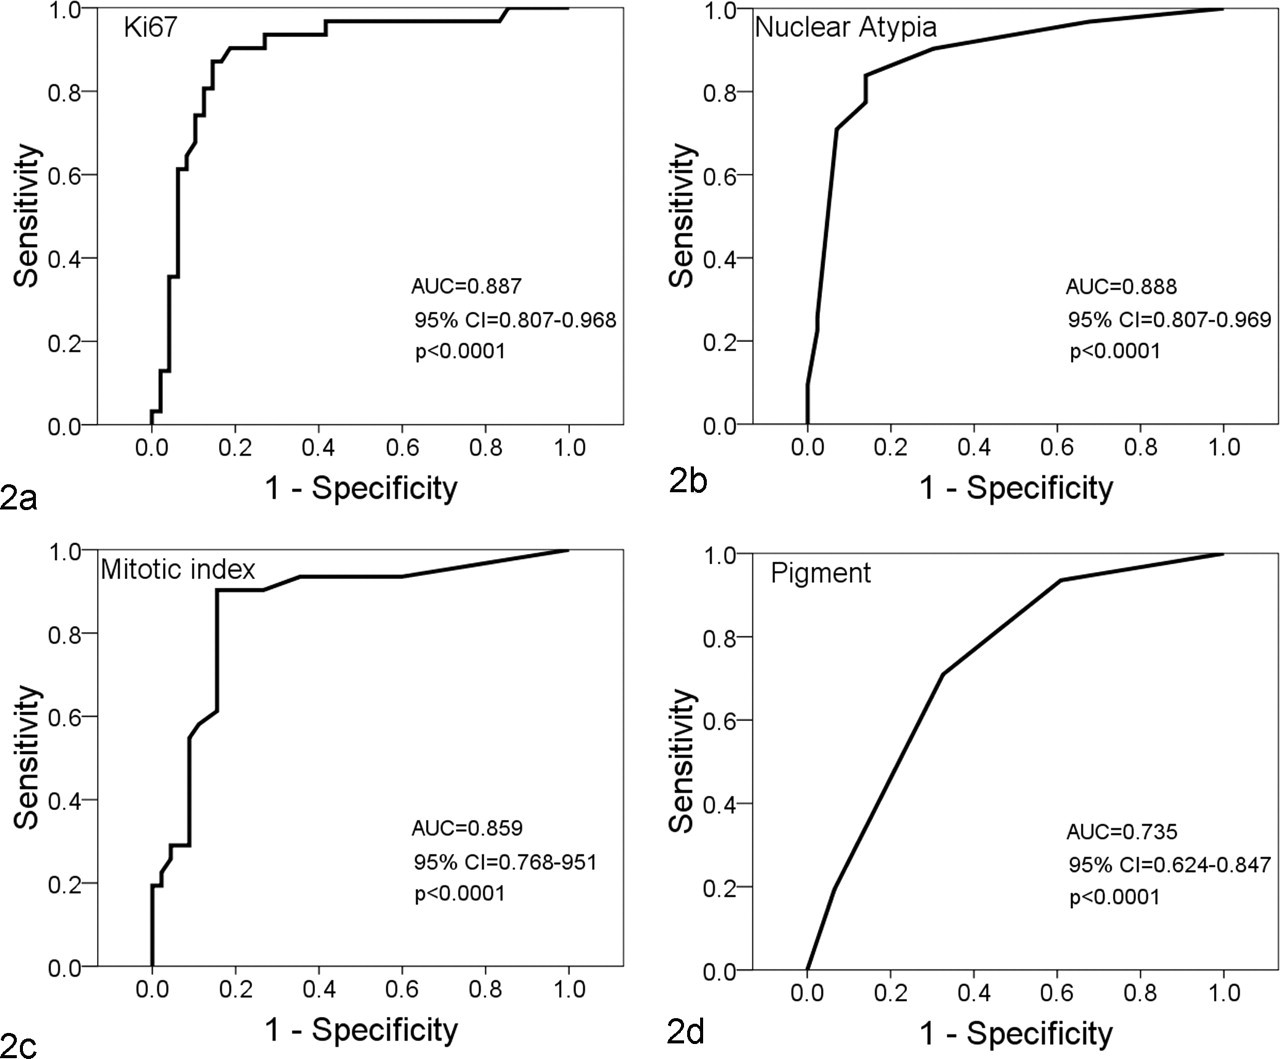
Receiver operating characteristic (ROC) curves for parameters evaluated in cases of canine oral melanoma. Each point represents the number of true-positive (sensitivity) versus false-positive (1-specificity) results for an individual value of the specified histological parameter. Areas under the curve (AUC) closer to 1 represent a more predictive diagnostic test, while values closer to 0.5 represent tests equivalent to chance. Horizontal lines represent ties between successive values. (a) Ki67, n = 79. (b) Nuclear atypia, n = 73. (c) Mitotic index, n = 76. (d) Pigment, n = 77.
Threshold Values, Sensitivity, and Specificity
From the coordinates of an ROC curve, the specificity and sensitivity for each measured value of a parameter can be determined. 6,17 The coordinate that generates the highest sensitivity and specificity can be used as a threshold or cutoff value. For Ki67, a value of ≥19.5 was selected as an optimum threshold. Across the range of all Ki67 values, this value gave the highest sensitivity and specificity for predicting outcome at 1 year postdiagnosis. The prognostic sensitivity and specificity of a Ki67 index value ≥19.5 were 87.1 and 85.4%, respectively. The optimum threshold value for nuclear atypia was ≥4, representing nuclear atypia of ≥30% (sensitivity = 83.9%, specificity = 86.0%). MI had an optimum threshold ≥4 (sensitivity = 90.3%, specificity = 84.4%). A specific threshold value for pigment with sensitivity and specificity both greater than 75% could not be identified. The specific ROC coordinates for the parameters evaluated in this study are listed in the online materials (Supplement 3).
Positive/Negative Predictive Values and Overall Accuracy (Percentage Correct Classification) With Respect to Disease Prevalence
Positive predictive value (PPV), negative predictive value (NPV), and overall accuracy are frequently cited in the evaluation of diagnostic tests. 20 PPV represents the number of true-positives out of all positive test results (of those patients with a positive test result, how many actually have the disease). Similarly, NPV represents the number of true-negatives out of all negative test results (of those patients with a negative test result, how many actually are free of disease). Overall accuracy represents the number of true-positives and true-negatives out of all test results (percentage correct classification). Unlike sensitivity and specificity, which are inherent to the diagnostic test and do not substantially vary with disease prevalence, PPV, NPV, and accuracy are all affected by the prevalence of disease in the population (in this case, the prevalence of death due to melanoma out of all cases with melanoma). 20 In this study, the overall prevalence of death (by 1 year postdiagnosis) due to melanoma was 39.2% (31 of 79 dogs). This is much lower than the historically reported percentage mortality of approximately 90% 3 or the mortality reported in more recent studies. 24,26
To account for this, we compared the observed PPV, NPV, and accuracy of Ki67, nuclear atypia, and MI threshold values in our study with the calculated values for these parameters in hypothetical populations with a higher percentage of death due to melanoma (Table 5 ). PPV, as would be expected, was highest in populations with higher percentage mortality and lowest in populations with lower percentage mortality. The inverse was true for NPV. Accuracy was fairly comparable for Ki67, nuclear atypia, and MI as compared within each prevalence level.
Positive and Negative Predictive Values and Accuracy of Ki67, Nuclear Atypia, and Mitotic Index Threshold Values as a Function of Differing Percentage Mortality in Canine Oral Melanoma
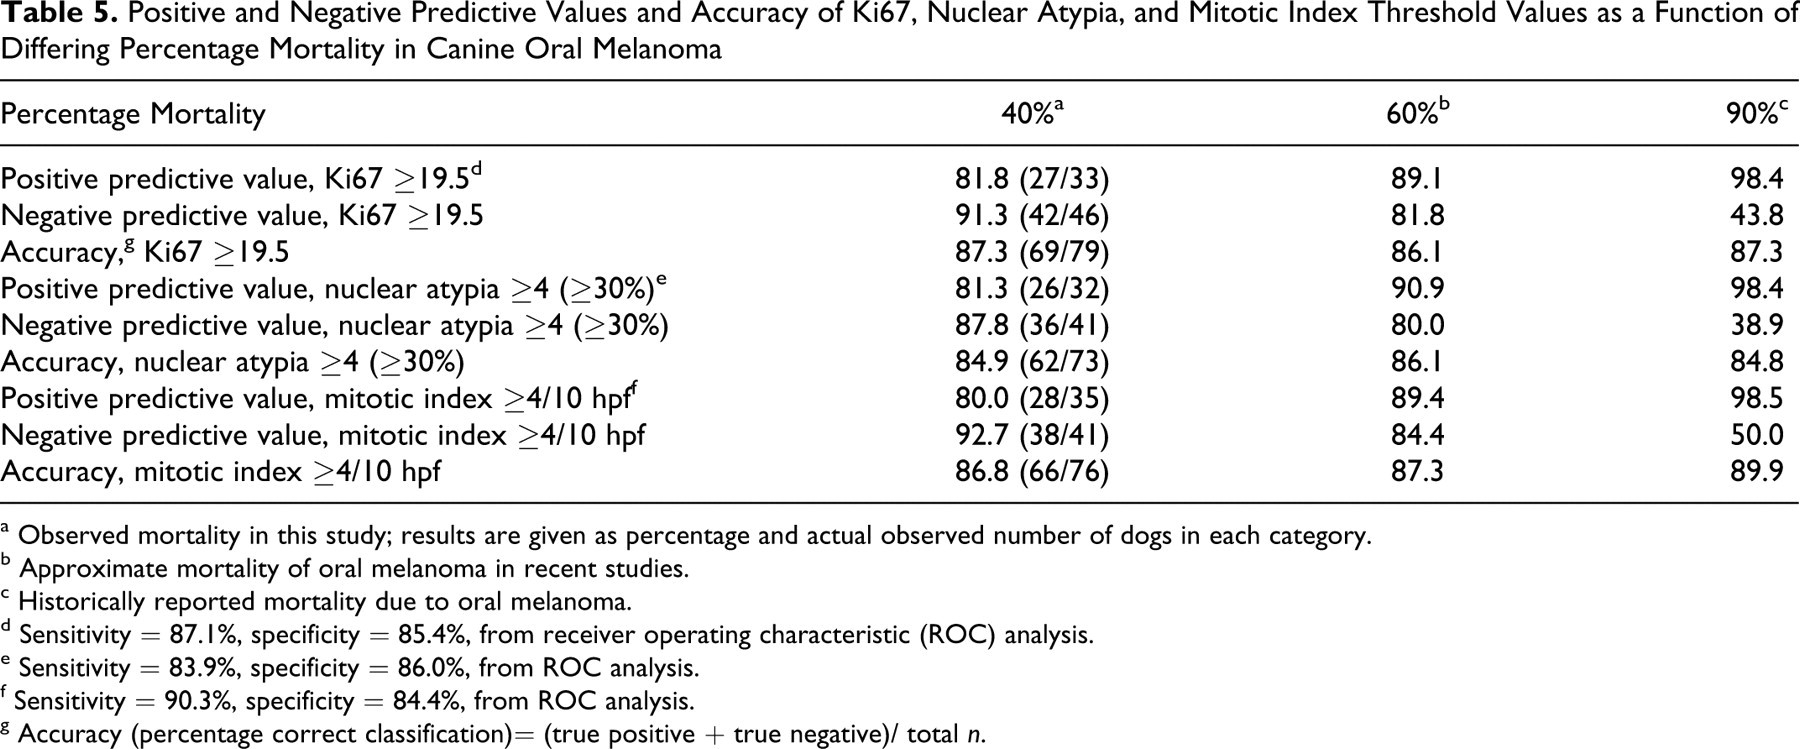
a Observed mortality in this study; results are given as percentage and actual observed number of dogs in each category.
b Approximate mortality of oral melanoma in recent studies.
c Historically reported mortality due to oral melanoma.
d Sensitivity = 87.1%, specificity = 85.4%, from receiver operating characteristic (ROC) analysis.
e Sensitivity = 83.9%, specificity = 86.0%, from ROC analysis.
f Sensitivity = 90.3%, specificity = 84.4%, from ROC analysis.
g Accuracy (percentage correct classification)= (true positive + true negative)/ total n.
Since we could not identify a suitable threshold value for pigment, we did not perform a similar threshold analysis for populations of 60 and 90% mortality for this parameter. Instead, we examined the observed PPV, NPV, and accuracy for each of the pigment categories used in this study (Table 6 ). Overall, pigment had the lowest PPV, NPV, and accuracy of any of the parameters measured. However, for tumors with pigment >moderate (ie, tumors with high pigment), the NPV was very high (90%). Thus, tumors with high pigment were very likely to be associated with survival, but outcome could not be accurately predicted for less-pigmented tumors by this parameter alone.
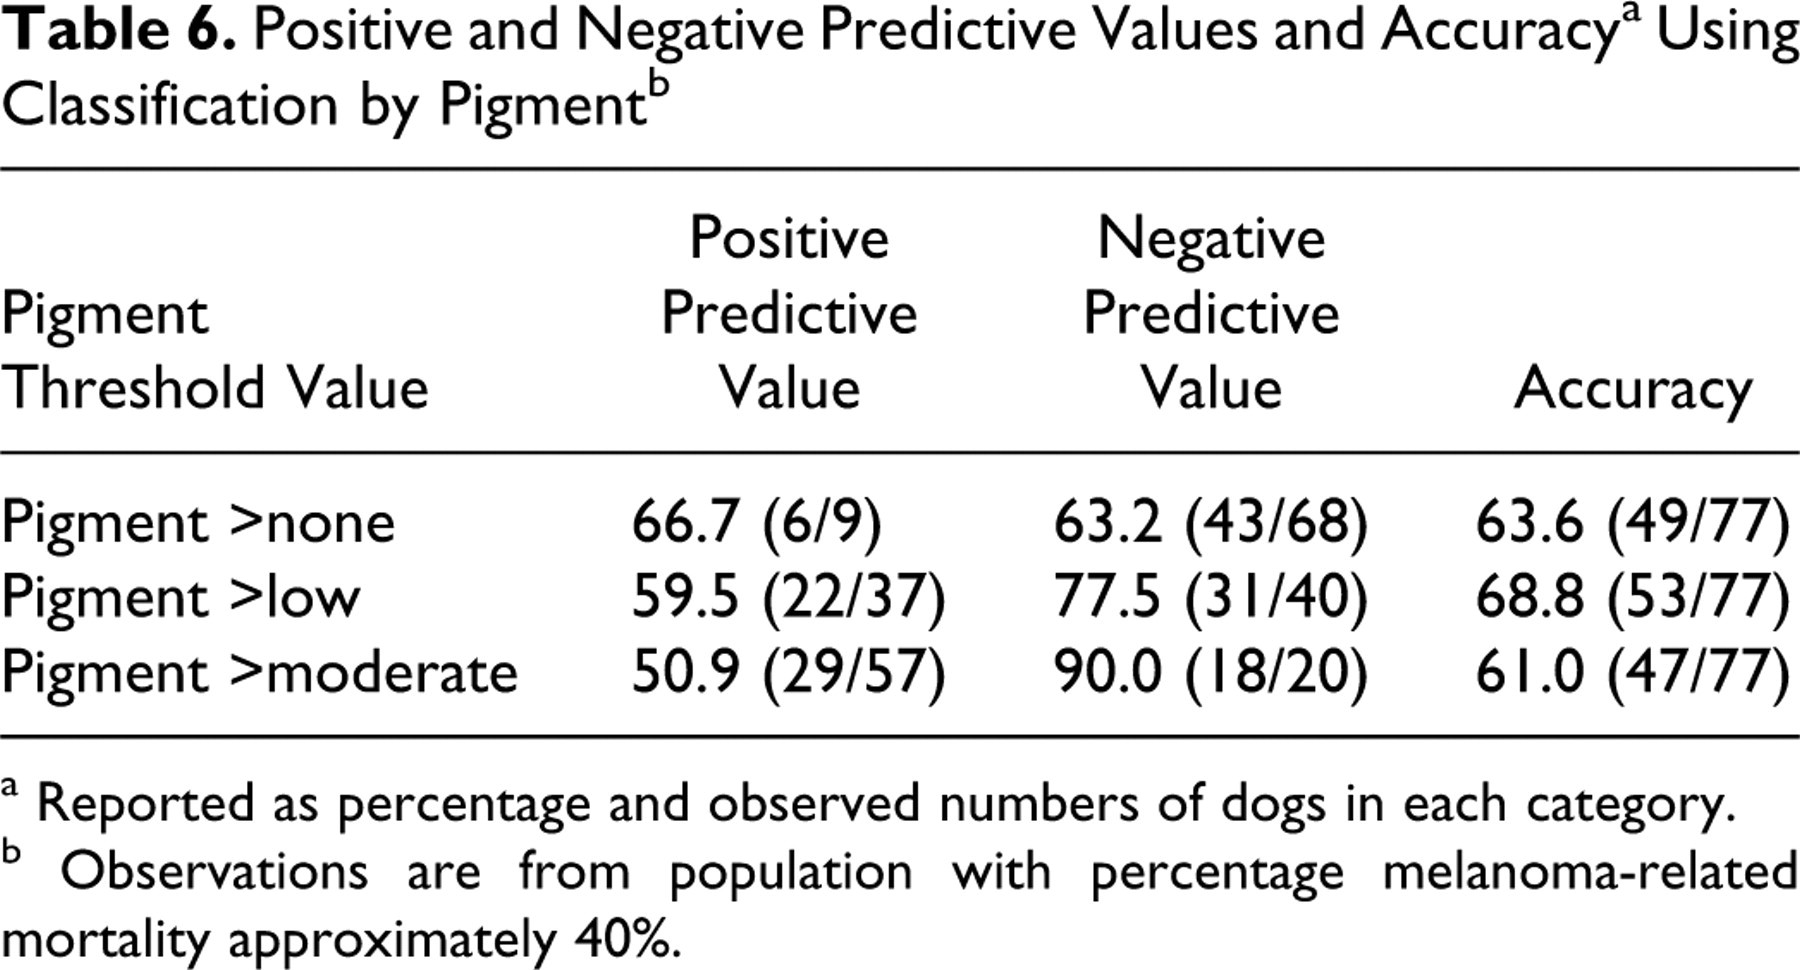
a Reported as percentage and observed numbers of dogs in each category.
b Observations are from population with percentage melanoma-related mortality approximately 40%.
Survival Analysis
Survival analysis was performed on the basis of classification by thresholds for Ki67, nuclear atypia, and MI (Fig. 3). A similar analysis was performed for pigment using each degree of pigment (none, low, moderate, or high) as a classification parameter (Fig. 3d). These analyses were performed using the specific date of death/euthanasia due to melanoma (even if after 1 year) or the date of last follow-up/death due to competing causes. Groups with values above and below the thresholds for Ki67, nuclear atypia, and MI had statistically significantly different survival times. For Ki67, only 4 of 44 dogs with Ki67 <19.5 had died or were euthanized because of melanoma by 1 year. Comparably, 6 of 41 dogs with nuclear atypia <4 and 4 of 41 dogs with MI <4/10 hpf had died or were euthanized by 1 year. Of all dogs that survived at least 1 year, only 3 eventually died of melanoma; 2 of these had Ki67 values greater than 19.5, and 1 had a Ki67 value of 10.8. The dog that died with a Ki67 value of 10.8 (case 34 in the supplemental file) had high scores for nuclear atypia (score = 5) and MI (MI = 49), demonstrating the value of a diagnostic panel rather than a single marker. For pigment, dogs with high pigment had a significantly higher rate of survival (2 of 20 died by 1 year) than dogs with amelanotic or low pigment, but dogs with moderate pigment could not be reliably distinguished from either group with respect to survival. Based on this information, Ki67, nuclear atypia, and MI threshold values performed well at predicting death due to melanoma at 1 year postdiagnosis. It also confirmed that 1 year was a reasonable time point to assess outcome since, overall, only 3 dogs that died of melanoma died more than 1 year after diagnosis.
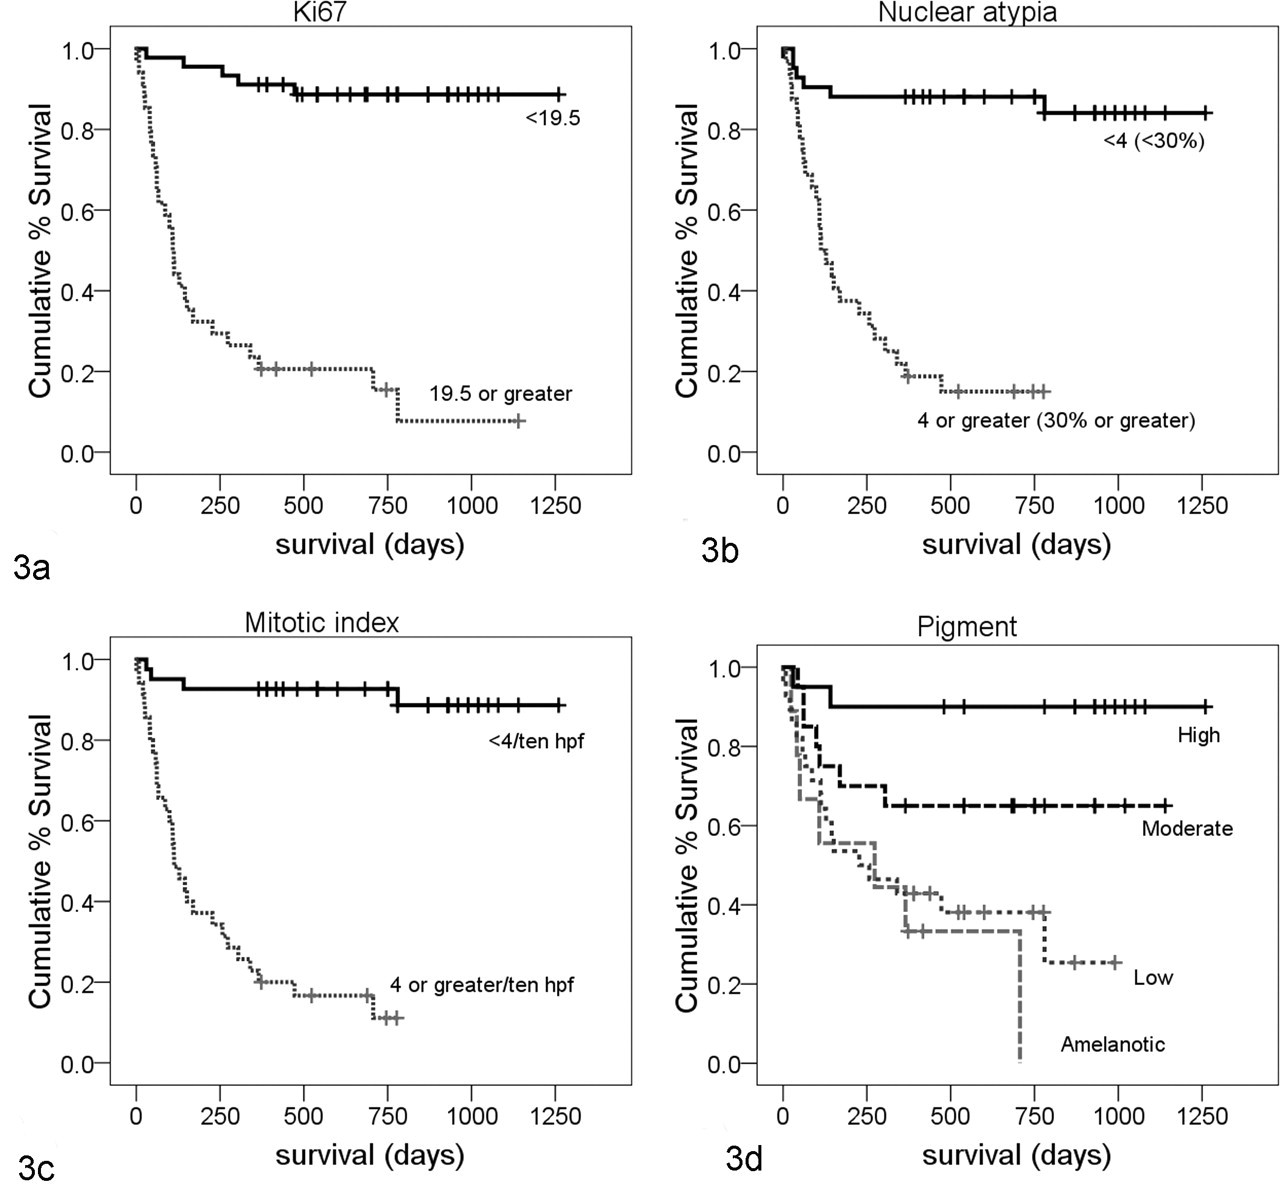
Kaplan-Meier survival curves for dogs with oral melanoma grouped by threshold values for the measured parameters. Deaths represent those due to melanoma at any time point. Censored data are represented by vertical dashes and represent time of last follow-up for dogs that were alive or time of death due to competing (nonmelanoma) cause. Significance was computed by Breslow test (generalized Wilcoxan). (a) Ki67 threshold value ≥19.5, n = 79. Only 5 of 44 dogs with Ki67 <19.5 died of melanoma (4 of these died by 1 year) compared with 29 of 35 dogs with Ki67 ≥19.5 (P < .0001). (b) Nuclear atypia threshold value ≥4 (≥30%), n = 73. Six of 41 dogs with atypia <4 died of melanoma (5 of these by 1 year) compared with 27 of 32 dogs with atypia ≥4 (P < .0001). (c) Mitotic index threshold value ≥4/10 hpf, n = 76. Four of 41 dogs with mitotic index <4 died of melanoma (3 of these by 1 year) compared with 30 of 35 dogs with mitotic index ≥4 (P < .0001). (d) Pigment, classified as amelanotic, low, moderate, or high, n = 77. Only high pigment had a significant difference in survival. Two of 20 dogs with high pigment died of melanoma (both by 1 year) compared with 32 of 57 dogs with low, moderate, or no pigment (P < .0001). Survival for moderate and high pigment grouped together was not significant (P = .055).
Nuclear Atypia
In this study, nuclear atypia was assessed using a semiquantitative decile scale. This is different from the subjective assessment of mild, moderate, or severe that is more typically used in a veterinary diagnostic laboratory. To mimic a more typical diagnostic assessment, nuclear atypia scores were grouped. Scores of 0–3 were considered mild, 4–8 moderate, and 9–10 severe. The ROC analysis was repeated using this 3-point system (Fig. 4) and resulted in an AUC slightly lower but comparable with that obtained with the decile grouping, with a wider confidence interval for the AUC. From this curve, the selected optimal threshold value (maximum sensitivity and specificity) was “moderate,” with sensitivity of 83.9% and specificity of 85.0%. Dogs with nuclear atypia of “moderate” or “severe” were significantly more likely to die by 1 year postdiagnosis than dogs with “mild” atypia (Fig. 5).
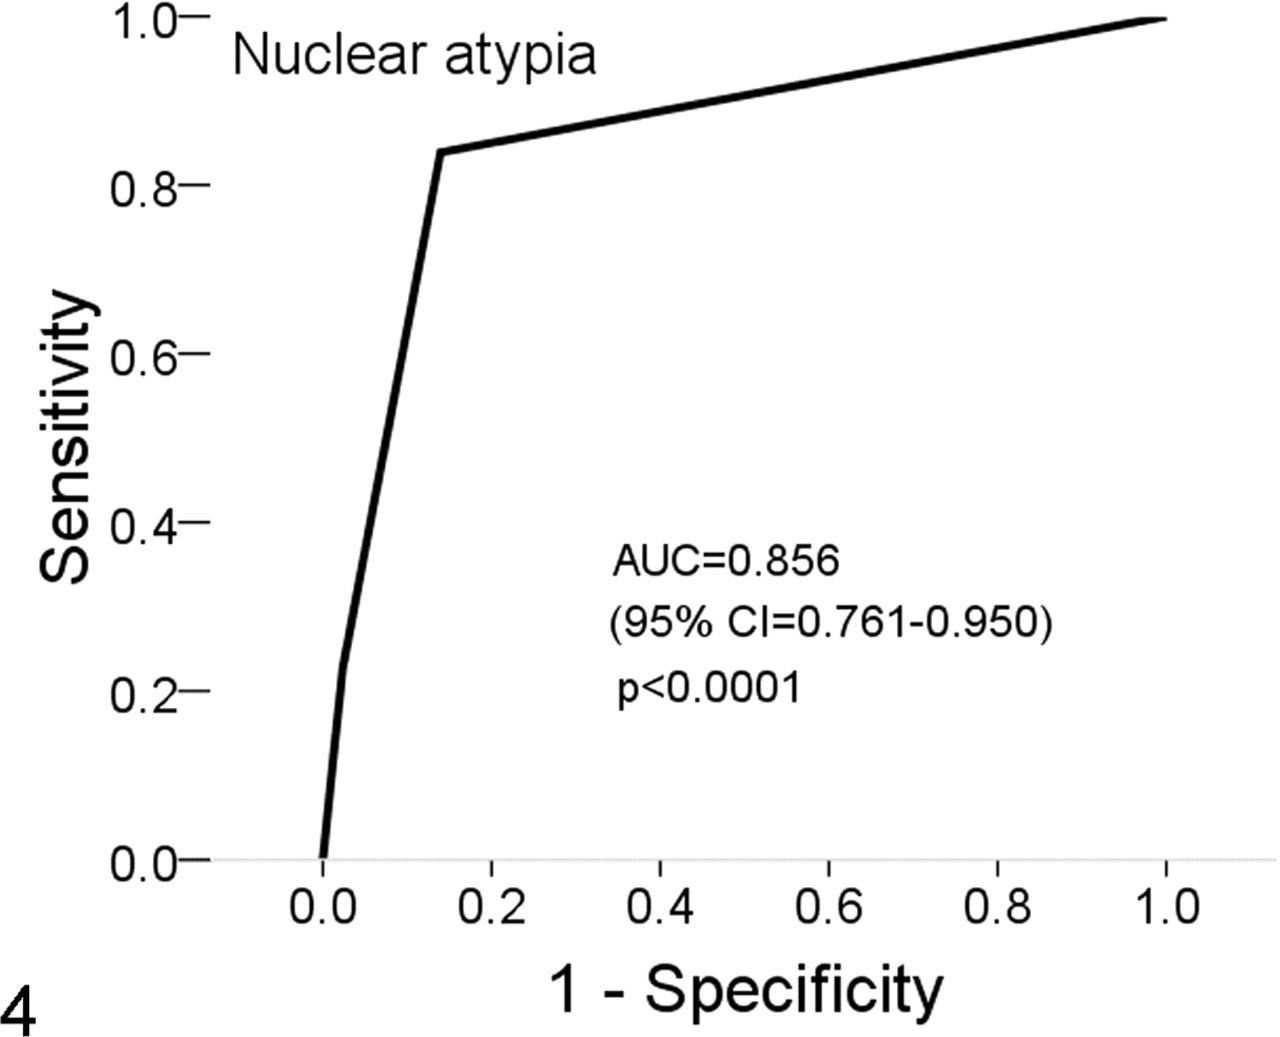
Receiver operating characteristic (ROC) curve for nuclear atypia classified as mild, moderate, or severe in cases of oral melanoma, n = 73. Horizontal lines represent ties between successive values.
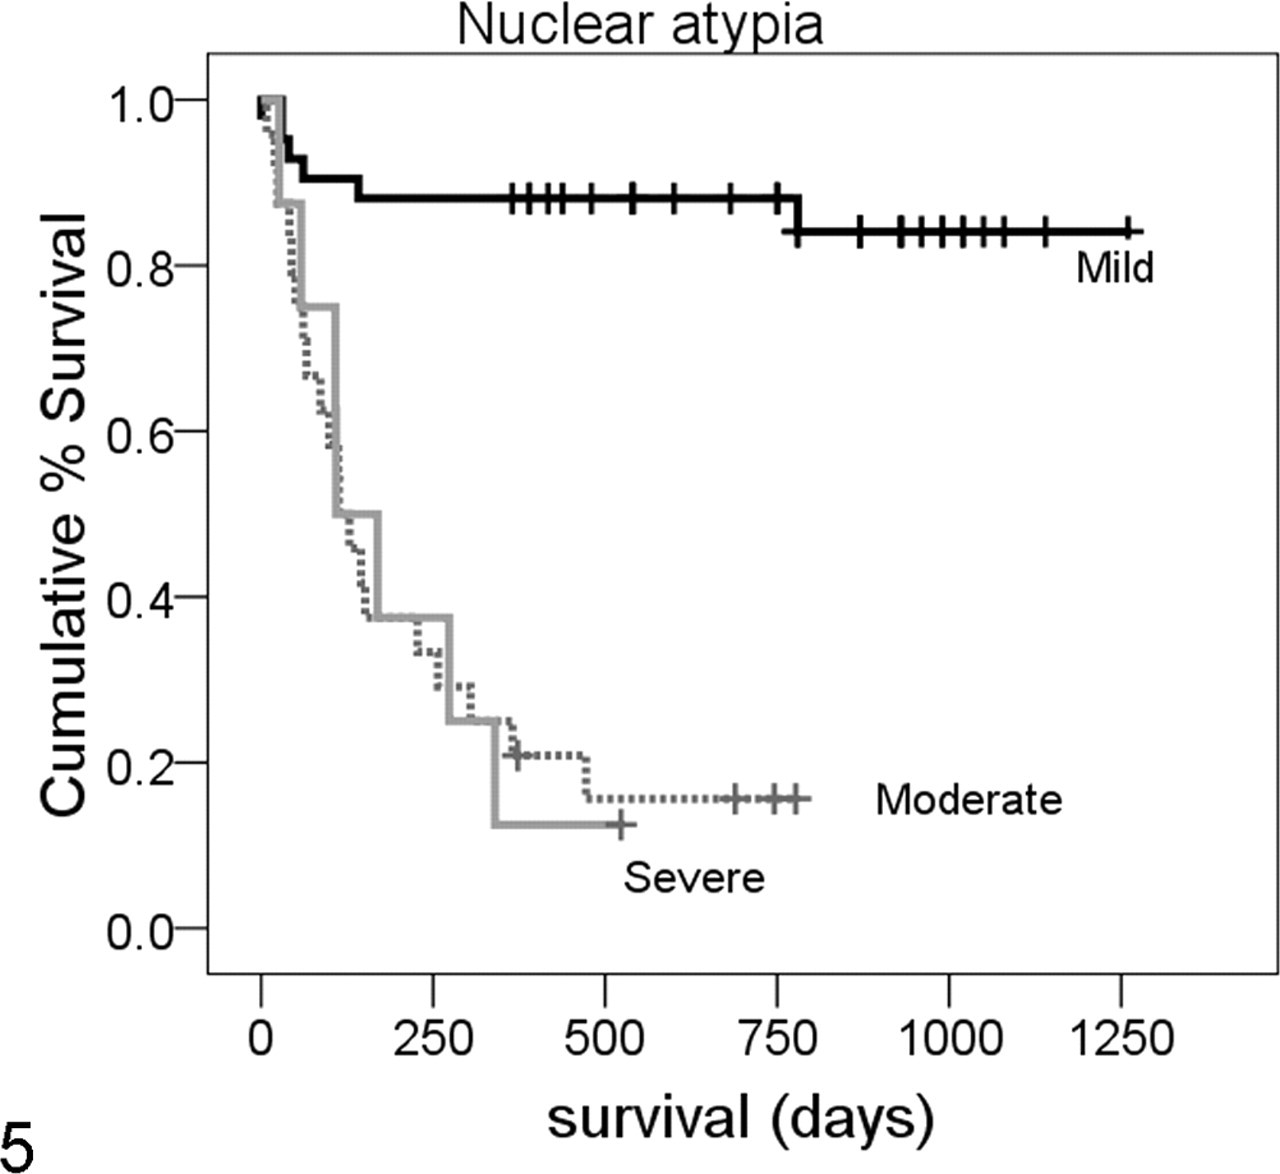
Kaplan-Meyer survival curve for nuclear atypia scores grouped as mild (score 0–3), moderate (score 4–8), or severe (score 9–10), total n = 73. Six of 41 dogs with mild atypia died of melanoma compared with 20 of 24 dogs with moderate atypia and 7 of 8 dogs with severe atypia. Mild atypia was significantly different from moderate and severe atypia (P < .0001), but moderate atypia could not be separated from severe by this method.
Discussion
In this study, we established a diagnostically applicable cutoff or threshold value for prognostic use of Ki67 immunohistochemistry in canine oral melanoma. We also established and evaluated similar threshold values for nuclear atypia, MI, and pigment. We found that Ki67, nuclear atypia, and MI are comparable predictive measures for the evaluation of canine oral melanoma. Pigment, although it has significant inverse correlation with survival, has lower prognostic value except for those cases with very high pigment values (higher survival).
In our study, although nuclear atypia, Ki67, MI, and pigment were each significant individually, nuclear atypia was dominant in a multivariate analysis due to correlation between the variables (inversely for pigment). This does not indicate that evaluation of Ki67 or the other individual parameters is without value. The apparent dominance of nuclear atypia in the multivariate regression may be due in part to the precisely defined criteria and semiquantitative method of classification we used. This method was more time-consuming and cumbersome to apply than the routine diagnostic evaluation of mild, moderate, or severe. Although we attempted to replicate a more subjective assessment by grouping our nuclear atypia values, nuclear atypia defined by different criteria or by a different observer is essentially a different diagnostic test and will have different sensitivity and specificity. In contrast to visually quantifying individual atypical nuclei, Ki67 quantitation by the optical grid method is fairly easily performed (Fig. 6) and may have more interobserver consistency. Future direct comparison of Ki67 and traditional (mild, moderate, severe) nuclear atypia assessment in a separate data set by a separate observer would allow independent validation of this assertion.
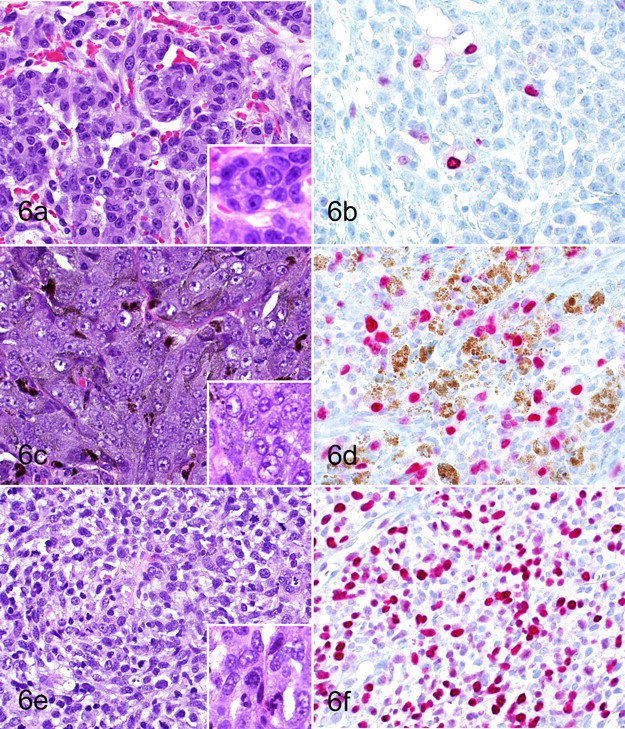
Comparison of nuclear morphology to Ki67 immunolabeling in cases of canine oral melanoma. Canine oral melanomas with low (a), medium (c), and high (e) scores for nuclear morphology are compared with Ki67 immunohistochemically stained sections of the same tumors (b, d, f). (5a, c, e) Hematoxylin and eosin. Original magnification 400×. Insets original magnification 1,000×. (5b, d, f) Ki67 immunohistochemistry. AEC chromagen, hematoxylin counterstain. Melanin pigment (brown) is present in some cells. Original magnification 400×.
The specific threshold values we identified had some differences in comparison to previous studies. In a study 26 using the same histological criteria and a portion of the same case set, the nuclear atypia threshold was ≥5 (≥40%) versus our ≥4 (≥30%), and the MI threshold was ≥14/10 hpf versus our ≥4/10 hpf. Reasons for this disparity could include interobserver variation and varying statistical method (logistic regression and percentage correct classification). In this study, we preferred the use of ROC analysis for determination of threshold values as the percentage correct classification method is more dependent on the population. 6,17,20
The previous data for Ki67 in oral melanoma is limited, and comparison is difficult. In osteocartilaginous melanoma, an empirically determined cutoff of ≥30% (out of 600 nuclei) was reported but not statistically verified. 23 For cutaneous melanoma, a threshold value of 15% (out of 500 cells) was reported. 12 For our grid reticle method, each grid field typically contains between 100 and150 cells, and counting 5 grids would be roughly comparable with counting 500 cells. Out of a mean 125 cells/grid, 19.5 positively staining cells would be equivalent to 15.6%, similar to that reported for cutaneous melanoma. 12
The sensitivities and specificities for the parameters Ki67, nuclear atypia, and MI in our study were similar, ranging between 84 and 90%. Minor variations in sensitivity and specificity do not indicate that one test is inherently superior to another. Depending on the intended purpose, tests of differing sensitivity and specificity may be more appropriate to an individual situation. For example, if the clinical decision is between euthanasia (with a poor prognosis) and watchful waiting (with a favorable prognosis), more emphasis may be placed on results of a high-specificity test (rule-out test) as the consequences of a false-positive are worse than a false-negative. If a decision to pursue adjunct therapy is based on increased likelihood of malignant behavior, more weight may be placed on a higher sensitivity test (screening test) as the false-negative may be more harmful. For these reasons, consideration of a panel of prognostic parameters (histological and immunohistochemical) in combination with the clinical features provides broader information on which to base clinical decisions.
There were cases in this study for which the Ki67 index would have incorrectly predicted the outcome at 1 year. The specific histories for these false-positive and false-negative cases are given in Table 7 . For some cases, clear confounding factors can be identified. Of the false-negative results, 4 of 4 dogs had recurrence within 30 days of the initial surgery. For case 24, it was noted that the dog also had diabetes, which may have influenced the euthanasia decision. In cases 1 and 8, although the Ki67 index was <19.5, the other evaluated parameters suggested more aggressive behavior, illustrating the utility of a prognostic panel. For the false-positives, Ki67 appears to correctly predict the eventual aggressive disease course for cases 35 and 80, despite the fact that the study criteria for survival at 1 year were met. Both dogs had initial recurrence by 1 year postdiagnosis and were treated with additional surgery. In the remaining false-positive cases, Ki67 values truly are discordant with the case outcome, particularly in case 74, which also has a very high MI and nuclear atypia values. This illustrates that tumor growth fraction does not correlate with outcome in every case of canine oral melanoma, and other factors, such as apoptotic fraction, may affect progression.
Data From Cases Incorrectly Classified by Ki67 Index
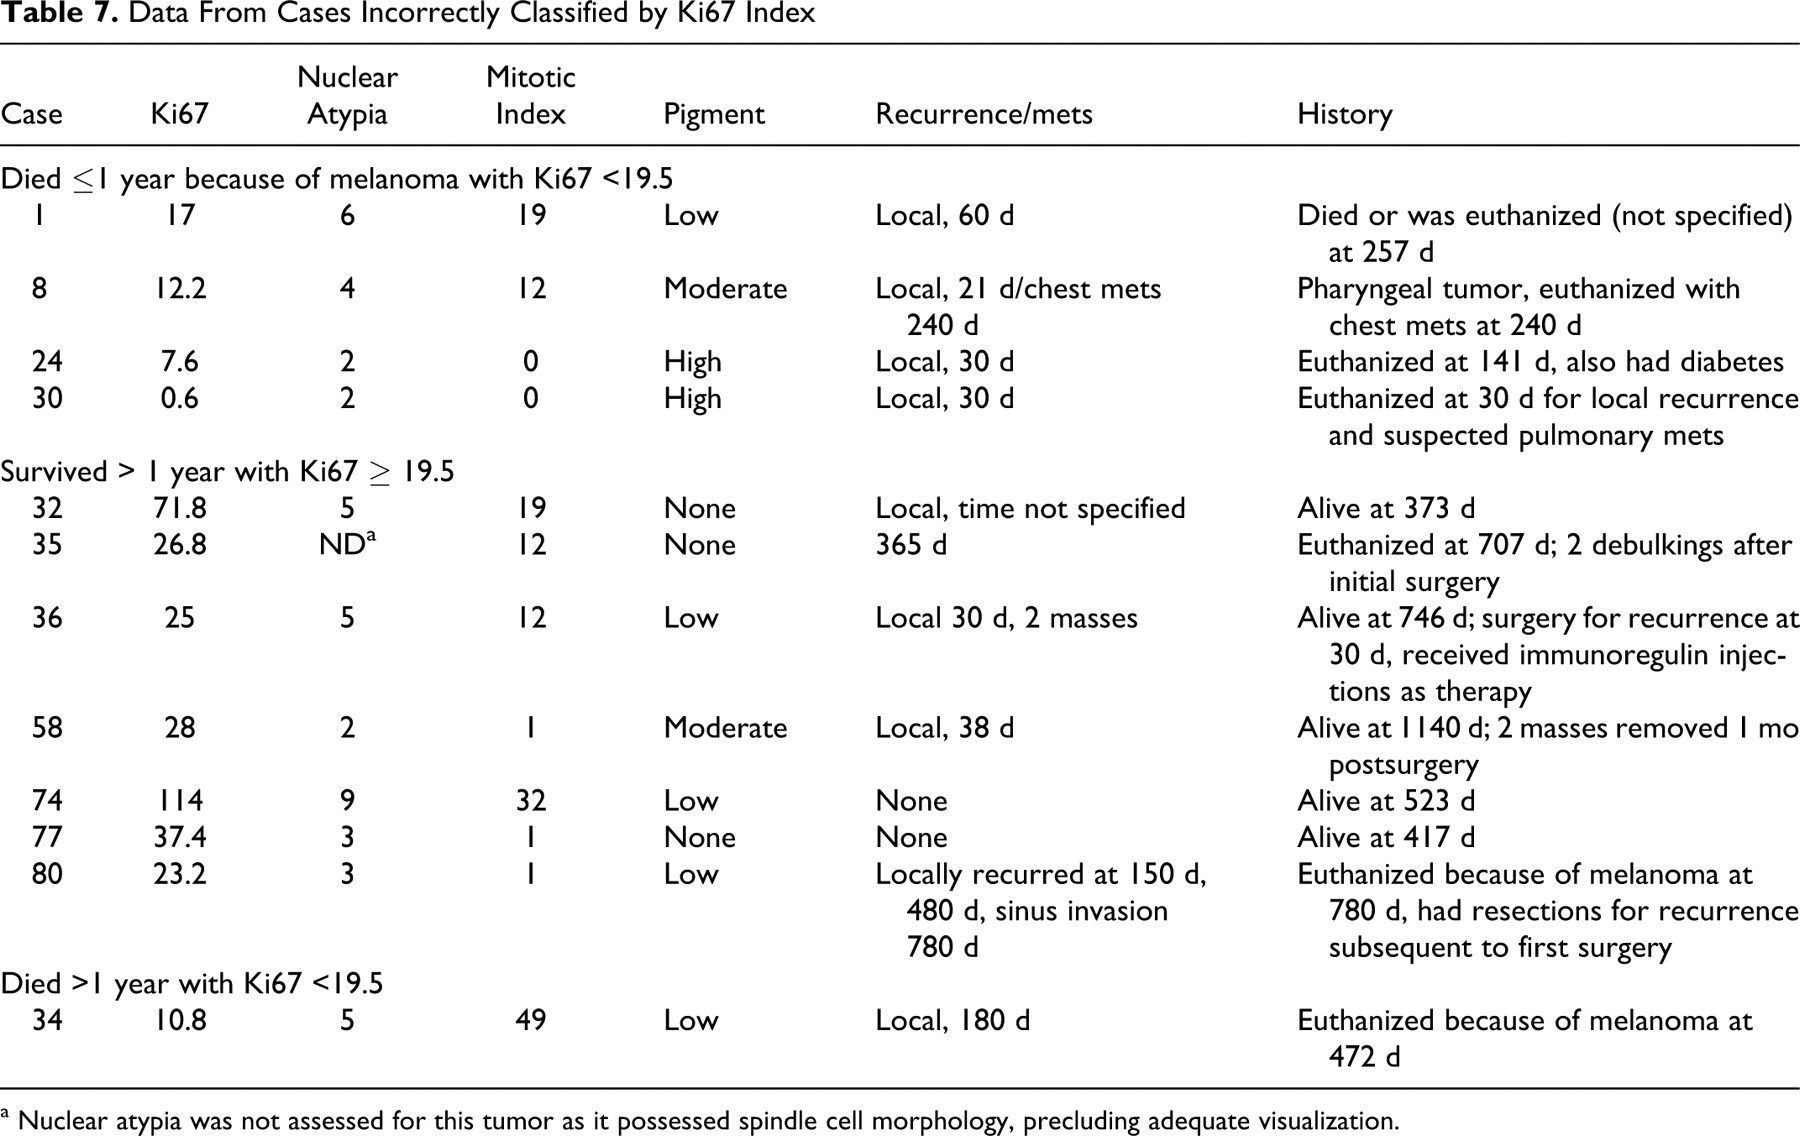
a Nuclear atypia was not assessed for this tumor as it possessed spindle cell morphology, precluding adequate visualization.
In recognition of the above, we prefer the term threshold value rather than cutoff value in reference to the Ki67 index of 19.5. The sensitivity and specificity for the selected Ki67 value reflect the likely outcome for the population of dogs with a higher or lower value, not the definitive result for an individual dog. Because of the inherent dilemma of applying a dichotomous decision point to a continuous variable, we recommend that the Ki67 index value of ≥19.5 be used as a decision threshold in correlation with all other clinical and histological assessments for a given case. If the information is in conflict, the parameters and clinical findings should be reviewed and clinical decisions made based on the specifics of the individual case. Additional potential uses for the Ki67 index and other prognostic parameters include the critical, evidence-based evaluation of potential adjunct therapies. For example, comparison of the Ki67 index in dogs with melanoma receiving adjunct treatments versus dogs with no postdiagnosis treatment may reveal that a low Ki67 index predicts long-term survival irrespective of treatment applied. In this study, 1 dog that had received immunoregulin injections (case 36) remained alive at 746 days despite relatively high Ki67, nuclear atypia, and MI values, although this finding cannot be evaluated further in this study design.
In summary, we find that the Ki67 index of oral canine melanocytic tumors is easily measured in a veterinary diagnostic laboratory setting and is a semiquantitative, objective test of high sensitivity and specificity with respect to case outcome. The addition of Ki67 to the standard histological evaluation and clinical staging of canine oral melanoma may provide corroboration of other, potentially more subjective, evaluated parameters.
Footnotes
Acknowledgements
We thank Mr Thomas Wood and the staff of the histology laboratory at the Diagnostic Center for Population and Animal Health at Michigan State University for performing immunohistochemistry. In addition, we thank the submitting veterinarians and their clients for providing case follow-up information.
The authors declared that they had no conflicts of interest with respect to their authorship or the publication of this article.
This project was funded by the Marilyn and Ron Palleschi Fund for Canine Health within the Companion Animal Fund program at Michigan State University, grant 81-3214-A.