
Abstract
Congenital generalized lipodystrophy (CGL) comprises a heterogeneous group of rare diseases associated with partial or total loss of adipose tissue. Of these, autosomal recessive Berardinelli–Seip congenital lipodystrophy (BSCL) is characterized by the absence of metabolically active subcutaneous and visceral adipose tissues. Metabolic abnormalities associated with lipodystrophy include insulin resistance, hypertriglyceridemia, hepatic steatosis, and diabetes. One form of BSCL has been linked to genetic mutations affecting the lipid biosynthetic enzyme 1-acyl-sn-glycerol 3-phosphate O-acyltransferase 2 (AGPAT2), which is highly expressed in adipose tissue. Precisely how AGPAT2 deficiency causes lipodystrophy remains unresolved, but possible mechanisms include impaired lipogenesis (triglyceride synthesis and storage), blocked adipogenesis (differentiation of preadipocytes to adipocytes), or apoptosis/necrosis of adipocytes. Agpat2 –/– mice share important pathophysiologic features of CGL previously reported in humans. However, the small white adipose tissue (WAT) depots consisting largely of amoeboid adipocytes with microvesiculated basophilic cytoplasm showed that adipogenesis with deficient lipogenesis was present in all usual locations. Although well-defined lobules of brown adipose tissue (BAT) were present, massive necrosis resulted in early ablation of BAT. Although necrotic or apoptotic adipocytes were not detected in WAT of 10-day-old Agpat2–/– , the absence of adipocytes in aged mice indicates that these cells must undergo necrosis/apoptosis at some point. Another significant finding in aged lipodystrophic mice was massive pancreatic islet hypertrophy in the face of chronic hyperglycemia, which suggests that glucotoxicity is insufficient by itself to cause β-cell loss and that adipocyte-derived factors help regulate total β-cell mass.
Keywords
The congenital lipodystrophies comprise a heterogeneous group of rare diseases that are associated with partial or total absence of adipose tissue. 17 Of these, Berardinelli–Seip congenital lipodystrophy (BSCL) is an autosomal recessive disorder characterized by a generalized loss of metabolically active subcutaneous and visceral adipose tissues. Significant metabolic abnormalities are associated with the decreased adipose tissue mass in patients with all forms of congenital generalized lipodystrophy (CGL). These include severe insulin resistance, hypertriglyceridemia, and hepatic steatosis, 45 which are accompanied by markedly reduced serum levels of adipose-derived hormones (sometimes referred to as adipokines), such as adiponectin and leptin. 23 Affected humans usually develop insulin-resistant lipoatrophic diabetes during adolescence. 53
BSCL has been linked to genetic mutations affecting 2 proteins: the lipid biosynthetic enzyme 1-acyl-sn-glycerol 3-phosphate O-acyltransferase 2 (AGPAT2) in type 1 CGL2 and the integral endoplasmic reticulum membrane protein seipin in type 2 CGL. 35 The AGPAT2 enzyme represents 1 of at least 10 isoforms of AGPAT, all of which have different tissue expression profiles. 2,3,5,20,36,47,48 The AGPAT2 enzyme (also known as lysophosphatidic acid acyltransferase) is most highly expressed in adipose tissue, 2 where it catalyzes the acylation of lysophosphatidic acid to phosphatidic acid (which is an essential precursor in the biosynthesis of triacylglycerol and phospholipids). 30,32
Mouse models with lipid disorders have provided important insights into the pathogenetic role of adipocytes in the development of insulin resistance and diabetes and in the processes of adipocyte differentiation. 6 For example, excessive adipose tissue contributes to the development of severe insulin resistance and diabetes in obese leptin-deficient ob/ob and leptin receptor–deficient db/db mice. Interestingly, mice that lack white adipose tissue (WAT), such as the transgenic A-ZIP/F mouse—Tg(AZIP/F)1Vsn—also develop severe insulin resistance and diabetes, associated with hepatic steatosis, increased triglycerides and free fatty acids, and decreased leptin levels. 40,46 It seems paradoxical that similar adverse metabolic complications such as insulin resistance, type 2 diabetes mellitus, dyslipidemia, and hepatic steatosis develop in association with either too much adipose tissue (obesity) or too little (lipoatrophy). 18 In humans, the inability of absent or dysfunctional adipocytes to synthesize and store triglycerides can divert excess free fatty acids to liver and skeletal muscle, resulting in the characteristic features of hepatic steatosis and severe insulin resistance. However, the similarity of metabolic disturbances seen with obesity and lipodystrophy suggests that adipose tissue has functions other than merely that of storing energy in the form of triglycerides during periods of energy excess and releasing stored energy as free fatty acids and glycerol during periods of fasting. Rodent models have helped to establish the important role of adipose tissue–derived hormones or adipokines (eg, leptin, adiponectin, tumor necrosis factor α, interleukin 6, and resistin) in regulating energy homeostasis and intermediary metabolism by a variety of endocrine, autocrine, and paracrine effects. 39 Reduced levels of adipokines as the result of lipodystrophy appear to contribute to the metabolic and pathologic abnormalities that develop in CGL patients. 25
In this report, we show that Agpat2 –/– mice share important pathophysiologic features of CGL previously reported in humans and other rodent models, such as severe lipodystrophy affecting WAT and brown adipose tissue (BAT), extreme insulin resistance, diabetes, and hepatic steatosis. Our findings support and extend those of a recent report describing Agpat2 –/– mice, 10 which showed generalized lipodystrophy, extreme insulin resistance, diabetes and hepatic steatosis. The precise mechanisms by which AGPAT2 deficiency causes lipodystrophy remain unresolved, but proposed mechanisms include impaired triglyceride synthesis and storage, as well as failure of adipocyte differentiation from precursors. 15 Our findings in 10-day-old Agpat2 –/– mice confirm that triglyceride synthesis is impaired, but they also show that adipocytes differentiate and proliferate in all usual locations. Nevertheless, the volume of resulting white and mixed adipose tissue is minimal, consisting mostly of individual and small clusters of abnormal “amoeboid” adipocytes. Although necrotic or apoptotic adipocytes were rare in WAT of 10-day-old Agpat2 –/–, the complete absence of adipocytes in aged mice indicates that WAT lipodystrophy is the result of adipocyte loss rather than the mere absence of triglyceride storage. In contrast, the massive necrosis of metabolically active BAT adipocytes clearly demonstrates that adipocyte destruction is the dominant pathogenetic process involved in the loss of BAT. The additional finding of severe islet hypertrophy might be considered an expected physiologic response to insulin resistance in mice; however, we did not observe islet hypertrophy until later stages of disease, when adipocytes were absent, and long after the development of severe hyperglycemia in Agpat2 –/– mice. Taken together, these findings suggest that adipocyte-derived factors may be involved in regulating total islet cell mass in mice. Furthermore, the development of massive islets in Agpat2 –/– mice in the face of chronic severe hyperglycemia suggests that glucotoxicity alone is insufficient to cause β-cell loss. Further studies utilizing Agpat2 –/– mice should provide valuable insights into the metabolic and hormonal roles of adipose tissue in the development of insulin resistance and type 2 diabetes mellitus. This model may also prove useful in discovering new therapeutic approaches that will treat these disorders by increasing the proliferation or survival of pancreatic β cells.
Materials and Methods
Generation of Agpat2 Knockout Mice
Homozygous Agpat2-null mice were generated by a gene-trapping method. 55 The Lexicon OmniBank embryonic stem cell clone OST438470 was selected for microinjection based on sequence similarity to the mouse Agpat2 gene (accession No. NM_026212). The genomic insertion site of the gene trap vector in OST438470 was determined by inverse polymerase chain reaction (PCR; Fig. 1 ). 55 Mice carrying this mutation were generated with standard methods of host embryo microinjection of embryonic stem cells, chimera production, and germ-line transmission. 55 Targeted and gene-trapped embryonic stem cell clones were microinjected into C57BL/6-Tyr c-Brd (albino) blastocysts to generate chimeric animals, which were bred to C57BL/6-Tyr c-Brd (albino) females, and the resulting heterozygous offspring were interbred to produce homozygous gene-deficient mice. Knockout F2 mice used in phenotyping studies were produced by intercrossing the F1 heterozygous knockout (–/+) offspring of chimeric founder parents. Using the albino variant of C57BL/6 permits simple visual recognition of chimeric offspring 56 because they have dark eyes and patches of dark hair that derive from stem cells from the agouti 129S5/SvEvBrd. Genotypes of offspring were determined by quantitative PCR as previously described. 22 Expression analysis was performed using standard methods, 1,55 and animal genotypes were determined by quantitative PCR. 22
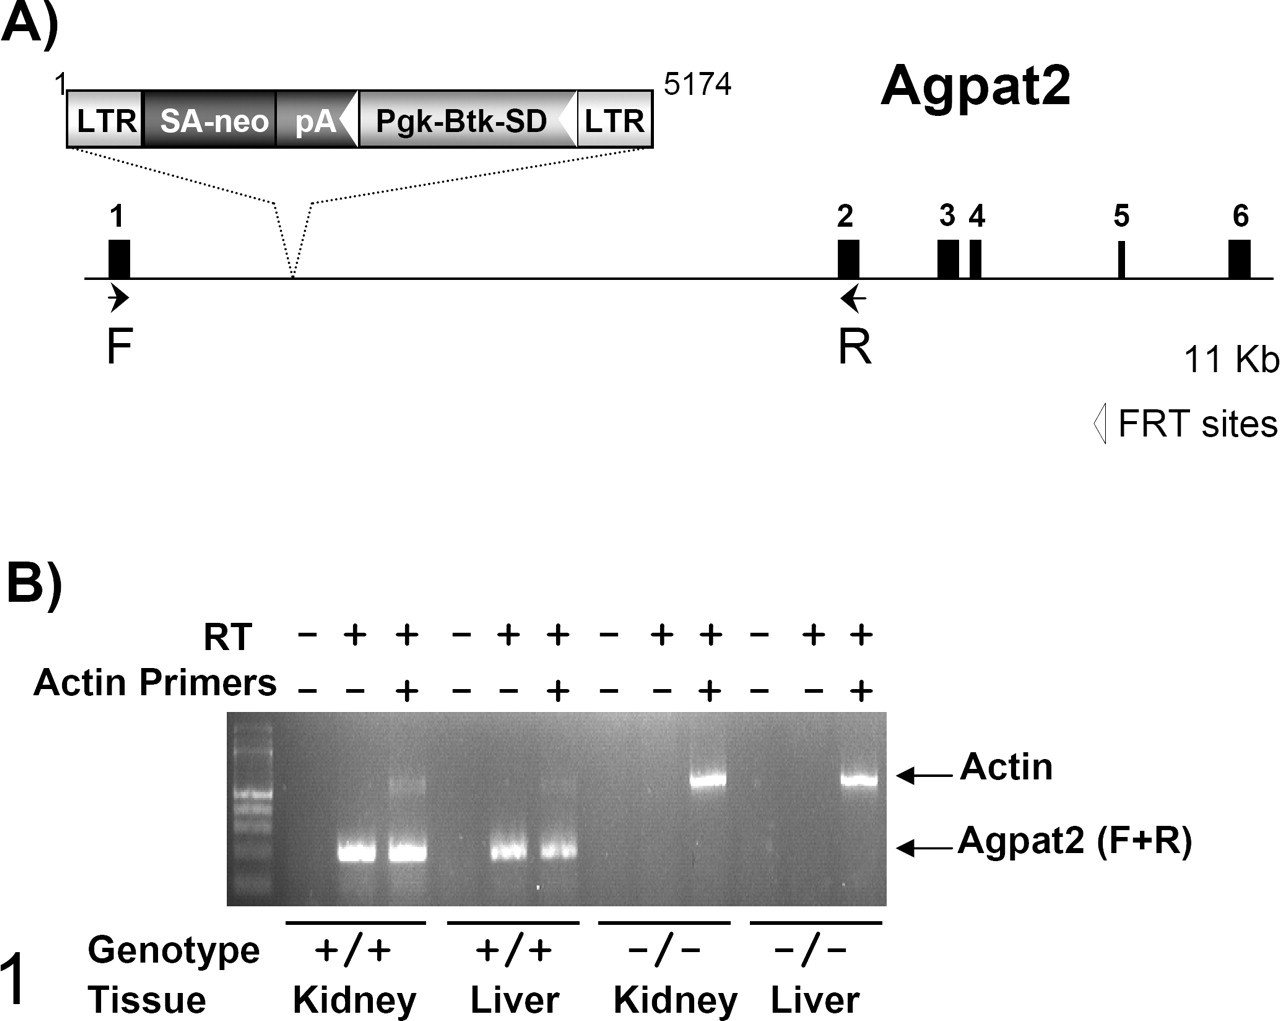
Generation of Agpat2 mutant mice. A, gene trap mutation of the Agpat2 gene. Retroviral gene trap vector VICTR48 (accession No. EU676804) was used to generate OmniBank clone OST438470, which contains an insertion within the first intron of the Agpat2 gene (NM_026212). LTR, viral long terminal repeat; SA, splice acceptor sequence; neo, neomycin phosphotransferase gene; pA, polyadenylation sequence; Pgk, phosphoglycerate kinase 1 promoter; Btk-SD, Bruton’s tyrosine kinase splice donor sequence. (B) Reverse transcription polymerase chain reaction expression analysis of Agpat2 transcript. Endogenous Agpat2 transcript was detected in the kidney and spleen of wild type (+/+) mice. No endogenous Agpat2 transcript was detected in homozygous (–/–) tissues. Primers 5′-CGCACAGCCAGGTTCTACGCCAAG-3′ (forward) and 5′-CCTCCAGTTTCTTCTGTCCGCTGAC-3′ (reverse) are complementary to Agpat2 exons 1 and 2, respectively, and amplify a product of 199 nucleotides. Reverse transcription polymerase chain reaction analysis using primers (actin) complementary to the mouse beta actin gene (accession No. M12481) was performed in the same reaction as an internal amplification control.
Histopathology
Full necropsies of Agpat2 –/– mice were completed on 4 one-week-old pups and 3 mature adult mice (78, 91, and 94 weeks of age), with similar numbers of age-matched wild-type control mice. All tissues collected from knockout and control mice were immersion fixed in 10% neutral buffered formalin, except eyes, which were fixed for 24 hours in Davidson’s fixative. All tissues were embedded in paraffin, sectioned at 4 μm, mounted on positively charged glass slides (Superfrost Plus, Fisher Scientific, Pittsburgh, PA), and stained with hematoxylin and eosin (HE) for histopathologic examination. Immunohistochemistry staining for insulin and glucagon was completed on the pancreas only, whereas staining for perilipin was performed on all tissues. For immunohistochemistry, anti-insulin or anti-glucagon antibodies (Abcam Inc, Cambridge, MA) were diluted 1:1000 in phosphate buffered saline (PBS) and applied for 1 hour to separate serial sections of pancreas. After rinsing, sections were incubated for 1 hour with biotinylated rabbit anti-rat immunoglobulin G secondary antibody (Vector Laboratories, Burlingame, CA) diluted 1:400 in PBS. For detection of perilipin, antigen retrieval was performed in citrate buffer at 98°C in a pressure cooker for 30 minutes; nonspecific antibody binding was blocked with Super Block (ScyTek Laboratories, Logan, UT). Guinea pig anti-perilipin polyclonal antibody (Progen, Cambridge, MA) was diluted 1:100 in PBS and applied for 1 hour to tissue sections. After rinsing, sections were incubated for 1 hour with horseradish peroxidase–tagged donkey anti-guinea pig immunoglobulin G secondary antibody (Jackson ImmunoResearch, West Grove, PA) diluted 1:300 in PBS. Detection of bound secondary antibodies was performed with Vector Elite ABC Kit (PK-6100) or with Ultravison Plus Detection System (Thermo Scientific, Kalamazoo, MI) respectively, with 3,3′-diaminobenzidine as chromogenic substrate and a light hematoxylin counterstain.
Glucose, Insulin, and Glucose Tolerance Test
As a result of the increased mortality of neonates, serial blood glucose and insulin levels were measured, and oral glucose tolerance tests completed, on a limited number of knockout mice that were available for testing. Small numbers of 1-day-old mice were euthanized to determine fed whole blood glucose concentrations (Agpat2 –/–, n = 2; Agpat2 +/–, n = 12; Agpat2 +/+, n = 10) and serum insulin concentrations (Agpat2 –/–, n = 2; Agpat2 +/–, n = 5; Agpat2 +/+, n = 5) in neonates. Similarly; terminal bleeds from 1-week-old mice were obtained to determine fed blood glucose (Agpat2 –/–, n = 7; Agpat2 +/–, n = 27; Agpat2 +/+, n = 12) and serum insulin concentrations (Agpat2 –/–, n = 7; Agpat2 +/–, n = 10; Agpat2 +/+, n = 10). Body weights were recorded before each bleed. Whole blood glucose concentrations were measured with an Accuchek Aviva glucometer (Roche Diagnostics, Indianapolis, IN). Serum insulin concentrations were measured by ELISA (Ultra-Sensitive Rat Insulin ELISA, Crystal Chem Inc, Downers Grove, IL), according to manufacturer’s instructions. A third group of mice (Agpat2 –/–, n = 4; Agpat2 +/–, n = 4; Agpat2 +/+, n = 3) maintained on chow diet (Mouse Diet 9F, LabDiet 5020, PMI, Richmond, IN) were monitored weekly from 4 weeks old to 11 weeks old for body weight and whole blood glucose concentrations. Fasting plasma triglycerides (L-Type TG H Kit, Wako Diagnostics, Richmond, VA) and total plasma cholesterol (Cholesterol E Kit, Wako Diagnostics) were measured in these mice at 12 to 13 weeks of age using blood collected via retro-orbital sinus. Oral glucose tolerance tests were performed on mice at 12 and 24 weeks of age; for these tests, mice were fasted overnight (18 hours), with their cages placed on a heat blanket the morning of the procedure. A baseline blood sample (75 μl) was collected via tail vein and assayed for glucose and insulin as described above. Mice were then gavaged with 2 g/kg glucose (20% glucose solution). Blood was collected again from the tail vein at 30 minutes (for glucose and insulin) and 60 minutes (glucose only). Total glucose area under the curve from 0 to 60 minutes was calculated by trapezoidal method (GraphPad Prism 4.03, GraphPad Software, La Jolla, CA). A HOMA-R value (homeostasis model assessment for insulin resistance) was calculated from fasting glucose and fasting insulin concentrations. 38 Hemoglobin A1c concentrations were measured on whole blood samples (5 μl collected via tail vein) at 15 and 60 weeks of age on a Cobas Integra 400 analyzer (Roche Diagnostics, Indianapolis, IN).
Results
Agpat2 –/– mice were produced according to expected Mendelian ratios; however, high mortality in neonates resulted in most Agpat2 –/– mice dying during the first 2 weeks of life. The cause of death was not determined in these pups, and tissues from early deaths were not collected for pathologic examination. Agpat2 –/– mice that survived past weaning were generally smaller than littermate controls (Fig. 2 ), and relatively few survived to 3 months of age, because of continued high mortality rates after weaning (data not shown).
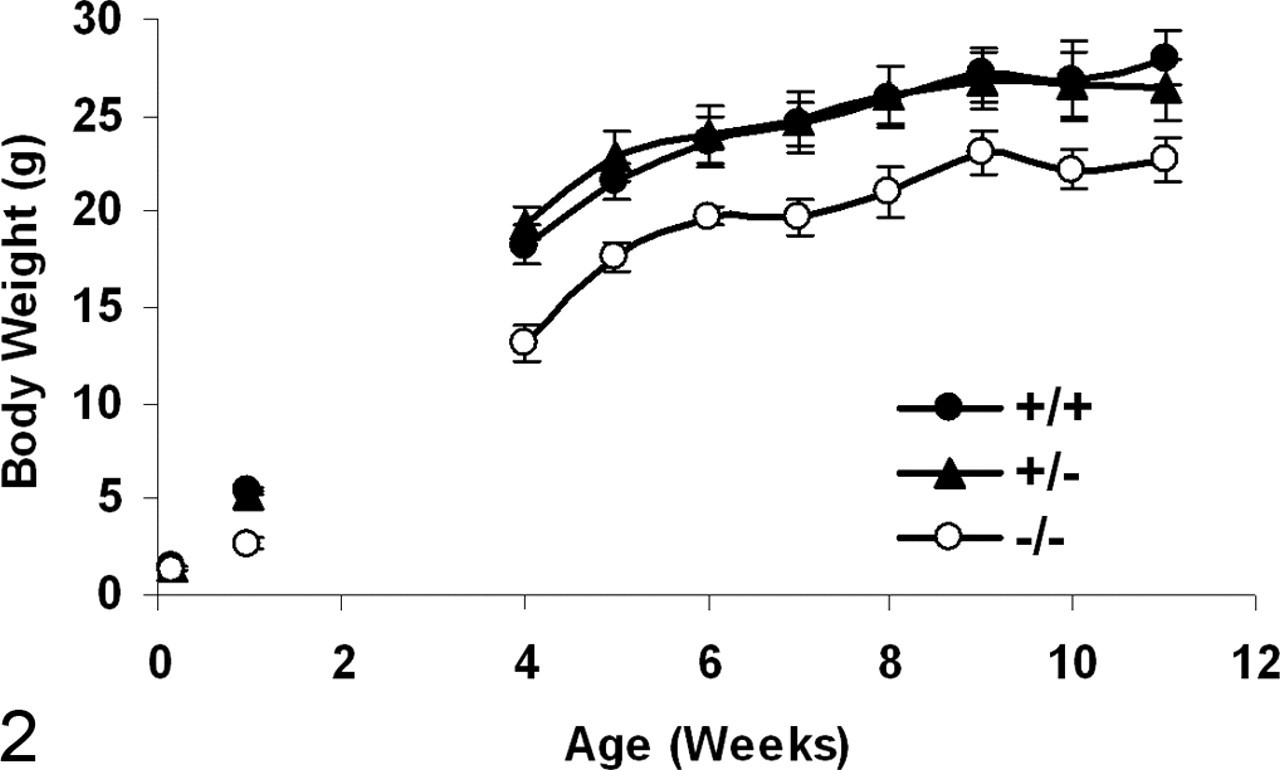
Body weight (mean ± SEM, g) of Agpat2 –/– (ˆ), Agpat2 +/+ (•), and Agpat2 +/– (▴) mice at birth (–/–, n = 2; +/–, n = 12; +/+, n = 10), at 1 week of age (–/–, n = 7; +/–, n = 27; +/+, n = 12), and from 5 through 11 weeks of age (–/–, n = 4; +/–, n = 4; +/+, n = 3).
Insulin, Glucose, and Glucose Tolerance Test
Hyperglycemia in the fed state was evident in Agpat2 –/– mice by 1 week of age (Fig. 3 ). Between 5 and 11 weeks of age, the average fed blood glucose concentration of Agpat2 –/– mice was 435 ± 15 mg/dl, approximately 3-fold greater than that of Agpat2 +/– mice (140 ±3 mg/dl) and Agpat2 +/+ mice (145 ±3 mg/dl) (Fig. 3). Chronic hyperglycemia was confirmed by elevated HbA1c concentrations in young and old Agpat2 –/– mice (Fig. 4 ). High serum insulin concentrations (fed state) were evident in mutant mice beginning at birth (Fig. 5 ).
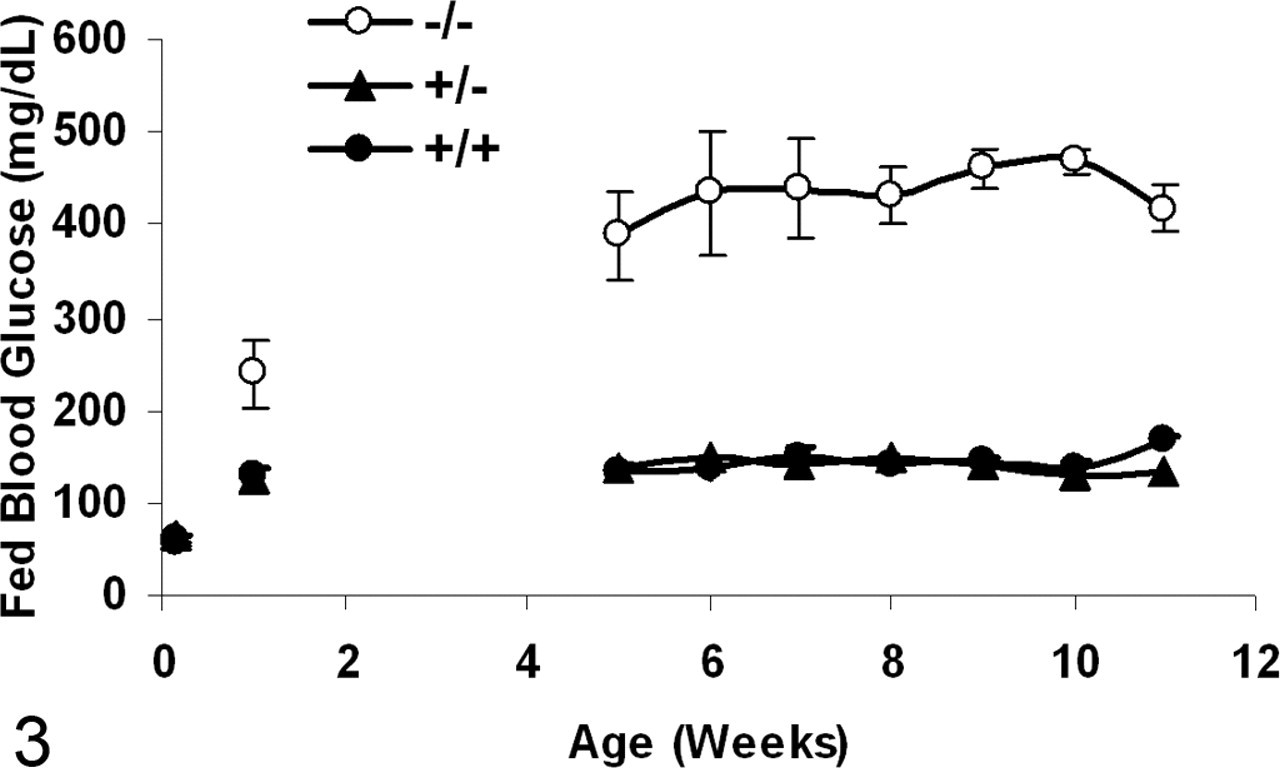
Fed blood glucose concentrations (mean ± SEM, mg/dl) in Agpat2 –/– (ˆ), Agpat2 +/– (▴), and Agpat2 +/+ (•) mice at birth (–/–, n = 2; +/–, n = 12; +/+, n = 10), at 1 week of age (–/–, n = 7; +/–, n = 27; +/+, n = 12), and from 5 through 11 weeks of age (–/–, n = 4; +/–, n = 4; +/+, n = 3).
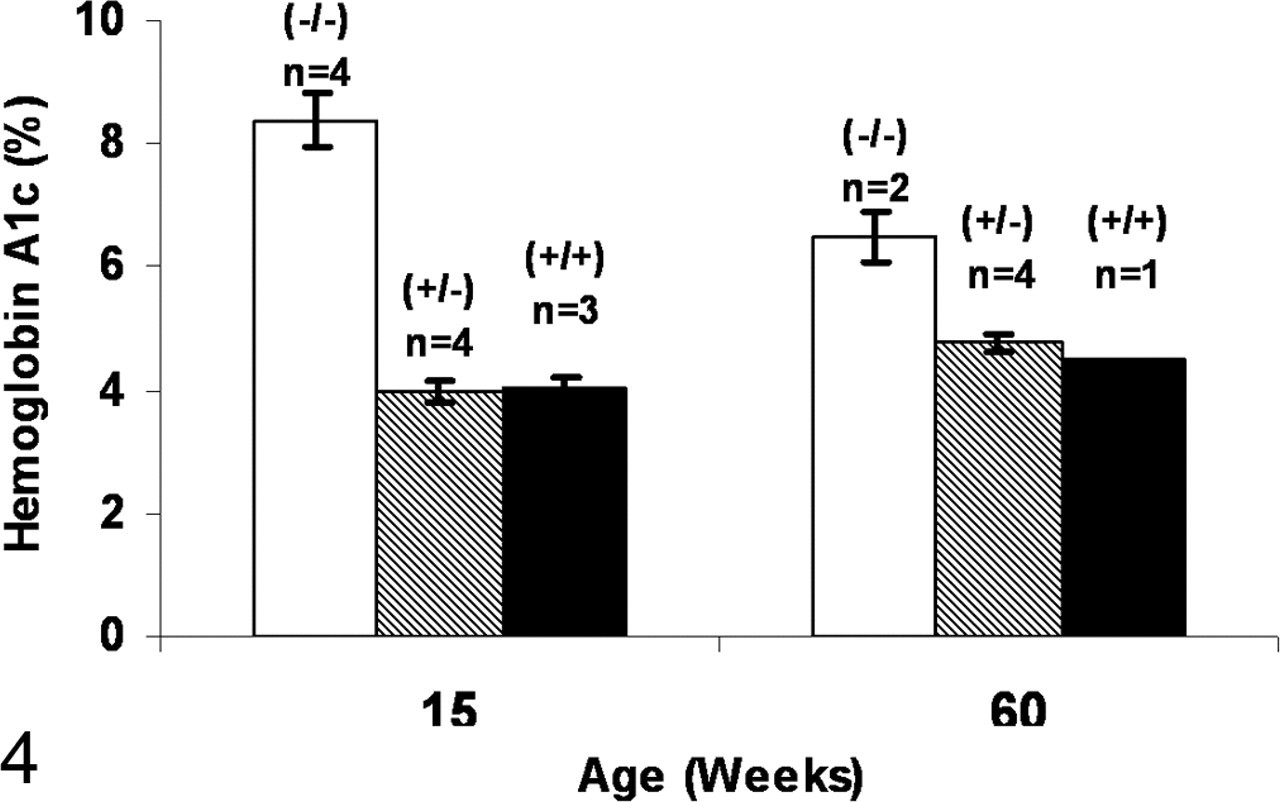
Hemoglobin A1c concentrations (mean ± SEM, %) in Agpat2 –/– (open bar), Agpat2 +/– (hashed bar), and Agpat2 +/+ (black bar) mice at 15 and 60 weeks of age.
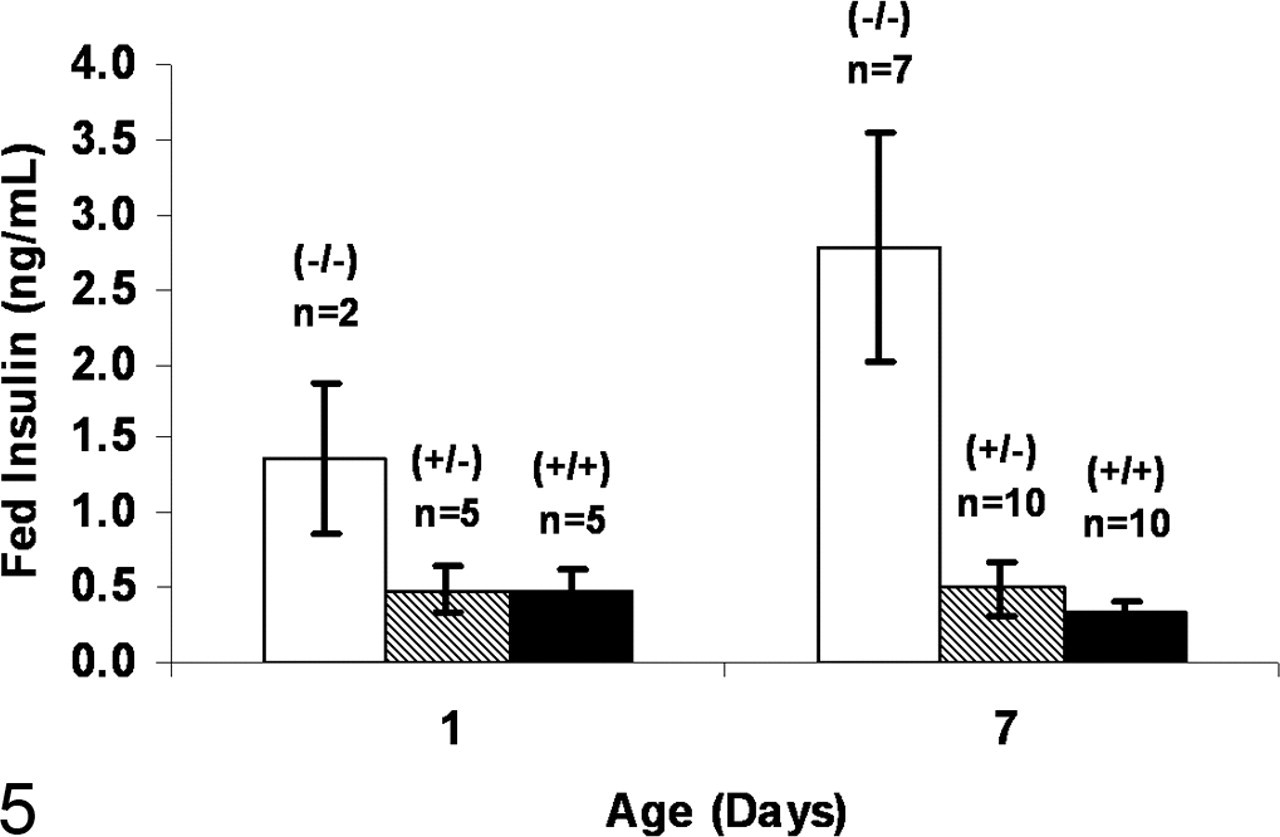
Fed serum insulin concentrations (mean ± SEM, ng/ml) in Agpat2 –/– (open bar), Agpat2 +/– (hashed bar), and Agpat2 +/+ (black bar) mice at 1 and 7 days of age.
Although fasting and postchallenge blood glucose concentrations tended to be higher in Agpat2 –/– mice in the glucose tolerance test than in wild-type control mice, the differences were not statistically significant (Table 1 ). However, insulin concentrations were significantly elevated in the fasting state and 30 minutes following oral glucose challenge in 12- and 24-week-old Agpat2 –/– mice (Table 1). HOMA-R value, a calculation of insulin resistance, also tended to be greater in Agpat2 –/– mice.
Comparison of Blood Measures in 12- and 24-Week-Old Agpat2 -/-, Agpat2 +/ -, and Agpat2 +/+ Mice: Mean ± SEM
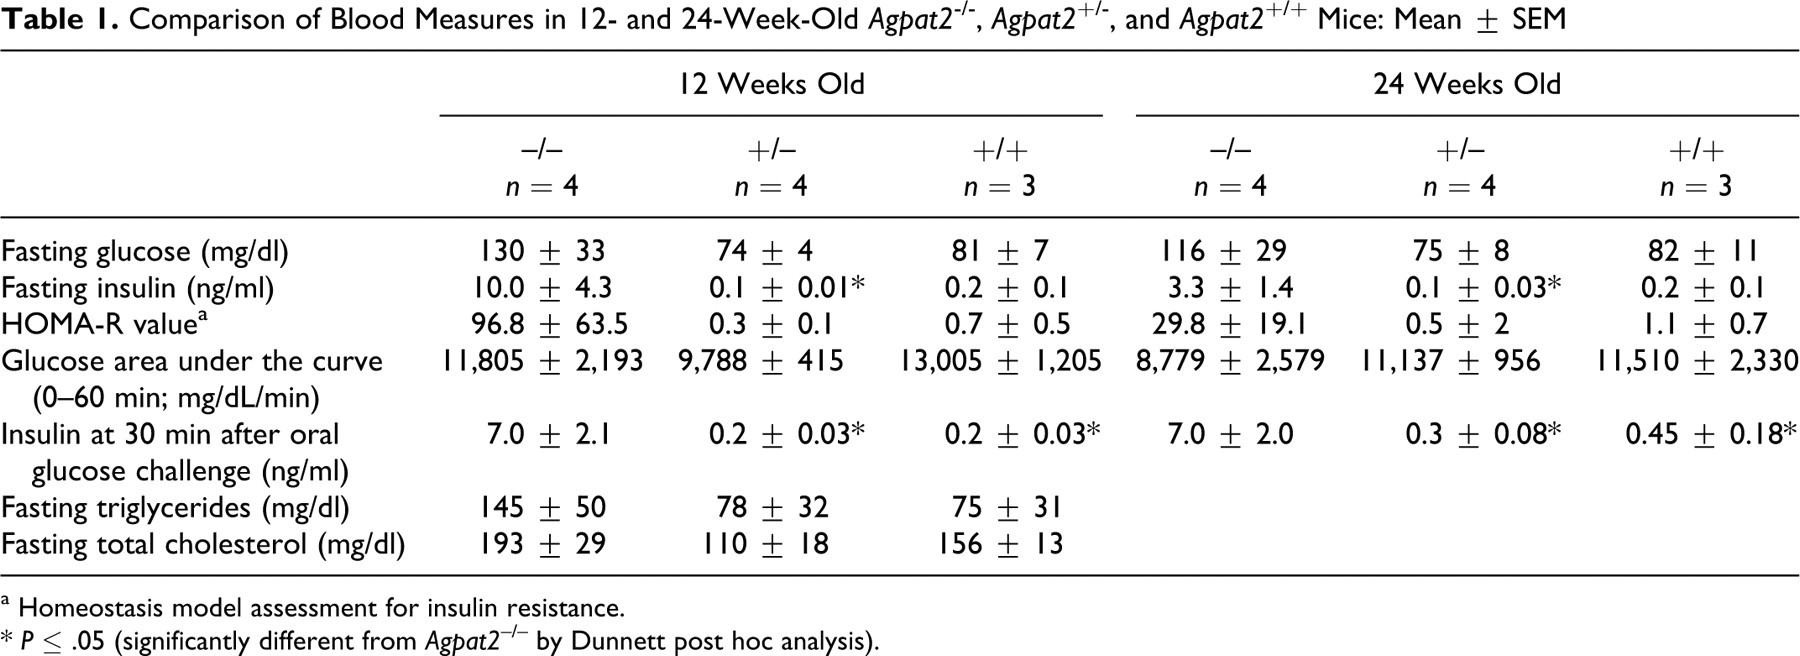
a Homeostasis model assessment for insulin resistance.
* P ≤ .05 (significantly different from Agpat2 –/– by Dunnett post hoc analysis).
Gross Pathology
At necropsy, Agpat2 –/– mice were easily differentiated from control littermates by their smaller size, rough hair coats, and greatly distended abdomens. The primary findings at necropsy in all Agpat2 –/– mice were severe hepatomegaly and a complete absence of WAT. The massively enlarged livers were uniformly pale in color and floated in fixative.
Histopathology
To characterize the progression and extent of lipodystrophy in Agpat2 –/– mice, we compared histologic findings in BAT and WAT in knockout and wild-type mice at 1 week of age in comparison to aged mice. Minimal amounts of adipose tissue and widely disseminated adipocytes were present in the 1-week-old Agpat2 –/– mice, and striking pathologic alterations were noted in adipocytes in WAT and BAT. The differences in the amount of adipose tissues in wild-type and knockout mice progressed in severity over time, and the 3 aged Agpat2 –/– mice (78 to 94 weeks old) were completed devoid of BAT and WAT in all locations.
WAT
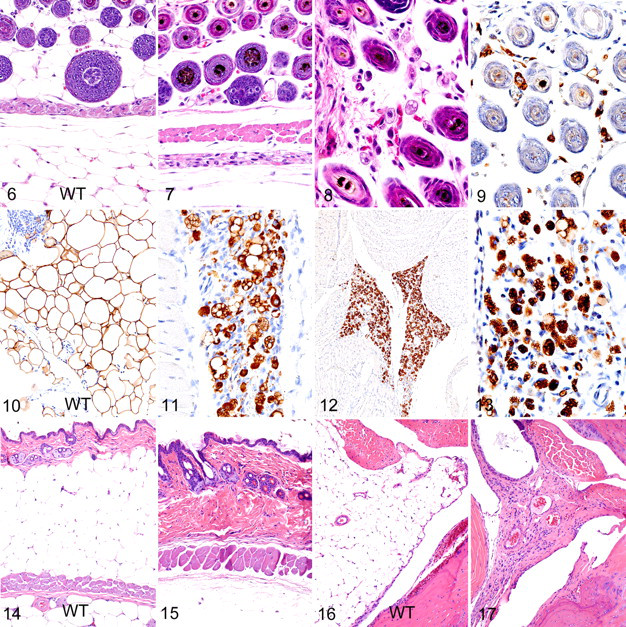
In 1-week-old wild-type mice, WAT filled the interfollicular space in the dermis and the subcutaneous fat pads and consisted of large tightly packed polygonal cells containing a single large lipid droplet surrounded by a thin rim of cytoplasm (Fig. 6 ). In contrast to those of wild-type mice, dermal and hypodermal WAT adipocytes appeared to be essentially absent in standard HE-stained sections of skin from 1-week-old Agpat2 –/– mice (Fig. 7 ). Upon closer examination at high magnification, it appeared that small numbers of abnormal small adipocytes were widely dispersed within the loose stroma of the dermis. In the dermis, these adipocytes were widely scattered between hair follicles in all areas of skin (Fig. 8 ). Notably, the Agpat2 –/– WAT adipocytes lacked the characteristic large unilocular fat droplet and flattened peripherally displaced nucleus of normal WAT adipocytes, appearing instead as individualized amoeboid cells having abundant microvacuolated cytoplasm and an eccentric large round nucleus with prominent nucleoli. Immunohistochemical staining with anti-perilipin antibodies revealed that variably sized adipocytes were actually much more common and widely dispersed within the interfollicular spaces in the dermis (Fig. 9 ); they were also present in large numbers in scattered small subcutaneous lobules (Fig. 11 ) and in other areas of the body normally containing adipose tissue depots. By comparison, the normal subcutaneous fat depots in age-matched wild-type mice consisted of tightly packed large round and polygonal adipocytes that were clearly outlined by immunohistochemical staining for perilipin (Fig. 10 ). Although prominent fat depots were absent in the young Agpat2 –/– mice, large numbers of small atypical adipocytes were present in all the usual locations of the body (Fig. 12 ), including the bone marrow and the mechanical adipose depots in the retrobulbar space and joint pads. Also in these locations, large numbers of amoeboid WAT adipocytes, similar to those found subcutaneous fat pads, were scattered within the loose stroma (Fig. 13 ). Although there were rare individual necrotic/apoptotic cells in some foci containing abnormal adipocytes, it was not possible to determine with certainty if these represented degenerating adipocytes or inflammatory cells. In aged Agpat2 –/– mice, the abundant cutaneous WAT normally present in age-matched control mice (Fig. 14 ) was entirely absent in knockout mice (Fig. 15 ). Even the mechanical fat depots in the synovial foot pads and retro-orbital areas were entirely absent in knockout mice (cf Figs. 16 , 17). The complete loss of adipocytes in these aged mice was confirmed by the absence of any perilipin-positive cells in all locations that would normally contain adipose tissue depots.
BAT
At 1 week of age, the characteristic well-defined lobules of BAT (defined in this report as type 1 BAT) were easily identified between the shoulder blades and extending into the subcutaneous tissues of the dorsal head, neck, and thoracic areas of wild-type and knockout mice. Type 1 BAT was arranged into clearly demarcated and richly vascularized lobules that were tightly packed with adipocytes with eosinophilic plurivacuolated cytoplasm (Fig. 18 ). In contrast, the hallmark lesion in type 1 BAT of Agpat2 –/– mice was massive necrosis and granulomatous inflammation affecting all well-defined lobes of BAT (Fig. 19 ). The BAT adipocytes were replaced by a coagulum of amorphous basophilic material and cytoplasmic debris, which contained infiltrating macrophages and multinucleated giant cells at the periphery (Fig. 20 ). The stage and severity of necrosis and inflammatory response were remarkably uniform in all lobules of type 1 BAT, suggesting that the lesions developed simultaneously in all locations. Small numbers of large highly vacuolated and degenerating adipocytes survived in a few BAT lobules in only 1 mouse (Fig. 21 ). In addition to observing these classic well-defined BAT depots in 1-week-old pups, we observed that the areas of less well-demarcated BAT (defined in this report as type 2 BAT) survived in multiple locations in knockout and wild-type mice. Cytologically, this type 2 BAT in wild-type mice was composed of small eosinophilic multiloculated adipocytes; however, type 2 BAT was generally not organized into clearly demarcated lobules but instead gradually merged with the large uniloculated adipocytes of WAT. In 1-week-old and adult wild-type mice, type 2 BAT was consistently found in association with WAT at the base of the mesentery and mediastinum, at the kidney hilus and periadrenal area, and in many locations on the head, including between skeletal muscle bundles and adjacent to the salivary glands. In comparison to that of wild-type mice, the amount of type 2 BAT in these locations in 1-week-old Agpat2 –/– mice was markedly reduced. However, necrosis and inflammation were essentially absent in these less-well-defined type 2 BAT depots, and they appeared near normal except for enlarged vesicles in many cells. In contrast to the widely dispersed but abnormal adipocytes seen in young Agpat2 –/– mice, no perilipin-positive cells were detected in aged mice in any location that would normally be expected to contain depots of either type of BAT.
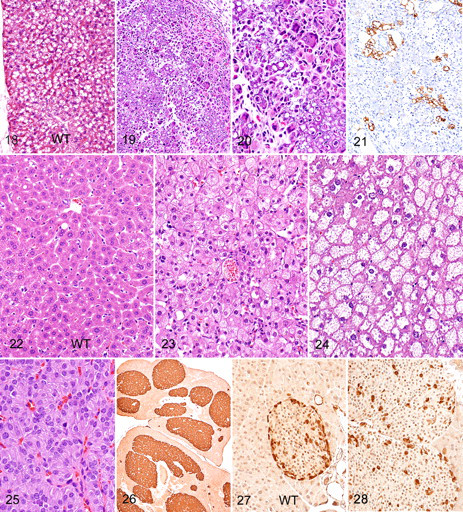
Evidence of abnormal lipid metabolism was present in the liver. Grossly, the livers of 1-week-old and aged Agpat2 –/– mice were pale and massively enlarged in comparison to those of wild-type littermates. Histologically, the hepatomegaly in 1-week-old Agpat2 –/– mice was due to a diffuse marked microvesicular steatosis (Fig. 23 ). The oil red O–positive cytoplasmic vesicles in hepatocytes were small in neonates and mildly larger in the aged mice. In fact, the only place that lipid was detected in the aged knockout mice was in the massively enlarged livers, which showed severe microvesicular hepatocellular steatosis (Fig. 24 ). Interestingly, no fibrosis and only scattered foci of mild inflammation were associated with the hepatic steatosis.
In the aged knockout mice, significant changes were present in the pancreas. These were characterized by diffuse hyperplasia of endocrine cells within the islets of Langerhans (Fig. 25 ), which on average made up approximately 20% of the total pancreatic volume in the 3 aged mice, versus 1 to 2% in wild-type controls (data not shown). The enlarged islets comprised masses of granulated endocrine cells, with the majority of islet cells staining positive for insulin (Fig. 26 ). The ratio of insulin- to glucagon-positive cells was not calculated but appeared to be normal; however, whereas glucagon-producing alpha cells are normally concentrated at the periphery of smaller islets in wild-type mice (Fig. 27 ), they tended to be more randomly dispersed throughout the islets in Agpat2 –/– mice (Fig. 28 ). There was no evidence of inflammation, degeneration, necrosis, or increased mitoses in the enlarged islets of aged mice.
Other notable pathologic findings in 1-week-old knockout mice included proximal femoral fractures in 2 of the 4 mice examined; however, no lesions were noted in the pancreatic islets, skeletal muscle, or other tissues of these young mice (data not shown). The only other notable lesions in the aged Agpat2 –/– mice involved the incisor teeth, where severe bilateral dental dysplasia was characterized by disruption and loss of ameloblasts resulting in enamel hypoplasia accompanied by disordered growth and orientation of dentin. Unlike in humans with BSCL, there was no histologic evidence of lipid accumulation in cardiac or skeletal muscle in either young or aged Agpat2 –/– mice.
Discussion
We found that Agpat2 –/– mice shared many of the characteristic metabolic and pathologic changes reported with CGL in affected human patients and other mouse lipodystrophy models. Although a primary function of adipose tissue is to act as an energy storage depot, adipocytes secrete a variety of adipose-derived hormones or adipokines (eg, leptin, adiponectin, tumor necrosis factor α, interleukin 6, resistin, visfatin) that have significant effects in regulating metabolism. The major pathophysiologic consequences of lipoatrophy seen in this animal model highlight the numerous and essential metabolic and endocrine functions of adipose tissue. Although it seems paradoxical, many of the same metabolic complications typically associated with excessive adiposity in metabolic syndrome are present with the severely reduced mass of adipose tissue in generalized lipoatrophy. Like human BSCL patients, Agpat2 –/– mice develop a syndrome characterized by severe insulin resistance, hepatic steatosis, and lipoatrophic diabetes. Although the pathogenesis of insulin resistance and other metabolic complications in CGL has not been fully elucidated, an association between (1) a lack of adipose tissue and (2) the accumulation of triglycerides in the liver and skeletal muscle and increased insulin resistance has long been recognized. 9 It was recently reported that expression of lipogenic genes and rates of de novo fatty acid biosynthesis were increased approximately 4-fold in Agpat2 –/– mouse livers. Specifically, levels of monoacylglycerol acyltransferase isoform 1 were markedly increased in the livers of Agpat2 –/– mice, suggesting that this alternative pathway for triglyceride biosynthesis is activated in the absence of AGPAT2 and so cause the hepatic steatosis in Agpat2 –/– mice. 10
The precise mechanisms responsible for the lack of adipose tissue in human BSCL have not been determined, but arrested differentiation/proliferation of adipocytes has been suggested as a possible cause. 15 However, our findings of well-defined BAT depots and widely dispersed WAT adipocytes in 10-day-old mice indicate that AGPAT2 is not required for the early differentiation and proliferation of either BAT or WAT adipocytes. Instead, our findings show that massive necrosis and associated granulomatous inflammation affecting all well-defined lobes of BAT in the perinatal period is responsible for the ablation of this tissue in Agpat2 –/– mice. Although we did not determine the molecular mechanisms responsible for the acute necrosis of BAT in Agpat2 –/– mice, it is clear that absence of the enzyme in the neonatal period leads to rapid postpartum destruction of type 1 BAT adipocytes. In fact, the necrosis of BAT depots may be largely responsible for the high mortality observed in neonatal Agpat2 –/– mice. It is well known that the primary function of BAT is to rapidly transform chemical energy from fat into heat and that functional BAT is important for survival of altricial neonatal mice during the first weeks after birth. 8 Although we did not demonstrate hypothermia in neonatal Agpat2 –/– mice or test the effects of environmental temperatures on survival, we believe that these high mortality rates might be reduced in future studies by maintaining pregnant dams and pups in a thermoneutral environment. Support for this hypothesis was provided by a report that showed greatly improved postnatal survival of mouse pups lacking functional BAT owing to loss of uncoupling protein if they were housed at higher ambient temperatures. 8
Less dramatic but just as clear is the case for apoptosis/necrosis of adipocytes being the cause of lipodystrophy in WAT and type 2 BAT. The destruction of the well-defined type 1 BAT depots was complete in neonatal Agpat2 –/– mice, but small depots of type 2 BAT were present in all the locations (base of the mesentery, eye orbit, renal medulla, various locations in the head) that normally contain mixed BAT/WAT depots. It is not clear why necrosis and inflammation were absent within the less well-defined type 2 BAT depots in 1-week-old Agpat2 –/– mice, but recent studies suggest that various BAT depots have different developmental origins and may thus have differing pathophysiologic responses to metabolic demands. 54 The brown fat cells located in the well-demarcated interscapular lobules that underwent necrosis in Agpat2 –/– mice are apparently derived from the same precursor cells as skeletal muscle and are irreversibly committed to a brown adipocyte phenotype. 44 In contrast, the comparatively protected brown fat adipocytes found in mixed type 2 BAT/WAT depots are believed to arise from the same precursors as WAT adipocytes and can in fact transform into WAT adipocytes under certain conditions. 54 Thus, the differing origins and metabolic functions of the 2 types of BAT may be responsible for the different lesions that they develop in Agpat2 –/– mice.
One notable difference between Agpat2 –/– mice and humans with BSCL is the greater severity and extent of WAT loss in Agpat2 –/– mice. In humans, there is evidence that deficient AGPAT2 enzyme activity has a greater effect on triglyceride synthesis in metabolically active adipose tissue than in liver, skeletal muscle, or mechanical adipose tissue. 4 As a result, humans with inactivating mutations in AGPAT2 lack the more metabolically active mesenteric and subcutaneous adipose tissues that dynamically store or release energy, but they retain the mechanical adipose tissue depots. 9,19,47 In contrast, all adipocytes in metabolic and mechanical WAT depots in aged Agpat2 –/– mice were absent, suggesting that all types of mouse WAT are more sensitive to the deleterious effects of Agpat2 deficiency. The increased susceptibility of mouse adipocytes to lipodystrophy may be related to the higher metabolic rate in these small mammals. 50
Although necrosis is clearly the primary mechanism responsible for the loss of BAT, our findings suggest that the generalized WAT lipoatrophy seen in young Agpat2 –/– mice may be due, at least initially, to a combination of severely reduced triacylglycerol production and the impaired proliferation and development of adipocytes. In vitro studies have shown that AGPAT2 is involved in the metabolism and differentiation of adipocytes; as such, knockdown of AGPAT2 expression reduces the synthesis and storage of triglycerides in preadipocytes and adipocytes, thus preventing the development of normal adipocyte morphology. 15 The abnormal appearance and reduced numbers of WAT adipocytes that we observed in 1-week-old Agpat2 –/– mice are consistent with impaired metabolism, proliferation, and differentiation of these cells. The WAT adipocytes that were present in small numbers in young Agpat2 –/– mice displayed morphologic characteristics of poorly differentiated adipocytes, characterized by abundant microvacuolated basophilic cytoplasm surrounding a relatively large round nucleus having prominent nucleoli. Yet, it is highly significant that no adipocytes were detected in aged knockout mice, and their absence indicates that they were eliminated as a result of the AGPAT2 deficiency. At the very least, the absence of adipocytes in aged mice proves that AGPAT2 deficiency prevents the long-term survival of adipocytes, which we speculate might be due to the accumulation of cytotoxic breakdown products in metabolically active AGPAT2-deficient adipocytes. Interestingly, it is widely known that some fatty acids can be toxic to adipocytes and that diets supplemented with certain conjugated linoleic acid produce characteristic abnormalities of lipoatrophy in mice—including the ablation of BAT, a marked reduction of WAT, marked hepatomegaly, and marked insulin resistance. In mice, the reduction of fat mass owing to dietary conjugated linoleic acid is caused by apoptosis of adipocytes. 51 Regardless of the precise molecular mechanisms responsible, continued apoptosis/necrosis of adipocytes in Agpat2 –/– mice would prevent their ability to differentiate and proliferate. Taken together, our findings indicate that the absence of WAT depots in adult Agpat2 –/– mice is due to loss of WAT adipocytes, most likely as a result of apoptosis or necrosis.
Chronic hyperglycemia and hyperinsulinemia are 2 other characteristic manifestations of lipoatrophy that we observed in Agpat2 –/– mice. Several factors contribute to the development of insulin resistance in lipoatrophy. There is, of course, the reduced capacity of adipose tissue to buffer dietary fatty acids, and the elevated free fatty acids contribute to the hyperglycemia as muscle energy use shifts to free fatty acid instead of glucose. In type 2 diabetes, the accumulation of intracellular lipid metabolites, such as diacylglycerol and acyl-CoA in skeletal muscle and liver, interferes with insulin signaling in these tissues. 41 The increased insulin resistance in skeletal muscle and liver is initially compensated for by increased insulin production (resulting in hyperinsulinemia), but β-cell depletion and reduced insulin production due to glucolipotoxicity usually occur as disease progresses, eventually resulting in hyperglycemia and overt type 2 diabetes. 52 The precise mechanisms responsible for insulin resistance and pancreatic β-cell failure in diabetes are not yet fully understood, but toxic effects of chronic hyperglycemia and hyperlipidemia (glucotoxicity and lipotoxicity) on β cells are believed to be largely responsible for progression to disease in type 2 diabetes. Because hyperglycemia is a prerequisite for lipotoxicity, the term glucolipotoxicity has been coined to more accurately describe the deleterious effects of glucose and lipids on β-cell function. 7,14,43 Generally, pancreatic β cells appear to be particularly susceptible to the toxicity of saturated fatty acids, 14 which trigger apoptosis in β cells via the endoplasmic reticulum stress response. 27 However, there was no evidence of β-cell depletion, and insulin production was actually increased, despite the presence of long-standing hyperglycemia in aged Agpat2 –/– mice.
Instead of depletion of β cells, perhaps one of the most striking findings in aged Agpat2 –/– mice was the massive hyperplasia of pancreatic islets. The proliferation and survival of insulin-producing β cells in the face of severe hyperglycemia in our Agpat2 –/– mice strongly suggest that glucotoxicity alone does not directly cause islet cell dysfunction/destruction and progression to diabetes. Initially, increased insulin resistance in the liver and skeletal muscle is compensated for by increased insulin production resulting in hyperinsulinemia, but eventual islet cell failure results in reduced insulin production and overt diabetes. 52 The mechanisms that regulate pancreatic β-cell proliferation and apoptosis are not completely understood, but it is clear that total β-cell mass depends on a balance between cell growth and differentiation and cell death. Thus, the massive islet hyperplasia observed in lipoatrophic Agpat2 –/– mice indicates that an imbalance exists between proliferation and destruction of β cells. Our findings suggest that lipoatrophy disrupts the homeostatic control mechanisms that normally regulate the proliferation and/or destruction of islet cells. Changes in glucose concentration have profound effects on β-cell mass. 49 In rats, elevated glucose stimulates β-cell replication by converting β cells from a resting state into proliferative cells, and a sucrose rich diet produces a significant increase in β-cell mass. 11,31 The role of glucose in regulating islet cell mass is further complicated by findings that chronic hyperglycemia actually decreases β-cell mass by inducing apoptosis, without a compensatory increase in β-cell proliferation and neogenesis. 26 The development of massive islets in our knockout mice in the face of chronic hyperglycemia shows that glucotoxicity alone is insufficient to cause β-cell loss. Determining the precise mechanisms whereby lipoatrophy and insulin resistance in mice result in proliferation and survival of β cells may help in developing effective therapeutic strategies to treat human disease.
Our findings suggest that the loss of adipocyte-derived factors, rather than glucotoxicity, is responsible for reduced β-cell destruction in lipoatrophic mice. Adipocyte-derived factors that have been shown to influence β-cell survival include free fatty acids, tumor necrosis factor α, interleukin 6, leptin, resistin, and adiponectin (reviewed in Maedler 33 ). Although we did not measure leptin or adiponectin levels in our Agpat2 –/– mice, Cortes et al demonstrated a near absence of plasma leptin in similar Agpat2 –/– mice. 10 Elevated plasma leptin levels in obesity appear to be involved in the regulation of β-cell proliferation, 24 and leptin accelerates the onset and progression of diabetes in nonobese diabetic mice. 37 Chronically elevated concentrations of leptin and glucose appear to induce β-cell apoptosis through activation of the c-Jun N-terminal kinase pathway in islets. 34 Conversely, leptin deficiency results in decreased apoptosis of β cells. In leptin-deficient obese ob/ob mice (Lep –/–) with diabetes and insulin resistance, 12,13 the marked expansion of total β-cell mass is due to β-cell hyperplasia and hypertrophy. 21 Similarly, leptin receptor–deficient db/db (Lepr –/–) mice show a massive increase in islet cell mass volume, due largely to β-cell hyperplasia, despite having elevated leptin levels, 16,28 as do leptin-resistant fa/fa Zucker rats (Lepr –/–). 29,42 Taken together, these findings support a critical role for leptin in controlling islet cell mass and suggest that leptin deficiency secondary to the absence of adipocytes could be primarily responsible for islet hypertrophy in Agpat2 –/– mice.
Mouse models of lipodystrophy have proven useful in the discovery and development of novel treatments for the metabolic disturbances related to dysfunctional adipose tissue. 6 Because Agpat2 –/– mice are devoid of WAT and BAT, they constitute an animal model that will facilitate systematic investigations into the role of adipose tissue in the pathogenesis of diabetes and metabolic syndrome. This model may also help in elucidating the mechanisms involved in modulating islet cell mass, which could lead to the development of novel therapeutic approaches to treating diabetes by expanding and maintaining islet cell mass.
Footnotes
Acknowledgements
We thank Mary Thiel, Kathy Henze, and Ryan Vance for histology support on this project, as well as David Powell for critical review of the manuscript. This research received no grant from any funding agency in the public, commercial, or not-for-profit sectors.
The authors declared that they had no conflicts of interests with respect to their authorship or the publication of this article.
Financial support for these studies was provided by Lexicon Pharmaceuticals, Inc.