
Abstract
Transferrin receptor 1 (TfR1) expression was measured by immunohistochemistry in 78 archived cases of canine B-cell and T-cell lymphoma with an anti-human TfR1 monoclonal antibody that was validated in the dog by immunohistochemistry and immunoblotting. The canine lymphoma cases were initially classified on the basis of World Health Organization criteria and then subdivided into the following 4 subgroups: low-grade B-cell (LGB), high-grade B-cell (HGB), low-grade T-cell (LGT), and high-grade T-cell (HGT). A visual scoring system and densitometric analysis of the proportion and intensity of positive staining were used to quantify TfR1 expression. TfR1 expression was also correlated to mitotic rate. TfR1 expression was significantly lower in the LGT tumors compared to all other lymphoma subgroups (LGB, HGB, and HGT). LGB tumors showed a TfR1 expression similar to those of the high-grade tumors (HGB and HGT). Significant correlations were found between mitotic rate and densitometric TfR1 variables in the T-cell tumors but not in the B-cell tumors. Further studies are needed to investigate the underlying molecular basis of the high TfR1 expression in LGB lymphomas and its pathological relevance. The anti-human TfR1 monoclonal antibody is a useful tool for measurement of total cellular transferrin receptor expression in the dog; however, an antibody with specificity for the canine TfR1 ectodomain is needed to investigate the potential of this receptor as an oncolytic target.
Transferrin receptor 1 (TfR1) is a type II transmembrane glycoprotein that binds and internalizes transferrin–iron complexes, allowing for cellular uptake of iron via endocytosis. The receptor is located on the cell surface (20% to 40%); following internalization during iron uptake and receptor recycling, it is also found intracellularly within endosomes (60% to 80%). 22 Iron is critical for many cellular functions, including hemoglobin production, DNA synthesis, and energy production. Because these functions are cell dependent, iron requirements vary according to the cell type. Cells with the highest iron requirements, such as immature erythrocytes and placental syncytiotrophoblasts, have the highest expression of the receptor in human tissues. In contrast, low expression of TfR1 is seen in epithelial cells of various organs. 13,36
Human studies have confirmed that TfR1 expression is higher in proliferating normal and malignant transformed cells than in their resting counterparts 42,44 and that TfR1 expression correlates with a variety of proliferation markers, including mitotic index, 31 Ki67 expression, 24 and 3 H-thymidine incorporation. 21 TfR1 expression has been measured and found to be expressed in many hematopoietic and nonhematopoietic neoplasms in humans, including non-Hodgkin lymphoma (NHL), 11,13,15,17,21,25,34,47 acute leukemia, 3 and solid tumors of the brain, bladder, liver, and gastrointestinal tract. 2,19,26,37,39 Higher expression of TfR1 in NHL was associated with a poorer prognosis in 2 human studies. 17,21 Given the high expression of TfR1 on neoplastic cells, many investigators have pursued it as an oncolytic target through the use of a variety of strategies including monoclonal antibodies, with or without conjugation to cytotoxic substances, as well as toxic small molecules which use the TfR1 to enter the cell. 3,4,6,7,24,27,29 Phase 2 clinical trials of one such treatment for human NHL—gallium nitrate—have shown promise in patients who have relapsed after standard chemotherapy. Some patients developed anemia during treatment; otherwise, the drug was well tolerated. 38 Little is known about the expression of TfR1 in canine tissues. Studies of TfR1 expression in canine tumors has been limited to brain tumors, where expression was stronger in primary and metastatic tumors than in normal brain tissue. 30
Lymphoma accounts for approximately 83% of all hematopoietic neoplasms in dogs. 45 Estimated annual incidence risks vary but range from 24 to 114 cases per 100,000 dogs. 9,10 There is much variability in response to treatment among lymphomas of the same histologic subtype; 35 thus, new biologic markers are needed to help predict the behavior of these tumors. Because TfR1 is frequently and strongly expressed in NHL in humans and expression has been related to outcome, TfR1 has promise as such a marker in dogs. Accordingly, we hypothesize that (1) TfR1 is expressed in canine lymphoma, (2) TfR1 expression relates to tumor grade but is independent of phenotype, and (3) TfR1 expression correlates with the tumor mitotic index.
To test these hypotheses, we performed a retrospective study of 78 cases of canine lymphoma diagnosed from 2001 to 2009 at the Cornell University Hospital for Animals. Archived cases were immunostained with an anti-human TfR1 antibody, which we validated in dogs using immunohistochemistry and immunoblotting. The lymphoma cases were immunophenotyped and classified according to World Health Organization (WHO) criteria. 1 We then compared TfR1 expression between histologic subtypes of lymphoma and correlated expression to mitotic index.
Materials and Methods
Samples for Validation of the Antibody
Archived formalin-fixed sections of canine placenta and both normal and hyperplastic lymph nodes were selected for validation of the anti-human TfR1 antibody by immunohistochemistry. Archived (–80°C) cell lysates prepared from canine lymph nodes from B-cell and T-cell lymphomas (one of each) and human placenta were used for immunoblotting analysis.
Case Selection
A search of medical records from Cornell University Hospital for Animals was conducted for cases of histologically confirmed multicentric canine lymphoma diagnosed between 2001 and 2009. Only dogs with archived formalin-fixed peripheral lymph node biopsies were selected. Cases were excluded if the dogs had received treatment with chemotherapeutic agents (including corticosteroids).
Detection of TfR1 by Immunohistochemistry
Immunohistochemical staining for TfR1 was performed with a semiautomated ProbOn system (Fisher Scientific Co, Pittsburgh, PA) and the Vectastain Elite ABC kit (Vector Laboratories, Burlingame, CA). Formalin-fixed, paraffin-embedded tissues were sectioned at 4 μm and mounted on positively charged slides (ProbOn, Fisher Scientific Co). Deparaffinization was performed in xylene, after which slides were passed through graded ethanols and rinsed in distilled water. Endogenous peroxidase activity was blocked with a 3% solution of hydrogen peroxide in methanol for 10 minutes. Following a rinse in distilled water, slides were heated by microwave (high, 800 W) for 20 minutes in boiling EDTA buffer (pH 8.0) for antigen retrieval and allowed to cool at 4°C for 20 minutes. Slides were then washed with distilled water and phosphate buffered saline (PBS; pH 7.4) before blocking with normal goat serum (Vector Laboratories) and a casein solution (Vector Laboratories). Slides were incubated with a mouse anti-human TfR1 antibody (clone H68.4, Zymed Laboratories, San Francisco, CA), diluted to 1:50 in a solution of casein and PBS, for a period of 90 minutes. After washing in PBS, binding of the primary antibody was detected with a biotinylated goat anti-mouse secondary antibody, streptavidin–horseradish peroxidase (Vector Laboratories), and 3,3′-diaminobenzidine as the chromogen substrate (Dako, Carpentaria, CA). Slides were then counterstained with Mayer’s hematoxylin, dehydrated, cleared, and mounted in Permount (Fisher Scientific Co). Duplicate tissue sections from each tissue were incubated with murine immunoglobulin G1 (Dako) as a negative control. For consistency between staining runs, each run included a mixture of B-cell and T-cell and high-grade and low-grade lymphoma cases, a section of normal or hyperplastic canine lymph node, and 2 lymphoma cases designated as having weak-positive TfR1 and strong-positive TfR1 expression (one each).
Immunoblot Analysis
Immunoblot analysis was performed on cell lysates obtained from 2 cases of canine lymphoma (one B-cell and one T-cell). Human placental cell lysates were used as a positive control (canine placenta was unavailable). Protein concentrations in the lysates were determined with a DC protein assay (Bio-rad, Hercules, CA). Equal amounts of lysate (40 μg of protein) were boiled for 5 minutes in Laemmli sample buffer with 5% β-mercaptoethanol, then loaded into a 10% sodium dodecyl sulfate–polyacrylamide gel. After electrophoresis, proteins were transferred to a 0.45-μm nitrocellulose membrane. After blocking with 5% skim milk powder in PBS with 0.5% Tween 20 (PBS-T), the membrane was incubated overnight at 4°C with the anti-TfR1 antibody diluted in blocking buffer. Following several washes containing PBS-T, horseradish peroxidase–conjugated donkey anti-murine immunoglobulin G (Bio-rad, diluted in blocking buffer) was added for 1 hour at room temperature. After washing in PBS-T, a chemiluminescent substrate (Supersignal West Pico ThermoFisher Scientific, Pittsburgh, PA) was applied for 3 minutes, followed by autoradiographic exposure.
Tumor Classification
Hematoxylin and eosin–stained slides from the lymphoma cases were reexamined by one board-certified pathologist (S.M.) who was blinded to the original diagnosis but provided with tumor immunophenotype. Tumors were classified by cell morphology, immunophenotype, and lymph node architecture based on updated WHO criteria. 1 Four general tumor subgroups were obtained on the basis of phenotype and predicted biologic behavior: low-grade B-cell (LGB), high-grade B-cell (HGB), low-grade T-cell (LGT), and high-grade T-cell (HGT). Mitotic index was determined as the number of mitoses observed in a total of 10 randomly selected representative high-power fields (400×).
Quantification of TfR1 Expression
Both the proportion and the intensity of positive staining of TfR1 were quantified with a subjective visual scoring system and with densitometric analysis of representative digital images, as follows.
Visual scoring system
For the visual scoring system, the percentage of neoplastic cells expressing TfR1 (percentage positive cells score) was determined by counting 1,000 cells in at least 5 representative areas of lymphomatous tissue within a grid. Results were then scored 0 to 4, based on percentage positive cells—respectively, < 5%, 5% to 25%, 26% to 50%, 51% to 75%, 76% to 100%. The intensity of TfR1 expression within the neoplastic cells was nominally scored by 3 observers blind to the study (1, weak; 2, moderate; 3, strong). The weak and strong positive controls that were run with each batch were used as a guide for scoring staining intensity.
Densitometry
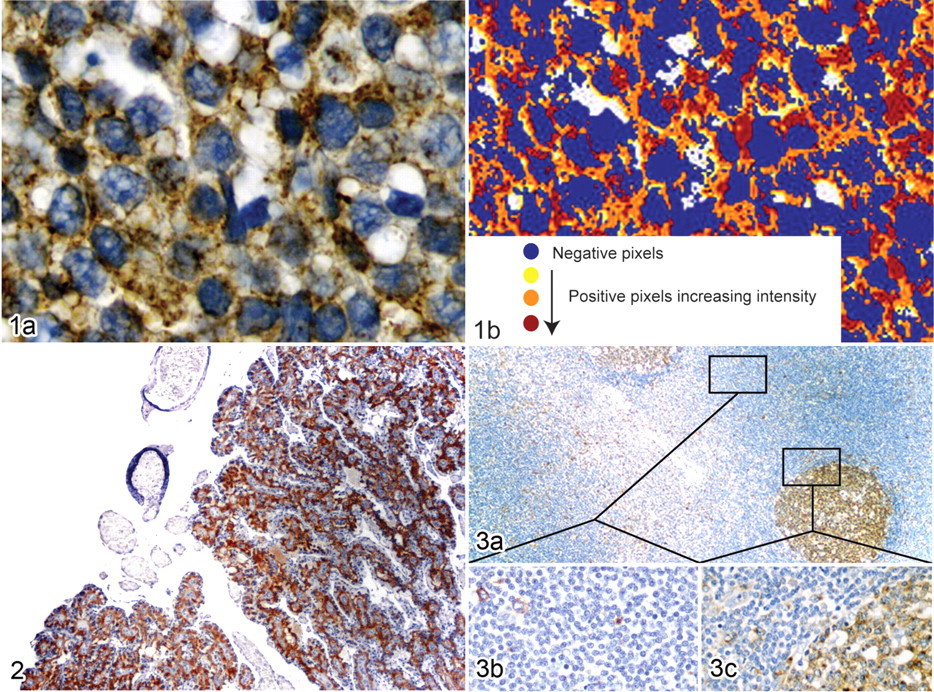
For densitometry, slides were digitally scanned at 20× magnification. The percentage of positive pixels and the total intensity of positive pixels in 5 standardized representative lymphomatous areas of approximately 10,000 μm2 each were calculated with the Aperio Scanscope Positive Pixel Count algorithm (Aperio Technologies, Inc, Vista, CA) (Fig. 1 ). For ease of presentation, the total intensity of positive pixels was divided by 10,000.
Statistical Analysis
Statistical analysis was performed with the Statistix 9 software package (Analytical Software, Tallahassee, FL). Data distribution was non-Gaussian; thus, we used nonparametric statistics. We performed the Kruskal–Wallis one-way analysis of variance and all-pairwise comparisons to identify differences between the 4 lymphoma subgroups (LGB, HGB, LGT, HGT) in percentage positive cells score, visual intensity score, percentage positive pixels, and total intensity of positive pixels. We also calculated Spearman rank correlations between the median mitotic index and the median of the 2 densitometric TfR1 expression variables (percentage positive pixels and total intensity of positive pixels). A value of P < .05 (2 sided) was considered significant for all tests.
Results
Antibody Validation
Strong positive staining was seen in the placental trophoblast cells of formalin-fixed, paraffin-embedded canine placenta (Fig. 2 ), as expected. Moderate to strong expression of TfR1 in normal and hyperplastic canine lymph nodes was seen in germinal centers, with lower and more scattered expression in the surrounding mantle and marginal zones as well as interfollicular paracortical areas (Fig. 3 ). Expression was localized mostly to lymphocytes, with some staining detected in a few histiocytes in these areas. No staining was observed within granulocytes.
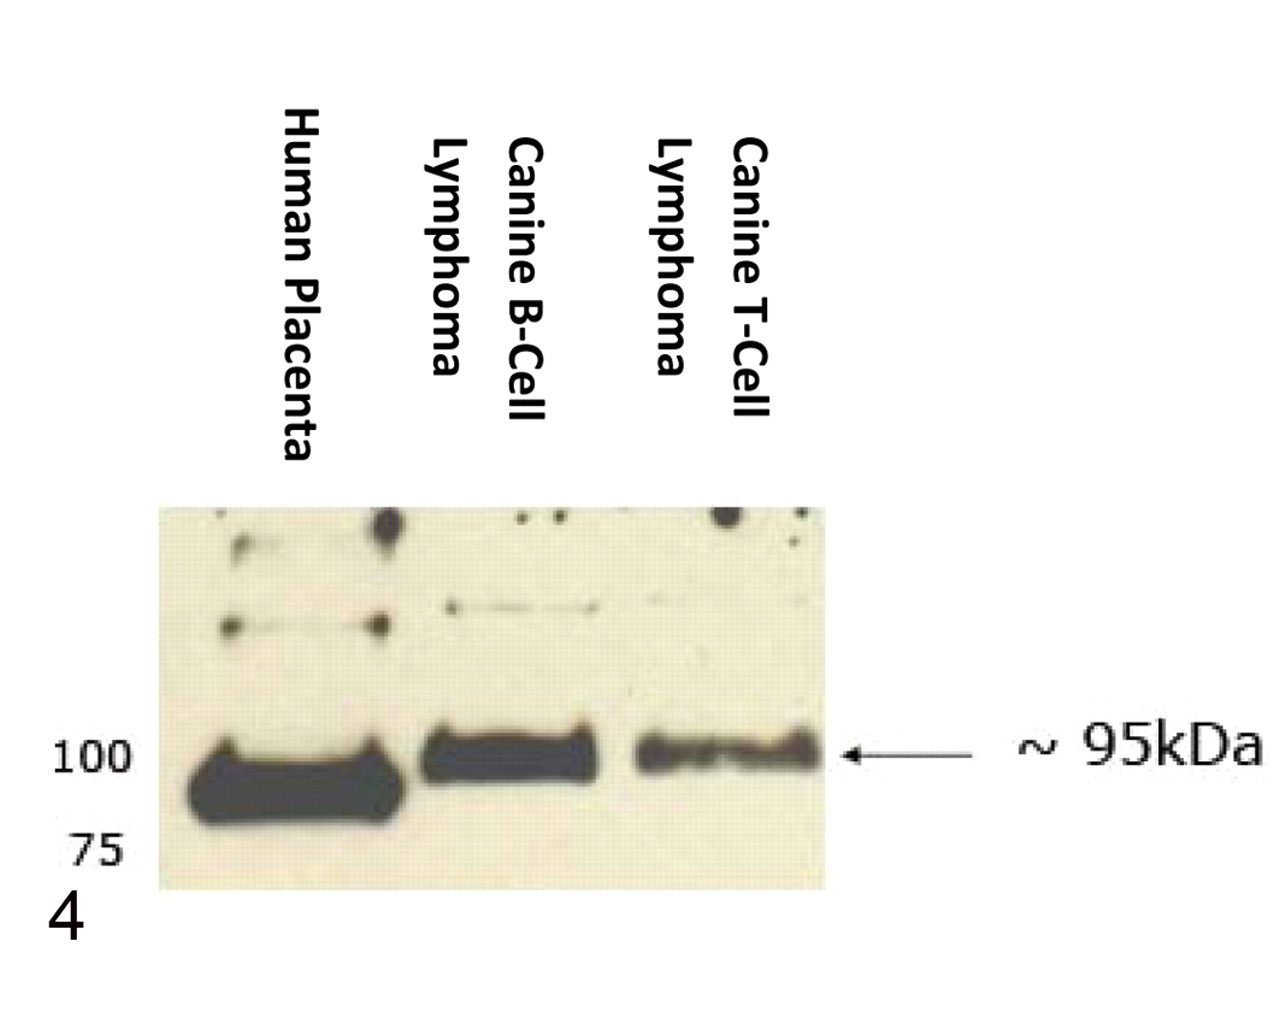
Detection of transferrin receptor 1 by immunoblot analysis with the anti-human H68.4 antibody in protein lysates of human placenta and a canine B-cell and T-cell lymphoma. Note the presence of a single protein band of approximately 95 kDa in each lane corresponding to the molecular weight of human transferrin receptor 1. Small variations in protein band migration are likely due to species differences in glycosylation of the receptor.

The antibody detected a single protein band of similar molecular weight to TfR1 (95 kDa) in both the B-cell and T-cell canine lymphoma cell lysates and the human placental lysate on immunoblot analysis (Fig. 4 ). There was a small difference in molecular weight between the human and canine tissues, which we attributed to interspecies variation in protein structure and degree of glycosylation or, alternatively, to alterations in the protein structure occurring during malignant transformation in canine lymphoma. 23,33,40
Patient Characteristics and Lymphoma Classification
Dogs ranged in age from 3 to 14 years old, with a median age of 8 years. Thirty breeds were represented, along with 20 mixed breeds. The sex distribution was 38% spayed female (30 of 78), 49% neutered male (38 of 78), and 13% intact male dogs (10 of 78). The distribution of lymphoma subgroups was 28% LGB (22 of 78), 35% HGB (27 of 78), 10% LGT (8 of 78), and 27% HGT (21 of 78). Based on the WHO classification scheme, the most common LGB tumors were lymphoplasmacytic and marginal zone lymphomas, whereas the HGB subgroup was predominated by diffuse large B-cell centroblastic and lymphoblastic precursor B-cell tumors. Of the T-cell tumors, the LGT tumors were uncommon and consisted of indolent T-zone lymphomas and small lymphocytic T-cell lymphomas, whereas the HGT subgroup consisted of peripheral T-cell lymphomas not otherwise specified and lymphoblastic T-cell lymphomas (Table 1 ).
Observed Transferrin Receptor 1 Staining Intensity in Canine Lymphoma
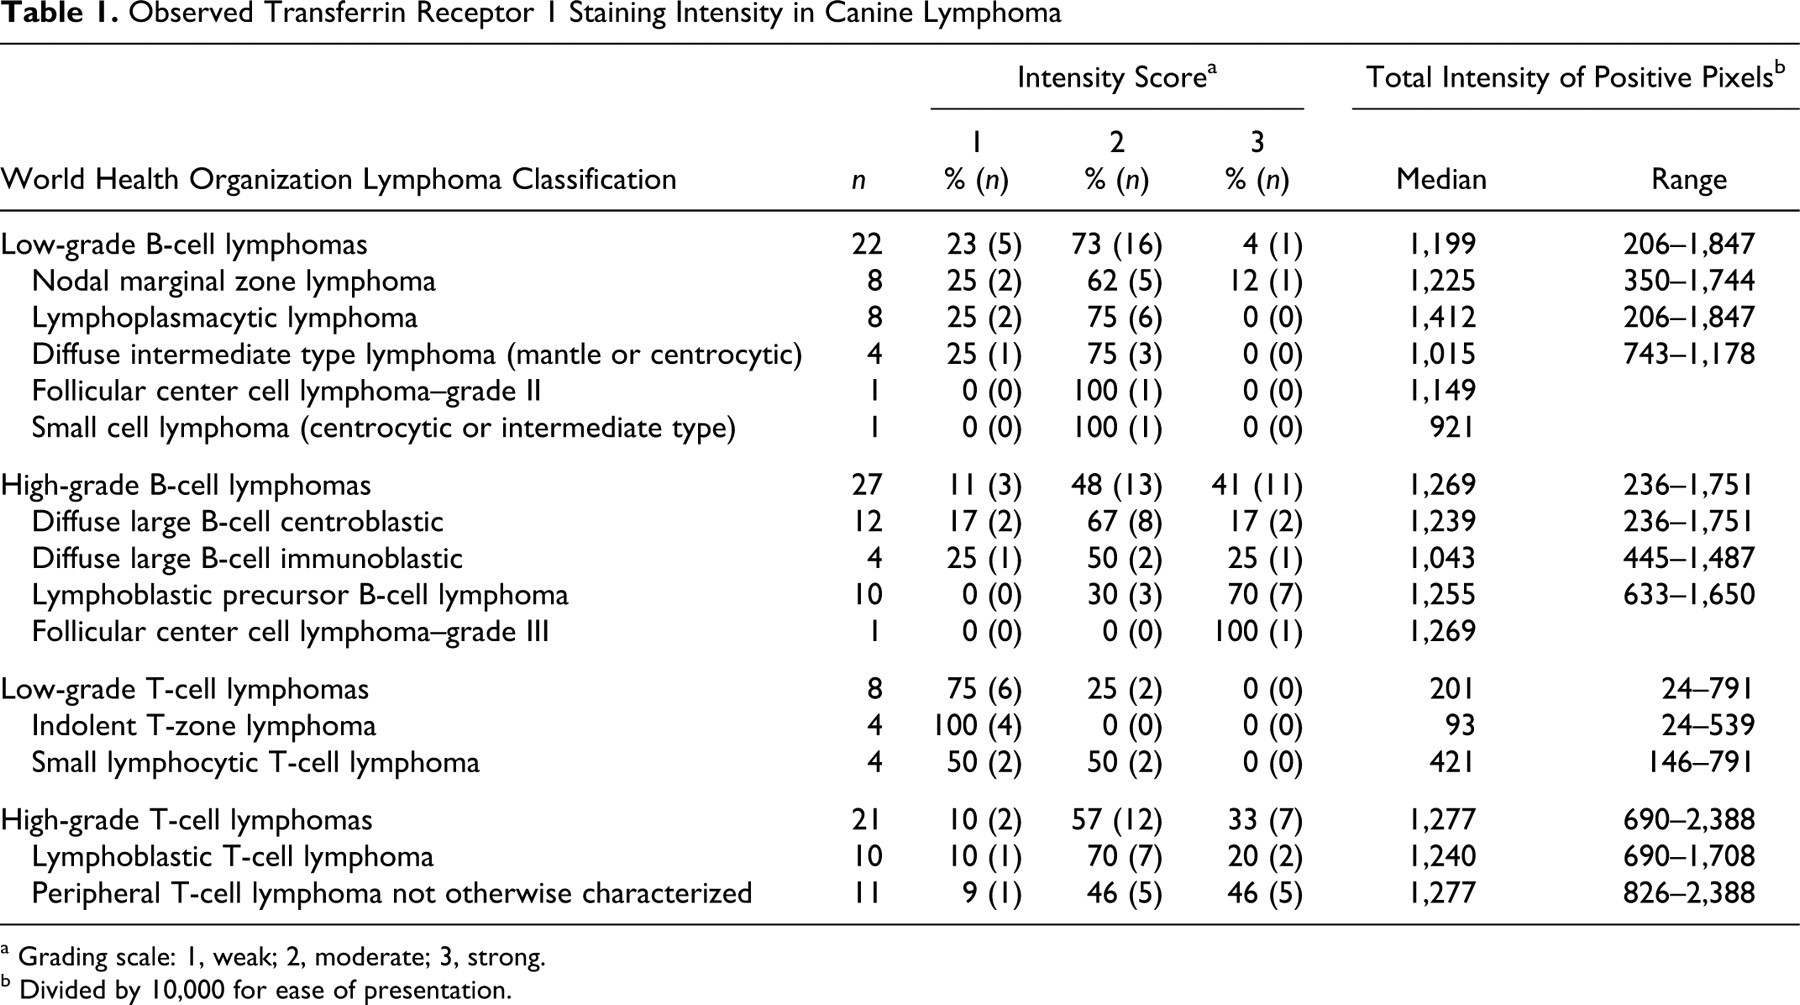
a Grading scale: 1, weak; 2, moderate; 3, strong.
b Divided by 10,000 for ease of presentation.
TfR1 Expression in Canine Lymphoma
TfR1 was expressed to variable degrees in all 4 subgroups of canine lymphoma (Figs. 5–7). We found that in 95% of cases (74 of 78), more than 75% of the neoplastic cells expressed TfR1 (visual percentage positive cell score of 4). When comparing TfR1 among tumor subgroups by densitometric analysis, we noted no difference in the percentage positive pixels or the total intensity of positive pixels between HGB and HGT tumors or between the LGB and high-grade tumors (HGB and HGT). However, when compared to the other 3 subgroups, the LGT tumors had significantly lower percentage positive pixels (P < .001) and weaker TfR1 expression (P < .001) (Table 2). A similar trend was seen with the visual scoring system, although only the median visual intensity score was significantly different between the TfR1 expression of the LGT tumors and that of the high-grade tumors (HGB and HGT) (Table 2).
Observed Median Transferrin Receptor 1 Expression Variables and Mitotic Index in Canine Lymphoma Subdivided by Tumor Grade and Phenotype a
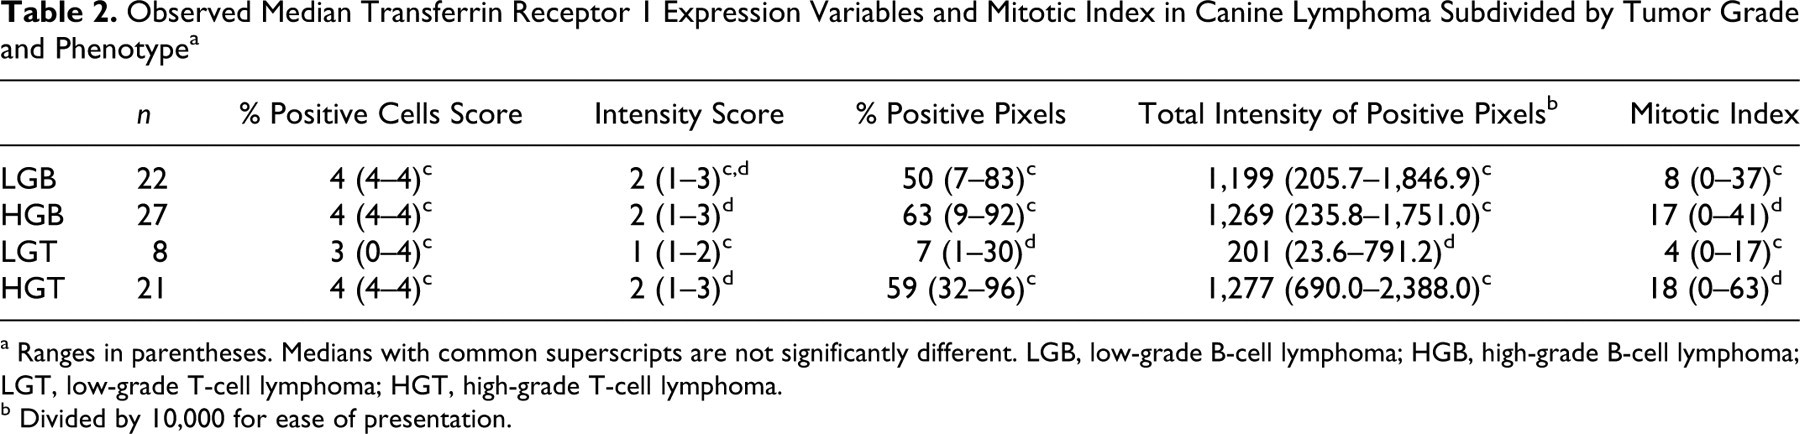
a Ranges in parentheses. Medians with common superscripts are not significantly different. LGB, low-grade B-cell lymphoma; HGB, high-grade B-cell lymphoma; LGT, low-grade T-cell lymphoma; HGT, high-grade T-cell lymphoma.
b Divided by 10,000 for ease of presentation.
To further understand the unexpected higher TfR1 expression in the LGB subgroup versus the LGT subgroup, we examined (by inspection, a posteriori) the intensity of TfR1 expression of the specific WHO categories within each subgroup (Table 1). We found that most LGT tumors displayed low TfR1 staining intensity by visual scoring method (ie, 75% [6 of 8] had a low score of 1) and densitometry (median total intensity of positive pixels, 201). In contrast, most LGB tumors (77%, 17 of 22) had moderate to high visual intensity scores and much higher staining intensity by densitometry (median total intensity of positive pixels, 1,199). Although a greater proportion of lymphoblastic precursor B-cell lymphomas (70%, 7 of 10) had an intensity score of 3 compared to the diffuse large B-cell centroblastic tumors (16%, 2 of 12), this difference was less apparent with densitometry, given that the median total intensity of positive pixels was similar in both tumor types (1,255 and 1,239, respectively).
TfR1 Expression As It Relates to Mitotic Index
No difference in the median mitotic index was seen between the B-cell and T-cell subgroups within either the high-grade tumors or the low-grade tumors. High-grade tumors (HGB and HGT) had significantly higher median mitotic indices than did the two low-grade tumor groups (LGB and LGT) (Table 2). We found that mitotic index had statistically significant correlations with both the percentage positive pixels and the total intensity of positive pixels within the T-cell tumor group combined (HGT and LGT); however, correlations were not strong (for both, r 2 < .33 and P < .01). No correlation was observed between mitotic index and these indices in the B-cell tumors (for both, r 2 < .01 and P > .50).
Discussion
As hypothesized, TfR1 is expressed in canine lymphoma, with more than 75% of cells expressing this receptor in 95% of the present cases. However, substantial variability was present within subgroups in intensity of staining. This variability was associated with tumor grade and phenotype in that high-grade lymphomas, regardless of phenotype, had significantly higher TfR1 expression than that of LGT lymphomas. In contrast, TfR1 staining intensity in LGB tumors was similar to that in both high-grade tumors and higher than that in LGT tumors. Indeed, 89% of low-grade tumors with moderate to high visual intensity scores were B-cell (17 of 19; LGB and LGT combined), with only 2 LGT tumors having moderate intensity scores.
Given that rapidly dividing cells have a high iron requirement, we expected to find that mitotic rate would correlate to TfR1 expression. Several studies in human NHL have found that TfR1 expression correlates with various proliferation indices, including mitotic rate, 31 Ki67 staining, 24 and 3 H-thymidine incorporation. 21 We found a significant, albeit not strong, correlation between TfR1 expression (densitometric intensity and percentage of positive pixels) and mitotic rate in T-cell tumors but none in B-cell tumors. This can be attributed to the lower mitotic rate in LGB tumors, which had unexpectedly high TfR1 expression. Why LGB tumors have higher TfR1 expression despite a low mitotic rate is unknown, but several possibilities exist. First, these tumors could be transitioning into high-grade forms and could consequently have high TfR1 expression in preparation for increased growth and proliferation. Changes in TfR1 expression can precede increases in DNA content in activated lymphocytes, 5 and progression of LGB into higher-grade tumors has been documented in canine lymphoma. 46 Second, cells in LGB tumors may be in a more activated state. Authors have proposed that TfR1 expression reflects the activation state of neoplastic cells 18,32 and that high expression may confer a selective advantage to the cell, independent of growth rate. 11 Third, high TfR1 expression may be a marker of oncogenic transformation of B-cells; that is, it could be a direct consequence of chromosomal aberrations. Trisomy of chromosome 3 (on which the TfR1 gene is located) 23 has been associated with overexpression of TfR1 in human marginal zone lymphomas. 8,11 Unfortunately, little information is available on the karyotypes of canine lymphoma. Finally, it is possible that high TfR1 expression in LGB is an extension of the phenotype of normal B-cells that give rise to these tumors. Arguing against this theory, we did not find increased TfR1 expression in the marginal zone of normal or hyperplastic canine lymph nodes (Fig. 3c), which are the usual sources of these LGB tumors in dogs. 46 Regardless of the mechanism, it is intriguing that LGB tumors have high TfR1 expression. It is possible that this may translate to progression to more aggressive variants or be a marker of poorer prognosis. In two studies, TfR1 expression was identified as a negative prognostic factor in human NHL. 17,21 Unfortunately, because of insufficient follow-up data, variable treatment protocols, and too few low-TfR1-expressing cases, we could not assess whether TfR1 expression was a prognostic indicator in our study. Large-scale prospective studies are needed evaluating the prognostic significance of this marker in canine lymphoma.
In this study, we used visual scoring and quantitative computerized densitometric methods to assess TfR1 expression. We obtained similar results for both methods, with consistently lower expression in LGT tumors. The Positive Pixel Count algorithm is feasible and superior to the visual scoring system. The continuous data provided by the algorithm allowed us to detect significant differences between tumor types (eg, the LGB and LGT tumors); such data are also less subject to interobserver variation (which we minimized in this study by our use of 3 independent observers blinded to the study, who visually scored the tumors). We also restricted our measurement of TfR1 expression to neoplastic cells, as done in some human studies. 15,34 This allowed for consistent assessment of TfR1 expression in cases of nodular lymphoma and in cases with mixed neoplastic and nonneoplastic lymphoid cells (owing to residual normal lymph node tissue). In contrast, other studies have assessed the overall percentage of TfR1 positive cells in a sample, which might include nonneoplastic cells. 17,21 The inclusion of nonneoplastic cells will affect the results, making it difficult to compare between studies and accurately correlate data to biologic behavior or prognosis. (Residual germinal centers will positively bias results because of high TfR1 expression by normal germinal lymphocytes, whereas residual normal paracortical, marginal, or mantle zones will negatively bias results because of low TfR1 expression by normal cells.)
We used the new WHO system of classification of hematopoietic tumors to classify the canine lymphoma cases on the basis of cell morphology, immunophenotype, and architecture. To decrease bias, all cases were classified by one pathologist who was blinded to the original diagnosis and provided only with the immunophenotype of the tumor. We found that HGB tumors were readily retrieved from archives (63% of our cases were B-cell), but we had difficulty in finding the desired number of LGT lymphomas (72% of the T-cell tumors were high grade). Others have reported a similar low incidence of canine LGT lymphoma, with HGB tumors dominating. 12,14,16,41,43 Within the LGB tumors in our study, the nodal marginal zone lymphomas and lymphoplasmacytic forms predominated, with follicular lymphomas only rarely identified. This result is similar to that of other canine reports where follicular lymphomas were uncommon and marginal zone or lymphoplasmacytic forms predominated, 41,46 and it contrasts with findings in the human literature, where nodal marginal zone and lymphoplasmacytic lymphomas are rarely diagnosed and the follicular lymphomas more common. 28
We used standard immunohistochemistry methods to show that the murine monoclonal antibody H68.4, directed against human TfR1, stained canine placenta and lymph nodes in a pattern consistent with their expected TfR1 expression. 13,25 Furthermore, we used immunoblotting to show that the antibody detected a protein of similar molecular weight to human TfR1 in lysates of human placenta and canine lymphoma (B-cell and T-cell). Although a small difference in band migration was seen between the human and canine tissues on the immunoblot, we attributed this to differences in glycosylation that may be intrinsic to the normal protein 23 or to an abnormality associated with neoplastic transformation. 33 Another similar receptor, TfR2, has recently been discovered. TfR2 also plays a role in iron metabolism but is found mostly on hepatocytes. 20 Although TfR1 and TfR2 share 66% homology in their extracellular domains, they differ in their cytoplasmic domain. 23 The H68.4 antibody is specifically directed against the cytoplasmic domain of the TfR1; therefore, cross-reaction of the antibody with TfR2 is unlikely. Unfortunately, there are (to our knowledge) no available anti-TfR2 antibodies that cross-react with canine tissue. Our results demonstrate that the H68.4 antibody is useful for assessing TfR1 expression in histologic sections in dogs. However, surface expression of TfR1 is more relevant for studies evaluating canine TfR1 as an oncolytic target. A high-affinity ectodomain-specific anti-canine TfR1 antibody would be required for this purpose but is currently unavailable.
In conclusion, we have shown that TfR1 is expressed in canine lymphoma and may hold promise as a future oncolytic target. Our results also indicate that TfR1 expression in canine lymphoma depends on tumor grade and phenotype. Expression is significantly lower in LGT tumors than in all other lymphoma subgroups (HGT, LGB, and HGB). Unexpectedly high expression of TfR1 was present in LGB tumors, which had a TfR1 expression similar to that of HGT and HGB tumors. TfR1 expression correlates with mitotic index in T-cell, but not B-cell, tumors. Further studies are needed to determine what molecular mechanism is responsible for high TfR1 expression in LGB tumors, whether high cytoplasmic expression correlates to surface expression, and what usefulness TfR1 has as a prognostic marker and oncolytic target in canine lymphoma.
Footnotes
Acknowledgements
We wish to thank Drs Cheryl Balkman, Mark Roberson, and Donald Schlafer for provision of tissues and protein lysates, Pat Fisher for technical assistance, and Drs Deanna Schaefer and Seigo Ogasawara for visual scoring of transferrin receptor 1 expression.
The authors declared that they had no conflicts of interest with respect to their authorship or the publication of this article.
The authors declared that they received no financial support for their research and/or authorship of this article.