
Abstract
Proteasome inhibitor therapeutics (PITs) have the potential to cause peripheral neuropathy. In a mouse model of PIT-induced peripheral neuropathy, the authors demonstrated that ubiquitin-positive multifocal protein aggregates with nuclear displacement appear in dorsal root ganglion cells of animals that subsequently develop nerve injuries. This peripheral-nerve effect in nonclinical models has generally been recognized as the correlate of grade 3 neuropathy in clinical testing. In differentiated PC12 cells, the authors demonstrated perturbations correlative with the development of neuropathy in vivo, including ubiquitinated protein aggregate (UPA) formation and/or nuclear displacement associated with the degree of proteasome inhibition. They compared 7 proteasome inhibitors of 3 chemical scaffolds (peptide boronate, peptide epoxyketone, and lactacystin analog) to determine if PIT-induced peripheral neuropathy is modulated by inhibition of the proteasome (ie, a mechanism-based effect) or due to effects independent of proteasome inhibition (ie, an off target or chemical-structure-based effect). The appearance of UPAs was assayed at IC90 ± 5% (90% inhibition concentration ± 5%) for 20S proteasome inhibition. Results show that each of the investigated proteasome inhibitors induced identical proteasome-inhibitor-specific ubiquitin-positive immunostaining and nuclear displacement in PC12 cells. Other agents—such as paclitaxel, cisplatin, and thalidomide, which cause neuropathy by other mechanisms—did not cause UPAs or nuclear displacement, demonstrating that the effect was specific to proteasome inhibitors. In conclusion, PIT-induced neuronal cell UPA formation and nuclear displacement are mechanism based and independent of the proteasome inhibitor scaffold. These data indicate that attempts to modulate the neuropathy associated with PIT may not benefit from changing scaffolds.
The ubiquitin–proteasome system (UPS) plays a critical role in the degradation of many proteins involved in cell cycle regulation, apoptosis, and angiogenesis. Because these pathways are fundamental for cell survival and proliferation, the UPS has become an attractive molecular target in cancer. 1 Proteasome inhibition results in anticancer activity by a variety of mechanisms, including inhibition of NF-κB, inhibition of antiapoptotic molecules (eg, bcl-2), accumulation of p53, and induction of endoplasmic reticulum (ER) stress. 30
Bortezomib (VELCADE®, Millennium Pharmaceuticals, Inc, Cambridge, MA, and Johnson & Johnson Pharmaceutical Research & Development, LLC, Raritan, NJ; also known as PS-341) is a potent and selective first-in-class peptide boronate proteasome inhibitor that is approved in the US for the treatment of patients with multiple myeloma and with mantle cell lymphoma who have received at least 1 prior therapy. 18 Since bortezomib’s approval, development has begun on novel clinically relevant proteasome inhibitors such as salinosporamide A and carfilzomib. 21 These proteasome inhibitors—bortezomib, salinosporamide A, and carfilzomib—represent 3 classes of chemical compounds: peptide boronates, lactacystin analogs, and peptide epoxyketones, respectively. Bortezomib has become a standard of care for the treatment of multiple myeloma. With the introduction of this proteasome inhibitor and other novel agents, outcomes for myeloma patients have significantly improved over the past 10 years. Whereas marked inhibition of proteasome activity can result in peripheral neuropathy, the central nervous system does not develop neuronal dysfunction, because bortezomib does not cross the blood–brain barrier in a biologically significant level. 6
Peripheral neuropathy is a common adverse effect of many chemotherapeutic drugs, including proteasome inhibitors 2 ; however, the mechanism of chemotherapeutic neuropathy is not completely understood. To better understand the mechanism of proteasome-inhibitor-induced peripheral neuropathy, in vitro and in vivo models have been developed. 8,27 In a mouse model of proteasome-inhibitor-induced peripheral neuropathy, we demonstrated that, after treatment, ubiquitin-positive multifocal protein aggregates with nuclear displacement appear in the dorsal root ganglion (DRG) cells of the animals as the primary high-dose peripheral nervous system effect. 27 In GT-1 neuronal- and nerve growth factor–differentiated PC12 cells, we demonstrated perturbations correlative with the development of neuropathy in vivo, including ubiquitinated protein aggregate (UPA) formation and/or nuclear displacement associated with the degree of proteasome inhibition. Numerous reports indicate that aggregated proteins can disrupt cellular function through a variety of mechanisms, including ER stress, protofibrillar amyloid pore formation in the cell membranes, and sequestration of key cellular factors. 3,24 It has also been hypothesized that the protein aggregates may not cause cell injury but rather appear as a consequence of neuronal dysfunction, with subsequent perturbation of axonal transport leading to nerve injury symptoms and lesions. Protein aggregates have been recently likened to tombstones, representing the endpoint of a past disease process in neurodegenerative diseases. 7 It was recently demonstrated that UPA formation was linked not only to proteasome inhibition but also to lysosomal dysfunction in neuronal cells. 15
Owing to the apparent linkage of UPA formation and neuronal dysfunction, the presence of UPA was chosen as the endpoint in the present study. This study provided supportive data that the peripheral neuropathy associated with proteasome inhibitor therapeutics (PITs) was mechanism based and therefore independent of the chemical structure of the proteasome inhibitor. Multiple proteasome inhibitors of diverse chemical structures were compared in vitro using the PC12 cell–based neurotoxicity model to demonstrate the relationship between the chemical structure and the pharmacological effects and induction of tissue injury. Nerve growth factor–differentiated PC12 (pheochromocytoma) cells assume a neuronal phenotype and are models for cell biological and biochemical studies of neuronal intracellular phenomena. 11 It has been reported that UPAs can form in PC12 cells after proteasome inhibitor treatment. 23 We investigated the effect of proteasome inhibitors of diverse chemical structures in PC12 cells—specifically, the presence of polyubiquitinated proteins by Western blot analyses, the accumulation of UPAs as assessed by immunohistochemistry (IHC), and the level of 20S proteasome inhibition by measuring chymotryptic activity. The results suggest that PIT-associated adverse effects in neuronal cells were independent of the chemical scaffold.
Materials and Methods
Test and Control Articles
The proteasome inhibitor lactacystin (Sigma-Aldrich, St Louis, MO) was dissolved in tissue culture medium. Synthetic epoxomicin (Calbiochem, a division of EMD Biosciences, Inc, La Jolla, CA) was dissolved in dimethyl sulfoxide (DMSO; Sigma-Aldrich) for tissue culture experiments. Experimental proteasome inhibitors (EPIs) representing the 3 chemical scaffolds—designated EPIB (boronates), EPIL (lactacystin analogs), and EPIE (epoxyketone derivatives)—were synthesized (Millennium Pharmaceuticals, Inc, Cambridge, MA) and dissolved in DMSO (Sigma-Aldrich) for tissue culture experiments. For in vivo studies, the mannitol-coupled derivative of the peptide boronate EPIB2 was dissolved in saline for injection; for placebo controls, only the mannitol component of the mannitol–EPIB2 complex was dissolved in saline for injection.
Mouse Model of Peripheral Neuropathy
Animal care and experimentation procedures were conducted according to the National Institutes of Health’s Guide for the Care and Use of Laboratory Animals, as well as the guidelines of the National Research Council. BALB/c mice aged 8 to 10 weeks were purchased from Charles River Laboratories (Wilmington, MA) and acclimated for 5 days in our testing facilities before performance of this study. The peptide boronate proteasome inhibitor EPIB2 was administered intravenously to 3 BALB/c mice per dose group, once daily, on days 1, 4, 8, and 11 at doses of 0.3, 0.6, 1.0, and 2.0 mg/kg (0.9, 1.8, 3.0, and 6.0 mg/m2). One mouse was sacrificed on day 2, 2 on day 8 from the 2-mg/kg group, and the rest on day 15. Mice were perfused using a solution of 1% sodium nitrate in heparinized (1000 U/mL) phosphate-buffered saline (1 × PBS) at 37°C, followed by 10% neutral-buffered formalin. Dorsal root ganglia from the lumbar region (6 per mouse) were collected and paraffin-embedded for hematoxylin and eosin staining and ubiquitin IHC analysis. The IHC analysis was performed as detailed in the Immunohistochemistry section of Materials and Methods with the exception that the FL-76 rabbit polyclonal antibody from Santa Cruz Biotechnology (Santa Cruz, CA) was used as primary antibody followed by a horseradish peroxidase–conjugated anti-rabbit secondary antibody (Santa Cruz Biotechnology), whereas the rabbit polyclonal immunoglobulin G was used as a negative control (Sigma-Aldrich).
Cell Culture
PC12 cells were obtained from the American Type Culture Collection and grown at 37°C and 5% CO2. Cells were cultured in RPMI medium 1640 (+ L-glutamine/+25 mM HEPES) supplemented with 5% heat-inactivated fetal bovine serum (Gibco, Invitrogen Corp, Grand Island, NY), 10% heat-inactivated horse serum (Gibco, Invitrogen Corp), 50 μg/mL penicillin, and 50 μg/mL streptomycin. Nondifferentiated cells were grown in 75-cm2 flasks (BD Biosciences, Bedford, MA) coated in type IV collagen (Sigma-Aldrich) and were split once weekly. For differentiation, PC12 cells were grown in 150-mm tissue culture dishes coated with 10 μg/cm2 type I collagen (Sigma-Aldrich). Cells were plated on the type I collagen-coated dishes at a density of 30 000 cells per square centimeter and incubated overnight before the addition of 100 ng/mL human recombinant nerve growth factor (NGF; Sigma-Aldrich) for differentiation. Tissue culture medium and NGF were replaced on day 5. Cells were differentiated for 7 days before treatment.
Viability Assay
WST-8-based viability assays were performed on PC12 cells differentiated with 100 ng/mL human recombinant NGF for 7 days in 96-well plates (BD Biosciences). Cells were exposed to either proteasome inhibitors or other compounds, such as paclitaxel, cisplatin, and thalidomide in concentration ranges that produced a dose response curve from which lethal dose (LD) values could be defined. The concentrations representing the LD50 values for paclitaxel, cisplatin, and thalidomide were then used in the subsequent experiments. After exposure to one of the agents, 10 μL Cell Counting Kit-8 reagent (Axxora, San Diego, CA) was added to each well, and cells were incubated for 1 to 4 hours. Absorbance, which was proportional to cell viability, was measured at 450 nm. Viability was expressed in percentages relative to nontreated controls representing 100% viability.
20S Proteasome Activity Measurement
A fluorogenic kinetic assay was used to measure the chymotryptic ativity of the 20S proteasome. 19 Approximately 106 differentiated PC12 cells were lysed in 300 μL 5 mM EDTA for 15 minutes and then centrifuged at 6600 × g for 15 minutes at 4°C. An aliquot of the protein extract with 100 μL reaction buffer (20 mM HEPES, pH 8.4) and 100 μL fluorogenic chymotryptic substrate (Suc-Leu-Leu-Val-Tyr-7-amino-4-methylcoumarin; AMC) (Bachem Americas, Inc, Torrance, CA) at a final concentration of 78 μM was added to each well of a 96-well plate. Plates were read in a plate reader at 40-second intervals for 25 minutes using an excitation wavelength of 380 nm and an emission wavelength of 450 nm. To convert fluorescence units to nanomoles (nM) of AMC, a standard curve was prepared at a concentration range of 900 to 0nM. Protein concentrations were measured using Coomassie Plus Protein Assay Reagent (VWR, West Chester, PA). The specific activity of the chymotryptic site was determined in the presence (SpAp) and absence (SpAa) of the proteasome inhibitors in units of nM AMC/sec/mg protein. The extent (percentage) of proteasome inhibition (%I) was calculated using the following equation: %I(SpA) = 100 × (1 – SpAp/SpAa). Dose–response curves for determining inhibitory concentration (IC) values were generated using the XLfit software (ID Business Solutions Ltd, Burlington, MA).
Western Blot Analyses
Cells were lysed in lysis buffer (125 mM Tris-HCl, pH 6.8) containing 4% sodium dodecyl sulfate (SDS) plus the protease inhibitors antipain, aprotinin, benzamidin, bestatin, chymostatin, leupeptin, pefabloc C, pepstatin A, phenylmethylsulfonyl fluoride, Nα-tosyl-Lys-chloromethylketone-HCl, and L-1-tosylamido-2-phenylethyl chloromethyl ketone at concentrations recommended by the manufacturer (Roche Molecular Biochem, Indianapolis, IN). Samples were sonicated (30 seconds), heated (95°C, 10 minutes), and centrifuged at room temperature (10 000 × g, 10 minutes). Protein was quantified using the DC protein assay kit (Bio-Rad Laboratories, Hercules, CA). After reduction with 2.5% β-mercaptoethanol, samples were heated to 95°C for 5 minutes, and 100 μg protein per lane was resolved by 4 to 18% SDS-PAGE (sodium dodecyl sulfate–polyacrylamide gel electrophoresis). Proteins were transferred to 0.2-μm polyvinylidene fluoride membranes (Gibco, Invitrogen Corp). Membranes were blocked with Blotto solution and incubated with the primary antibodies ubiquitin (P4D1-HRP, 0.2 μg/mL) and β-tubulin (H-235, 0.2 μg/mL) overnight. Membranes were washed 3 times with 1 × PBS containing 0.1% Tween-20, and the β-tubulin membranes were incubated with a peroxidase-conjugated secondary antibody (0.2 μg/mL) for 1 hour at room temperature. Membranes were then washed 3 times with 1 × PBS containing 0.1% Tween-20, and bands were revealed by Western blotting luminol reagent. Antibodies and the luminal reagent were purchased from Santa Cruz Biotechnology (Santa Cruz, CA). Blots were exposed to BioMax MR double-emulsion films (Eastman Kodak, Rochester, NY).
Immunohistochemistry
Approximately 5 × 10⁶ differentiated PC12 cells were collected for making paraffin blocks. Cells were washed 3 times with 50 mL 1 × PBS and centrifuged at 1800 revolutions per minute (rpm) for 5 minutes after each wash. Cells were resuspended in 10 mL 4% paraformaldehyde in 1 × PBS, incubated at room temperature for 20 minutes, then centrifuged at 2000 rpm for 5 minutes. Cells were washed 3 times with 50 mL 1 × PBS and centrifuged at 2000 rpm for 5 minutes after each wash. Cell pellets were resuspended in 45 mL 70% ethanol, incubated at room temperature for 30 minutes, and centrifuged at 2000 rpm for 5 minutes. Cells were then resuspended in 45 mL 100% ethanol, incubated at room temperature for 30 minutes, then centrifuged at 2000 rpm for 5 minutes. Cell pellets were transferred to a 1.5-mL microcentrifuge tube and washed with 700 μL 70% ethanol. After a quick spin to precipitate cells, ethanol was removed, and the tubes were incubated at 55°C. Prewarmed (55°C) HistoGel (Richard-Allan Scientific, Kalamazoo, MI) was added to the cell pellet at a 4:1 (gel:pellet) ratio and mixed thoroughly. In addition, 200-μL aliquots of suspension were dropped onto a parafilm sheet (American National Con, Menasha, WI) using a prewarmed cut-end 200-μL pipette tip. After solidification, gel droplets were placed in 20 mL 70% ethanol and processed for paraffin embedding. Processing involved a short protocol with the following settings: 95% ethanol, 30 minutes; 100% ethanol, 3 × 30 minutes; xylene, 3 × 30 minutes; paraffin 2 × 30 minutes. From the blocks, 5 μm sections were mounted on charged Superfrost Plus microscopy slides (Erie Scientific Company, Portsmouth, NH), air-dried overnight, and incubated at 56°C for 15 minutes. Sections were deparaffinized in xylene (2 × 4 minutes), 100% ethanol (2 × 4 minutes), 95% ethanol (2 × 2 minutes). Slides were twice rinsed with water and placed in 1 × PBS. Endogenous peroxidase activity was blocked by incubating slides in 1 × PBS solution containing hydrogen peroxide (0.3%) for 10 minutes. Slides were rinsed once with 1 × PBS and incubated in 10 mM citrate buffer, pH 6.0, for 2 minutes. Slides were transferred to hot citrate buffer (heated to 85°C by microwave exposure) and incubated for 10 minutes. The container with the slides and hot buffer was placed in ice-cold water for 10 minutes. Slides were washed twice in 1 × PBS for 5 minutes each. In a humid chamber, slides were treated with 1 × PBS containing 0.05% Tween-20 for 1 minute. Slides were then blocked with 5% horse serum in 1 × PBS at room temperature for 30 minutes. Blocking solution was removed by tapping the slides against a sheet of paper, and the ubiquitin antibody P4D1 (0.5 μg/mL) diluted in 1 × PBS was immediately placed over the tissue sections, which were incubated at 4°C overnight. Slides were rinsed in 1 × PBS containing 0.05% Tween-20 three times for 3 minutes each. Color was developed by incubation with the liquid DAB (3,3′-diaminodbenzidine) substrate (BioGenex, San Ramon, CA) for approximately 4 minutes. The reaction was stopped in water. Slides were stained with Gill II hematoxylin for 1 minute, dehydrated, and mounted.
Results
Mouse Model of Peripheral Neuropathy
The most severe alterations in the DRG were present at the 2 mg/kg dose. Histomorphologic changes in the neurons of the DRG consisted of nuclear displacement and UPA formation, which was visualized by immunostaining (Fig. 1 ). These results were consistent across all DRG neurons.
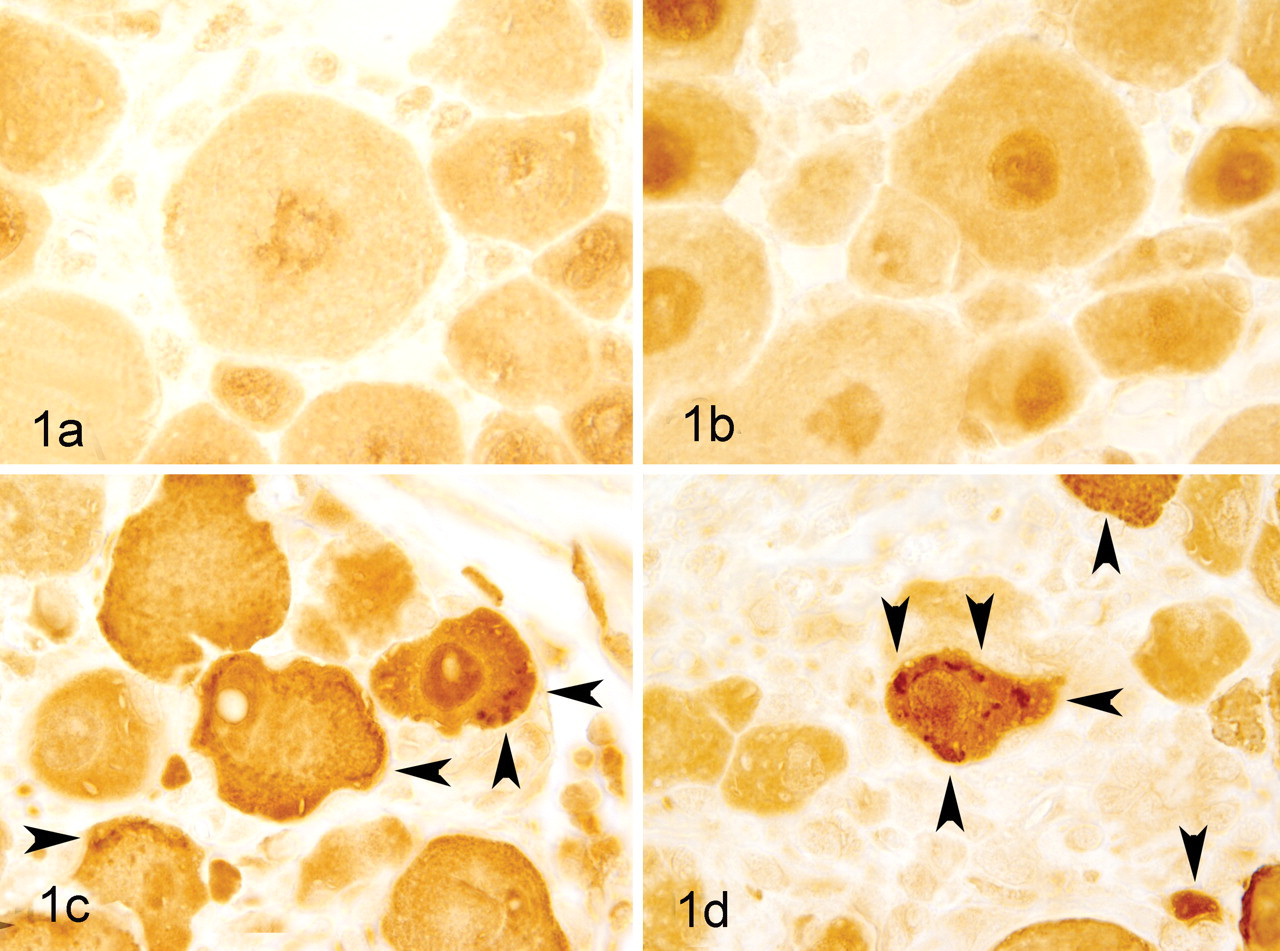
Dose-dependent induction of ubiquitin-positive protein aggregates in the dorsal root ganglion neuronal cells of BALB/c mice treated with increasing doses of the proteasome inhibitor EPIB2 and stained with an ubiquitin-specific antibody. A, 0.0 mg/kg EPIB2 (placebo); B, 0.6 mg/kg EPIB2; C, 1.0 mg/kg EPIB2; D, 2.0 mg/kg EPIB2. Arrows indicate the ubiquitin-positive protein aggregates. EPI, experimental proteasome inhibitor.
In Vitro Neuropathy Model
Exposure to proteasome inhibitors resulted in a clear dose-dependent inhibition of the 20S proteasome, ranging from 10% to 100%. As shown by dose–response curves, proteasome inhibitor concentrations equivalent to IC50 or IC90 (ie, 50% or 90%) had markedly different UPA formation effects (Fig. 2 ). Numerous physicochemical effects could have contributed to the broad range of these IC values. Peptide boronates were the most potent, and lactacystin analogs the least potent, inhibitors of 20S proteasome activity in differentiated PC12 cells.
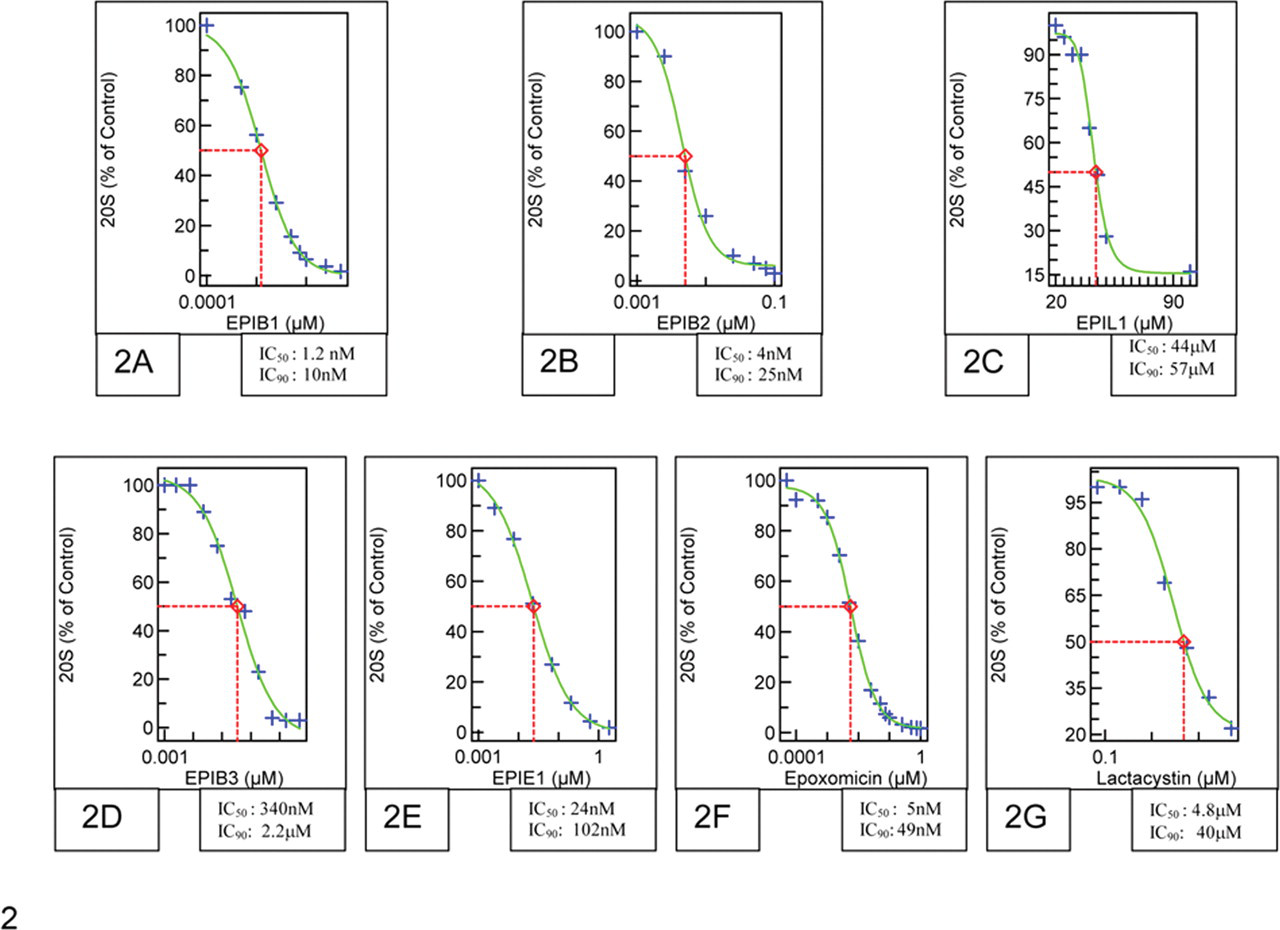
Dose–response curves for the determination of IC50 and IC90 values for 20S proteasome inhibition in differentiated PC12 cells. Cells were exposed to indicated concentrations of proteasome inhibitors for 24 hours. Inhibition of the chymotrypsin-like activity of the proteasome was evaluated by a fluorogenic kinetic assay, as described in the Materials and Methods section. Levels of proteasome inhibition (%) were plotted against the concentrations of the proteasome inhibitors to determine the IC50 and IC90 values, shown in the corresponding squares. IC50 and IC90, inhibitory concentration (50% and 90%).
Phenotype of the Proteasome-Inhibitor-Treated Cells In Vitro
Proteasome-inhibitor-treated PC12 cells in tissue culture gradually rounded up and occasionally detached from the culture plate by day 3 as the length of exposure time increased. This phenotypical change was accompanied by ubiquitin protein upregulation and the appearance of ubiquitinated proteins in Western blots (Fig. 3 ). WST-8-based cytotoxicity assays indicated that 20S proteasome inhibition and UPA formation were both well tolerated by differentiated PC12 cells during the 3-day experimental period (Table 1 ). The exceptions were lactacystin and its analog EPIL1, as well as epoxomicin. Lactacystin is known to inhibit not only the proteasome but also the lysosomal enzyme cathepsin A, and the combination of proteasome inhibition and these additional activities may not have been well tolerated by the affected cells. 17 The toxic effects of epoxomicin were intriguing because the catalytic subunits of the 20S proteasome were the only cellular targets of epoxomicin known to date. 14
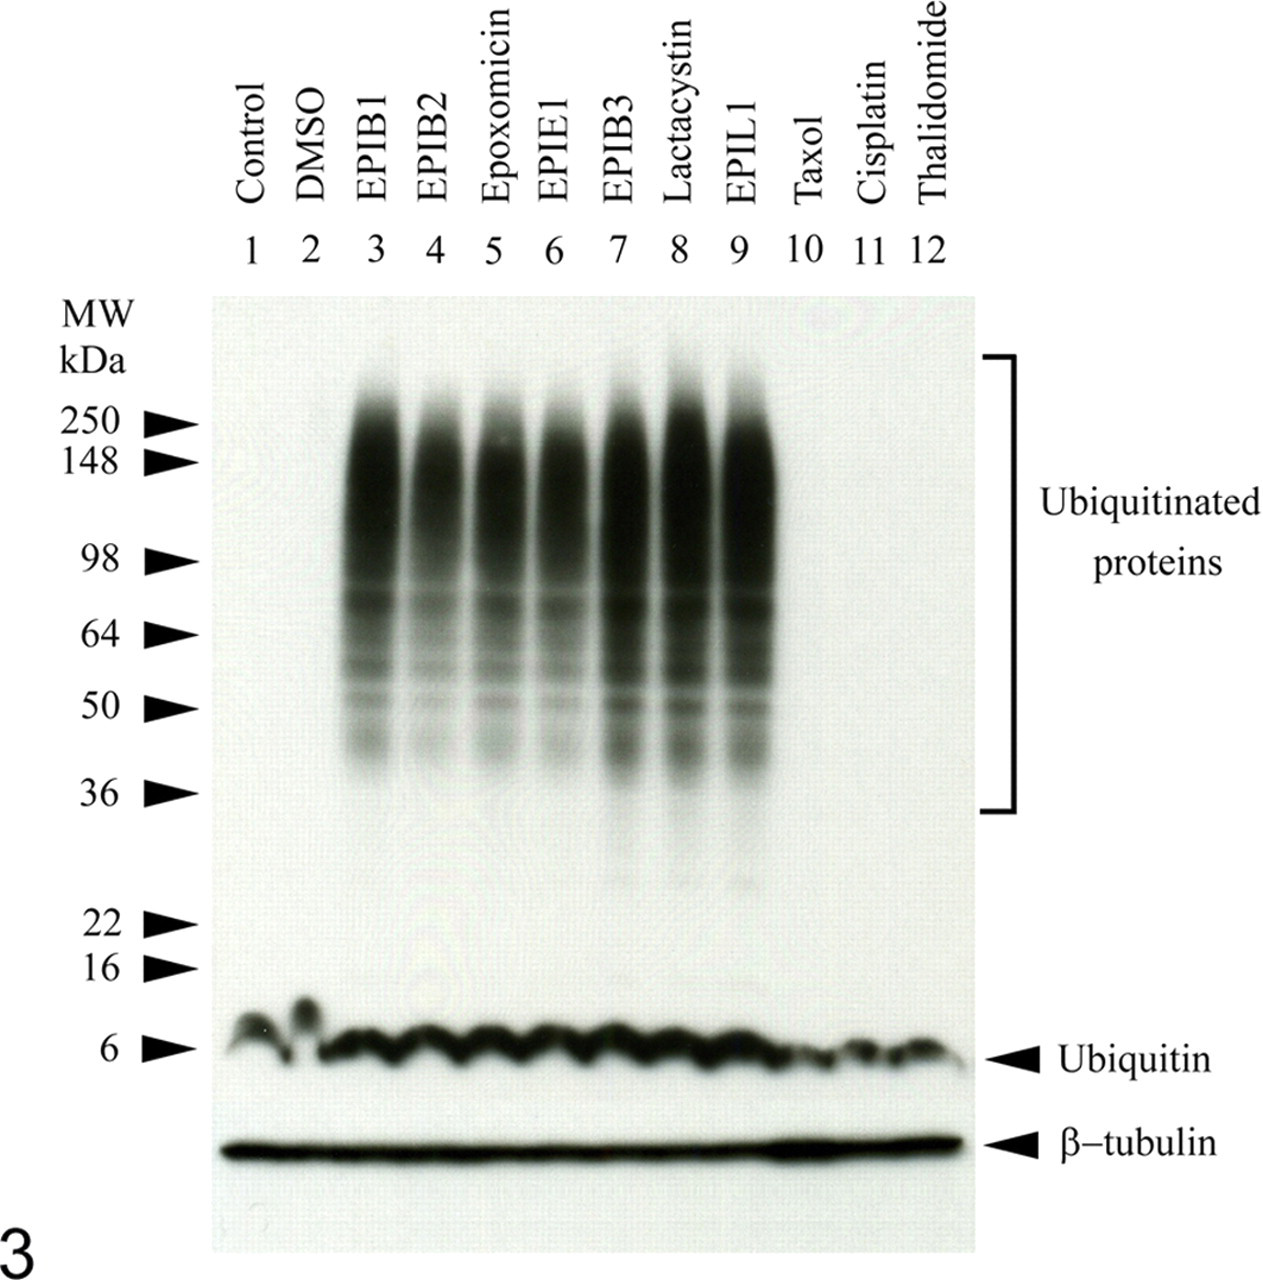
Proteasome inhibitors specifically induced the ubiquitin protein and the polyubiquitination of multiple other proteins in differentiated PC12 cells. Cells were exposed to the indicated proteasome inhibitors resulting in 90 ± 5% proteasome inhibition or to paclitaxel (Taxol), cisplatin, and thalidomide at LD50 for 24 hours. In sum, 100 μg of total protein per lane was separated by SDS-PAGE. Proteins were transferred to a polyvinylidene fluoride membrane, and the ubiquitin was visualized by a horseradish peroxidase–conjugated monoclonal antibody (P4D1) recognizing both free and conjugated ubiquitin. Equal loading was demonstrated using an antitubulin polyclonal antibody. LD50, lethal dose (50%); SDS-PAGE, sodium dodecyl sulfate–polyacrylamide gel electrophoresis.
Basic Properties of the Proteasome Inhibitors Used in the Present Analyses a
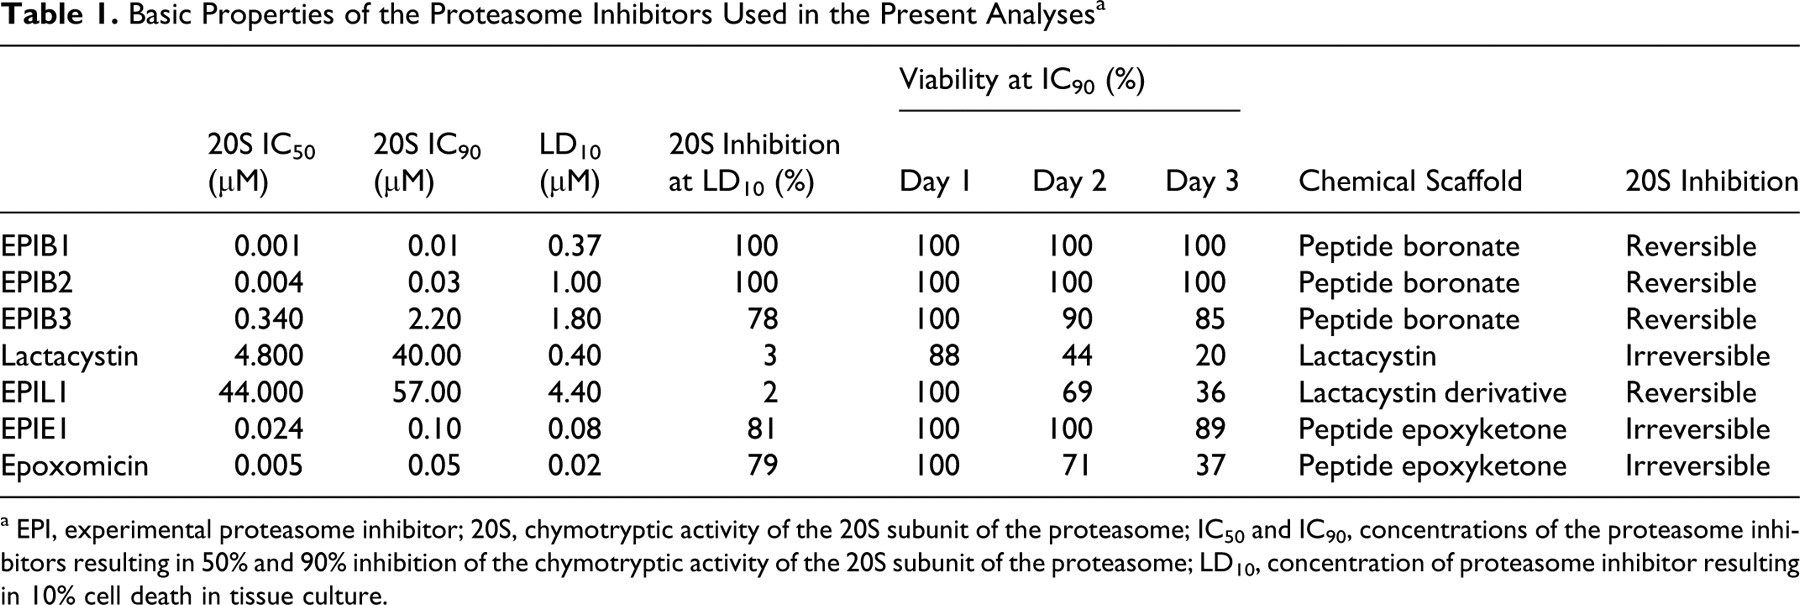
a EPI, experimental proteasome inhibitor; 20S, chymotryptic activity of the 20S subunit of the proteasome; IC50 and IC90, concentrations of the proteasome inhibitors resulting in 50% and 90% inhibition of the chymotryptic activity of the 20S subunit of the proteasome; LD10, concentration of proteasome inhibitor resulting in 10% cell death in tissue culture.
Ubiquitin Positive Aggregates in the In Vitro Model
In contrast to the dose–response relationship for inhibition of the 20S proteasome, ubiquitin IHC analysis revealed that most UPAs did not not appear until a threshold of 90 ± 5% of 20S proteasome inhibition was reached (Fig. 4 ). Ubiquitin IHC analysis was also performed after administration of EPIB1, EPIL1, and epoxomicin compounds (representing 3 different molecular scaffolds) at IC90 ± 5% for 3 consecutive days to identify the optimal exposure time for UPA detection. These results showed that day 2 was the earliest time point at which the UPAs could be identified (Fig. 5 ). These data indicated that proteasome inhibitor concentrations of IC90 ± 5% for 20S proteasome activity and 2-day exposures were the optimal experimental conditions for UPA formation and detection by IHC in differentiated PC12 cells. These conditions were used to investigate UPA formation in the next phase of the study, when the effects of each of the 7 proteasome inhibitors were compared at the same level of 20S inhibition (IC90 ± 5%). Each proteasome inhibitor induced identical, proteasome-inhibitor-specific, ubiquitin-positive immunostaining and nuclear displacement in PC12 cells at the IC90 ± 5%. The effect was specific to proteasome inhibitors because other compounds that caused neuropathy by independent mechanisms, such as paclitaxel, cisplatin, and thalidomide, did not cause UPAs, as indicated by ubiquitin Western blot (Fig. 3) and nuclear displacement analyses (Fig. 6 ). The unique morphology of UPAs in PC12 cells is shown by representative cells after ubiquitin IHC (Fig. 7 ). The selected cells exhibited a complex phenotype with single or multiple cytoplasmic compartments containing UPA or ubiquitinated proteins.
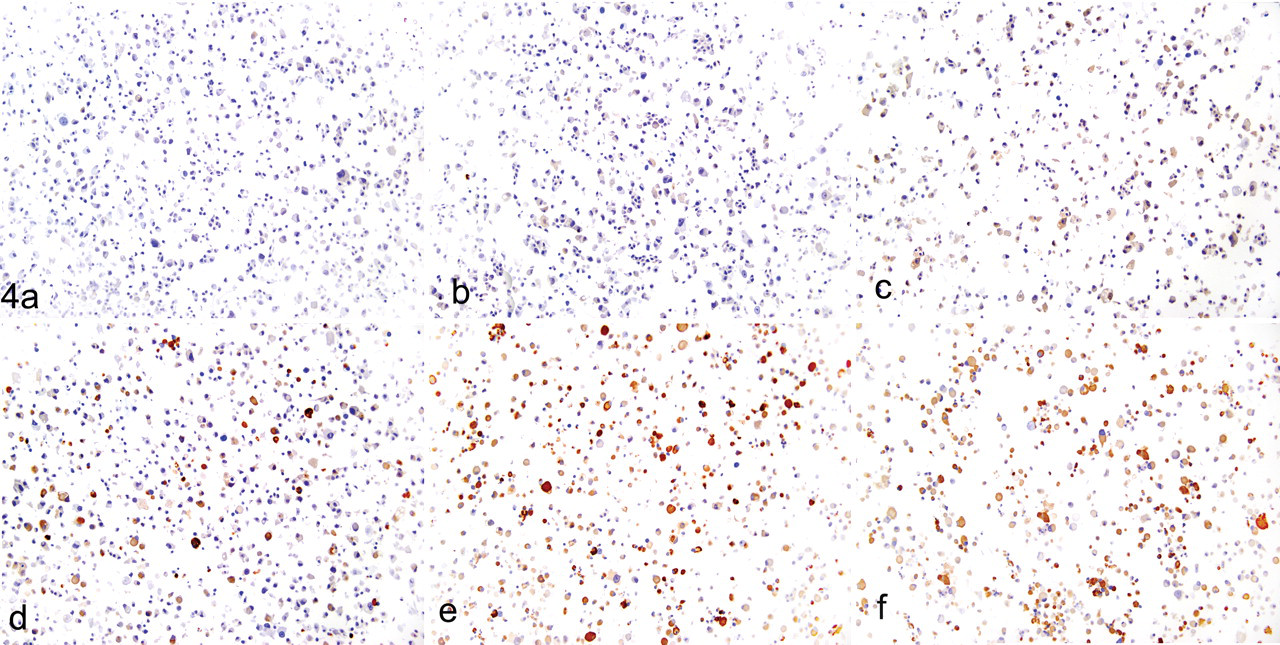
The appearance of ubiquitin-positive aggregates is associated with a high degree of proteasome inhibition. Ubiquitin-positive proteins were visualized by DAB (3,3′-diaminodbenzidine) immunohistochemistry on day 2 using an ubiquitin-specific monoclonal antibody (P4D1). Differentiated PC12 cells were exposed to EPIB1 at concentrations resulting in ≤ 60%, 70%, 80%, 90%, 95%, and 100% proteasome inhibition (A–F, respectively). EPI, experimental proteasome inhibitor.
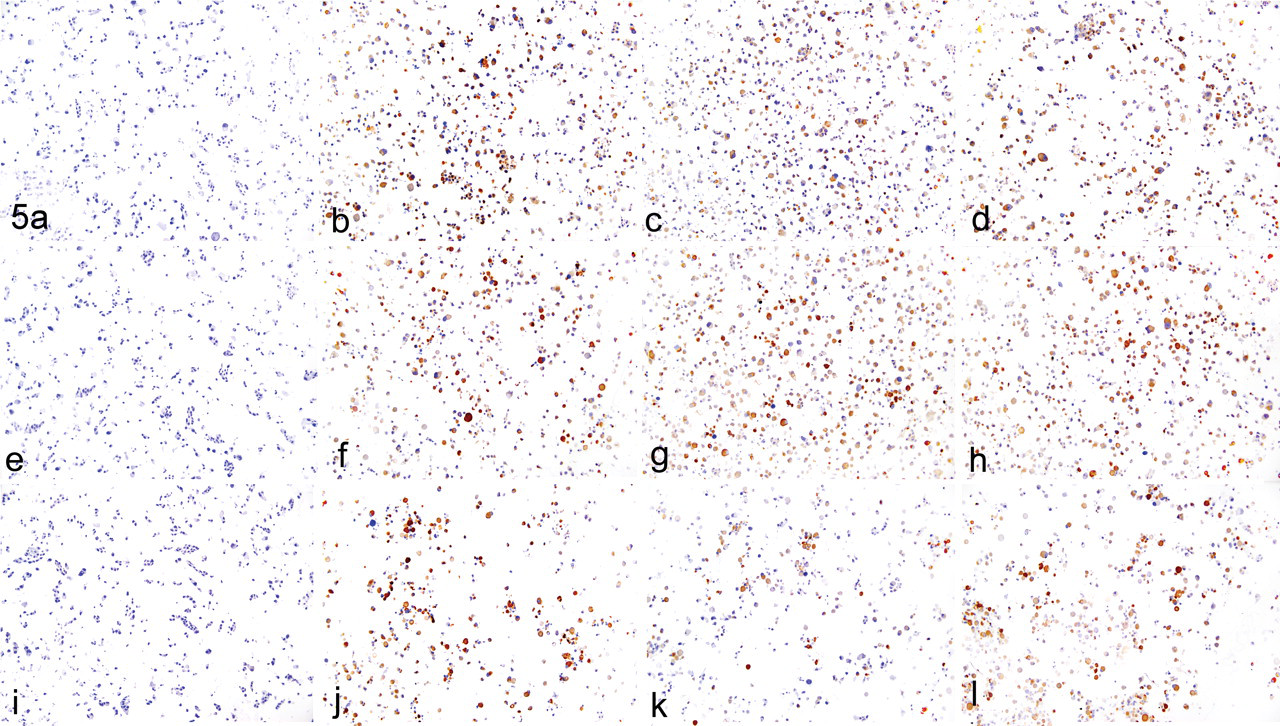
Time course of ubiquitinated protein aggregate induction at 90 ± 5% proteasome inhibition. Differentiated PC12 cells were exposed to proteasome inhibitors representing 3 molecular scaffolds. The 3 chemotypes of proteasome inhibitors were peptide boronate (EPIB1; B, F, J), lactacystin analog (EPIL1; C, G, K), and peptide epoxyketone molecules (epoxomicin; D, H, L). Control cells are shown as well (A, E, I). The images in the first row (A–D) represent the status of ubiquitin-positive protein aggregates on day 1; the second row (E–H), day 2; and the third row (I–L), day 3. EPI, experimental proteasome inhibitor.
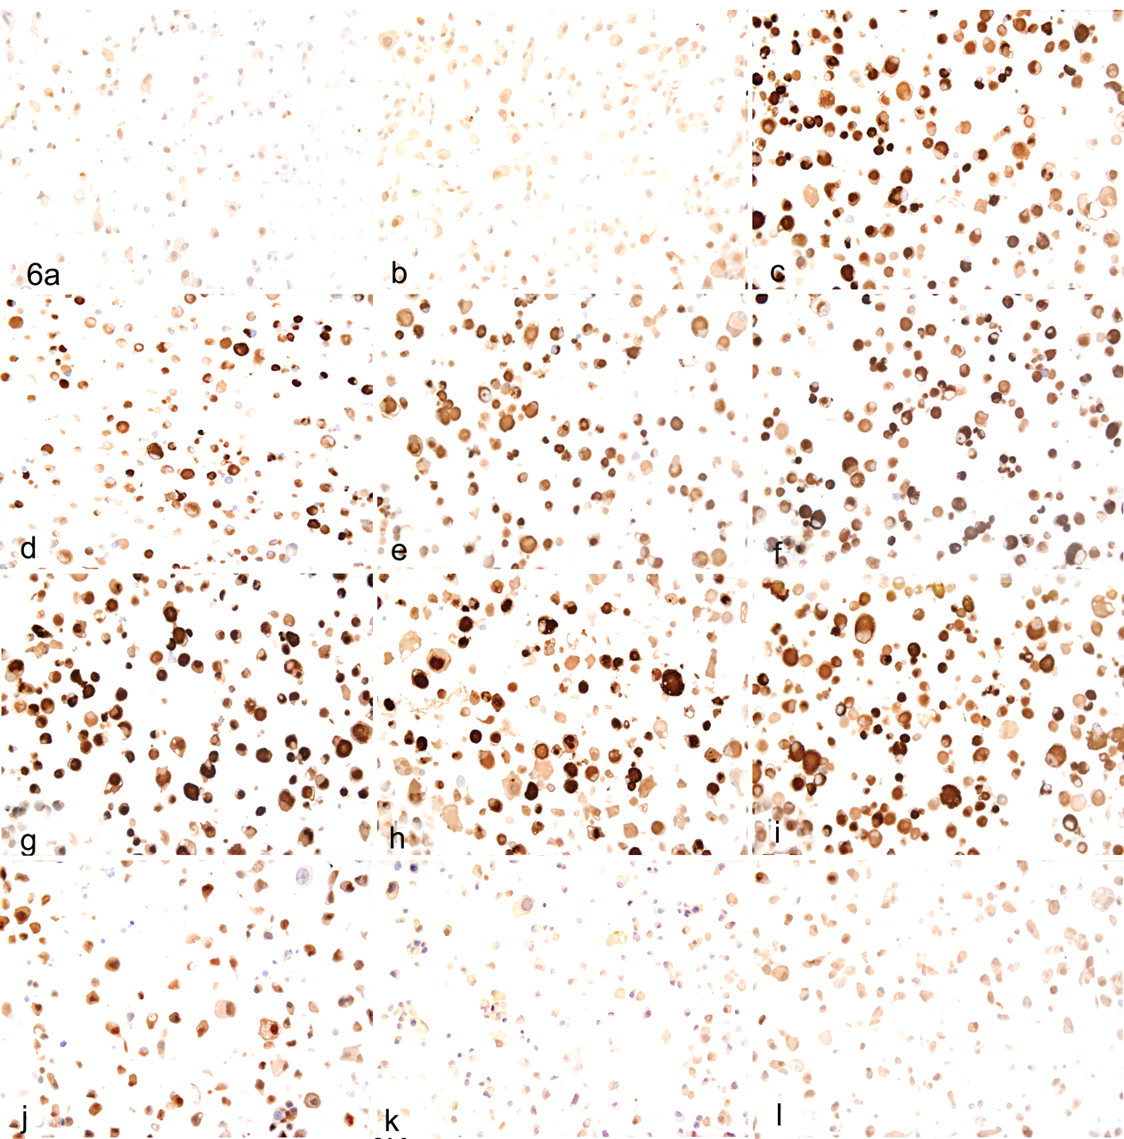
Proteasome inhibitors of different chemotypes induce identical ubiquitin immunostaining and nuclear displacement in differentiated PC12 cells at concentrations equivalent to IC90 ± 5%. A, control cells; B, cells exposed to the solvent 0.1% dimethyl sulfoxide. Cells were also exposed to the following proteasome inhibitors for 2 days: C, epoxomicin; D, lactacystin; E, EPIE1; F, EPIL1; G, EPIB1; H, EPIB2; I, EPIB3. Cells were also exposed to molecules other than proteasome inhibitors such as paclitaxel (J) cisplatin (K), and thalidomide (L), each at LD50 concentrations for 2 consecutive days before DAB (3,3′-diaminodbenzidine) immunohistochemistry. IC90, inhibitory concentration (90%); LD50, lethal dose (50%).
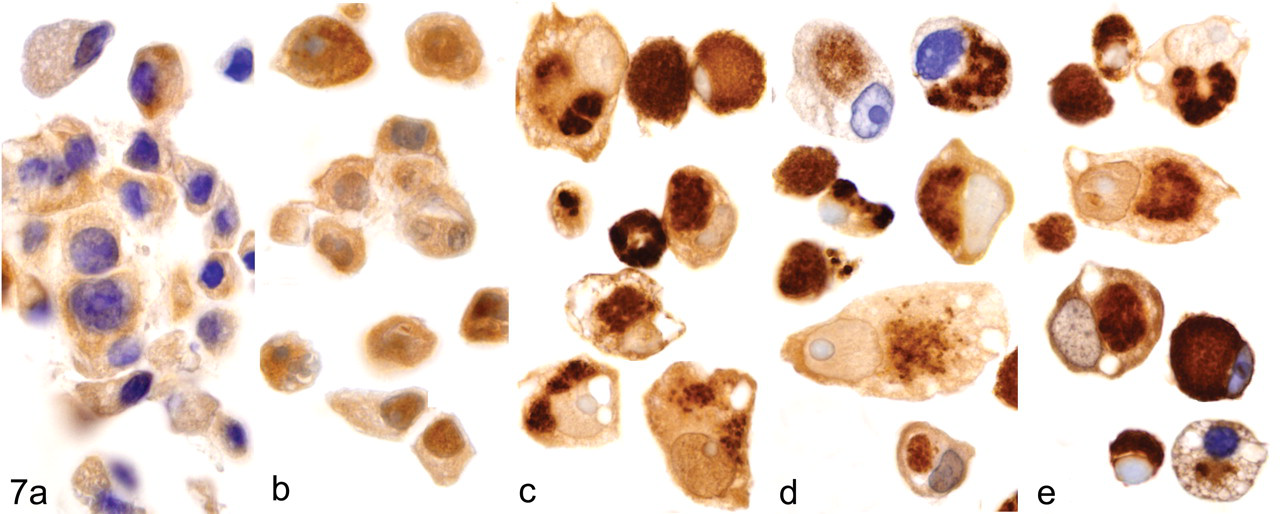
Unique morphology of the UPA-containing differentiated PC12 cells exposed to the indicated proteasome inhibitors for 2 consecutive days at concentrations that resulted in 90 ± 5% proteasome inhibition. To demonstrate proteasome-inhibitor specificity in UPA formation, cells were also exposed to paclitaxel at LD50 for 2 days. Ubiquitin-specific immunohistochemistry was performed on day 2: A, placebo; B, paclitaxel; C, EPIB1; D, EPIE1; E, EPIL1. LD50, lethal dose (50%); UPA, ubiquitinated protein aggregate; EPI, experimental proteasome inhibitor.
Discussion
Understanding the formation and functional role of protein aggregates in PIT-induced peripheral neuropathy could provide critical guidance for the development of effective therapies. The relationships between the level of proteasome inhibition and ubiquitin-positive protein aggregate formation was investigated herein, utilizing differentiated PC12 neuronal cells exposed to 3 different proteasome inhibitor chemotypes. The data supported that UPA formation was specific to the mechanism of proteasome inhibition because paclitaxel, cisplatin, and thalidomide, which cause neuropathy by other mechanisms, did not induce UPAs in our model. 25,26,32 The data also demonstrated that UPA formation in these cells, a characteristic of the effects of proteasome inhibitors in the DRG cells of the mouse peripheral neuropathy model, was dependent on the degree of proteasome inhibition. 27 In addition, this study showed that UPA formation was initiated in PC12 cells only if the chymotryptic activity of the 20S proteasome was inhibited by 90 ± 5%. UPA formation did not exhibit any relationship to the chemotype of proteasome inhibitor, so we concluded that UPA formation was a pharmacologic consequence of proteasome inhibition.
These observations have important implications for the development of future proteasome therapeutics because they indicate that PIT-induced peripheral neuropathy is a pharmacologic (on-target) toxicity. Several retrospective studies have investigated the relationship between the response to treatment and the peripheral neuropathy. 22
It was recently reported that response rate, time to disease progression, and overall survival appeared higher for patients with peripheral neuropathy in a large clinical trial in patients with relapsed multiple myeloma, compared with those patients without peripheral neuropathy. The authors speculated that this finding may have been related to differences in treatment duration between the 2 groups. 22 Hence, one hypothesis is that PIT-induced peripheral neuropathy can be avoided only by limiting exposure of peripheral nerves to PITs. Future therapeutic strategies should thus consider modifying pharmacokinetic properties to limit exposure of peripheral nerves. A challenge in pursuing this strategy is to limit exposure of neurons without limiting exposure to tumors, particularly solid tumors. Novel chemical synthesis strategies and tumor-specific targeting of therapeutics are needed to develop novel proteasome inhibitor molecules with an improved efficacy-to-safety (ie, benefit-to-risk) profile.
Protein aggregation is critical in many neurological diseases, with the UPS involved in the genesis of these inclusions. 13,28 Approximately 30% of newly synthesized proteins are misfolded in the normal cell. 24 Cellular perturbations caused by proteasome inhibitors can increase the quantity of these proteins by preventing their proteolysis. 8 The misfolded proteins are either regenerated by molecular chaperones or, in the case of failure of regenerative mechanisms, delivered to the cytoplasm from the ER lumen and degraded, mostly through the ubiquitin–proteasome pathway. 23 During ER-assisted degradation, after delivery to the cytoplasm, proteins are polyubiquitinated, which labels them for proteasomal degradation. If the proteasome pathway is blocked, continuing protein synthesis results in the accumulation of misfolded proteins, which causes ER stress that triggers defensive cellular mechanisms, including aggresome formation. 16
Any aggregation of misfolded proteins can initiate the formation of larger aggregates that can become ubiquitin-positive inclusions, clearly visible by light microscopy after ubiquitin IHC. One of the most thoroughly investigated examples of these inclusions is the aggresome, a cytoplasmic inclusion body located near the centrosome consisting of aggregated proteins collected from the other parts of the cell through microtubule-based active transport. 16 Aggresomes are similar in structure to the Lewy bodies found in the neuronal cells of the central nervous system in patients with neurodegenerative diseases. 5 Hovewer, not all UPAs are necessarily aggresomes. A recent study demonstrated that perturbations in the lysosomal protein degradation pathway can also result in UPA formation in the lysosomes of neuronal cells of the central nervous system, leading to neurodegeneration in the mouse brain. 15 These UPAs were not identified as aggresomes. In addition, these data showed the importance of ubiquitin and UPA formation not only in association with the UPS but also with other cellular protein degradation pathways and highlighted the critical role of protein aggregates in many neurodegenerative diseases, including peripheral neuropathy.
In this study we did not focus on the characterization of the UPAs in detail, so we could not specify with certainty what type of UPAs were generated. The results reported herein further demonstrated that UPAs were reliable markers of neuronal cell dysfunction irrespective of the underlying mechanisms.
The precise mechanisms leading to proteasome-inhibitor-induced neuronal cell dysfunction are not known. Based on GT-1 neuronal cell responses, our previous report indicated that proteasome inhibition caused cytoskeletal reorganization and accumulation of diverse ubiquitinated and nonubiquitinated proteins in the perinuclear region, which potentially overloaded the ER-dependent protein quality control system and possibly resulted in impaired axonal transport or affected other aspects of cellular homeostasis. 8 These inclusions can form barriers that sequester vital cellular components, such as motor proteins crucial to axonal transport, resulting in decay in the intracellular transport mechanisms in general. 12,29 However, the aggregation intermediates—namely, protofibrils, oligomeric aggregates, and microaggregates that can be generated from practically any misfolded protein—have recently been reported as the real agents of cellular damage rather than the large insoluble aggregates. 3,4,31 We do not know if these models, which refer mostly to neuropathies of the central nervous system, are applicable in the PC12 model or to the peripheral nervous system in vivo. An increasing body of evidence suggests that inclusion body formation is actually a cellular-protective response and can be dissociated from toxicity. 16,20 The aggregates can be cleared by autophagy-related mechanisms with the involvement of the lysosomes and their proteolytic enzymes. 9,10 Given that the status of protein aggregates as neurotoxins is still under debate, additional studies with new approaches to the problem are needed. 5
Footnotes
Acknowledgments
We thank Alexis Khalil, Karen Repetny, and Jelena Veljkovic for a critical reading of the article.
The authors declared that they had no conflicts of interests with respect to their authorship or the publication of this article.
The authors declared that they received no financial support for their research and/or authorship of this article.