
Abstract
Background
Intracerebral hemorrhage is associated with high mortality in intensive care settings. Current prognostic models have limitations, including poor interpretability and insufficient validation in critically ill populations. In this study, we developed an interpretable machine learning model to predict survival in intensive care unit patients with intracerebral hemorrhage.
Methods
This retrospective study used data from patients with intracerebral hemorrhage in the eICU Collaborative Research Database for model development and the Medical Information Mart for Intensive Care IV database for external validation. Clinical, laboratory, and physiological parameters within 24 h of intensive care unit admission were extracted. Six machine learning survival algorithms, including the Random Survival Forest, were implemented. Model performance was assessed using the time-dependent area under the curve, concordance index, and Brier score. Model interpretability was achieved through the SHapley Additive exPlanations framework.
Results
The cohort comprised 5797 patients from eICU and 1423 patients from Medical Information Mart for Intensive Care IV. Random Survival Forest demonstrated superior performance, with a time-dependent area under the curve of 0.88 in internal validation and 0.82 on day 1 of external validation. SHapley Additive exPlanations analysis identified Glasgow Coma Scale score, Acute Physiology Score, age, creatinine, temperature, and systolic blood pressure as key predictors. Critical risk thresholds were Glasgow Coma Scale score <9.8, Acute Physiology Score >52.7, and age >62.9 years.
Conclusion
We developed a machine learning survival prediction model that demonstrated robust performance and clinical utility. The web-based tool may enhance intensive care unit risk stratification and clinical decision-making.
Keywords
Introduction
Although intracerebral hemorrhage (ICH) represents only 10%–15% of all stroke cases, it exhibits a disproportionately high mortality rate of 30%–40%, establishing it as one of the most devastating neurological emergencies.1,2 Despite therapeutic advances in hypertension control and anticoagulation management, ICH continues to pose a considerable disease burden, particularly in older patients and those with multiple comorbidities.3–5 Surviving patients typically exhibit lasting neurological sequelae, impaired quality of life, and an increased predisposition to recurrent cerebrovascular events.6–8 These complications generate substantial clinical uncertainty and place considerable strain on acute care systems and intensive care resources.9–11 Although prognostic instruments such as the ICH score are widely used for early outcome prediction, they have inherent limitations, including dependence on static parameters, insufficient personalization, and subjective evaluation components.12,13 For critically ill patients requiring expeditious decisions regarding intensive interventions or withdrawal of life support, more precise and dynamic prognostic methodologies are urgently needed. 14 This clinical gap has driven growing interest in utilizing comprehensive clinical datasets to enhance outcome prediction through advanced analytical frameworks.
Machine learning (ML) has recently emerged as a transformative technology for clinical decision support, offering substantial advantages over conventional statistical methods. These advantages include superior high-dimensional data processing, identification of complex nonlinear associations, and facilitation of individualized risk stratification.15–19 These capabilities make ML exceptionally well suited for characterizing the diverse clinical trajectories observed in patients with ICH. Geng et al. 20 constructed and validated an ML-based prognostic model for 90-day outcomes in patients with ICH that incorporated clinical, laboratory, and radiological variables. Their random forest algorithm demonstrated excellent discrimination (area under the curve (AUC) = 0.916), with the National Institutes of Health Stroke Scale (NIHSS) score, aspartate aminotransferase (AST) levels, age, white blood cell count (WBC), and hematoma volume emerging as the primary predictive features. Similarly, Mao et al. 21 developed an Extreme Gradient Boosting (XGBoost) algorithm using intensive care data from the Medical Information Mart for Intensive Care (MIMIC) IV (MIMIC-IV) and Zhejiang Hospital databases for in-hospital mortality prediction in patients with ICH. The model exhibited robust performance across internal (AUC = 0.907) and external (AUC = 0.788) validation cohorts, culminating in the creation of a web-based clinical decision-support tool. Artificial intelligence (AI) encompasses both traditional ML approaches and advanced deep learning techniques, each offering distinct capabilities for medical prognostication. In neurosurgery, AI has emerged as a promising tool for outcome prediction and clinical decision support. Recent meta-analyses demonstrate the effectiveness of AI across various neurosurgical conditions,22–25 highlighting its potential to provide more accurate and individualized risk assessments than traditional prognostic scores, particularly in critical conditions such as ICH.
Although these investigations demonstrate the promise of ML applications in ICH prognostication, most current models target general hospitalized populations and frequently lack comprehensive survival modeling, particularly for critically ill cohorts. Currently, no published study has used ML methodologies to develop time-to-event prediction models exclusively for patients with severe ICH in intensive care settings. Given the substantial clinical uncertainty and elevated mortality risk characteristic of this population, there is a pressing need for robust, interpretable predictive models capable of supporting dynamic risk assessment and informing critical care management decisions.
Therefore, this study aimed to address this knowledge gap by developing a time-to-event survival prediction model specifically targeting critically ill patients with ICH in intensive care environments. We leveraged comprehensive clinical data from the eICU Collaborative Research Database and implemented six distinct ML algorithms for survival analysis: CoxPHSurvival, RandomSurvivalForest, GradientBoostingSurvival, FastKernelSurvival, SurvivalTree, and ExtraSurvivalTrees. Model performance was rigorously assessed using multiple evaluation metrics, including the time-dependent area under the curve (td-AUC), concordance index (C-index), Brier score, and calibration analysis, with optimal algorithm selection based on comprehensive performance comparisons. External validation was conducted using the MIMIC-IV database to establish model robustness and ensure generalizability across diverse patient populations. Model interpretability was achieved through SHapley Additive exPlanations (SHAP) analysis to elucidate key prognostic determinants and clinical decision pathways. Subsequently, we developed an intuitive web-based prognostic calculator that enables real-time individualized survival probability estimation to facilitate evidence-based clinical decision-making in intensive care practice.
Methods
Data source and study population
This retrospective cohort investigation employed the eICU Collaborative Research Database (v2.0) as the primary training dataset, including more than 200,000 intensive care unit (ICU) admissions from healthcare facilities across the United States, whereas the MIMIC-IV database (v3.1) served as an independent external validation cohort, containing more than 65,000 ICU admissions spanning 2008–2022. Adult patients with ICH requiring intensive care admission were identified using the standardized International classification of Diseases, Ninth and Tenth Revision (ICD-9 and ICD-10) diagnostic codes (comprehensive listing is provided in Supplementary Table S1). As illustrated in Figure 1, exclusion criteria comprised an ICU length of stay of less than 3 h, absence of demographic information, or physiologically implausible parameter values. Following rigorous data preprocessing and application of the inclusion criteria, the final analytical cohort consisted of 5797 patients from the eICU database and 1423 patients from the MIMIC-IV database. The primary endpoint was defined as time-to-event survival, with vital status determined at hospital discharge. Database access was obtained through appropriate institutional authorization, with the author Yangang Zhu completing the requisite Collaborative Institutional Training Initiative (CITI) program certification (ID: 64180628). Both datasets were used under institutional review board approval from the Massachusetts Institute of Technology and Beth Israel Deaconess Medical Center, with waived informed consent requirements and approved data-sharing protocols. The investigation adhered to ethical standards established by institutional research committees and to the principles outlined in the Declaration of Helsinki.

Flowchart of patient selection and machine learning model construction for ICH survival prediction. ICH: intracerebral hemorrhage.
Data extraction and preprocessing
Clinical data were systematically extracted from the eICU and MIMIC-IV databases, including demographic parameters (age, sex, race, height, and weight), laboratory values obtained within the initial 24-h ICU period, physiological measurements, comorbidity profiles, discharge dispositions, and validated disease severity indices. Variables exhibiting >30% missingness were systematically excluded from the analysis. The remaining missing values were addressed using the k-nearest neighbors (KNN) imputation method. Multicollinearity was assessed using variance inflation factor (VIF) calculations, with variables demonstrating VIF values >10 being eliminated to ensure model stability (detailed in Supplementary Table S2).
Sensitivity analyses comparing KNN imputation (k = 5) with complete-case analysis validated our missing data approach (Supplementary Table S3). Among the 24 predictive variables, prothrombin time (PT) (29.6%), international normalized ratio (INR) (26.2%), and anion gap (21.8%) had the highest missingness, with only 32.5% of patients having complete data across all variables.
The final feature set comprised 24 variables: demographic characteristics (age, weight, and height), hematological parameters (WBC, red blood cell (RBC) count, platelet count, and red cell distribution width (RDW)), electrolyte panel (sodium, potassium, calcium, chloride, and anion gap), coagulation studies (PT and INR), renal function markers (blood urea nitrogen (BUN) and creatinine), vital signs (heart rate, noninvasive systolic blood pressure, diastolic blood pressure, mean arterial pressure, respiratory rate, and body temperature), and validated severity scores (Acute Physiology Score (APS) and Glasgow Coma Scale (GCS) total score).
ML model construction and evaluation
The eICU dataset underwent random stratified partitioning into training (70%, N = 4057) and internal testing (30%, N = 1740) cohorts, with feature standardization performed using the StandardScaler implementation from scikit-learn. Six ML survival algorithms were implemented using the scikit-survival framework: CoxPHSurvival, RandomSurvivalForest, GradientBoostingSurvival, FastKernelSurvival, SurvivalTree, and ExtraSurvivalTrees. Hyperparameter optimization was performed through systematic grid search combined with 10-fold cross-validation to identify optimal model configurations.
Model performance assessment used multiple complementary metrics, including C-index, td-AUC, integrated Brier score (IBS), and calibration analysis via 10-fold cross-validation across both the training and internal testing datasets. External validation was conducted using the complete MIMIC-IV cohort, with temporal performance evaluation through td-AUC analysis. Statistical robustness was ensured by computing 95% confidence intervals for all performance metrics through bootstrap resampling with 1000 iterations across both institutional cohorts. Temporal discrimination and calibration characteristics were visualized using time-dependent receiver operating characteristic curves and Brier score trajectories generated through the scikit-survival package.
SHAP analysis
Model interpretability was achieved through SHAP methodology using a model-agnostic KernelExplainer framework. To optimize computational efficiency and maintain representative coverage, a background reference dataset was constructed through K-means clustering (k = 50) applied to the training cohort. SHAP value computation was performed across the entire test dataset, with feature importance ranking determined by mean absolute SHAP values to identify the 10 most influential predictive variables.
Comprehensive interpretability visualization was implemented through multiple complementary approaches, encompassing summary plots (dot and bar representations), decision pathway analyses, and waterfall diagrams for individual predictions. Furthermore, SHAP dependence plots with fitted regression curves were generated to elucidate nonlinear relationships between critical features, including the GCS score, APS, and body temperature, and their corresponding impact on survival probability estimates. This multifaceted visualization strategy provided both global insights into model behavior and local explanations of individual predictions, thereby facilitating clinically meaningful interpretation of key prognostic determinants and supporting evidence-based clinical decision-making processes.
Web-based calculator
To facilitate real-time clinical implementation, an interactive web-based prognostic calculator was developed using the Gradio framework for user interface deployment. The application integrateed the optimally performing Random Survival Forest (RSF) model along with the corresponding feature-scaling pipeline, enabling clinicians to input comprehensive patient data, including demographic characteristics, physiological parameters, laboratory values, comorbidity profiles, and validated severity indices.
Following automated data preprocessing, including standardization of continuous variables and encoding of categorical features, the system generated individualized survival probability curves along with discrete survival estimates at clinically relevant time points (days 1, 3, 5, and 7). The calculator provided intuitive visualization through dynamic survival probability plots to enhance clinical interpretation and decision-making. This publicly accessible tool is deployed at https://huggingface.co/spaces/Ganglab/EICU, offering clinicians and researchers a user-friendly platform for personalized risk stratification and prognostic assessment in critically ill patients with ICH in intensive care environments.
Statistical analysis
Continuous variables were summarized as mean ± SD, whereas categorical variables were reported as frequencies and percentages. A comparative analysis of baseline characteristics, including demographic parameters, physiological measurements, laboratory values, comorbidity burden, and disease severity indices, between survivors and nonsurvivors was conducted in both the eICU and MIMIC-IV cohorts. Statistical comparisons were performed using independent-samples t-tests for continuous variables and chi-square tests for categorical variables. All statistical analyses were conducted using Python (version 3.9.19) and R (version 4.4.0) software, with statistical significance established at a p value of 0.05.
Results
Baseline characteristics
A total of 5797 patients with ICH admitted to the ICU were included, of whom 565 (9.8%) died during their ICU stay. As shown in Table 1, there were no significant differences in age, sex, or race between survivors and nonsurvivors. However, nonsurvivors had significantly higher WBC, RDW, PT, INR, BUN, and creatinine levels and lower RBC, platelet, and calcium levels (all p < 0.001). Additionally, they demonstrated higher heart rates, lower mean arterial pressure, and more frequent comorbidities such as hypertension and diabetes (all p < 0.001). Severity scores were significantly worse among nonsurvivors, with higher APS (70.8 vs. 36.7) and lower GCS scores (6.67 vs. 12.6) (both p < 0.001). ICU stay was slightly shorter in the nonsurvivor group (4.28 vs. 4.53 days, p < 0.001).
Baseline characteristics of patients from the eICU database.
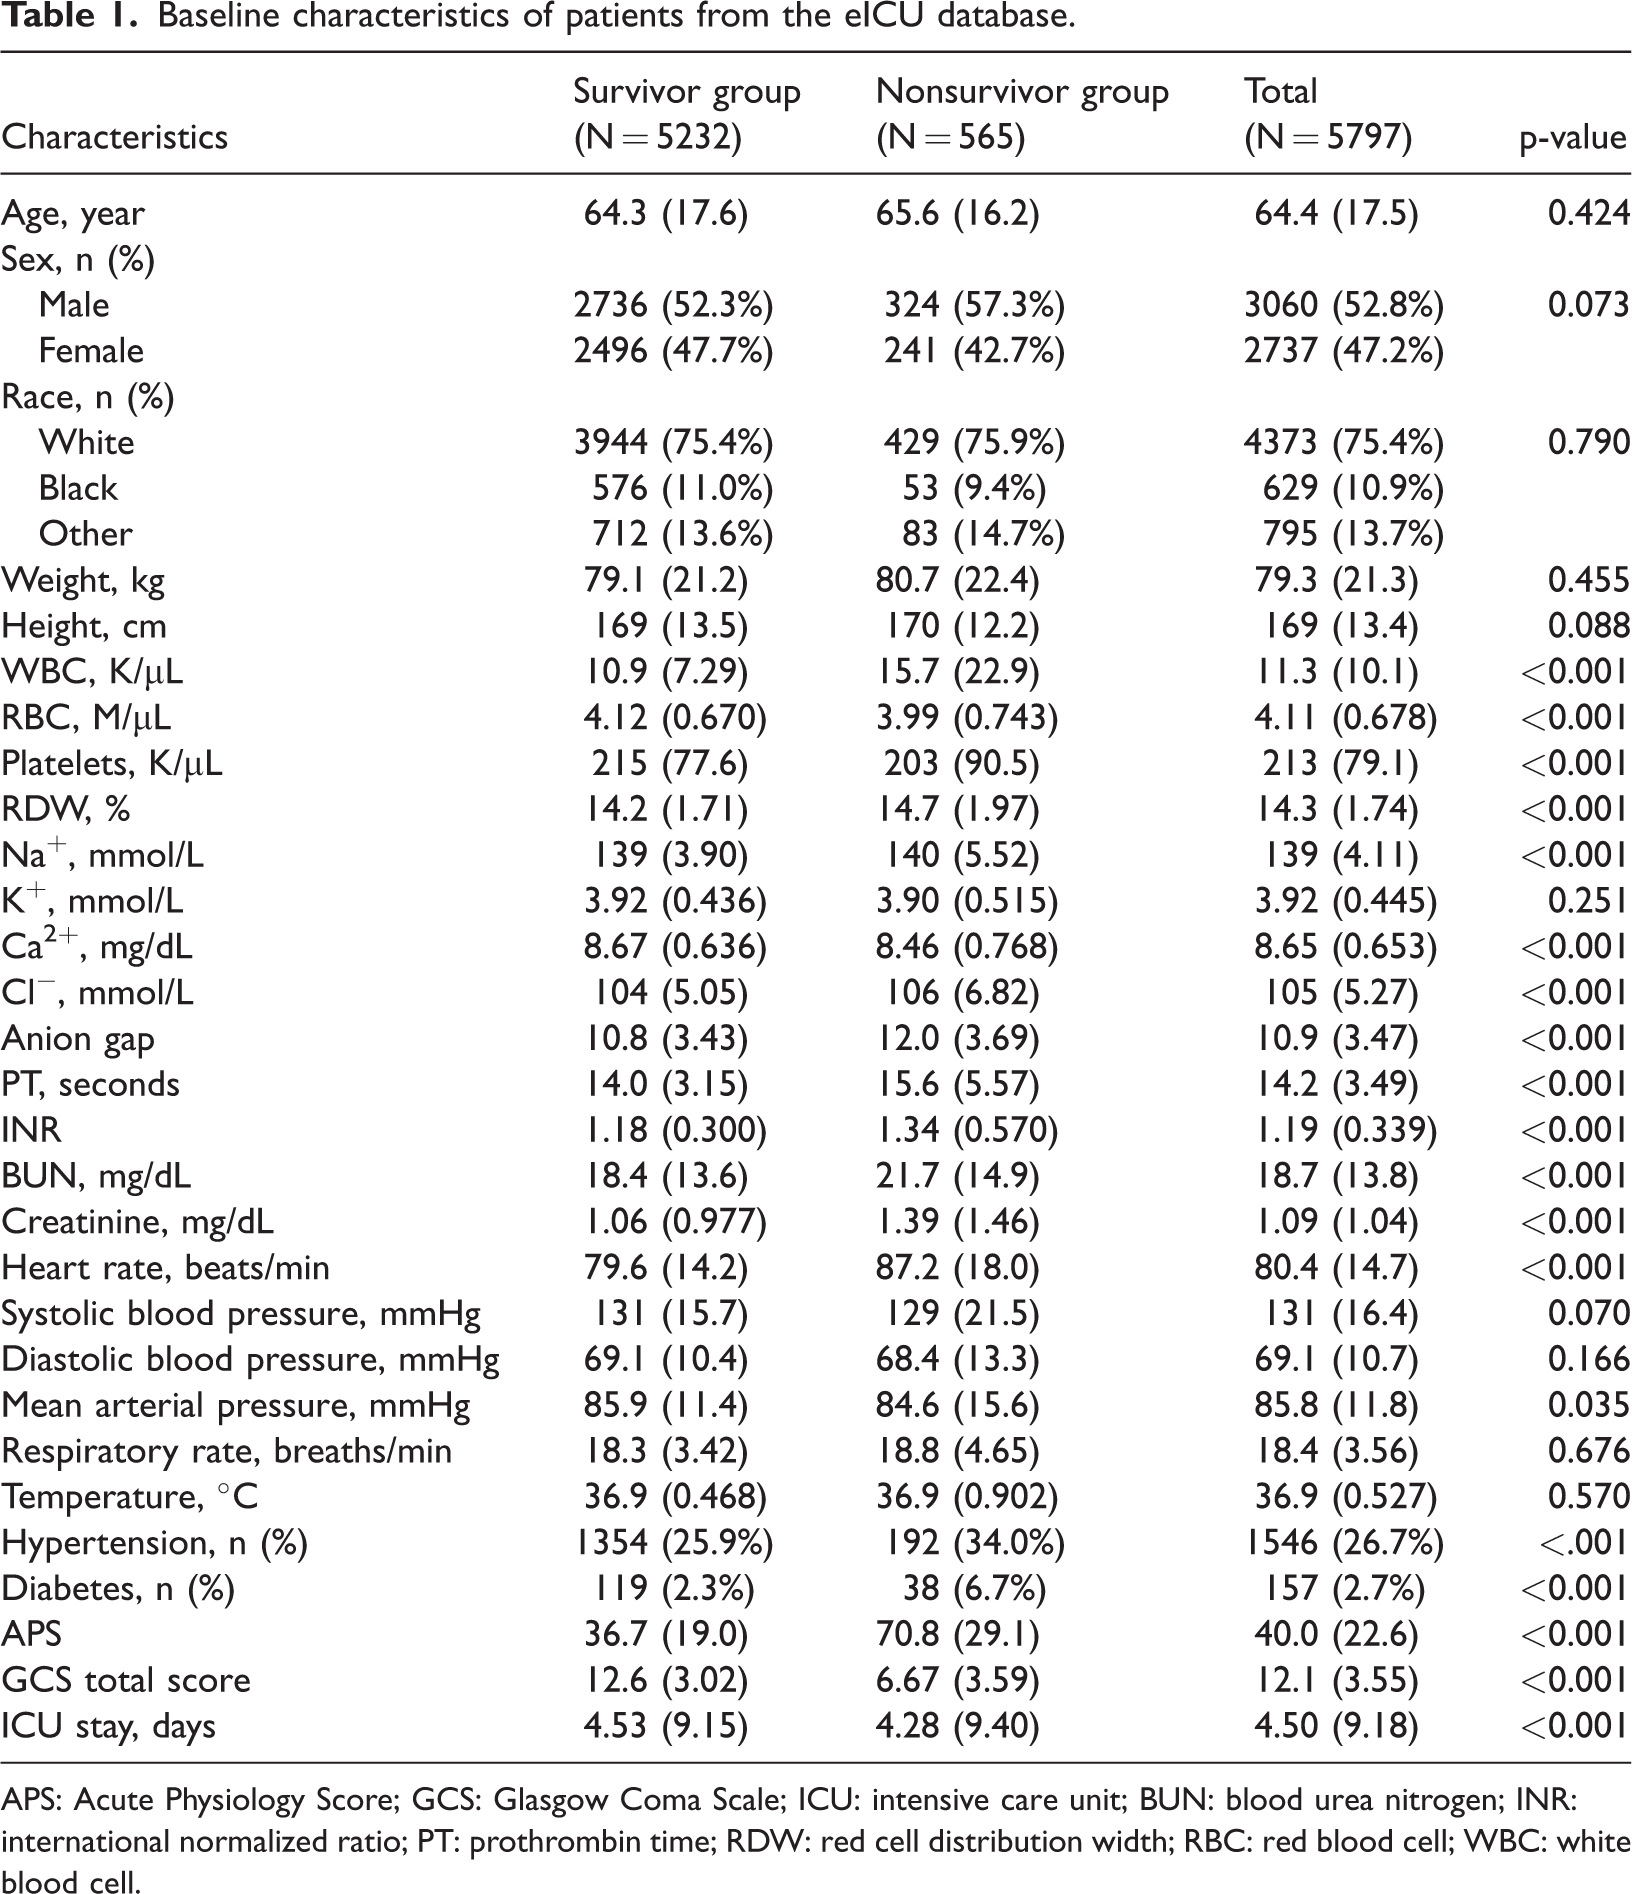
APS: Acute Physiology Score; GCS: Glasgow Coma Scale; ICU: intensive care unit; BUN: blood urea nitrogen; INR: international normalized ratio; PT: prothrombin time; RDW: red cell distribution width; RBC: red blood cell; WBC: white blood cell.
In the external validation cohort from the MIMIC-IV database (N = 1423), as shown in Table 2, 266 patients (18.7%) died during the ICU stay. Compared with survivors, nonsurvivors were older and had higher WBC, RDW, PT, INR, BUN, and creatinine levels along with lower RBC and platelet counts (all p < 0.001). Additionally, they exhibited higher APS and slightly lower GCS scores. Similar to the training cohort, nonsurvivors had a shorter ICU stay (7.94 vs. 9.88 days, p = 0.005).
Baseline characteristics of patients from the MIMIC-IV database.

APS: Acute Physiology Score; GCS: Glasgow Coma Scale; ICU: intensive care unit; BUN: blood urea nitrogen; INR: international normalized ratio; PT: prothrombin time; RDW: red cell distribution width; RBC: red blood cell; WBC: white blood cell; MIMIC-IV: Medical Information Mart for Intensive Care IV.
Performance metrics of survival models
Model performance was evaluated using td-AUC, C-index, Brier score, and calibration curves. As shown in Figure 2, all models achieved strong performance in the training and test sets. GradientBoostingSurvival and FastKernelSurvivalSVM demonstrated the highest training AUCs (both 0.93), whereas multiple models, including RandomSurvivalForest, achieved average AUCs of 0.88 in the testing set. In the external validation set (Figure 2(c)), RandomSurvivalForest showed strong short-term predictive performance, with td-AUCs of approximately 0.82 on day 1 and 0.71 on day 2. Its overall mean AUC across the entire follow-up period was the highest among all models (0.65), highlighting its superior generalizability. Calibration curves (Figure 3) indicated that RandomSurvivalForest, GradientBoostingSurvival, and SurvivalTrees were well calibrated, with predicted survival probabilities closely matching observed outcomes. C-index values (Table 3) were similarly high across all models, with GradientBoostingSurvival (0.889), ExtraSurvivalTrees (0.888), and FastKernelSurvivalSVM (0.887) ranking highest. The lowest Brier scores (0.080) were observed for GradientBoostingSurvival, RandomSurvivalForest, and ExtraSurvivalTrees. Based on its superior discrimination, well-calibrated predictions, and favorable external validation performance, the RSF model was selected for further interpretation and clinical application.

Time-dependent AUC curves of six survival models across the training, test, and validation datasets. (a) In the training dataset, GradientBoostingSurvival and FastKernelSurvivalSVM showed the highest AUCs (both 0.93), with all models demonstrating strong performance. (b) In the test dataset, model performance remained stable, with multiple models achieving a mean AUC of 0.88. (c) In the external validation dataset, RandomSurvivalForest demonstrated the best generalizability, with the highest day 1 (0.82), day 2 (0.71), and overall mean AUC (0.65). AUC: area under the curve.

Calibration curves of five survival models in the test dataset. (a–e) Calibration performance of CoxPHSurvival, RandomSurvivalForest, GradientBoostingSurvival, SurvivalTree, and ExtraSurvivalTrees. The solid line represents the average predicted survival probability, and the dashed line represents perfect calibration. RandomSurvivalForest, GradientBoostingSurvival, and SurvivalTree showed the best agreement between predicted and observed probabilities.
C-index and Brier score of each survival machine learning model.

C-index: concordance index; CI: confidence interval.
Model interpretation using SHAP
To interpret the final RSF model, SHAP was applied to quantify the contribution of individual features to survival prediction (Figure 4). The SHAP waterfall plot (Figure 4(a)) illustrated how the top 10 features influenced the prediction for a representative patient. Among these, APS, GCS total score, WBC, and temperature showed the greatest impact. Notably, APS and GCS score demonstrated large negative SHAP values, whereas temperature contributed positively, reflecting how these features shifted the model output from the baseline prediction (E(f(x)) = 13.211) toward the individualized prediction (f(x) = 6.561). The summary plot (Figure 4(b)) displayed the distribution of SHAP values across all patients, with features ranked by their overall influence. Each dot represented a single patient’s value for a given feature, color-coded by its magnitude (red = high, blue = low). The GCS total score exerted the strongest influence: lower GCS values (blue) were associated with increased predicted risk. Similarly, higher APS (red) and lower temperature values (blue) were associated with greater risk. The spread of SHAP values reflected the heterogeneous and nonlinear impact of each feature across individuals. Figure 4(c) presents the average absolute SHAP values for the top 10 features, further confirming the GCS total score, APS, and temperature as the most influential variables. Figure 4(d) shows the SHAP decision plot, illustrating how individual features cumulatively contributed to the model output across different patients.
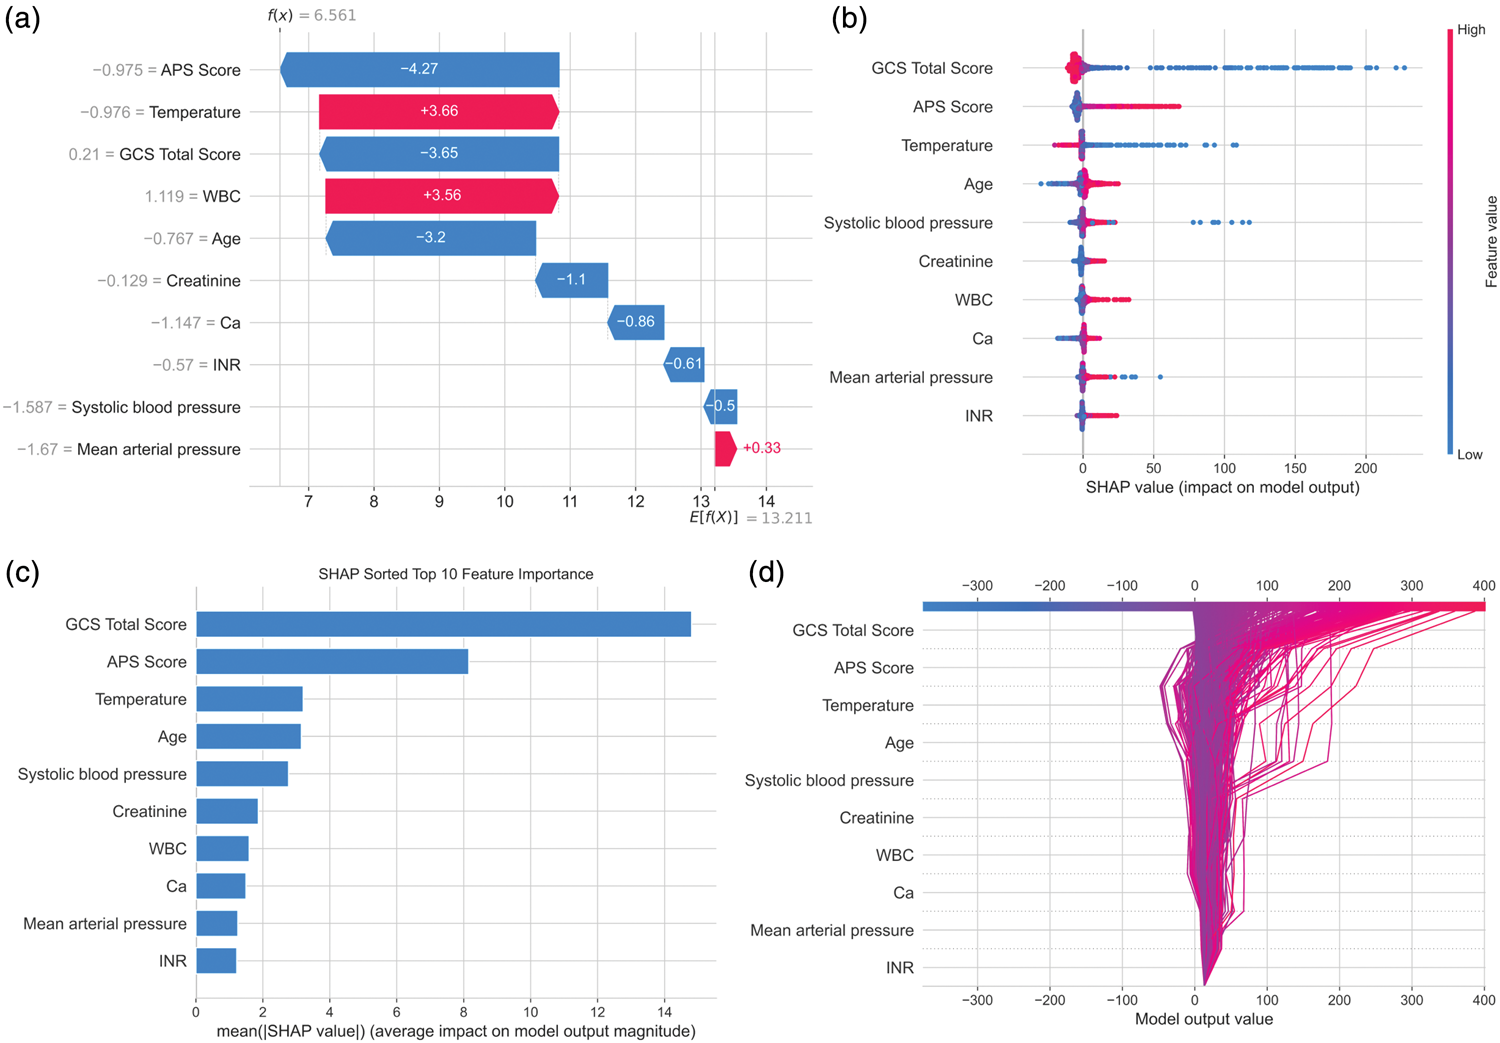
SHAP-based interpretation of the Random Survival Forest model. (a) SHAP waterfall plot showing the contribution of the top 10 features to the survival prediction for a representative patient. Features pushing the prediction higher (indicating higher risk) are shown in red, whereas those reducing risk are shown in blue. (b) SHAP summary plot displaying the distribution of SHAP values for each feature across all patients. Feature values are color-coded (red = high, blue = low), and the horizontal spread reflects variability in impact. (c) Bar plot of the top 10 features ranked by mean absolute SHAP value, indicating global feature importance. (d) SHAP decision plot visualizing how cumulative feature contributions shape the model output across individuals. SHAP: SHapley Additive exPlanations.
Model interpretation and feature threshold identification with SHAP
To further interpret the nonlinear relationships between key variables and survival risk, SHAP main-effect plots were generated for the top six features (Figure 5). For the GCS total score (Figure 5(a)), SHAP values increased sharply as scores decreased, indicating that values below approximately 9.8 were strongly associated with higher mortality risk. APS (Figure 5(b)) exhibited a J-shaped SHAP pattern, with minimal effect below 52.7 and a sharp increase in predicted risk above this threshold. Temperature (Figure 5(c)) showed a left-skewed J-shaped pattern, with a marked increase in predicted risk below 36.6°C and a slight rise above 38.6°C. Age (Figure 5(d)) demonstrated a threshold effect: SHAP values remained relatively flat until approximately 62.9 years, after which risk increased steadily. Systolic blood pressure (Figure 5(e)) exhibited a U-shaped pattern, with increased predicted risk observed at both low (<101.6 mmHg) and high (>135.4 mmHg) values, and the lowest risk occurring around the mid-range. Creatinine (Figure 5(f)) exhibited a J-shaped pattern, with slightly increased risk at very low levels (<0.4 mg/dL) and a steep rise in SHAP values beyond 1.1 mg/dL, indicating substantially elevated risk with higher creatinine concentrations.
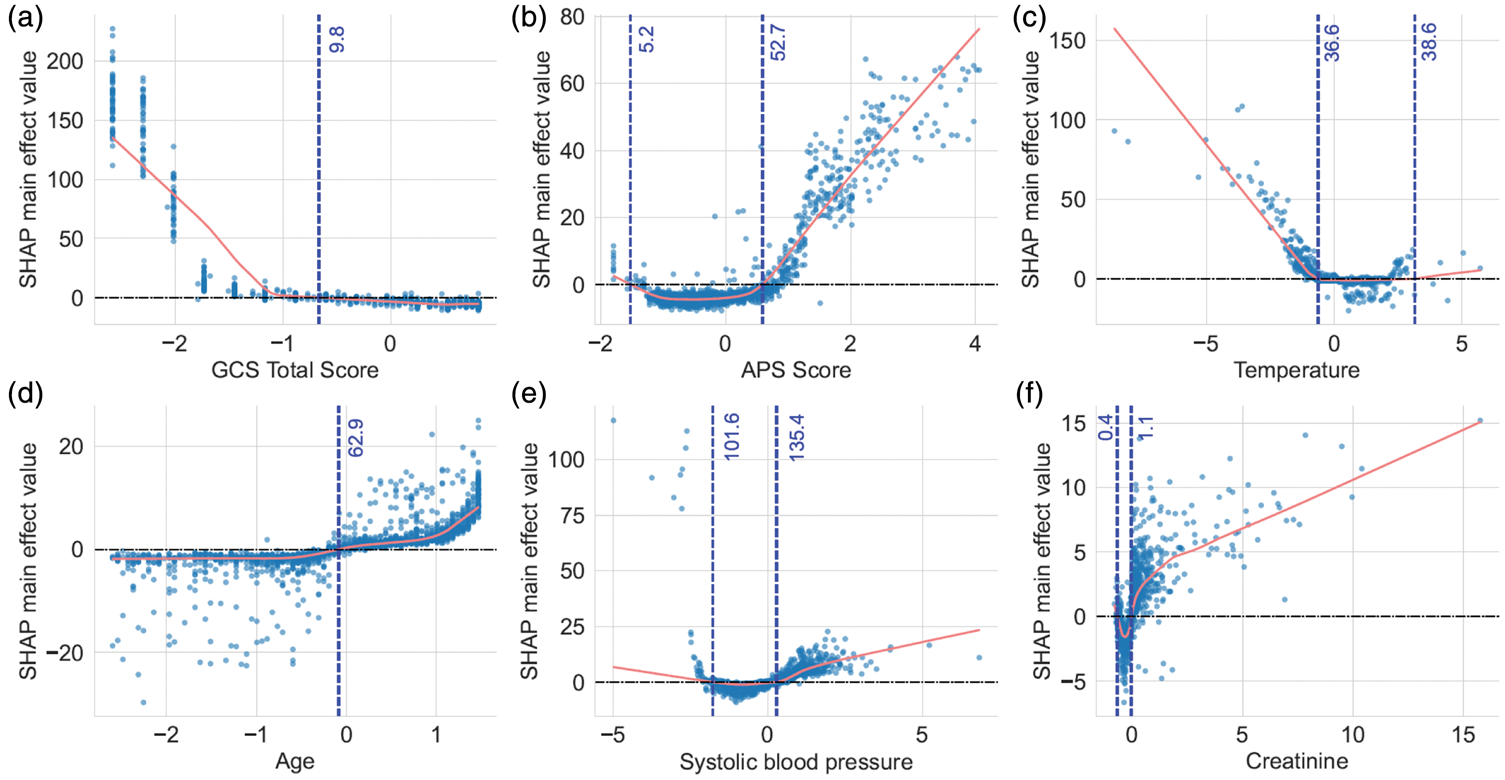
SHAP main-effect plots of the six most important features. Each panel shows the SHAP main-effect value for an individual feature derived from the final Random Survival Forest model. Red lines indicate LOWESS-smoothed curves showing the average marginal effect of each variable on predicted survival risk. Vertical blue dashed lines mark key thresholds at which feature contributions to the model output change direction. (a) GCS total score. SHAP values increased sharply below approximately 9.8, indicating higher predicted risk with lower scores; (b) APS score. J-shaped effect, with sharply increased risk above approximately 52.7; (c) Temperature. A left-skewed J-shaped pattern with markedly elevated risk below approximately 36.6°C and a mild increase above approximately 38.6°C; (d) Age. SHAP values remained relatively flat before approximately 62.9 years and increased steadily after that; (e) Systolic blood pressure. A U-shaped relationship, with increased risk at both low (<101.6 mmHg) and high (>135.4 mmHg) values; (f) Creatinine. A J-shaped curve with elevated risk, particularly at higher levels (>1.1 mg/dL). APS: Acute Physiology Score; GCS: Glasgow Coma Scale; SHAP: SHapley Additive exPlanations.
Web-based survival prediction calculator
To facilitate clinical application, a web-based calculator was developed using the final RSF model (Figure 6). Users can input individual patient characteristics, including demographics, comorbidities, vital signs, laboratory tests, and severity scores, to obtain real-time survival predictions. The model outputs include time-specific survival probabilities (e.g. days 1–7) and a personalized survival probability curve. In the illustrated example, the model predicted high survival probabilities, ranging from 100.0% on day 1 to 97.8% on day 7, for a 65-year-old male patient with typical physiological values. This tool provides an interpretable and interactive interface for individualized short-term mortality risk estimation in patients with ICH.

Web-based survival prediction calculator interface. An interactive online tool was developed based on the final Random Survival Forest model to estimate short-term survival probabilities for patients with spontaneous intracerebral hemorrhage. Users can input patient-specific information, including demographics, laboratory values, vital signs, and severity scores, and receive time-specific survival probabilities (e.g. days 1–7) along with a survival probability curve. The output shown here represents a simulated prediction for a 65-year-old male patient.
Discussion
In this study, we developed and externally validated an ML-based survival prediction model tailored for critically ill patients with ICH during ICU hospitalization. Using two large-scale critical care databases (eICU and MIMIC-IV), we constructed and compared six survival analysis models based on comprehensive clinical, laboratory, and physiological data. To the best of our knowledge, this is the first study to develop an ML-based survival prediction model specifically for patients with ICH during their ICU stay, addressing a critical gap in dynamic risk stratification for this high-risk population. Among the models tested, RSF demonstrated the best overall performance, with favorable discrimination, calibration, and generalizability. To enhance clinical interpretability, we applied SHAP to quantify feature importance and elucidate nonlinear associations between key predictors and the survival risk. Finally, we deployed the model as an interactive web-based calculator to enable real-time individualized risk estimation and support bedside decision-making in intensive care settings.
Several recent studies have explored ML applications for prognostication in patients with spontaneous intracerebral hemorrhage (sICH).26,27 For instance, Geng et al. 20 developed a random forest model using clinical, laboratory, and imaging features to predict 90-day outcomes in patients with sICH, reporting strong performance in both internal and external validation cohorts. Similarly, Fan et al. 28 developed a series of AI models to predict in-hospital mortality in patients with sICH admitted to the ICU, achieving high AUCs but without modeling survival time or individualized risk dynamics. Fan et al. 28 employed ML methods to explore 30-day, 1-year, and 3-year survival in a small cohort of enterally fed patients with stroke, primarily analyzing group-based survival differences and long-term mortality risk. In contrast, our study is the first to develop and validate an ML-based survival analysis model for critically ill patients with ICH during their ICU stay, using real-world data from two large intensive care databases. Unlike fixed-timepoint classifiers, our survival model estimates individualized survival probabilities over time, providing a more nuanced tool for risk stratification in real-time bedside decision-making.
RSF, an ensemble learning method for right-censored data, has been increasingly used in clinical prognostic studies because of its flexibility in modeling nonlinear relationships and complex feature interactions without assuming proportional hazards.29,30 Prior studies have demonstrated its strong predictive performance across diverse medical settings. For instance, Ingrisch et al. 31 applied RSF to predict overall survival in patients undergoing 90Y radioembolization for liver tumors, reporting a C-index of 0.657. In another study, Miao et al. 32 used RSF to model recurrence-free survival in patients with inverted papilloma, achieving a C-index of 0.831 and a td-AUC of 0.884 in the test set, remarkably close to our model’s test-set performance (td-AUC = 0.88). However, their model was not externally validated, limiting its generalizability to independent cohorts. In our study, RSF similarly achieved robust discrimination, with an average td-AUC of 0.88 in the test dataset and strong early predictive performance in the external validation cohort (AUC = 0.82 on day 1 and 0.71 on day 2). Although the mean AUC declined to 0.65 over the full external follow-up period, RSF consistently outperformed other survival models, demonstrating the best balance between discrimination, calibration, and external generalizability. The subsequent decrease in predictive accuracy over time may reflect a limitation of using only the first 24-h data post-ICU admission. Although this approach facilitates early risk stratification, it does not capture dynamic physiological changes or delayed complications, which may become more influential as the ICU stay progresses.
The decline in model performance over time in the external validation cohort likely reflects several interacting factors. Dataset heterogeneity between the eICU and MIMIC-IV databases may contribute to this temporal degradation. The two databases differ in patient demographics, institutional practices, and disease severity. Patients in MIMIC-IV exhibited higher mortality rates (18.7% vs. 9.8%) and longer ICU stays, suggesting a more critically ill population with different disease trajectories. Such distributional shifts may reduce the model’s generalizability, particularly in later stages of the ICU stay. Additionally, the decay of temporal information is inherent to models using only early admission data. Although variables from the first 24 h enable timely risk stratification, their predictive power naturally diminishes as clinical courses diverge based on subsequent interventions and complications. Events such as rebleeding, infections, or delayed cerebral edema occurring after 24 h are not captured in our static feature set but may profoundly influence later outcomes. This explains the stronger short-term performance (day 1 AUC =0.82) compared with that of longer-term predictions. Future model iterations may benefit from incorporating time-varying covariates or dynamic updating strategies. Nonetheless, the model maintained reasonable discrimination (mean AUC = 0.65) and outperformed other algorithms in external validation, demonstrating robust cross-institutional applicability.
Several clinical indicators have been consistently associated with mortality in patients with ICH. Among them, GCS is a widely used neurologic assessment tool.33,34 Prior studies have demonstrated its prognostic value, particularly when the scores are below 13. 35 Our SHAP analysis confirmed that mortality risk increased sharply when the GCS fell below 9.8, supporting its clinical significance. Similarly, in a recent large-scale study using the MIMIC-III database, logistic regression identified GCS as an independent predictor (odds ratio (OR) = 0.91, p < 0.001), further validating its importance. 36 Additionally, age >70 years has been recognized as a major mortality risk factor in patients with ICH. 35 Our model showed increasing SHAP values beginning at 62.9 years. This finding aligns with those of the previous studies and recent nomogram studies, in which age was independently associated with 30-day mortality (OR = 1.05, p < 0.001). 36 Creatinine, which reflects renal function and the severity of systemic illness, was shown in the same MIMIC-III study to have a strong positive association with mortality (OR =1.30, p < 0.001). 36 SHAP dependence plots from our model similarly confirmed that mortality risk increased notably when creatinine exceeded 1.1 mg/dL. In addition, elevated temperature and systolic blood pressure were associated with poor outcomes in both previous studies and our model. The MIMIC-III analysis identified temperature as an independent risk factor (OR = 1.73, p < 0.001), 36 and our SHAP plots confirmed it as an important feature. Systolic blood pressure >150 mmHg represented a key inflection point, consistent with earlier reports. 37
This study has several limitations. First, although we used two large and widely adopted critical care databases (eICU and MIMIC-IV), both are US-based and may not fully represent ICU practices or patient populations in other countries, potentially limiting generalizability. Second, only data from the first 24 h of ICU admission were included to enable early prediction; however, this approach may miss relevant dynamic changes, including neurological deterioration, delayed complications, or treatment response during the ICU stay. Third, several neurologically relevant variables, such as hematoma location and neuroimaging findings, were not available in a structured format and were therefore excluded, which may have reduced model accuracy. Fourth, variables with >30% missing values were excluded during preprocessing to ensure model stability. However, this may have led to the exclusion of potentially important predictors and may have introduced selection bias. Finally, although SHAP improves model transparency, it reflects associations rather than causality. Further prospective validation is required to confirm clinical utility and support integration into real-world ICU decision-making workflows.
Conclusion
In this study, we developed and externally validated an ML-based survival prediction model for critically ill patients with ICH during ICU hospitalization. By leveraging large-scale clinical data and implementing SHAP-based interpretation, our model demonstrated strong performance and generalizability and provided transparent, individualized risk estimation. The RSF model outperformed other survival models in terms of discrimination and calibration, and key prognostic variables, including GCS, APS, creatinine, temperature, and systolic blood pressure, were identified and visualized using SHAP analysis. Furthermore, we translated the model into a web-based survival prediction tool to enable real-time bedside clinical decision support. These findings highlight the potential of interpretable ML to enhance risk stratification, guide intensive care decisions, and ultimately improve outcomes for patients with ICH.
Supplemental Material
sj-xlsx-1-imr-10.1177_03000605261433691 - Supplemental material for Predicting time-to-event outcomes in critically ill patients with intracerebral hemorrhage using machine learning
Supplemental material, sj-xlsx-1-imr-10.1177_03000605261433691 for Predicting time-to-event outcomes in critically ill patients with intracerebral hemorrhage using machine learning by Jianhua Chen, Mengjie Wang, Xiaoqin Xia, Yuanyuan Xu, Yangang Zhu and Yu Zheng in Journal of International Medical Research
Supplemental Material
sj-xlsx-2-imr-10.1177_03000605261433691 - Supplemental material for Predicting time-to-event outcomes in critically ill patients with intracerebral hemorrhage using machine learning
Supplemental material, sj-xlsx-2-imr-10.1177_03000605261433691 for Predicting time-to-event outcomes in critically ill patients with intracerebral hemorrhage using machine learning by Jianhua Chen, Mengjie Wang, Xiaoqin Xia, Yuanyuan Xu, Yangang Zhu and Yu Zheng in Journal of International Medical Research
Supplemental Material
sj-xlsx-3-imr-10.1177_03000605261433691 - Supplemental material for Predicting time-to-event outcomes in critically ill patients with intracerebral hemorrhage using machine learning
Supplemental material, sj-xlsx-3-imr-10.1177_03000605261433691 for Predicting time-to-event outcomes in critically ill patients with intracerebral hemorrhage using machine learning by Jianhua Chen, Mengjie Wang, Xiaoqin Xia, Yuanyuan Xu, Yangang Zhu and Yu Zheng in Journal of International Medical Research
Footnotes
Acknowledgments
We thank Philips Healthcare and the eICU Research Institute for providing access to the eICU Collaborative Research Database, and Andrew A. Kramer and Dina Demner-Fushman for their contributions to data quality and deidentification. We also acknowledge the Beth Israel Deaconess Medical Center and the MIMIC team for supporting access to the MIMIC-IV database, with special thanks to Carolyn Conti, Alvin Gayles, Larry Markson, Ayad Shammout, Lu Shen, and Manu Tandon. This work was supported by the National Institute of Biomedical Imaging and Bioengineering (NIBIB) under NIH grant R01EB030362.
Author contributions
The project was designed by Jianhua Chen and Yu Zheng. Material preparation, data collection, and analysis were performed by Jianhua Chen, Yangang Zhu, and Xiaoqin Xia. The first draft of the manuscript was written by Jianhua Chen, Xiaoqin Xia, and Yuanyuan Xu, and the manuscript was critically revised by Jianhua Chen and Xiaoqin Xia. Mengjie Wang was responsible for the revision of the manuscript. All authors reviewed the manuscript.
Consent for publication
Not applicable.
Data availability statement
Declaration of conflicting interests
The authors have no conflicts of interest to disclose.
Ethics approval and consent to participate
The collection of patient information and creation of the research resource were reviewed by the Institutional Review Board at the Beth Israel Deaconess Medical Center, which granted a waiver of informed consent and approved the data-sharing initiative. The study was conducted in accordance with the ethical standards of the institutional research committees and the Declaration of Helsinki.
Funding
None.
Supplemental material
Supplemental material for this article is available online.
References
Supplementary Material
Please find the following supplemental material available below.
For Open Access articles published under a Creative Commons License, all supplemental material carries the same license as the article it is associated with.
For non-Open Access articles published, all supplemental material carries a non-exclusive license, and permission requests for re-use of supplemental material or any part of supplemental material shall be sent directly to the copyright owner as specified in the copyright notice associated with the article.