
Abstract
Objective
To evaluate the association between the Zhejiang University index, a composite metabolic indicator, and the risk and severity of metabolic dysfunction-associated fatty liver disease.
Methods
This cross-sectional study utilized data from the National Health and Nutrition Examination Survey conducted from 1999 to 2020. The association between the Zhejiang University index and severity of metabolic dysfunction-associated fatty liver disease was analyzed using multivariable logistic regression, with adjustments made for confounding variables. Subgroup analyses were performed stratified by sex, age, diabetes, and hypertension status. The relationship with alcoholic liver disease was also verified. Multiple sensitivity analyses were conducted, including analyses of data before and after imputation.
Results
The Zhejiang University index demonstrated a significant positive association with the incidence of metabolic dysfunction-associated fatty liver disease. The odds ratio increased from 1.74 (95% confidence interval: 1.70, 1.77; p < 0.001) in the crude model to 2.05 (95% confidence interval: 1.97, 2.15; p < 0.001) in the fully adjusted model. This association was more pronounced in nondiabetic subgroups and exhibited a threshold effect, diminishing when the Zhejiang University index exceeded 46.407. Sensitivity analyses, including the assessment of alcoholic liver disease, confirmed the robustness of these findings.
Conclusions
The Zhejiang University index is a promising and reliable tool for evaluating the risk of metabolic dysfunction-associated fatty liver disease. Further research into its clinical application could improve the risk stratification and management of metabolic dysfunction-associated fatty liver disease.
Keywords
Introduction
Metabolic dysfunction-associated fatty liver disease (MAFLD) represents a significant public health challenge characterized by fat accumulation in the liver that is not linked to alcohol consumption. The disease has garnered attention owing to its association with severe health complications, such as liver cirrhosis, hepatocellular carcinoma, and cardiovascular diseases, which impose substantial economic burdens on healthcare systems globally. The rising prevalence of obesity, metabolic syndrome, and type 2 diabetes mellitus (T2DM) has further exacerbated the MAFLD epidemic, necessitating effective screening and intervention strategies.1,2 Current diagnostic methodologies, including imaging techniques and invasive liver biopsies, present notable limitations, such as high cost and invasiveness, thereby underscoring the need for noninvasive, cost-effective screening tools.3,4
Recent efforts to redefine the classification of fatty liver diseases have led to the adoption of the term “MAFLD,” which emphasizes the disease’s metabolic underpinnings rather than merely its exclusion of alcohol consumption. 5 This shift in nomenclature aimed to facilitate a better understanding of disease etiology and improve risk stratification and management approaches. Despite this progress, significant knowledge gaps remain regarding the epidemiology, risk factors, and effective screening tools for MAFLD. For instance, the relationship between metabolic biomarkers and MAFLD risk has not been fully elucidated, and further research is needed to explore the potential role of innovative indices for early detection.6,7
In this context, the Zhejiang University (ZJU) index has emerged as a promising predictive tool for assessing the risk of nonalcoholic fatty liver disease (NAFLD). The ZJU index integrates various metabolic and anthropometric parameters and has demonstrated a robust association with the likelihood of developing NAFLD in previous studies.8,9 This noninvasive index holds potential as a screening mechanism to facilitate timely interventions and improve patient outcomes of NAFLD. The application of the ZJU index could be particularly beneficial in large populations where traditional diagnostic methods may prove impractical.
We conducted cross-sectional analyses utilizing data obtained from the National Health and Nutrition Examination Survey (NHANES) conducted between 1999 and 2020. The NHANES dataset provides a comprehensive representation of the US population, allowing an in-depth examination of the associations between various health indicators and MAFLD risk. The specific objectives of this research are twofold: (a) first, to validate the ZJU index as an effective tool for predicting MAFLD and (b) second, to explore its potential utility in public health interventions aimed at reducing the burden of metabolic liver diseases. 10
Methods
Data and sample sources
The data utilized in this study were derived from the NHANES (1999–2020), which provides a diverse and representative sample of noninstitutionalized US population. 11 This cross-sectional survey was conducted by the National Center for Health Statistics (NCHS). Among the initial 107,622 participants, 76,415 were excluded because of incomplete data preventing the diagnosis of MAFLD, and 106 participants were further excluded because of insufficient data for calculating the ZJU index. Consequently, 31,101 participants were included in the final analyses (Figure 1). The NHANES protocol was approved by the NCHS Ethics Review Board, and all participants provided written informed consent. The study received approval from the Medical Ethics Committee of the 925th Hospital of the People’s Liberation Army. All procedures adhered to the Declaration of Helsinki (1975, as revised in 2024). Patient identifiers were eliminated before data analyses to protect privacy and confidentiality. The reporting of this study follows the Strengthening the Reporting of Observational Studies in Epidemiology (STROBE) guidelines. 12
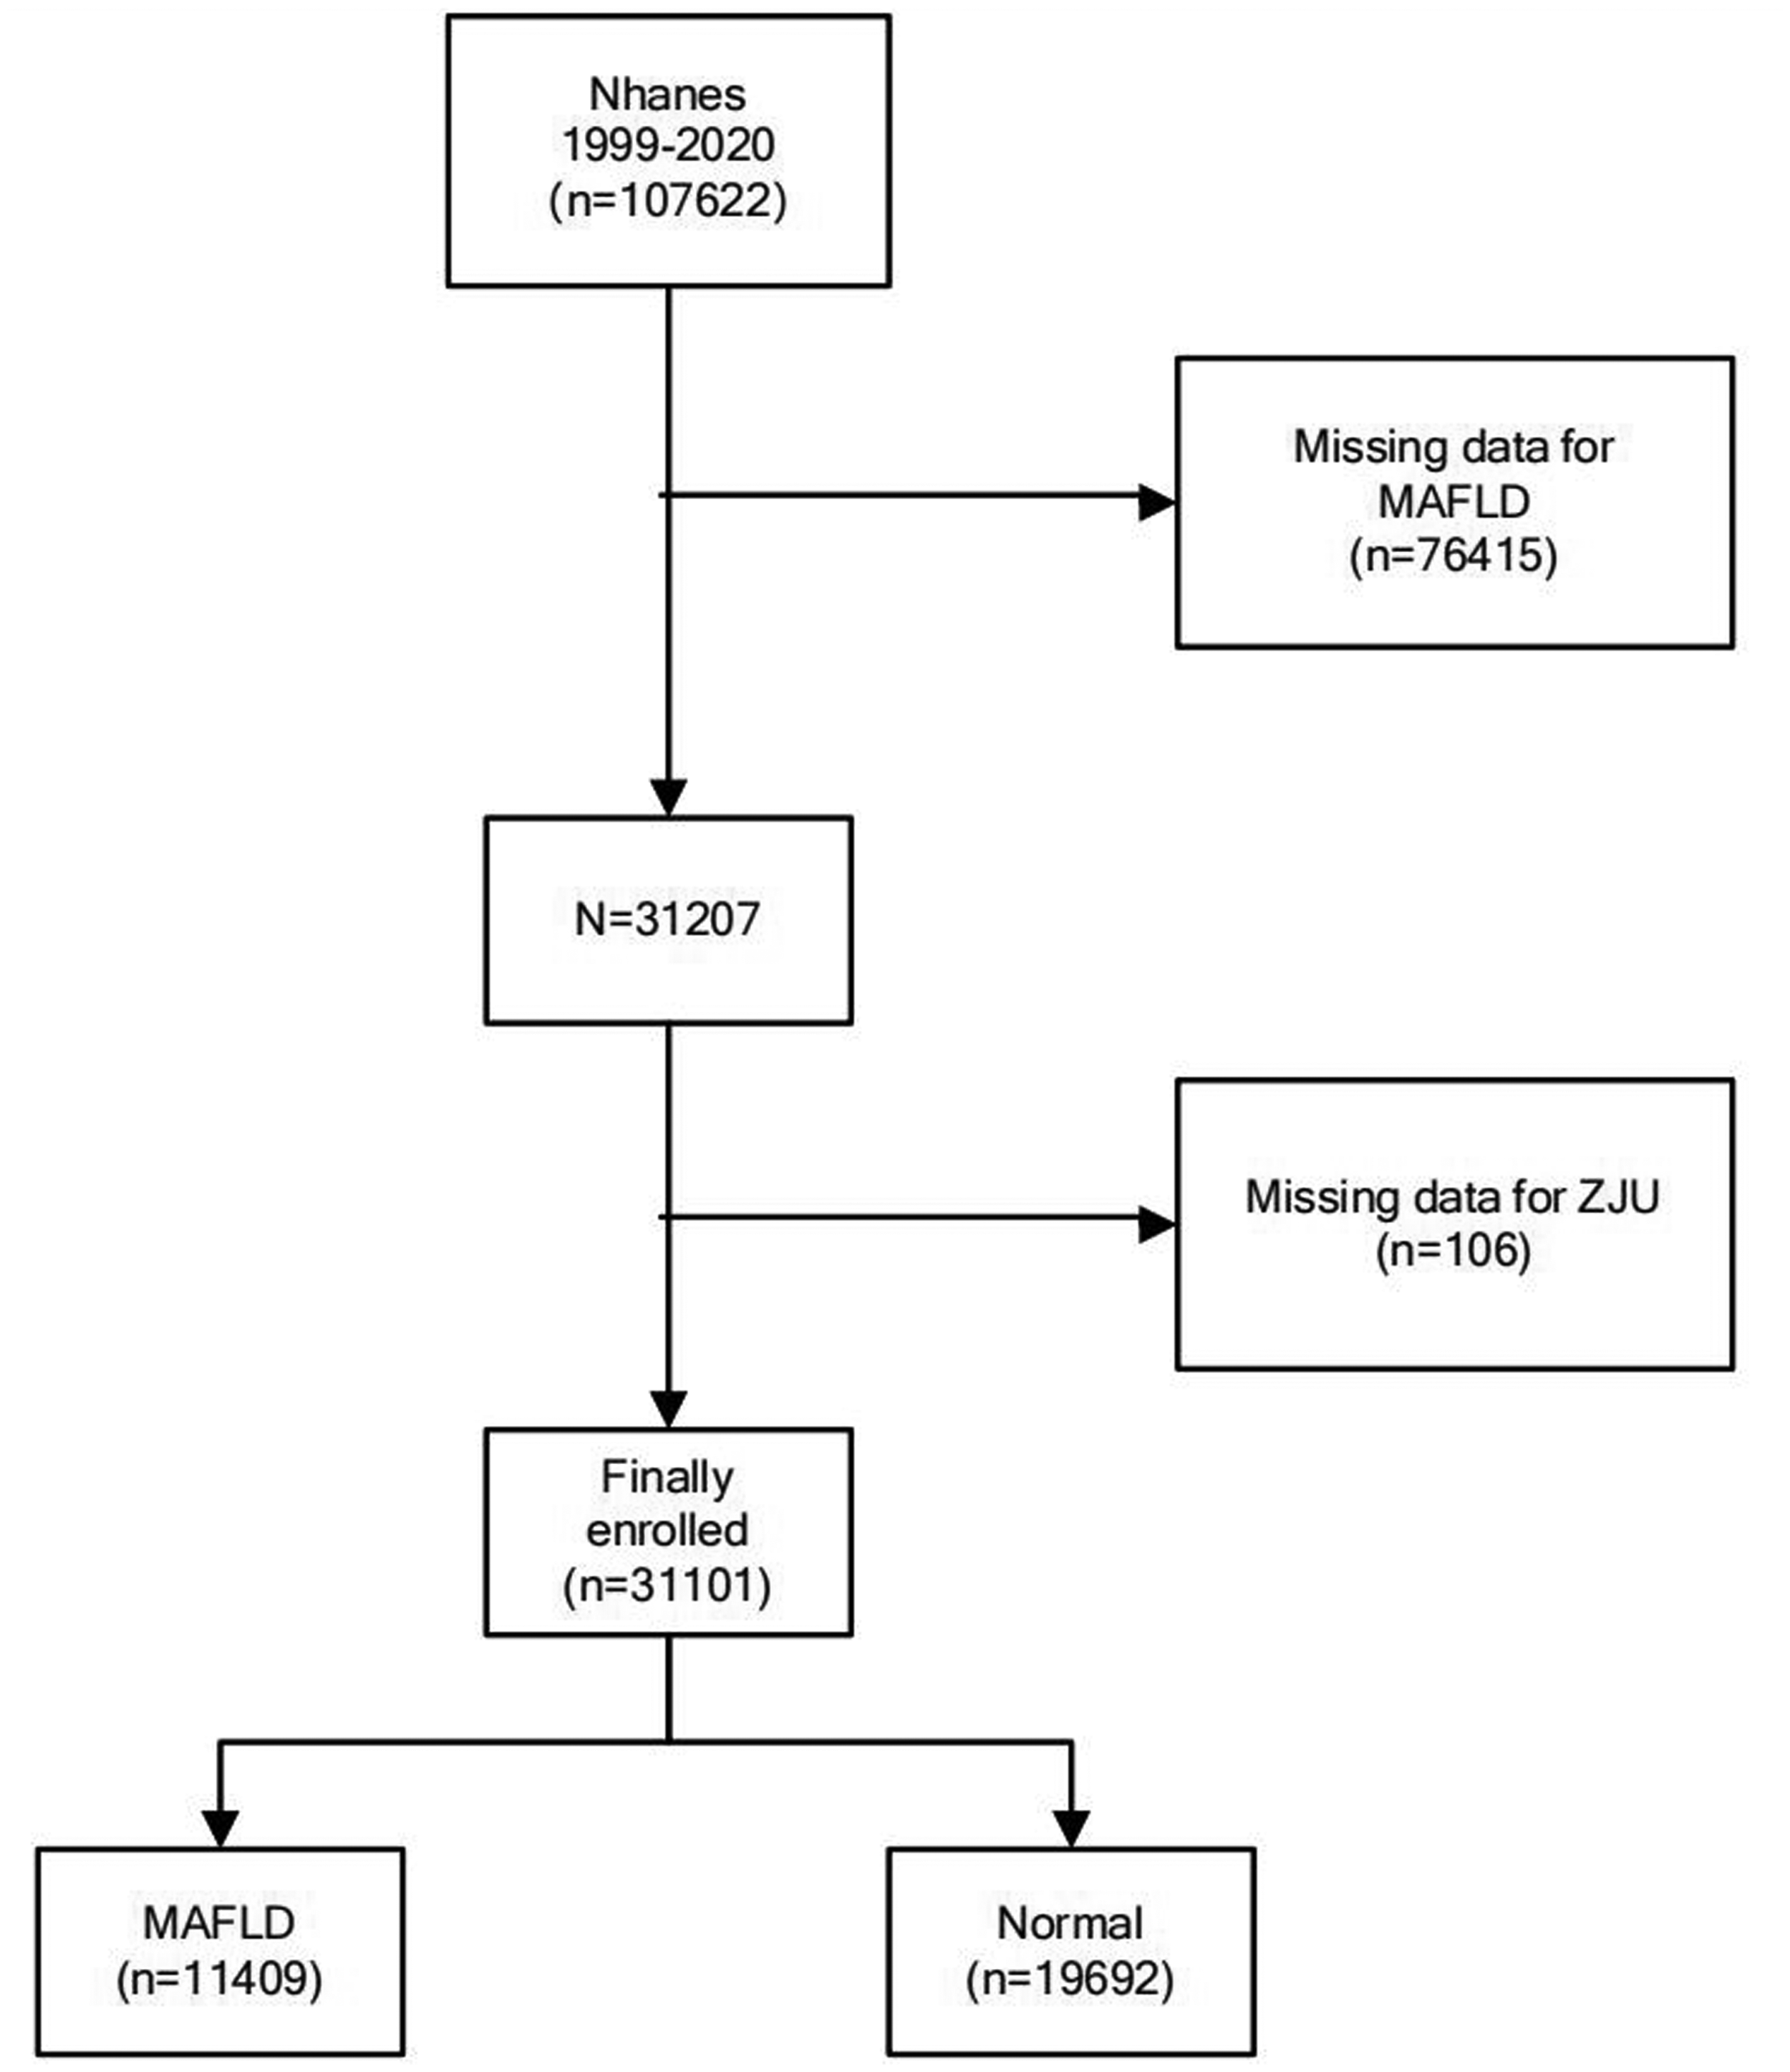
Flowchart of participant selection and classification in the 1999–2020 NHANES study. NHANES: National Health and Nutrition Examination Survey.
Definition of ZJU
The ZJU index 13 is a predictive tool for NAFLD and is calculated using the following formula: ZJU index = body mass index (BMI) + 3 × (alanine aminotransferase (ALT)/aspartate aminotransferase (AST) + fasting blood glucose (FBG) + triglycerides (TGs) + (2 (for female sex)), where the BMI is measured in kg/m2, AST and ALT are liver enzymes reported as U/L, TGs are measured in mmol/L), and FBG is reported as mmol/L. The ALT/AST ratio is emphasized (multiplied by 3) for its role in detecting liver damage, while a 2-point adjustment accounts for sex differences in females. A higher ZJU index indicates an increased likelihood of NAFLD, providing a noninvasive and practical method for identifying at-risk individuals without imaging.
Definition of MAFLD and Alcohol-associated liver disease (ALD)
MAFLD
14
is defined as the presence of hepatic steatosis, confirmed using noninvasive evaluations such as the fatty liver index (FLI ≥60), imaging techniques such as ultrasound and computed tomography (CT), and the presence of at least two of the following metabolic alterations: (a) overweight or obesity, defined as BMI ≥25 kg/m2 (adjusted for ethnicity-specific thresholds); (b) T2DM, diagnosed based on FBG values, glycated hemoglobin (HbA1c), and clinical diagnosis; and (c) metabolic dysregulation, defined by the presence of at least two of the following metabolic risk factors, including waist circumference ≥102 cm for males and ≥88 cm for females (adjusted for ethnicity), blood pressure ≥130/85 mmHg or use of antihypertensive therapy, plasma TG level ≥1.70 mmol/L or lipid-lowering treatment, high-density lipoprotein (HDL) cholesterol level <1.0 mmol/L for males and <1.3 mmol/L for females, and prediabetes (FBG level of 5.6–6.9 mmol/L or HbA1c level of 5.7%–6.4%). Homeostasis model assessment of insulin resistance (HOMA-IR ≥2.5) was calculated as fasting insulin (μU/mL) × FBS (mmol/L)/22.5.
15

ALD 16 is defined as the presence of elevated liver enzymes, specifically ALT or AST levels greater than 19 IU/L in females and 29 IU/L in males, combined with evidence of alcohol consumption, defined as follows: (a) current heavy alcohol consumption, defined as ≥3 drinks per day for females and ≥4 drinks per day for males or binge drinking (≥4 drinks on the same occasion for females and ≥5 drinks on the same occasion for males) ≥5 days per month; (b) current moderate alcohol consumption, defined as ≥2 drinks per day for females and ≥3 drinks per day for males or binge drinking ≥2 days per month; and (c) a history of daily binge drinking, regardless of current consumption patterns. This comprehensive definition combines biochemical and behavioral criteria to identify ALD.
Covariates
Through a comprehensive examination of existing literature, potential confounding covariates were identified in the multivariable-adjusted model for the relationship between various health conditions and associated biomarkers. Demographic covariates in this study included age, sex, race, and marital status. Socioeconomic covariates included poverty and educational levels.
Lifestyle and behavioral covariates included smoking status, alcohol consumption, and moderate physical activity. The anthropometric and laboratory covariates included BMI and ALT, AST, total bilirubin (TB), alkaline phosphatase (ALP), gamma-glutamyl transferase (GGT), creatinine, C-reactive protein (CRP), and albumin levels. These variables were carefully selected based on their potential influence on the relationships of interest and prevalence in previous studies.9,17,18
Statistical analyses
Continuous variables with a normal distribution were expressed as mean ± SD, whereas non-normally distributed continuous variables were presented as medians with interquartile ranges (IQRs). Categorical variables are expressed as frequencies and percentages. For continuous variables, group comparisons were conducted using the independent samples Student’s t-test for normally distributed data and Mann–Whitney U-test for skewed distributions.
For categorical variables, comparisons were made using chi-square test or Fisher’s exact test, as appropriate. Sample weights (WT) were calculated using the following formulas: 1999–2002, WT = WTsaf4yr × 2/10.625; 2003–2018, WT = WTsaf2yr × 1/10.625; and 2017–2020, WT = WTsaf2yr ×1.625/10.625. 19 To investigate the association between the ZJU index and outcome variables, both univariate and multivariate regression models were performed. The ZJU index was categorized into quartiles for primary analyses, and covariate selection was guided by prior scientific literature and expert judgment. Three multivariable models were constructed: (a) Model 0 was unadjusted; (b) Model 1 was adjusted for age and sex; and (c) Model 2 was further adjusted for race, marital status, socioeconomic status, educational level, alcohol consumption, smoking status, and TB, ALP, GGT, creatinine, CRP, and albumin levels. To evaluate potential trends across quartiles of the ZJU index, the median value of each quartile was treated as a continuous variable in the regression models.
Restricted cubic spline (RCS) models with four knots (5th, 35th, 65th, and 95th percentiles) were utilized to explore nonlinear dose–response relationships between the ZJU index and primary outcomes. Nonlinearity was evaluated by introducing a quadratic term into the models. In cases where a nonlinear association was identified, a two-piecewise linear regression model was applied to determine threshold effects, with the inflection point identified using a two-step recursive method. Subgroup analyses were conducted to examine interactions between the ZJU index and predefined covariates, including age, sex, BMI, T2DM, hypertension, and alcohol consumption. Interaction effects were tested using likelihood ratio tests, and stratified multivariable regression models were constructed for each subgroup. Missing data for covariates were addressed using imputation. Continuous variables were imputed using the mean, median, or mode, whereas categorical variables were imputed using the most frequent category or assigned a separate level for missingness. Sensitivity analyses were performed to ensure the robustness of the findings, including repeating the analysis with a complete case dataset and using alternative imputation methods. Additionally, the models were tested using different sets of covariates to assess the consistency of the results. Receiver operating characteristic (ROC) curve analysis was performed to evaluate the diagnostic performance of the ZJU index and MAFLD against the reference standard. Area under the ROC curve (AUC) and 95% confidence intervals (CIs) were estimated using the DeLong method.
All statistical analyses were conducted using R Statistical Software (version 4.2.2, The R Foundation) and Free Statistics Analysis Platform (version 2.0, Beijing, China). Free Statistics offers an intuitive graphical user interface (GUI) for conducting common statistical analyses and visualizations, utilizing R as the underlying computational engine. Statistical significance was defined as a two-sided p-value <0.05.
Results
Demographic characteristics
The study population, stratified by ZJU quartiles, comprised 31,101 participants (Table 1). Age exhibited a significant increase across quartiles, ranging from an average of 31.83 years in Q1 to 46.47 years in Q4 (p < 0.0001). The proportion of males decreased from 52.55% in Q3 to 41.88% in Q4 (p < 0.0001). The racial composition varied, with non-Hispanic White individuals forming the majority. There was a decrease in the percentage of individuals who were not married or living with a partner from 56.65% in Q1 to 34.93% in Q3 (p < 0.0001). Educational levels were higher in Q1, where 38.14% of the participants had a high school diploma or higher compared with 20.86% in Q2 (p < 0.0001). The average BMI increased significantly from 20.61 kg/m2 in Q1 to 36.90 kg/m2 in Q4 (p < 0.0001). Liver function markers, including ALT, AST, and GGT, showed an upward trend across quartiles. Inflammatory markers such as CRP also increased from 0.05 mg/dL in Q1 to 0.36 mg/dL in Q4 (p < 0.0001). Overall, most variables demonstrated significant differences across quartiles, indicating a diverse study population stratified by the ZJU index.
Weighted characteristics of the study population based on ZJU index quartiles.

Poverty level was measured as the PIR, a continuous variable calculated by dividing total family income by the federal poverty threshold specific to family size, age of family reference person, and survey year, following the US Department of Health and Human Services (HHS) poverty guidelines. PIR is a dimensionless ratio where a value of 1.0 indicates income at the poverty line, and higher values represent greater income relative to poverty.
ZJU: Zhejiang University; BMI: body mass index; ALT: alanine aminotransferase; AST: aspartate aminotransferase; Q1: first quartile; Q2: second quartile; Q3: third quartile; Q4: fourth quartile; PIR: poverty income ratio.
Logistic regression analysis of the ZJU index and MAFLD and ALD
Multivariable logistic regression analyses were conducted to explore the relationship between the ZJU index and NAFLD (MAFLD). Across the four models, potential confounders were progressively adjusted. The core finding was that the ZJU index was significantly and positively associated with the likelihood of developing MAFLD, even after accounting for a comprehensive set of covariates in fully adjusted Model 2, including demographic factors, lifestyle variables, and clinical biomarkers. In Model 2, the odds ratio (OR) was 2.05 (95% CI: 1.97, 2.15, p < 0.001), indicating that a 1-unit increase in the ZJU index was associated with a 2.05-fold increase in the risk of MAFLD. Additionally, when the ZJU index was categorized into quartiles, a dose–response relationship was observed, with the highest risk found in the fourth quartile (OR = 35863.52, 95% CI: 14720.11, 87376.58, p < 0.001), suggesting that higher ZJU index values corresponded to progressively greater MAFLD risk (Table 2). The ZJU index exhibited excellent diagnostic performance for MAFLD with an AUC of 0.958 (95% CI: 0.956–0.960), indicating robust discriminative ability and high clinical applicability (Figure 2).
Associations between the ZJU index and MAFLD in logistic regression analyses.

Model 0: Crude;
Model 1: Adjusted for age and sex;
Model 2: Adjusted for age, sex, race, marital status, poverty level, educational level, alcohol consumption, smoking status, creatinine level, CRP level, and albumin level.
CRP: C-reactive protein; Q1: first quartile; Q2: second quartile; Q3: third quartile; Q4: fourth quartile; ZJU: Zhejiang University; MAFLD: metabolic dysfunction-associated fatty liver disease; OR: odds ratio; CI: confidence interval.
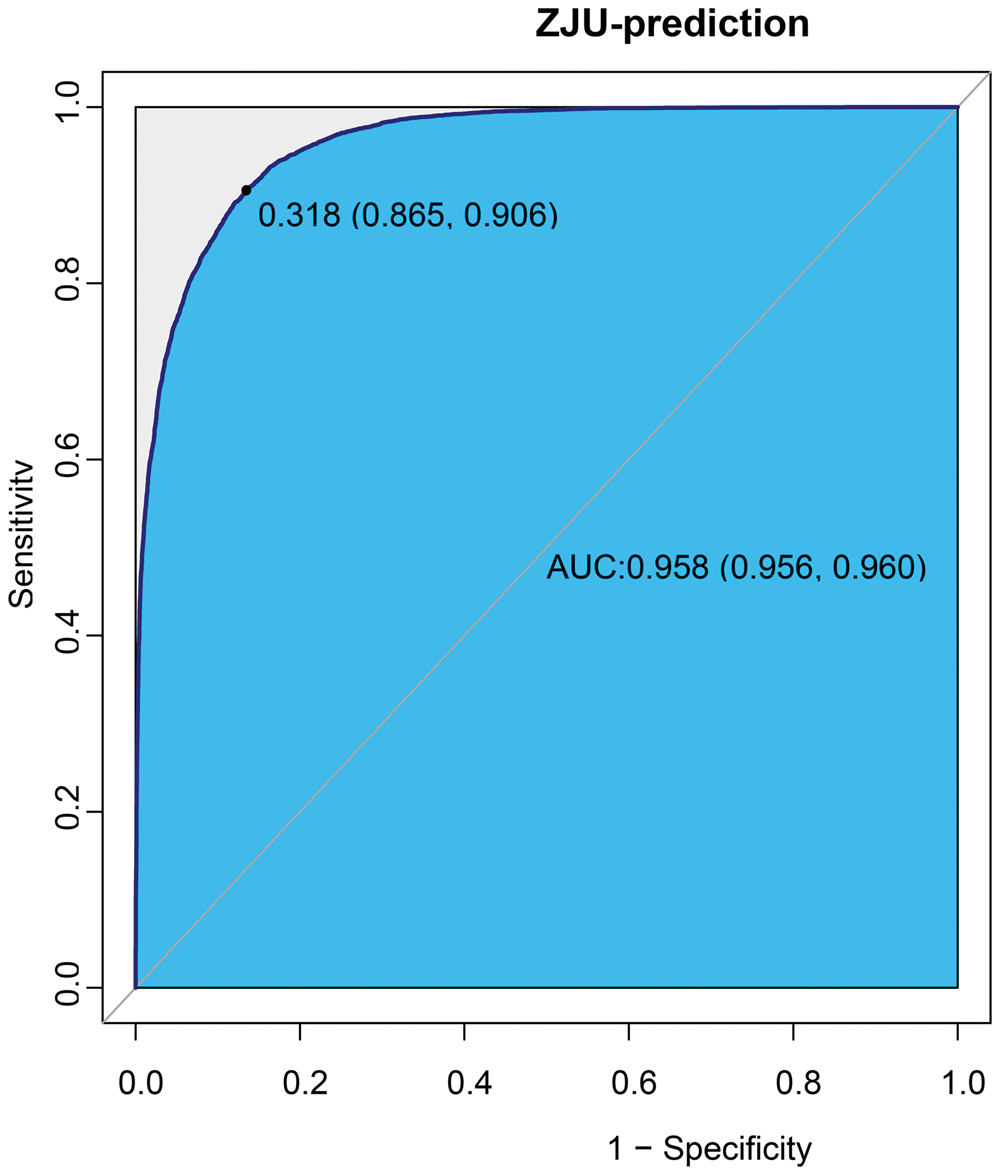
ROC curve of the ZJU index for MAFLD prediction. The AUC was 95.78% (95.59%–95.96%).
Linear regression analysis consistently showed a significant association between the ZJU index and alcoholic fatty liver disease (AFLD) across the models, with the relationship strengthening after adjusting for covariates. Notably, the fully adjusted Model 2, which included clinical biomarkers, confirmed a robust association (OR = 1.10, 95% CI: 1.09, 1.11; p < 0.001). This stability suggests a reliable link between ZJU and AFLD, which is likely to be applicable to ALD (Supplementary Table 1).
Nonlinear relationship between the ZJU index and MAFLD
Adjusted smoothed plots indicated a clear linear relationship between the ZJU index and MAFLD, as shown in Figure 3 (p for nonlinearity <0.001, with the exclusion of the highest and lowest 0.5% of each ZJU index measure). Threshold effect analysis indicated that the relationship between the ZJU index and MAFLD was nonlinear, with a critical breakpoint of 46.407. Below this threshold, each unit increase in ZJU significantly increased the risk of MAFLD 2.035 times. Above the threshold, the risk still increased, but at a reduced rate of 1.125 times per unit increase in the ZJU index. This suggests that monitoring ZJU levels around the threshold is crucial for early identification and intervention of MAFLD risk (Table 3).
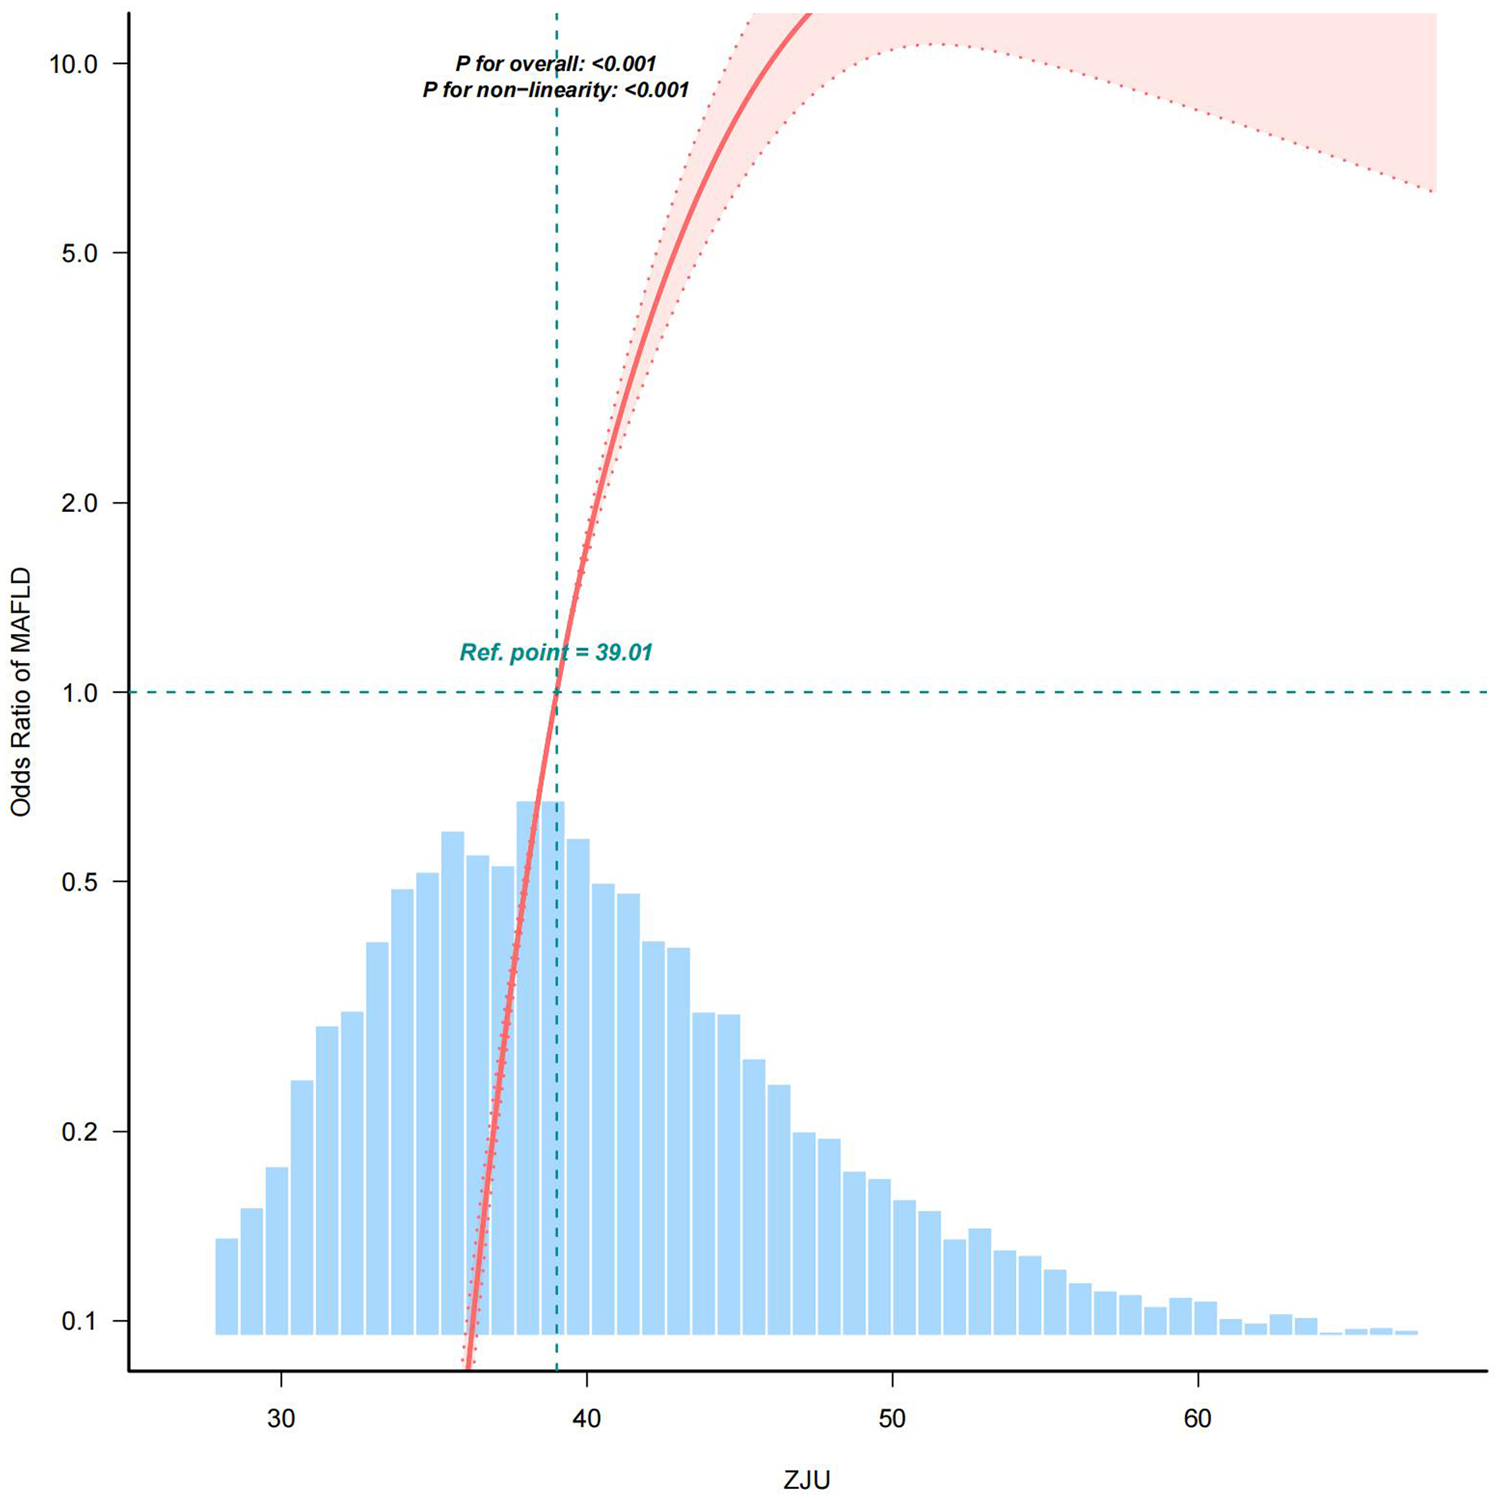
Nonlinear relationship between the ZJU index and MAFLD. ZJU: Zhejiang University; MAFLD: metabolic dysfunction-associated fatty liver disease.
Threshold effect analysis of the ZJU index on MAFLD using a two-piecewise linear regression model.

OR: odds ratio; CI: confidence interval; E_BK: estimated breakpoint; WT: weight.
Subgroup and sensitivity analyses
Stratified weighted multivariate regression analysis revealed that the association between the ZJU index and MAFLD was significantly stronger in males than in females; this association was also significantly stronger in those aged <50 years than in those aged ≥50 years. Additionally, the relationship was markedly stronger in with nondiabetic individuals (OR = 2.88, 95% CI: 2.69, 3.07) (Table 4).
Association between the ZJU index and MAFLD stratified by sex, age, diabetes status, BMI, and hypertension status.

ZJU: Zhejiang University; MAFLD: metabolic dysfunction-associated fatty liver disease; BMI: body mass index; OR: odds ratio; CI: confidence interval.
Sensitivity analysis using both unimputed weighted data and imputed unweighted data consistently demonstrated a robust association between the ZJU index and MAFLD. In the unimputed weighted analysis (Supplementary Table 2), the crude model showed an OR of 1.72 (95% CI: 1.68, 1.77; p < 0.001), which increased to 2.00 (95% CI: 1.93, 2.06; p < 0.001) after adjusting for covariates. Similarly, in the imputed unweighted analysis (Supplementary Table 3), the crude OR was 1.68 (95% CI: 1.66, 1.70; p < 0.001), and the adjusted OR was 1.86 (95% CI: 1.82, 1.89; p < 0.001). Both analyses revealed a significant dose–response relationship across ZJU quartiles, with the highest risk observed in the fourth quartile and a significant trend (p for trend < 0.001 in both tables). These findings confirm the stability of the association between the ZJU index and MAFLD regardless of the data imputation and weighting methods.
Discussion
MAFLD has emerged as a significant global health concern, particularly in the context of the increasing prevalence of obesity, T2DM, and metabolic syndrome. 20 This condition is characterized by the accumulation of fat in the liver without significant alcohol consumption, leading to serious health complications, including liver cirrhosis and cardiovascular diseases. The redefinition of this disease from NAFLD to MAFLD underscores its metabolic underpinnings and the need for greater awareness and diagnostic accuracy in clinical settings. 21 Consequently, effective screening and early detection strategies are essential to mitigate the associated health risks and economic burden on healthcare systems worldwide.
This study investigated the ZJU index, a novel predictive tool designed to identify individuals at risk of developing MAFLD. We performed comprehensive analyses of data from the NHANES (1999–2020) to validate the ZJU index as a reliable and noninvasive biomarker for the early detection of MAFLD. We found a significant association between the ZJU index and MAFLD prevalence, supporting its potential utility in clinical practice and public health interventions. This discussion will delve into the implications of our results, emphasizing the importance of demographic factors, risk stratification, and the need for further research to enhance our understanding of this complex disease. 22
Unlike previous studies that focused on traditional risk factors such as BMI and metabolic syndrome components, our investigation emphasized on a novel integrated approach that combines metabolic and anthropometric parameters to yield a powerful predictive index. 23 In addition, the ZJU index was used to assess the risk of obstructive sleep apnea syndrome (OSAS). 24 In a cross-sectional study targeting middle-aged and older individuals in China, the ZJU index was significantly associated with the risk of OSAS, particularly in individuals with a higher ZJU index for whom the risk of OSAS was markedly increased. Additionally, the ZJU index may be associated with sarcopenia risk in American adults aged 20–59 years, as demonstrated in a cross-sectional study 18 . It has been identified as a predictive marker for the incidence of diabetes, as evidenced by a population-based cohort study. 25 Furthermore, according to the cross-sectional NHANES (2017–2020), the ZJU index is associated with the risk of gallstones in American adults. 17 In subgroup analyses, we observed a significantly stronger association among nondiabetic participants (OR = 2.20) than among diabetic participants (OR = 1.47; p < 0.001), suggesting that diabetes attenuates the predictive performance of the ZJU index. Potential underlying mechanisms include pre-existing severe insulin resistance and established hepatic steatosis in diabetic individuals. Given the well-established link between MAFLD and insulin resistance, both prevalence of MAFLD and diagnostic accuracy of various predictive indices, including the ZJU index, may be systematically altered in this population. 26 Moreover, postprandial hyperglycemia can exacerbate insulin resistance and systemic inflammation, thereby promoting the development and progression of MAFLD. 12 Collectively, these findings imply that the discriminative capacity of the ZJU index may be inherently limited in populations characterized by pronounced insulin resistance or elevated baseline hepatic fat content.
The implications of our findings extend beyond mere academic interest; they carry significance for clinical practice and public health policies. The identification of the ZJU index as a reliable noninvasive screening tool may lead to earlier diagnosis and intervention strategies for at-risk populations, mitigating the long-term consequences of MAFLD, such as liver cirrhosis and cardiovascular diseases. 27 Furthermore, evidence supporting the ZJU index suggests that healthcare providers can implement this tool in routine assessments to enhance preventive strategies tailored to individual metabolic profiles. This aligns with recent guidelines advocating comprehensive screening measures among populations predisposed to metabolic disorders, particularly considering the increasing prevalence of obesity and associated comorbidities. 28
Despite these promising results, this study has certain limitations. The reliance on cross-sectional data from the NHANES survey poses challenges to establishing causal relationships between the ZJU index and MAFLD progression. Additionally, the study design, which is inherently dependent on self-reported lifestyle factors, may have introduced biases that could affect the robustness of our findings. 29 Future research should conduct longitudinal studies to better understand the temporal dynamics of MAFLD risk factors and the predictive capacity of the ZJU index over time. Moreover, enhancing data collection methods to ensure accuracy in lifestyle reporting and expanding participant diversity will be crucial for validating the generalizability of our results across different populations.
In conclusion, this study underscores the significance of the ZJU index in identifying individuals at risk of MAFLD, offering a promising noninvasive tool for early detection. The robust associations established between the ZJU index and various risk factors highlight the potential for targeted public health interventions aimed at mitigating the burden of MAFLD.
Supplemental Material
sj-pdf-1-imr-10.1177_03000605261431613 - Supplemental material for Association between the Zhejiang University index and metabolic dysfunction-associated fatty liver disease as analyzed in National Health and Nutrition Examination Survey: A retrospective observational study
Supplemental material, sj-pdf-1-imr-10.1177_03000605261431613 for Association between the Zhejiang University index and metabolic dysfunction-associated fatty liver disease as analyzed in National Health and Nutrition Examination Survey: A retrospective observational study by Wei Fu, Xiaoyue Wu, Guobin Cheng, Linya Lyu and Hulin Wang in Journal of International Medical Research
Footnotes
Acknowledgments
The authors would like to express their gratitude to all participants, staff members, and fellow study investigators for their invaluable contributions to this research.
In the course of composing this scholarly work, the employment of artificial intelligence models was deemed necessary to refine linguistic articulation and rectify any grammatical inaccuracies. Furthermore, the authors assume full responsibility for the utilization of artificial intelligence in the aforementioned capacity.
Authors’ contributions
W.F. designed the study and collected data. G.C. provided funding support and contributed to data analysis and interpretation. X.W. and L.L. prepared the figures and tables. H.W. assisted with data collection and wrote the initial draft. All the authors contributed to the writing and revision of the manuscript.
Availability of data and materials
Consent for publication
All authors have read and approved the final version of the manuscript and provided consent for publication. The corresponding author confirms that all authors have been informed of the submission and have provided consent for publication.
Declaration of conflicting interests
The authors declare that they have no competing financial or nonfinancial interests related to the work described in this manuscript. All authors confirm that there are no conflicts of interest, including financial, personal, or other relationships that could have influenced the study.
Ethics approval and consent to participate
Ethical approval for this study was granted by the Medical Ethics Committee of 925th Hospital (YNKT202501). The data used were anonymized and are publicly available from the NHANES website, leading to the study being categorized as “non-human subjects” research by the 925th Hospital Review Board. Written informed consent was obtained from all the participants.
Funding
Funding was received from the 925th Hospital of PLA Joint Logistics Support Force, Guiyang, China (2025-YNKT-05).
Supplemental material
Supplemental material for this article is available online.
References
Supplementary Material
Please find the following supplemental material available below.
For Open Access articles published under a Creative Commons License, all supplemental material carries the same license as the article it is associated with.
For non-Open Access articles published, all supplemental material carries a non-exclusive license, and permission requests for re-use of supplemental material or any part of supplemental material shall be sent directly to the copyright owner as specified in the copyright notice associated with the article.