
Abstract
Background
Accumulating evidence suggests that sleep disorders are strongly associated with obesity, particularly visceral adiposity. A Body Shape Index has been recognized as a more accurate anthropometric indicator for assessing overall obesity and visceral fat levels. This study aimed to explore the potential relationship between obesity and sleep disorders in a representative sample of the U.S. adult population.
Methods
This retrospective study involved data from 25,057 adults aged 20 years and older who participated in the National Health and Nutrition Examination Survey between 2005 and 2016. Multivariate logistic regression models, restricted cubic spline analysis, and subgroup stratification were used to analyze the association between A Body Shape Index and sleep disorders.
Results
Among the 25,057 participants, 6310 reported experiencing sleep disorders. After adjusting for potential confounders, the results revealed that a unit increase in A Body Shape Index was associated with a 10% higher likelihood of sleep disorders (odds ratio = 1.1, 95% confidence interval: 1.02–1.18, p < 0.05). When A Body Shape Index was categorized into tertiles, individuals in the highest tertile exhibited a significantly higher prevalence of sleep disorders compared with those in the lowest tertile (odds ratio = 1.13, 95% confidence interval: 1.04–1.23, p < 0.05). Restricted cubic spline analysis revealed a nonlinear relationship between A Body Shape Index and sleep disorders (p = 0.004). Additionally, subgroup analysis demonstrated a statistically significant interaction between age and A Body Shape Index categories (p < 0.05).
Conclusion
These findings demonstrate a positive association between A Body Shape Index and the prevalence of sleep disorders. A Body Shape Index may serve as a practical and simple anthropometric marker for identifying individuals at increased risk of sleep disorders.
Keywords
Introduction
Adequate sleep is essential for the optimal maintenance of memory consolidation, cognitive performance, emotional regulation, and proper functioning of endocrine and immune systems. 1 However, research indicates that a substantial proportion of adults fail to achieve the 7-h nightly sleep duration recommended by public health authorities for optimal health.2,3 The prevalence of sleep disorders is increasing in the contemporary society, affecting 30%–50% of the global population. 4 The Centers for Disease Control and Prevention (CDC) has recognized sleep disorders as a global public health concern. 5 Sleep disorders are characterized by disruptions in normal sleep architecture, manifesting as prolonged sleep latency, diminished sleep quality, and insufficient sleep duration. These disturbances significantly compromise quality of life and overall health, leading to daytime fatigue, cognitive impairment, and other sequelae that exert substantial deleterious effects on both somatic and psychological well-being. 6 Furthermore, sleep disorders are associated with various chronic diseases, including depression, 7 cardiovascular disease, 8 obesity, and stroke,4,9 which complicate disease management and may increase mortality.1,10 Therefore, further research is needed to elucidate factors associated with sleep disorders.
Obesity—defined by excessive adipose accumulation—affects >650 million people globally and constitutes a major public health threat.11,12 Beyond its established causal role in cardiometabolic diseases and multiple malignancies, obesity is consistently associated with sleep disturbances,13,14 sleep insufficiency, and circadian dysregulation. 15 Obesity-related obstructive sleep apnea, obesity hypoventilation syndrome, and associated proinflammatory cytokine release disrupt sleep architecture and increase the risk of sleep disorders. 16
In recent years, the association between obesity and sleep disorders has attracted considerable attention. However, traditional obesity indicators, such as body mass index (BMI), are limited in their accuracy as measures of obesity because they do not account for bone density, fat distribution, and muscle mass. 17 Therefore, Krakauer et al. 18 developed a new obesity index based on body shape characteristics in the U.S. population—the A Body Shape Index (ABSI). This index standardizes waist circumference (WC), BMI, and height to reflect the proportional relationship between waist circumference and overall body obesity. The correlation between ABSI and BMI is minimized, providing a measure of abdominal protrusion that does not rely on BMI (reflecting body shape rather than size). After controlling for factors such as height and weight, it was found that higher ABSI values are associated with a greater proportion of visceral (abdominal) fat relative to surrounding fat. ABSI is more focused on identifying health risks related to abdominal obesity and can more accurately assess body fat distribution and its relationship with the risk of chronic diseases. 19 Latest research has confirmed that ABSI is significantly associated with various health indicators, including cardiovascular diseases, diabetes, cancer, and all-cause mortality. 20
Although ABSI has been shown to be a more effective predictor of the health impacts of obesity and serves as a significant metric in assessing body composition, its association with the prevalence of sleep disorders has not been extensively studied. Therefore, this study aims to investigate the association between body shape indices and sleep disorders in a nationally representative cohort using data from the National Health and Nutrition Examination Survey (NHANES) collected between 2005 and 2016.
Materials and methods
Study population and design
This study was a cross-sectional study conducted using NHANES data. NHANES data were collected by the National Center for Health Statistics in the United States using a stratified, multistage random sampling approach. The research protocol underwent rigorous review and received ethical approval from the NHANES Institutional Review Board. All participants provided informed consent before inclusion in the study, ensuring adherence to ethical standards. For comprehensive details regarding NHANES data, refer to the official website: http://www.cdc.gov/nchs/nhanes. This study was conducted in accordance with the 1975 Helsinki Declaration (revised in 2024). The reporting of this study conforms to the Strengthening the Reporting of Observational Studies in Epidemiology (STROBE) guidelines. 21
To ensure a sufficient sample size for analysis, NHANES data from eight cycles spanning from 2005 to 2016 were used to explore the association between ABSI and sleep disorders. Initially, a total of 60,936 participants were considered. This study has anonymized all patient information. The study included participants aged 20 years and above, resulting in an initial sample size of 3857. Participants with missing data on BMI (n = 1736), WC (n = 1565), sleep disorders (n = 13), and covariates (n = 5809) were excluded, resulting in a final sample of 25,057 participants (Figure 1).
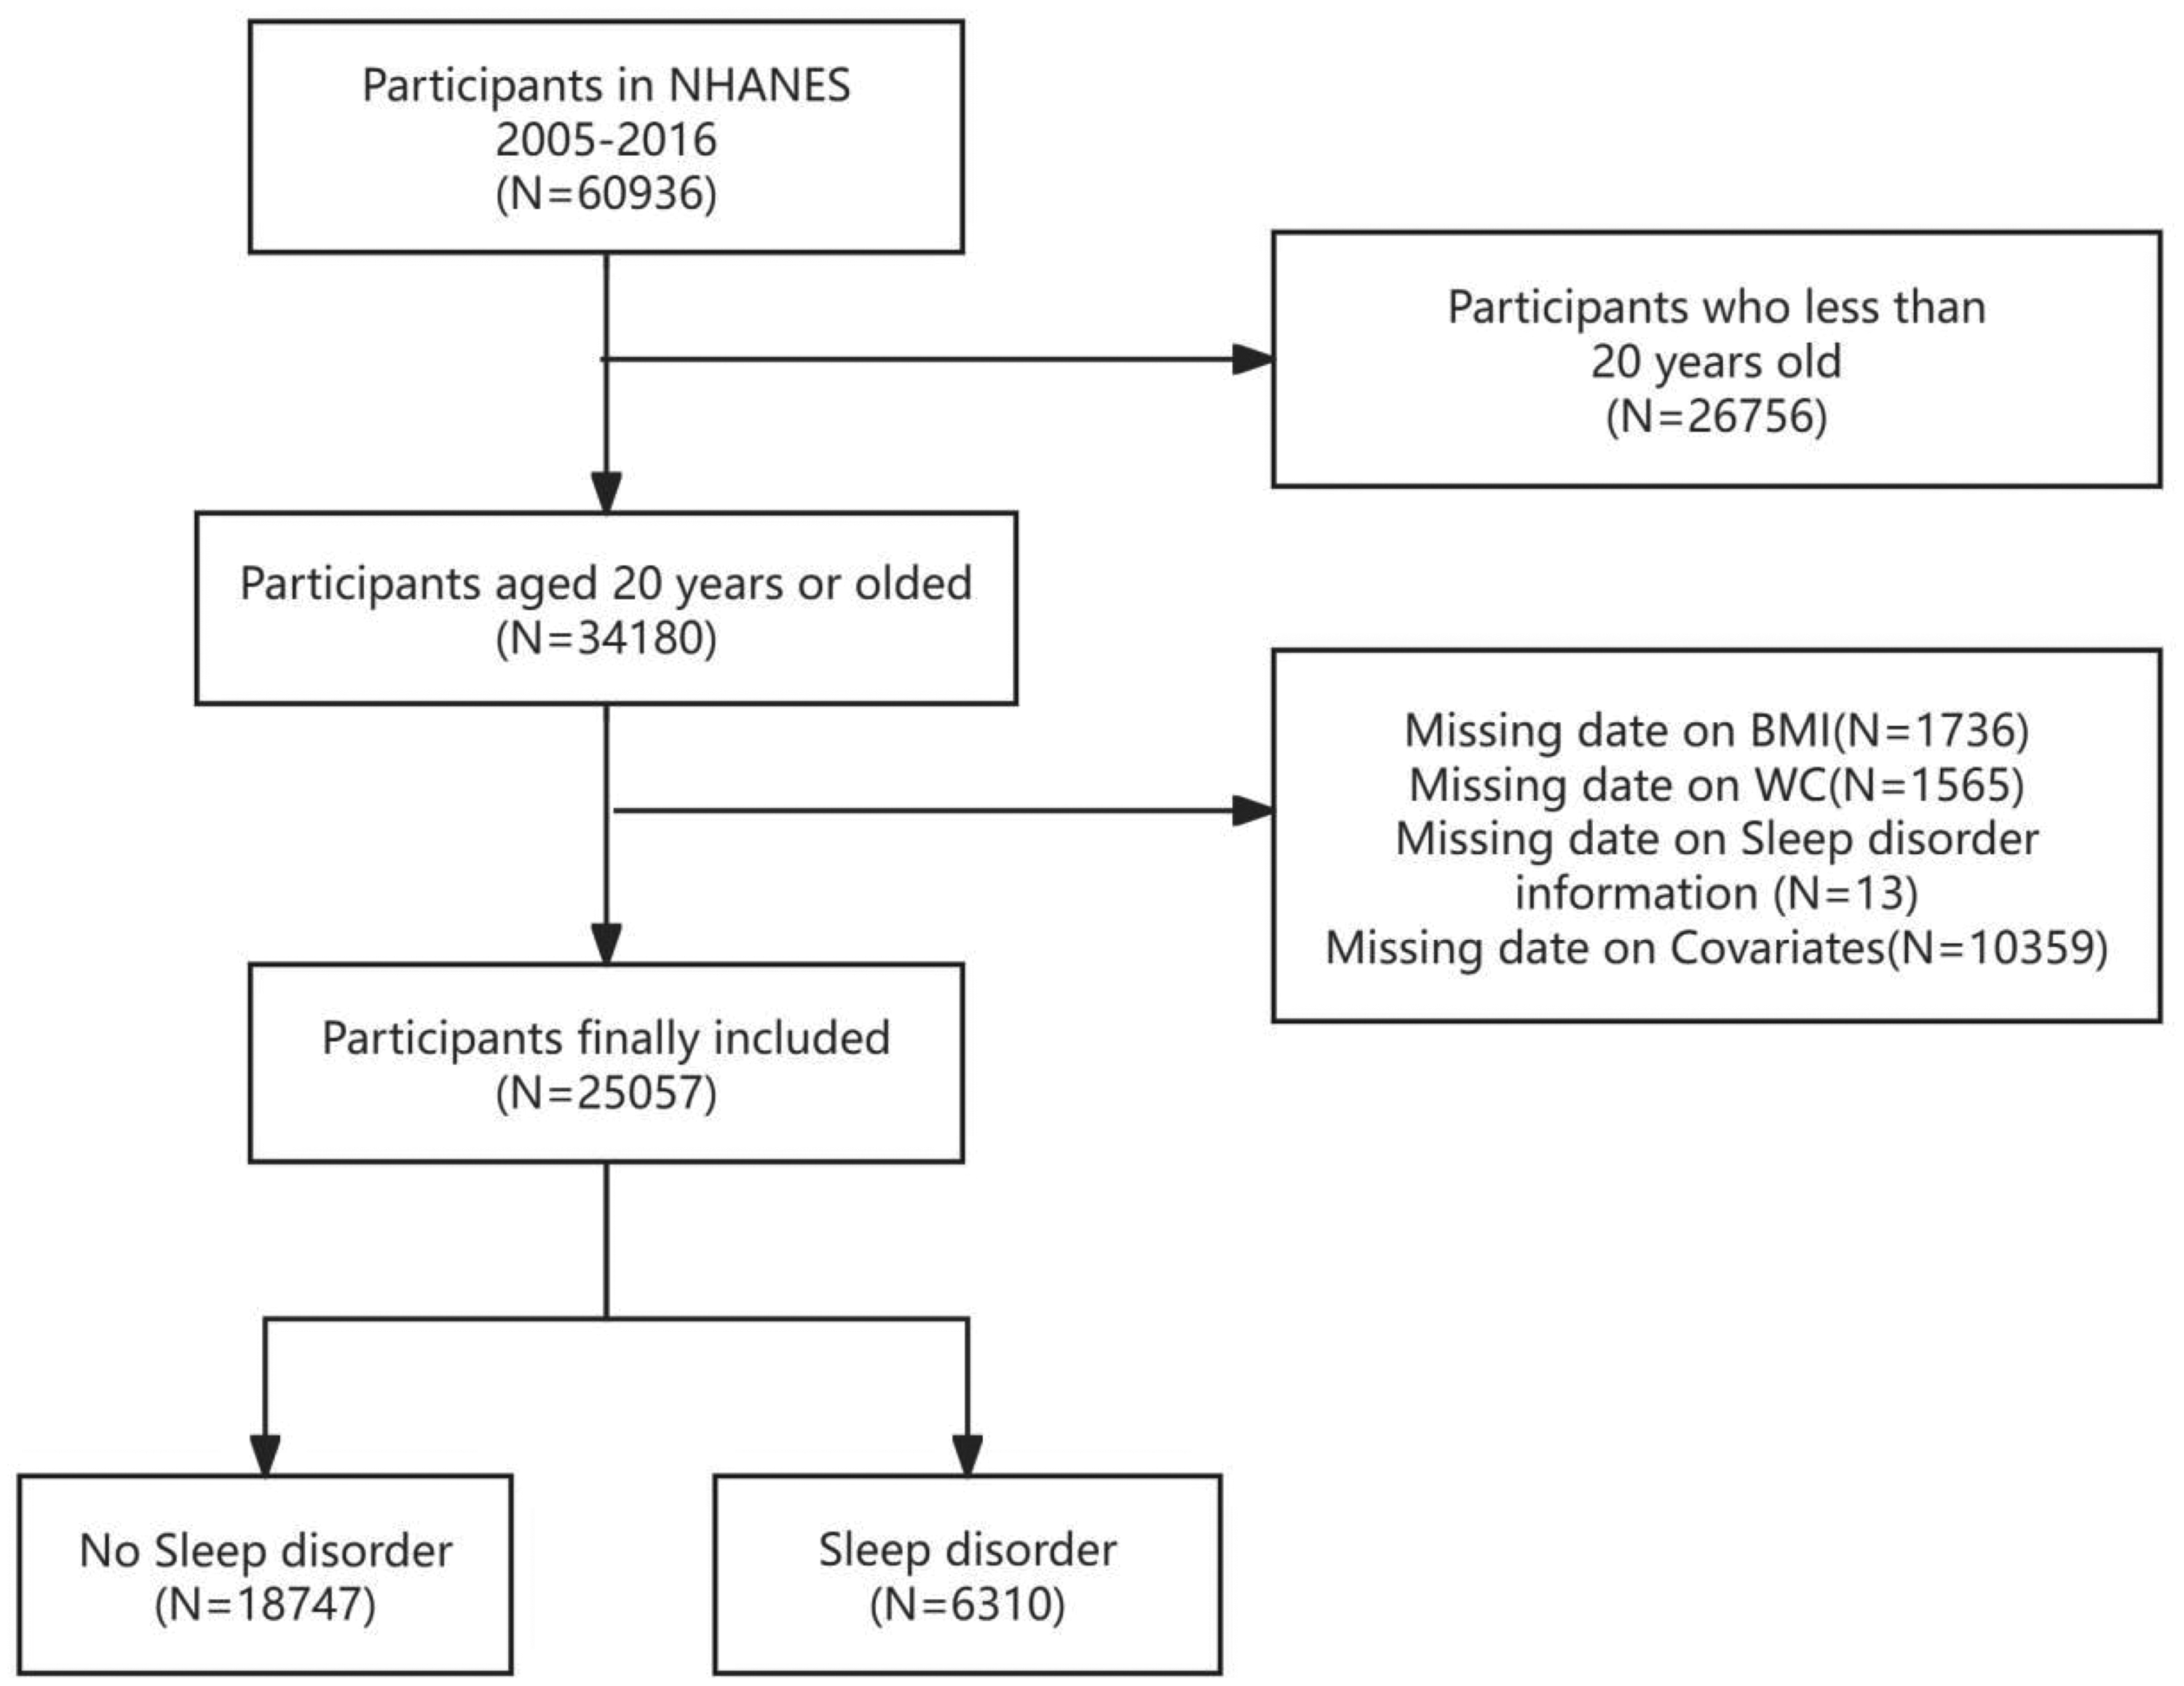
Flow chart of the inclusion and exclusion criteria process.
ABSI
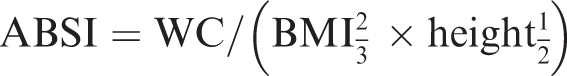
ABSI, a recognized indicator of obesity, served as the exposure variable. It was computed based on WC, height, and BMI. Both WC and height were measured in meters.
18
The ABSI value for each participant was calculated and rounded to three decimal places. To ensure accuracy, height and WC were measured by trained health technicians at the Mobile Examination Center. In this study, ABSI was categorized into three groups according to tertiles to examine its association with sleep disorders. The formula for calculating ABSI was as follows:
Covariates
NHANES collects sociodemographic information using structured data collection methods. Based on previous research, the covariates included in this study were sex, age, race, educational level, marital status, family income, poverty income ratio (PIR), alcohol consumption, smoking status, history of hypertension, history of diabetes, waist-to-height ratio (WHtR), exercise habits, depression status, triglyceride levels, and glycated hemoglobin levels. Smoking history was defined as “having smoked over 100 cigarettes in one’s lifetime,” while alcohol consumption was defined as “consuming at least 12 alcoholic beverages annually.” WHtR was calculated as WC divided by height. Triglyceride and glycated hemoglobin levels were assessed from blood samples. The 9-item Patient Health Questionnaire (PHQ-9) depression scale was used to evaluate depressive symptoms. 22 The PHQ-9 is a commonly used screening tool in clinical settings, comprising nine questions, with a total score ranging from 0 to 27. In this study, patients with a PHQ-9 total score of 10 or higher were classified as having chronic resistant depression (CRD).
Outcome variable
The dependent variable was the presence of sleep disorders. Participants responded to questions regarding sleep disorders through a dedicated questionnaire. The specific question used to assess the presence of sleep disorders was as follows: “Have you informed a doctor or other health professional about sleep difficulties?” Only participants who provided a clear “yes” or “no” response were included in the study. Those with missing data or responses such as “refused” and “did not know” were treated as missing values and excluded from the analysis. 23 The same question was consistently used across eight cycles to ensure consistency in data collection.
Statistical analysis
Mean values and standard deviations (SD) were computed for continuous variables, while counts (N) and percentages (%) were reported for categorical variables. To assess differences between the sleep disorder and nonsleep disorder groups, group comparisons were conducted using t-tests for continuous variables and chi-square tests for categorical variables. This study employed a detailed methodological approach beyond baseline statistical description and univariate analysis. To minimize underestimation of ABSI values and reduce the risk of inaccurate results, ABSI measurements were scaled by a factor of 100 for subsequent statistical analyses. The multivariate logistic regression model was the primary analytical tool for evaluating the odds ratio (OR) and 95% confidence interval (CI) for the association between ABSI and sleep disorders. Unadjusted, minimally adjusted, and fully adjusted findings were presented in accordance with the STROBE guidelines: Model 1 served as a basic reference and was not adjusted for any covariates; Model 2 was adjusted for sociodemographic characteristics (age, sex, and race); Model 3 was adjusted for Model 2 plus covariates with p < 0.1 in the univariate model and comorbidities; Model 4 was the most comprehensive model, adjusted for covariates with effect size changes exceeding 10% based on Model 3 as well as other variables reported in the literature. In the multivariate logistic regression with tertiles, the lowest tertile (T1) of ABSI was designated as the reference category in each model. To explore the potential nonlinear relationship between ABSI and sleep disorders, restricted cubic spline (RCS) functions were applied within the multivariate adjusted model. Notably, RCS operates by segmenting predictor variables into a series of polynomial functions, with each segment fitted using a low-order polynomial. The study population was stratified by key variables such as sex and age to account for potential confounding factors and heterogeneity. Subgroup analysis was performed to compare effects across different strata, track potential changes, and systematically evaluate variable interactions.
Results
Baseline characteristics of participants
This study included a total of 25,057 adults aged 20 years and older, categorized into 2 groups based on the presence of sleep disorders. The nonsleep disorder group comprised 18,747 participants, while the sleep disorder group consisted of 6310 participants, representing 25.2% of the total study population. The mean age of the sleep disorder group was 52.2 ± 16.3 years. Notably, the sleep disorder group exhibited a higher proportion of females, greater prevalence of depression, lower levels of physical activity, higher incidence of diabetes and hypertension, and greater tendency toward smoking and drinking. The mean ABSIs in the nonsleep disorder and sleep disorder groups were 0.081 ± 0.005 and 0.082 ± 0.005, respectively. Statistically significant differences were observed in various factors between the two groups (all p < 0.05; Table 1).
Basic characteristics of participants regarding the presence of sleep disorders.
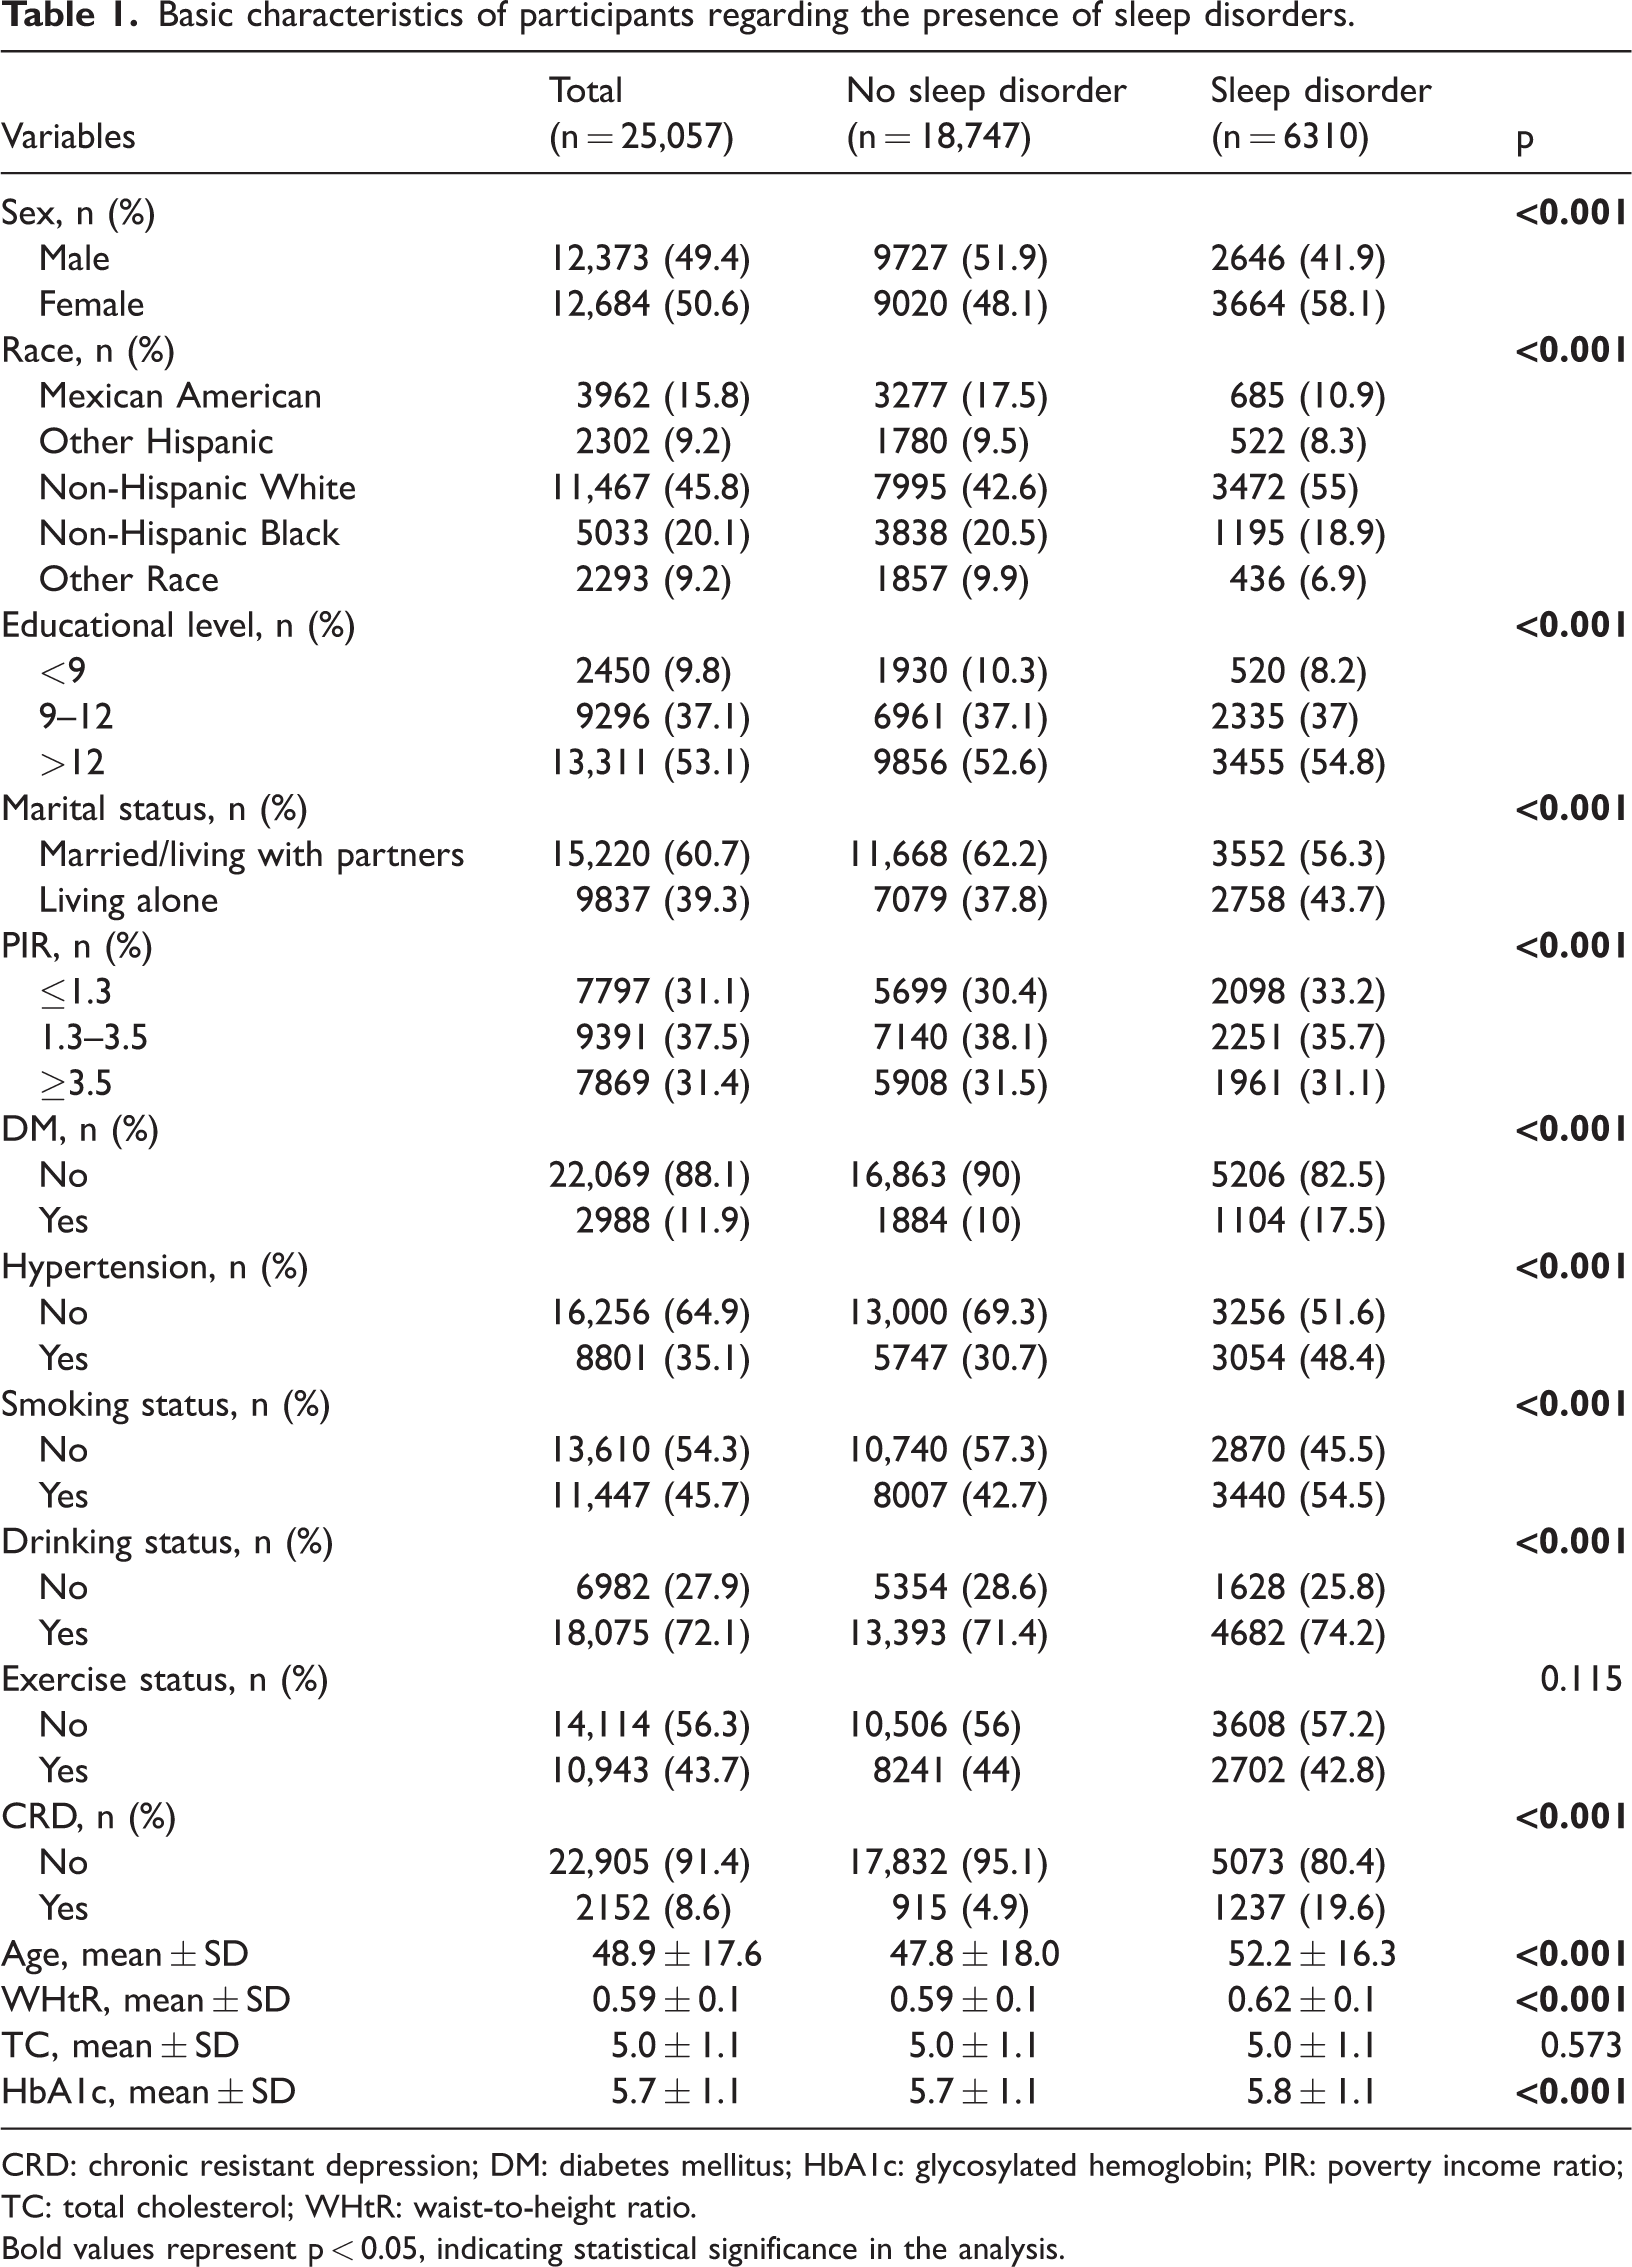
CRD: chronic resistant depression; DM: diabetes mellitus; HbA1c: glycosylated hemoglobin; PIR: poverty income ratio; TC: total cholesterol; WHtR: waist-to-height ratio.
Bold values represent p < 0.05, indicating statistical significance in the analysis.
ABSI was classified into tertiles: 0.058–0.08 (T1), 0.081–0.084 (T2), and 0.084–0.117 (T3). Increasing ABSI tertiles were associated with a rise in the mean age of participants, from 39.7 ± 14.9 years in the T1 group to 58.9 ± 16.4 years in the T3 group. Notably, the T3 group was characterized by a higher proportion of males; lower PIR; lower educational level; lower levels of physical activity; and greater incidences of smoking, drinking, hypertension, diabetes, and depression; and higher levels of triglycerides and glycated hemoglobin. Furthermore, significant differences were observed in other characteristics across the ABSI tertile groups (all p < 0.001; Table 2).
Baseline characteristics of participants in different ABSI level groups.
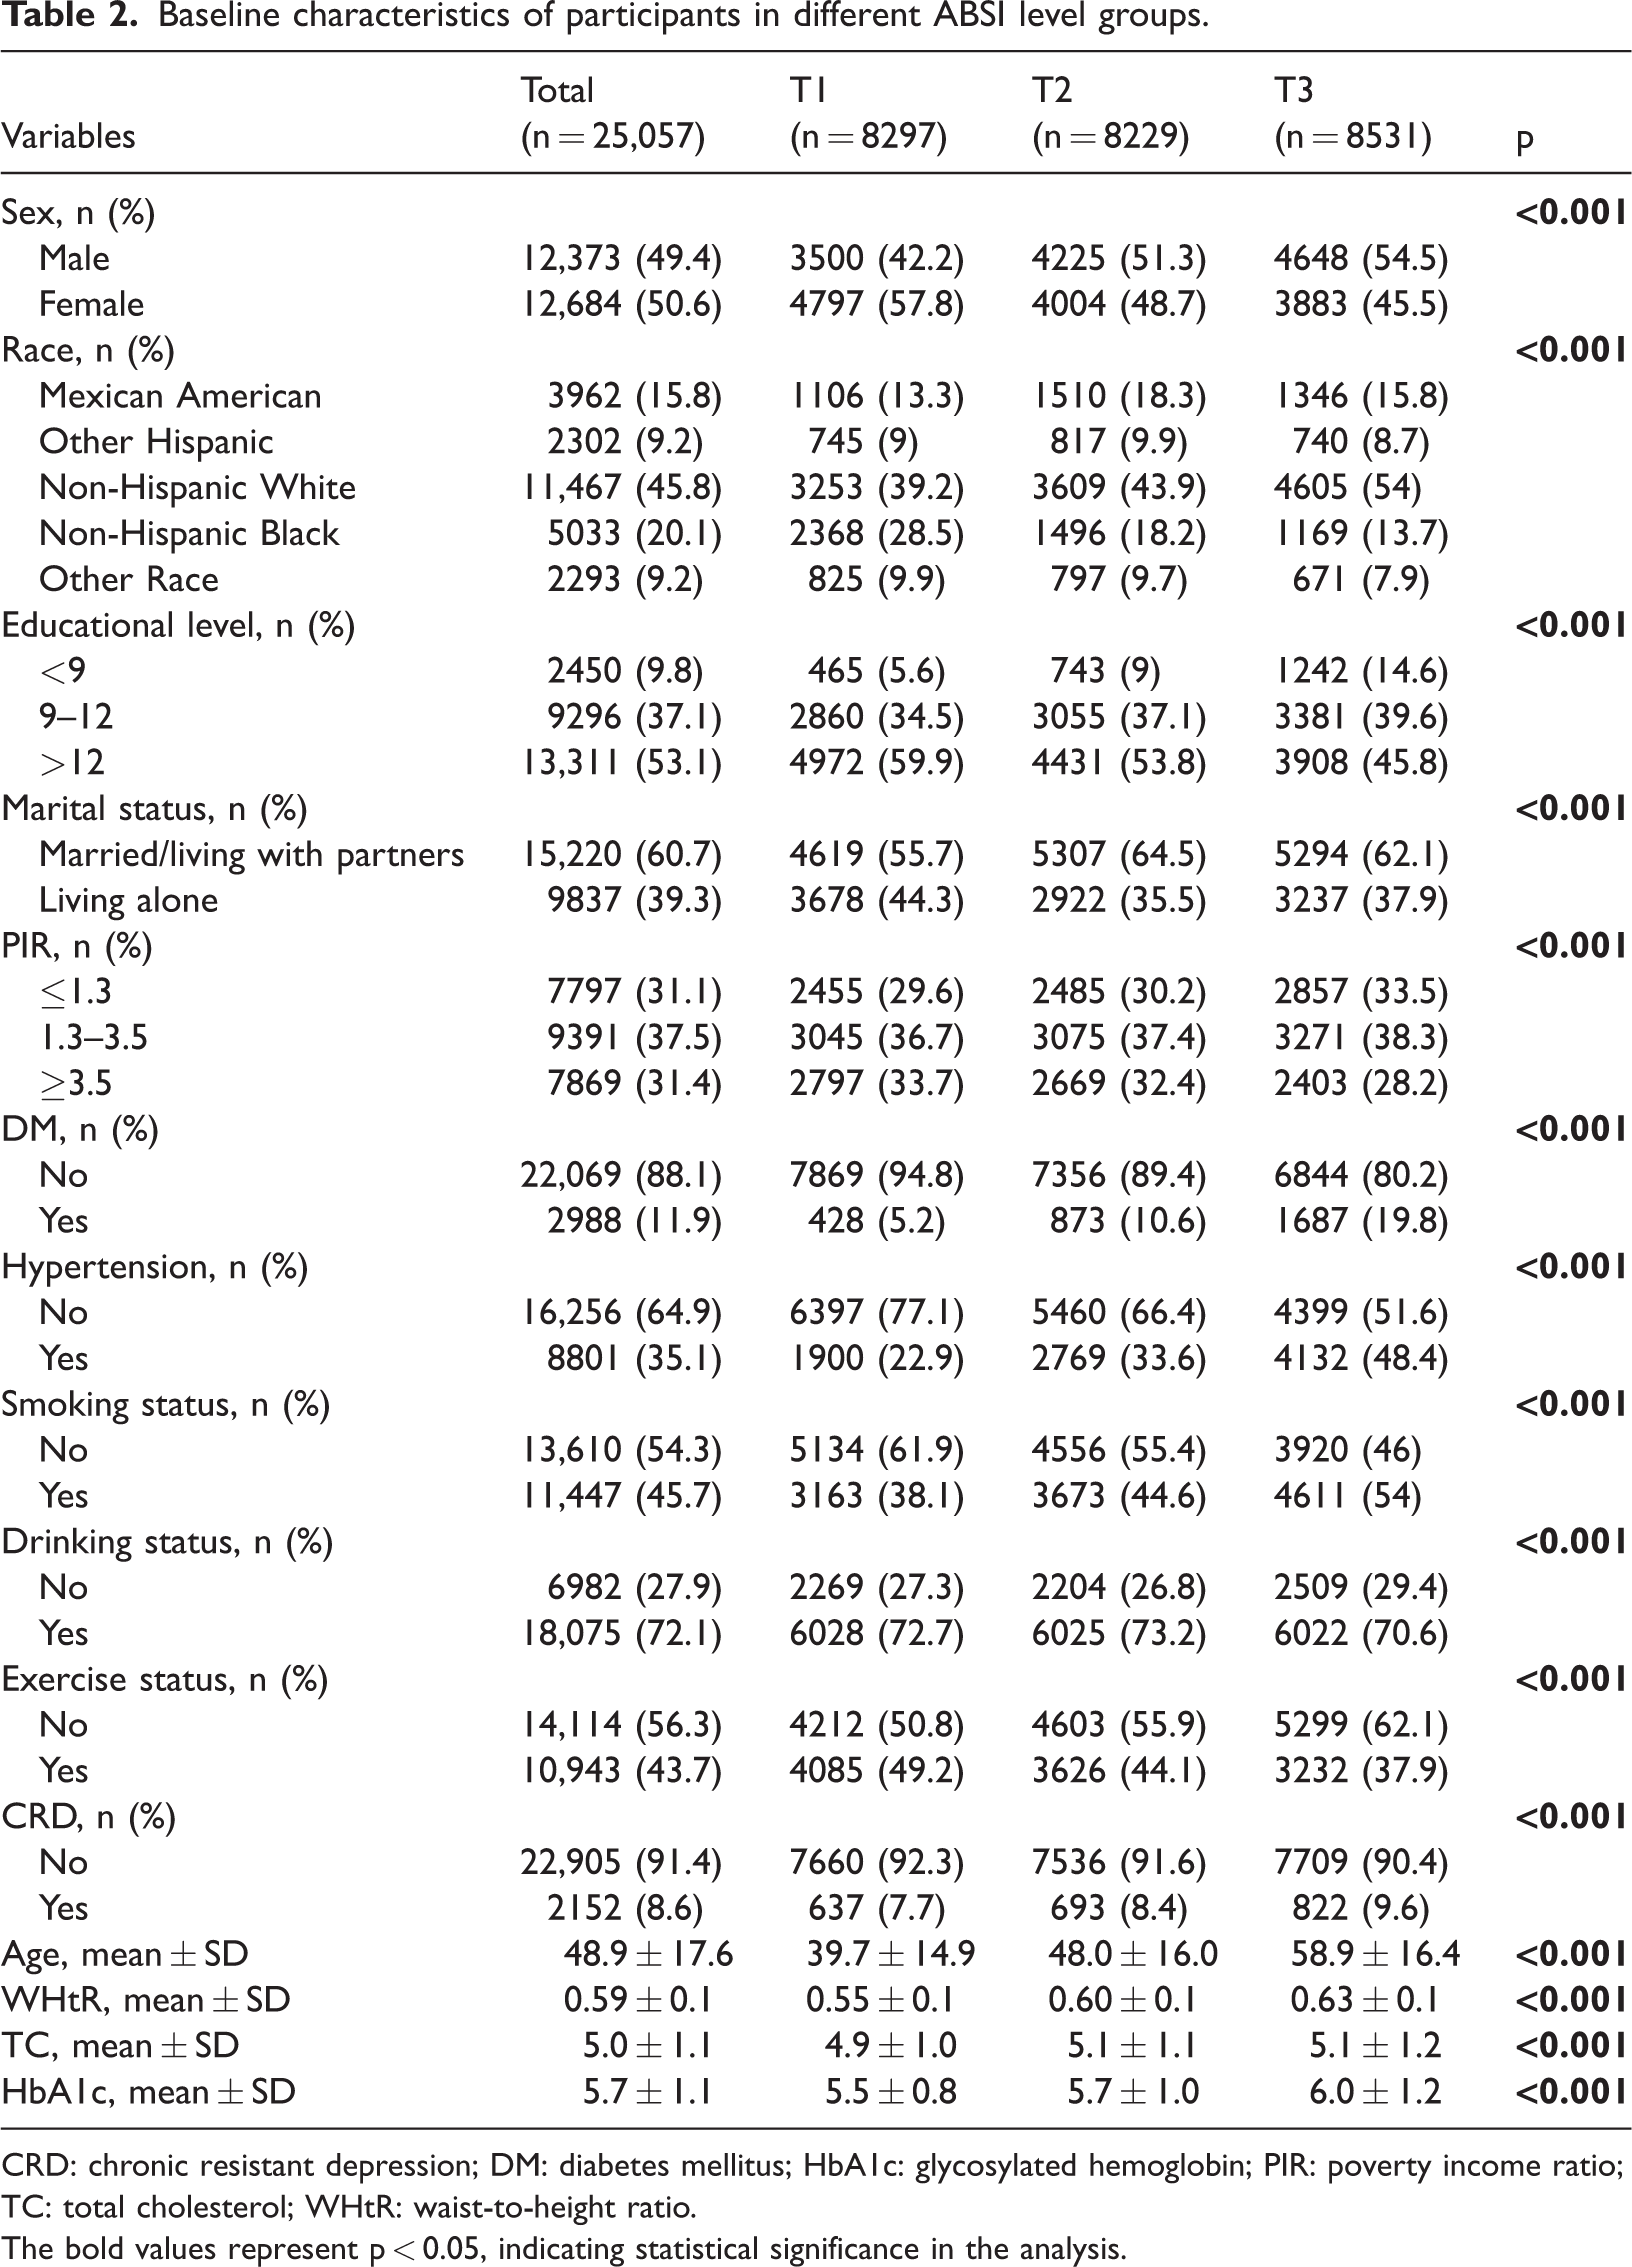
CRD: chronic resistant depression; DM: diabetes mellitus; HbA1c: glycosylated hemoglobin; PIR: poverty income ratio; TC: total cholesterol; WHtR: waist-to-height ratio.
The bold values represent p < 0.05, indicating statistical significance in the analysis.
Association between ABSI and sleep disorders
The incidence of sleep disorders was significantly higher in the T3 ABSI group (29.2%; 2489/8531) than in the T1 group (21.3%; 1771/8297; Table 3).
Logistic regression model for the impact of different ABSI levels on sleep disorders.
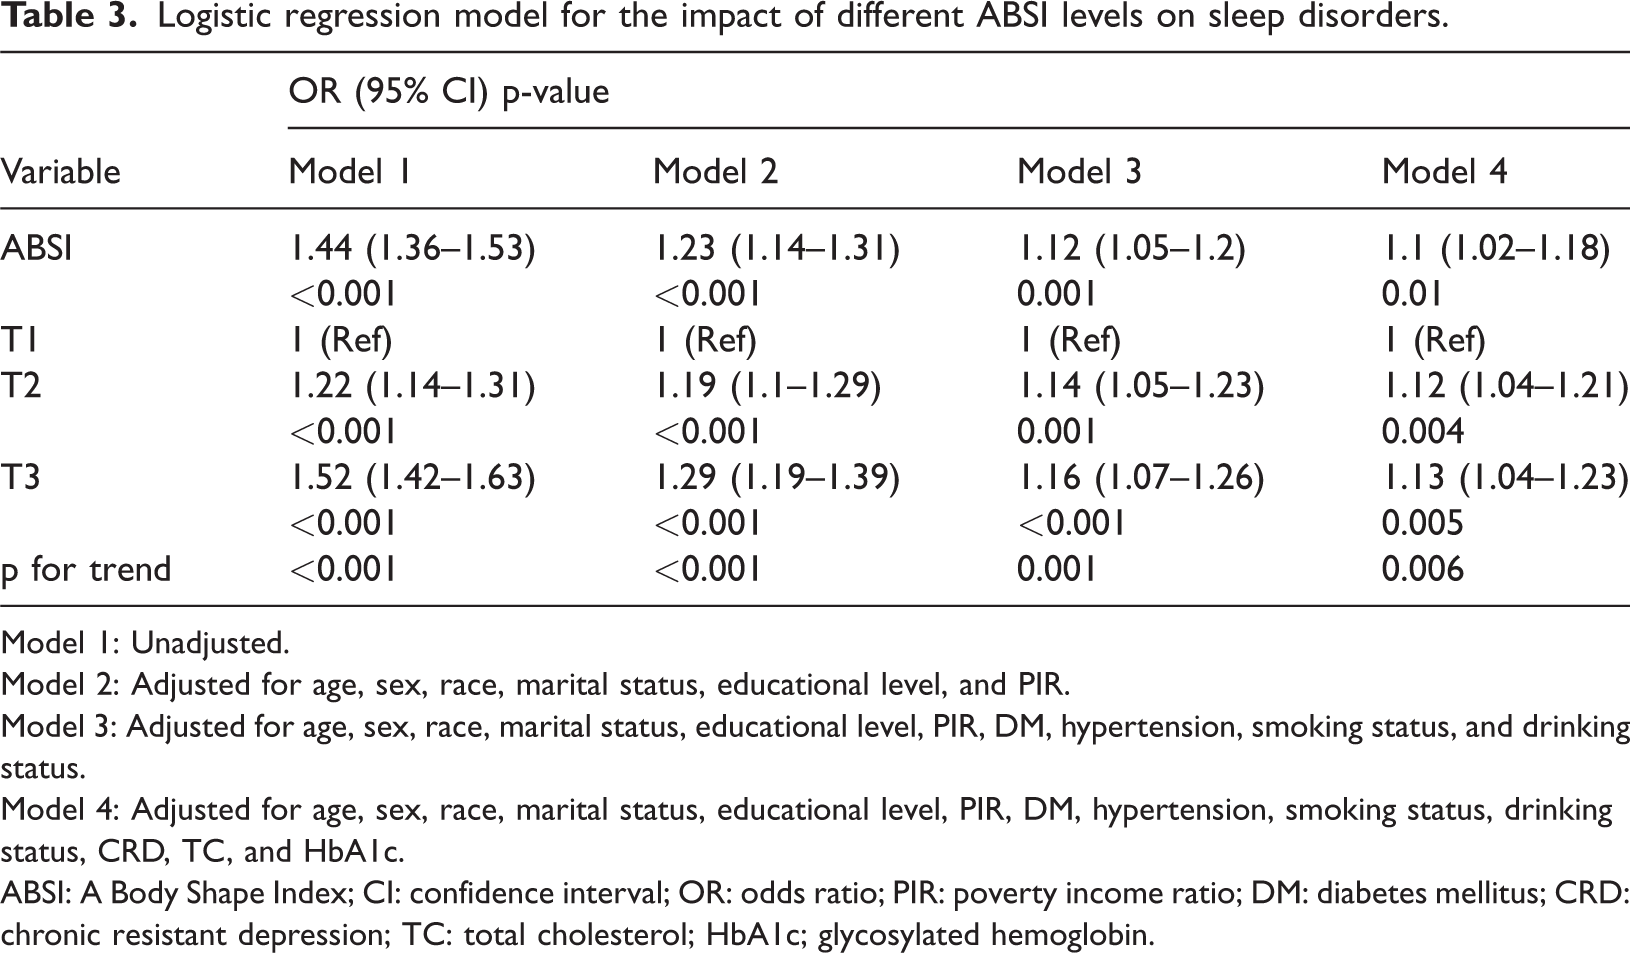
Model 1: Unadjusted.
Model 2: Adjusted for age, sex, race, marital status, educational level, and PIR.
Model 3: Adjusted for age, sex, race, marital status, educational level, PIR, DM, hypertension, smoking status, and drinking status.
Model 4: Adjusted for age, sex, race, marital status, educational level, PIR, DM, hypertension, smoking status, drinking status, CRD, TC, and HbA1c.
ABSI: A Body Shape Index; CI: confidence interval; OR: odds ratio; PIR: poverty income ratio; DM: diabetes mellitus; CRD: chronic resistant depression; TC: total cholesterol; HbA1c; glycosylated hemoglobin.
Across the four multivariate logistic regression models, a positive association between ABSI and sleep disorders was consistently observed. In the unadjusted continuous variable analysis, the OR for the association between ABSI and sleep disorders was 1.44 (95% CI: 1.36–1.53, p < 0.001). After adjusting for age, sex, race, educational level, marital status, and PIR in Model 2, the OR was 1.23 (95% CI: 1.14–1.31, p < 0.001). In the fully adjusted model, a positive association persisted, with an OR of 1.1 (95% CI: 1.02–1.18, p = 0.01), indicating that a unit increase in ABSI was associated with a 10% increase in the prevalence of sleep disorders. The conversion of ABSI into three-category variables for analysis further supported this finding. Tertile analysis demonstrated that the odds of sleep disorders in the T3 group were 1.13 times higher than those in the T1 group (OR = 1.13; 95% CI: 1.04–1.23, p < 0.005), further supporting an increasing trend in sleep disorder incidence with rising ABSI tertiles.
Nonlinear analysis of the association between continuous ABSI and sleep disorders
The smooth curve fitting results of Model 4 indicated a significant nonlinear association between ABSI and sleep disorders, with a distinct inflection point (p < 0.001; nonlinear p = 0.004; Figure 2). Threshold effect analysis revealed that the inflection point for ABSI was 8.46. Below this threshold, a significant positive association was observed between ABSI and sleep disorders (OR = 1.202; 95% CI: 1.072–1.348; p =0.0017; Table 4), suggesting that the ABSI was positively correlated with sleep disorders. However, beyond this threshold, the association was not statistically significant (OR = 1.015; 95% CI: 0.789–1.307; p = 0.9051).
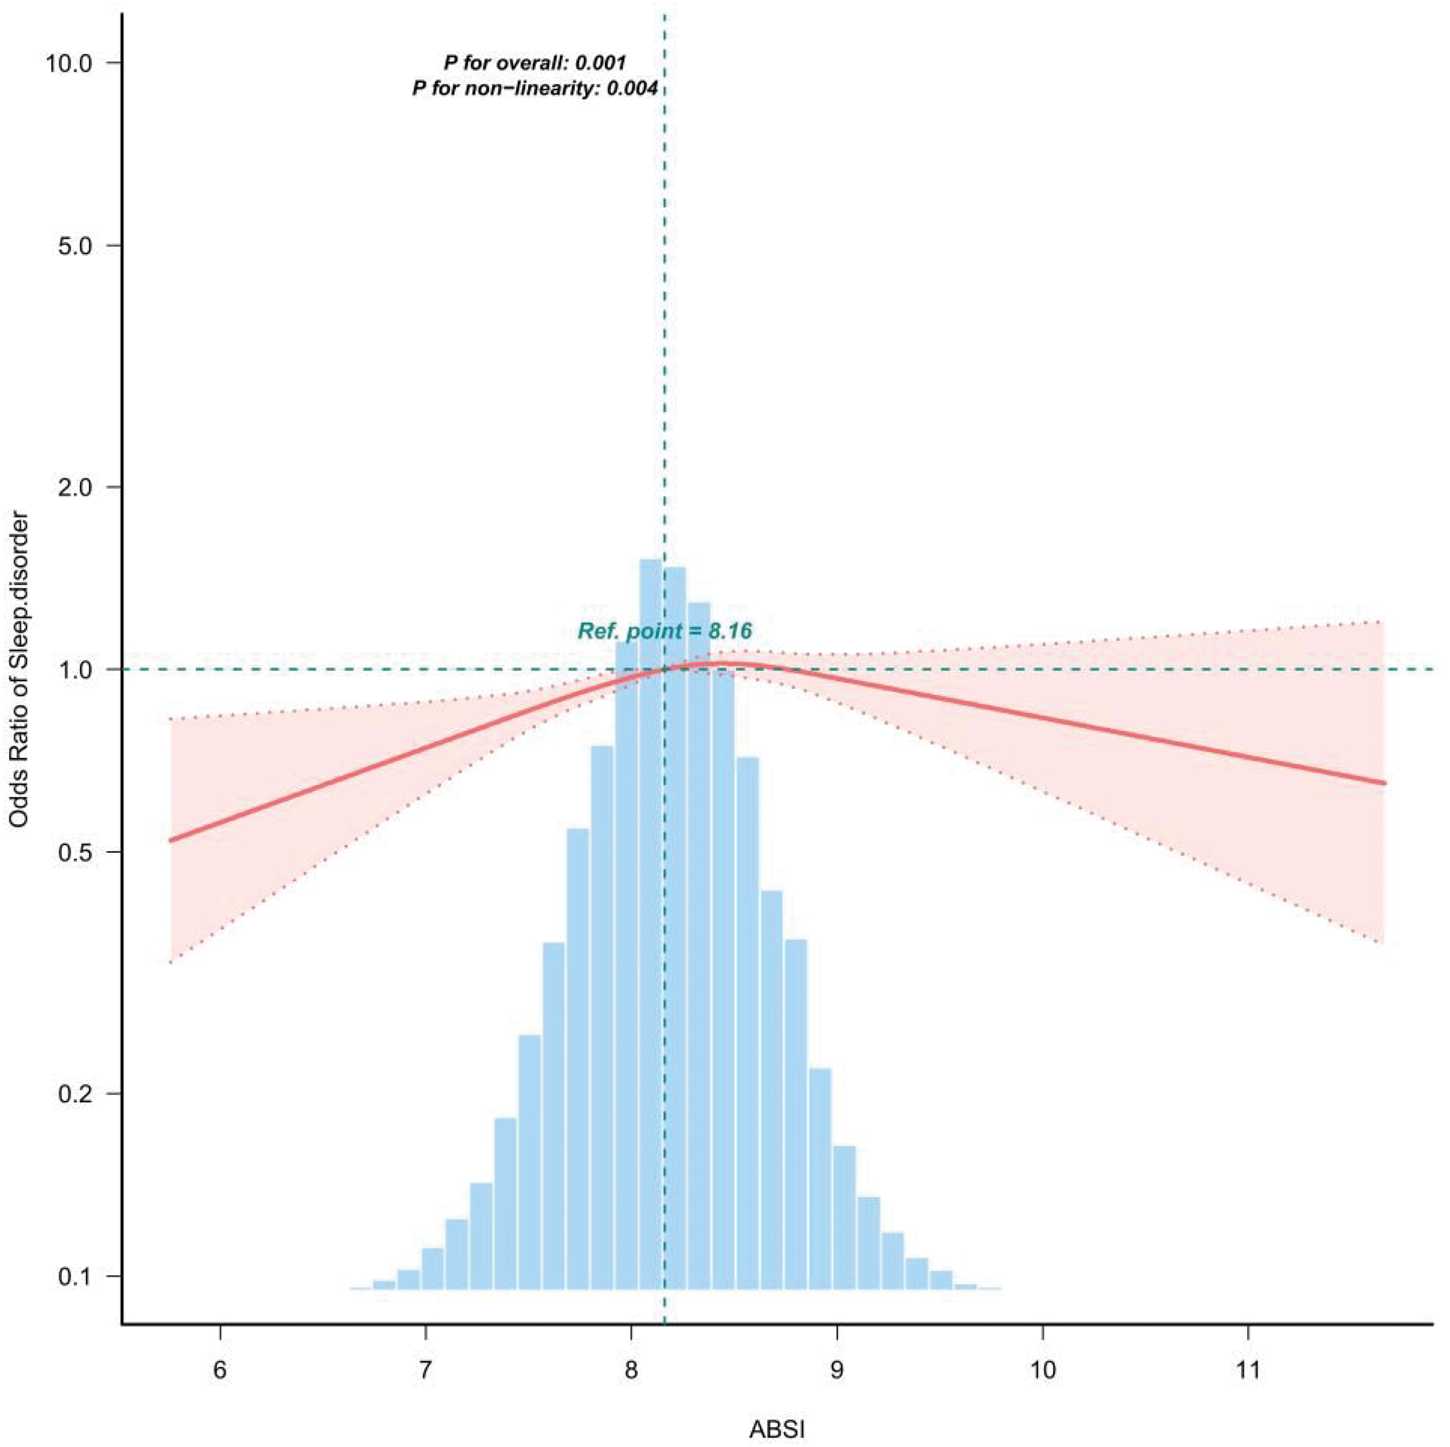
Nonlinear association between ABSI and the risk of sleep disorders based on the RCS model (Model 4). ABSI: A Body Shape Index.
Analysis of the threshold effect of ABSI on the odds of sleep disorder prevalence.

ABSI: A Body Shape Index; CI: confidence interval; OR: odds ratio.
Subgroup analysis
Subgroup analysis was performed to assess the robustness of the association between ABSI levels and the incidence of sleep disorders across different populations as well as to identify potential population differences. Participants were stratified by sex, age, CRD, smoking status, and drinking status. The results showed that ABSI was associated with the incidence of sleep disorders in the smoking subgroup (p = 0.003), with a significant interaction observed. However, differences across the other subgroups were not statistically significant (Figure 3), indicating that sex, age, CRD, and drinking status did not significantly modify the association between ABSI and sleep disorders.

Subgroup analysis of the correlation between ABSI and sleep disorders. ABSI: A Body Shape Index.
Discussion
This study utilized NHANES data from 2005 to 2016, with ABSI serving as an index of central obesity, and systematically evaluated the relationship between ABSI and sleep disorders among U.S. adults aged over 20 years. The results indicate a significant positive correlation between ABSI and the risk of developing sleep disorders. Our findings revealed that participants in the highest tertile of ABSI exhibited a greater likelihood of developing sleep disorders compared with those in the lowest tertile. This association remained robust even after extensive adjustment for potential confounding factors, indicating that abdominal obesity may exert a cumulative effect on the risk of sleep disorders. The RCS analysis revealed a nonlinear relationship between ABSI levels and sleep disorders. Furthermore, analysis on both sides of the inflection point (ABSI = 8.46) revealed a significant association between ABSI and sleep disorder prevalence on the left side, with the odds of sleep disorders increasing as ABSI rose. In contrast, no statistically significant association was observed on the right side. Subgroup analysis was performed to explore the robustness of this association, and the results demonstrated that ABSI had an impact on sleep disorders in the smoking subgroup, providing a reference for the prevention of sleep disorders in specific populations.
The prevalence of sleep disorders has shown a significant upward trajectory. Sleep disorders are characterized by a complex pathogenesis, and elucidating their risk factors is essential for developing effective prevention and treatment strategies. Leptin and adiponectin, two key hormones secreted by adipose tissue, play pivotal roles in regulating energy metabolism, appetite, and inflammatory responses. 24 In individuals with obesity, leptin resistance is commonly observed. Although circulating leptin levels are elevated, the body exhibits reduced sensitivity to its signaling. This diminished responsiveness results in ineffective appetite suppression, decreased energy expenditure, disruption of hypothalamic neural circuitry, and consequent disturbances in normal sleep–wake regulation. 25 Adiponectin, an anti-inflammatory hormone that regulates glucose metabolism and fatty acid oxidation, 26 is typically lower in individuals with obesity, which exacerbates the chronic inflammatory state. Reduced adiponectin levels have been shown to be closely associated with decreased deep sleep and the development of sleep disorders. Lower adiponectin levels further exacerbate chronic inflammation, which is closely related to sleep regulation and positively correlated with sleep disturbances. 27 Inflammatory factors, such as tumor necrosis factor alpha (TNF-α) and interleukin-6 (IL-6), can traverse the blood–brain barrier and affect the central nervous system, thereby disrupting sleep patterns. 28
Another potential mechanism linking obesity to sleep disorders is OSA, 29 which is a prevalent sleep-related breathing disorder. Pathologically, during sleep, the upper airway undergoes recurrent partial or complete collapse. This results in intermittent apnea or hypopnea, subsequently leading to intermittent hemoglobin oxygen desaturation. The pathological consequences of this phenomenon include insufficient blood oxygen levels, hypercapnia, disrupted sleep architecture, and repeated nocturnal awakenings.30–32 With an increase in the BMI, excessive adipose tissue further exacerbates the narrowing of the upper airway, thereby increasing the risk of OSA. 33 Obesity and sleep disorders exhibit a mutual association; hence, disrupted or restless sleep can further contribute to the accumulation of body fat. 34
Research has demonstrated a significant correlation between obesity and sleep disorders, 35 with visceral fat exhibiting an even stronger association with these conditions. 36 Previous research frequently relied on conventional indicators such as WC and BMI to assess obesity. However, BMI does not account for variations in fat distribution, thereby exhibiting a limited ability to accurately reflect the health risks associated with central obesity. 37 Although BMI is associated with sleep duration and quality, most studies indicate that these associations are relatively weak compared with those observed when central obesity measures are used. 38 Although computed tomography and magnetic resonance imaging (MRI) can accurately assess visceral fat distribution, their high costs and time-consuming nature have limited their widespread application in large-scale epidemiological studies. 39 To address this, researchers have developed a novel indicator, ABSI. Unlike traditional anthropometric measures, ABSI does not depend on metrics including height, BMI, or WC and provides a more accurate representation of visceral fat, offering a more effective reflection of the associated metabolic risk factors. In recent years, ABSI has gained recognition as a valuable tool for quantifying visceral fat, thereby increasing its adoption within healthcare settings.40,41 It helps clinicians more accurately identify patients who most urgently require further professional sleep evaluation. The application of ABSI in healthcare has rapidly gained popularity, but it must be combined with symptom assessment and objective sleep monitoring to achieve precise screening and management of sleep disorders. Liang et al. 42 conducted research among elderly Chinese population and revealed that central obesity indicators such as WC and visceral fat are significantly associated with reduced sleep quality. This further underscores the importance of using more specific fat distribution parameters to understand the mechanisms by which sleep disorders affect diverse populations.
Notably, research on the relationship between ABSI and sleep disorders remains scarce. Therefore, in this study, we employed ABSI as a measure of central obesity and systematically evaluated the association between ABSI and sleep disorders within the U.S. population. This study aimed to provide a more in-depth understanding of the relationship between fat distribution and sleep outcomes.
The results indicated a connection between ABSI and sleep disorders, thereby supporting the hypothesis that central obesity may be a risk factor for these conditions. To comprehensively investigate the relationship between ABSI and sleep disorders, we systematically reviewed previous studies. The findings suggest that the prevalence of sleep disorders is higher in females than in males. Notably, insomnia is the most common type of sleep disorder and exhibits significant sex differences. Due to differences in sex hormone levels, the prevalence of insomnia in females is 1.6 times higher than that in males and increases with age.43–45 During the perimenopausal transition, endogenous estrogen and progesterone levels undergo significant fluctuations and ultimately decline to persistently low levels, leading to sleep structure disorders, which are reported as “difficulty sleeping” and “sleep disorders”—frequently reported as the most common symptoms in menopausal women. 46 Furthermore, older adults exhibit a higher susceptibility to sleep disorders. Nevertheless, this phenomenon is considered a normal component of the aging process. As individuals age, there is a natural reduction in sleep duration and a decline in sleep quality. Physiological mechanisms in older adults gradually decline, making them more susceptible to disturbance by auditory stimuli during sleep, often characterized by difficulty falling back asleep. This ultimately leads to fragmented sleep patterns. Additionally, the suprachiasmatic nucleus, which plays a crucial role in regulating circadian rhythm, undergoes significant changes in older adults. 47 Moreover, age-related changes in the upper airway may exacerbate airway collapse during sleep, thereby increasing susceptibility to sleep disorders. 48
Subgroup analysis indicated demographic disparities in the relationship between ABSI and sleep outcomes. Compared with nonsmokers, smokers exhibited a more pronounced correlation between ABSI and sleep disorders. This phenomenon may be attributable to several factors. First, nicotine in cigarettes stimulates the central nervous system, increasing the frequency of nocturnal awakenings and causing sleep disturbances associated with withdrawal symptoms. Additionally, smokers typically have lower levels of melatonin, which is essential for regulating the sleep–wake cycle; reduced melatonin levels in smokers can further disrupt this cycle. 49
This study presents several notable strengths. To the best of our knowledge, it is the first to identify the association between ABSI and the prevalence of sleep disorders in the U.S. population, offering novel and potentially impactful indicators for the diagnosis and evaluation of sleep disorders. Moreover, compared with conventional anthropometric measures, ABSI demonstrates greater sensitivity in reflecting visceral fat accumulation, rendering it particularly valuable for cost-effective clinical screening. Furthermore, the study leveraged NHANES data spanning from 2005 to 2016, ensuring a substantial sample size and extended temporal coverage. Finally, we used multiple modeling approaches and subgroup analyses, involving controlling for a range of confounding variables, and the results still exhibited a robust positive association between ABSI and sleep disorders, thereby enhancing the reliability of the findings.
Despite these strengths, several limitations must be acknowledged. First, due to the cross-sectional nature of the study design, it is difficult to establish causal inferences regarding the relationship between ABSI and sleep disorders. Second, the diagnosis of sleep disorders was based entirely on self-reports, which may introduce recall bias and lack the precision of objective diagnostic methods. Third, the NHANES data may introduce potential selection bias due to the survey sampling design, thereby limiting the generalizability of the findings to the broader U.S. population. Moreover, because the study sample was restricted to a specific country and ethnic group, the generalizability of the conclusions to other populations requires further validation. Fourth, several potential confounding factors—such as dietary habits and occupational status—that may influence both central obesity and sleep health were not included in the analysis. Although ABSI exhibits a greater ability to predict abdominal fat compared with other indicators, it does not directly quantify central obesity. The specific physiological mechanisms underlying this remain to be further explored. In view of these limitations, future studies should adopt longitudinal designs, use validated sleep assessment tools, and comprehensively control for confounding variables to enhance the reliability of the conclusions.
Conclusion
For the first time, we explored the relationship between ABSI and sleep disorders based on NHANES data, revealing a potential association between obesity and sleep-related health problems. Our findings indicate a significant positive correlation between ABSI and sleep disorders, which may be helpful for the prevention and management of related conditions. Future research should employ longitudinal designs, utilize validated sleep assessment tools, and thoroughly consider confounding variables to strengthen the robustness of these findings.
Footnotes
Acknowledgment
We would like to thank all participants in this study.
Author contributions
Anhao Liu and Yuanqing Li: Conceptualization, data curation, formal analysis, writing–original draft, writing–review & editing; Xuehui Zhang, Ningkang Lv, and Hong Lian Yang: Data collection, writing–review & editing; Cuiping Hao and Dongmei Wu: Reviewed the manuscript.
Clinical trial number
Not applicable.
Consent for publication
Not applicable. No identifiable personal data or images are presented in this study.
Competing interests
The authors declare no competing interests.
Data availability statement
Declaration of conflicting interests
The authors declare that they have no known competing financial interests or personal relationships that could have appeared to influence the work reported in this paper.
Ethical declaration
This research involving human participants was approved by the Research Ethics Review Committee of the NCHS. The study was conducted in full compliance with applicable local legislation and institutional guidelines. All participants provided written informed consent prior to their participation in the study.
Funding
The authors declare that no financial support was received for the research, authorship, and/or publication of this article.