
Abstract
Background
The role of the C-reactive protein–albumin–lymphocyte (CALLY) index in predicting cardiovascular disease prognosis, particularly in the broader population, remains inadequately studied.
Methods
Data from 22,848 adults, collected between 1999 and 2010, were analyzed in this study. The association between the CALLY index and cardiovascular disease prevalence and mortality was examined using multivariate logistic regression and Cox proportional hazards models. Restricted cubic spline, Kaplan–Meier survival curves, time-dependent receiver operating characteristic curves, and subgroup and interaction tests were employed.
Results
Following adjustment for all covariates, a 1-unit rise in the ln CALLY index was correlated with an 11% reduction in cardiovascular disease prevalence (odds ratio = 0.89, 95% confidence interval: 0.85, 0.93) and a 15% decrease in the risk of cardiovascular disease mortality (hazard ratio = 0.85, 95% confidence interval: 0.81, 0.89). Compared with the lowest quartile, patients in the highest quartile of the ln CALLY index exhibited a 33% lower prevalence of cardiovascular disease (odds ratio = 0.67, 95% confidence interval: 0.57, 0.79) and a 39% reduced risk of cardiovascular disease mortality (hazard ratio = 0.61, 95% confidence interval: 0.50, 0.74). The time-dependent receiver operating characteristic curve showed that the ln CALLY index predicted the 1-year cardiovascular disease mortality with an area under the curve of 0.819 (95% confidence interval: 0.753, 0.885).
Conclusions
The CALLY index was significantly inversely associated with cardiovascular disease prevalence and mortality and provided reliable discriminatory capacity in predicting early mortality attributable to cardiovascular disease.
Keywords
Introduction
Cardiovascular diseases (CVDs) remain a major cause of mortality worldwide, contributing to a heavy burden on both public health and medical services.1,2 The prevalence of CVD and its mortality have substantially increased in recent decades. Globally, the number of individuals living with CVD has increased from 271 million to 523 million from 1990 to 2019, while the number of CVD-related deaths has grown from 11 million to 19.4 million, accounting for 28.6% of all global deaths.3–5 Despite the implementation of strategies aimed at managing relevant risk factors, the CVD burden continues to rise. This highlights the pressing need to identify and examine risk factors for CVD at an early stage to reduce both CVD incidence and mortality.
Over the past few years, noninvasive biomarkers for prognosis, obtained through standardized tests, have gained significant attention. The association of C-reactive protein (CRP), albumin, and lymphocytes with CVD is well-documented. Several studies have highlighted that higher CRP and lower albumin levels contribute to a higher risk of both the onset and mortality of CVD.6–9 Additionally, lymphocytes play a crucial role in driving the inflammatory processes underlying atherosclerosis, and their significance in the pathogenesis of CVD is increasingly being recognized. 10 In a recent study, Iida et al. introduced and validated a novel biomarker, the C-reactive protein–albumin–lymphocyte (CALLY) index, demonstrating its potential as a predictive tool for prognosis in patients who have undergone liver resection for hepatocellular carcinoma. 11 The CALLY index, which integrates CRP and albumin levels as well as lymphocyte counts, has demonstrated strong associations with sarcopenia, cardiorenal syndrome, and the prognosis of various cancers.12–17 The CALLY index has been found to be a more powerful predictor of colorectal cancer (CRC) compared with other indices that have been widely used to predict prognosis. 18 To date, prospective studies specifically validating its reliability for cardiovascular outcomes are lacking, necessitating large-scale population assessments to establish a basis for future trials. However, no studies have examined the link between the CALLY index and CVD prevalence and mortality in adults living in the United States.
Utilizing the National Health and Nutrition Examination Survey (NHANES) data, we retrospectively examined the influence of the CALLY index on the prevalence and mortality of CVD. This study sought to address the existing research gap and offer new insights for early risk screening and prognostic evaluation of CVD.
Materials and methods
Data source
This retrospective study analyzed publicly available data from the NHANES, a nationwide survey managed by the US Centers for Disease Control and Prevention (CDC) through its National Center for Health Statistics (NCHS). 19 The sampling process of the NHANES is based on a complex, multi-stage random technique that ensures that the sample mirrors the diversity of the US population. Participants underwent extensive physical examinations, completed detailed health and nutrition questionnaires, and provided biological samples for laboratory testing.
Study population
This research draws on data from six NHANES cycles, each lasting 2 years between 1999 and 2010, and includes 62,160 participants. During screening, we excluded 29,696 participants who were aged <20 years, 47 who did not have survival data, 4194 with missing information on the CALLY index and CVD, and 5375 with incomplete covariate data. The final analyses included 22,848 participants who met the eligibility criteria. Figure 1 provides a visual representation of the participant selection process.

Flow chart representing the participant selection process.
Diagnosis of CVD and mortality status
CVD was diagnosed based on a standardized health status questionnaire completed by participants during a personal interview. This included a self-reported physician diagnosis. Participants were asked, “Have you ever been told by a doctor or other healthcare professional that you have congestive heart failure, coronary heart disease, angina pectoris, myocardial infarction?” Those who answered “yes” were classified as having CVD. Diagnoses of heart failure, myocardial infarction, angina, and coronary heart disease were confirmed using the relevant self-reported items in the survey.
Mortality information was linked with the NHANES data through the National Death Index (NDI). The follow-up duration extended from the NHANES examination until death or 31 December 2019, whichever occurred first. Deaths were classified based on the International Classification of Diseases, 10th Revision (ICD-10) system. Cardiovascular deaths were defined as heart disease-related deaths, using ICD-10 codes I00-I09, I11, I13, and I20-I51. 20
Calculation of the CALLY index
The CALLY index was calculated by multiplying the lymphocyte count (109/L) by the albumin concentration (g/dL), followed by division with 10 times the CRP value (mg/dL). 21 Lymphocyte counts were measured using the UniCel DxH 800 analyzer, CRP levels were assessed using the Beckman UniCel platform, and albumin concentrations were determined through the DcX800 procedure.
Assessment of covariates
Covariates were defined as factors reported to be associated with the outcomes in previous studies; these included sociodemographic characteristics, lifestyle behaviors, and health conditions. Sociodemographic data, including sex, age, race, marital status, educational level, poverty-to-income ratio (PIR), smoking and alcohol consumption habits, and history of hypertension and diabetes, were collected via household interviews. Body mass index (BMI) was measured at the mobile examination center. Laboratory markers included serum alanine aminotransferase (ALT) and serum creatinine (SCr). Smoking status, alcohol consumption, hypertension status, and diabetes diagnoses were defined according to the relevant questionnaire items (SMQ020, ALQ101, DIQ010, and BPQ020).
Statistical analyses
Given the skewed distribution of the CALLY index, a natural logarithmic transformation (ln CALLY) was performed, and the variable was modeled in both continuous and categorical forms. To adequately address the survey’s complex design and achieve representative estimates, the analyses incorporated sampling weights (WTMEC2YR), stratification factors (SDMVSTRA), and clustering variables (SDMVPSU).
During the participant profiling phase, we evaluated demographic characteristics according to the quartiles of ln CALLY. For all continuous variables, data are presented as mean ± standard deviation (SD), while for all categorical variables, they are expressed as frequencies or percentages. To assess significant differences between groups, we conducted the weighted chi-square test and weighted rank sum test.
Multivariate logistic regression was employed to evaluate the relationship between ln CALLY and CVD, with findings expressed as odds ratios (ORs) and 95% confidence intervals (CIs). The impact of ln CALLY on cardiovascular mortality was assessed through Cox proportional hazards regression, and hazard ratios (HRs) with 95% CI were calculated. Within these models, ln CALLY was considered both as a continuous variable and by quartiles, with Q1 being the reference category. Model 1 was unadjusted; Model 2 was adjusted for sex, age, and race; and Model 3 additionally accounted for marital status, educational level, PIR, BMI, smoking status, alcohol consumption, diabetes, hypertension status, and ALT and SCr levels.
We conducted restricted cubic spline (RCS) analyses of ln CALLY at the 5th, 50th, and 95th percentiles, adjusting for potential confounders as specified in Model 3. Kaplan–Meier survival curves for CVD mortality were plotted based on the ln CALLY quartile classification. To determine the ability of the ln CALLY index to predict CVD mortality during different time points, we employed time-dependent receiver operating characteristic (ROC) analysis, resulting in time-dependent area under the curves (AUCs). The optimal cutoff value for the ln CALLY index was calculated using the Youden index derived from the 1-year ROC curve. In addition, we compared the AUC of the ln CALLY index with those of its individual components for predicting CVD mortality at 1-, 3-, and 5-year follow-up assessments.
Subgroup analyses were conducted across the categories of sex, age, race, marital status, educational level, PIR, BMI, smoking, alcohol use, diabetes, and hypertension; interaction tests were additionally performed.
Data analyses and statistical evaluations were conducted using R Studio software. A p-value <0.05 was considered statistically significant.
Results
Basic characteristics of participants according to quartiles of the ln CALLY index
In total, 22,848 participants, representing approximately 160,279,973 US adults, were included in this study. Table 1 details the baseline profile of the cohort. The mean participant age was 49.16 ± 18.27 years, with men comprising 48.6% and women comprising 51.4% of the population. Furthermore, 73.1% of the participants were of non-Hispanic White ethnicity. The mean ln CALLY index value was 1.40 ± 1.33; CVD prevalence reached 6.4% (1884 participants), and the mortality rate attributable to CVD was 3.5% (1059 participants). In the highest quartile of the ln CALLY index, participants displayed the following characteristics, as opposed to those in the lowest quartile: male sex, age <60 years, unmarried status, higher educational level, higher income, and better weight management. In terms of lifestyle habits, those in the higher quartiles of the ln CALLY index had a lower prevalence of smoking but higher prevalence of alcohol consumption. Additionally, this group demonstrated lower rates of hypertension, diabetes, and CVD, with fewer CVD-related deaths.
Baseline characteristics of participants.

Continuous variables were showed as mean ± SD, categorical variables were showed as frequency (percentage).
PIR: poverty-to-income ratio; BMI: body mass index; CHF: congestive heart failure; CHD: coronary heart disease; AP: angina pectoris; MI: myocardial infarction; CVD: cardiovascular disease; ALT: alanine aminotransferase; SCr: serum creatinine; Q1: quartile 1; Q2: quartile 2; Q3: quartile 3; Q4: quartile 4; GED: general educational development.
Association of the ln CALLY index with CVD and CVD mortality
The findings of the multiple logistic regression models investigating the connection between ln CALLY and CVD are presented in Table 2. Higher ln CALLY index values were negatively correlated with CVD prevalence. In both Model 1 and Model 2, negative correlations were observed between the ln CALLY index (treated as a continuous variable) and CVD risk, with the relationship maintaining statistical significance in the fully adjusted model (OR = 0.89, 95% CI: 0.85, 0.93). Results indicate that every 1-unit increase in the ln CALLY index corresponded to an 11% lower CVD prevalence. When the ln CALLY index values were categorized into quartiles, with Q1 as the reference group, the Q4 group continued to show a negative association in the fully adjusted model. Specifically, the likelihood of developing CVD was 33% lower in the Q4 group than in the Q1 group (OR = 0.67, 95% CI: 0.57, 0.79, p for trend <0.001).
Association between the ln CALLY index and CVD mortality.

Model 1: Unadjusted.
Model 2: Adjusted for sex, age, and race.
Model 3: Adjusted for sex, age, race, marital status, educational level, PIR, BMI, smoking, alcohol use, diabetes, hypertension, ALT, and SCr.
ln CALLY index: natural logarithm of the C-reactive protein–albumin–lymphocyte index; CVD: cardiovascular disease; PIR: poverty-to-income ratio; BMI: body mass index; ALT: alanine aminotransferase; SCr: serum creatinine; OR: odds ratio; CI: confidence interval.
To explore the independent link between the ln CALLY index and CVD mortality, three Cox regression models were built. The results revealed a negative correlation between the ln CALLY index values and CVD mortality (Table 3). In the unadjusted model, the HR was 0.80 (95% CI: 0.76, 0.83). After adjusting for covariates, the HR and 95% CI were 0.83 (0.80, 0.88) in Model 2 and 0.85 (0.81, 0.89) in the fully adjusted Model 3, with all p-values <0.001. These results suggest a consistent inverse relationship between the ln CALLY index and CVD mortality across all models. Higher ln CALLY index values in the Q4 group were linked to a 39% decrease in CVD mortality risk compared with that in the Q1 group (HR = 0.61, 95% CI: 0.50, 0.74, p for trend <0.001).
Association between the ln CALLY index and CVD mortality.
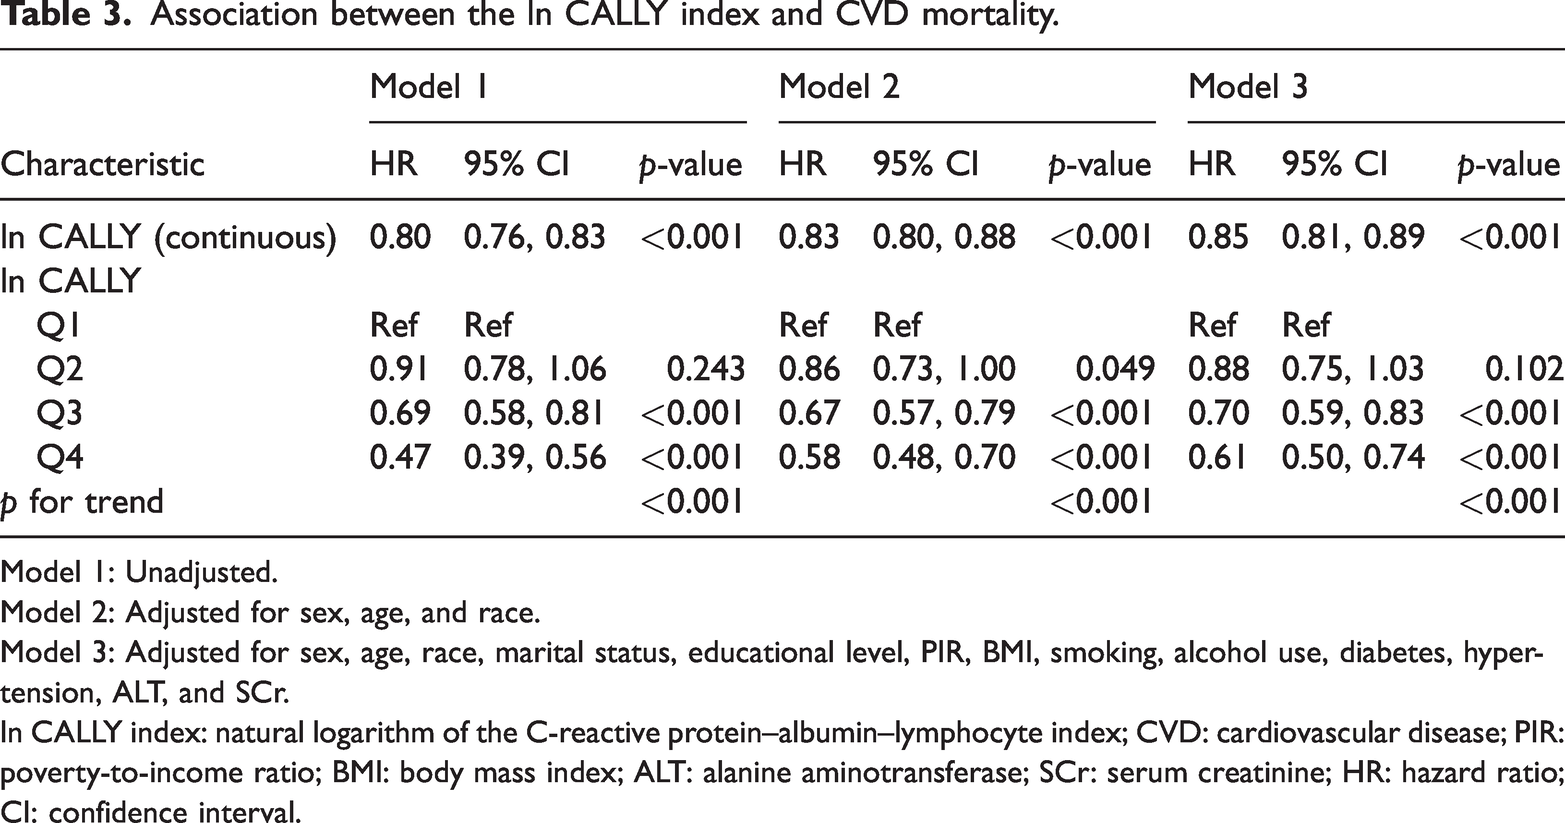
Model 1: Unadjusted.
Model 2: Adjusted for sex, age, and race.
Model 3: Adjusted for sex, age, race, marital status, educational level, PIR, BMI, smoking, alcohol use, diabetes, hypertension, ALT, and SCr.
ln CALLY index: natural logarithm of the C-reactive protein–albumin–lymphocyte index; CVD: cardiovascular disease; PIR: poverty-to-income ratio; BMI: body mass index; ALT: alanine aminotransferase; SCr: serum creatinine; HR: hazard ratio; CI: confidence interval.
Figure 2 illustrates the relationship between the ln CALLY index and multiple cardiovascular outcomes, including CVD mortality, overall CVD prevalence, congestive heart failure, coronary heart disease, angina pectoris, and myocardial infarction—modeled with the RCS function. After adjustment for all covariates in Model 3, the ln CALLY index showed a significant linear inverse association with each outcome (p-overall <0.05, p-nonlinear >0.05).
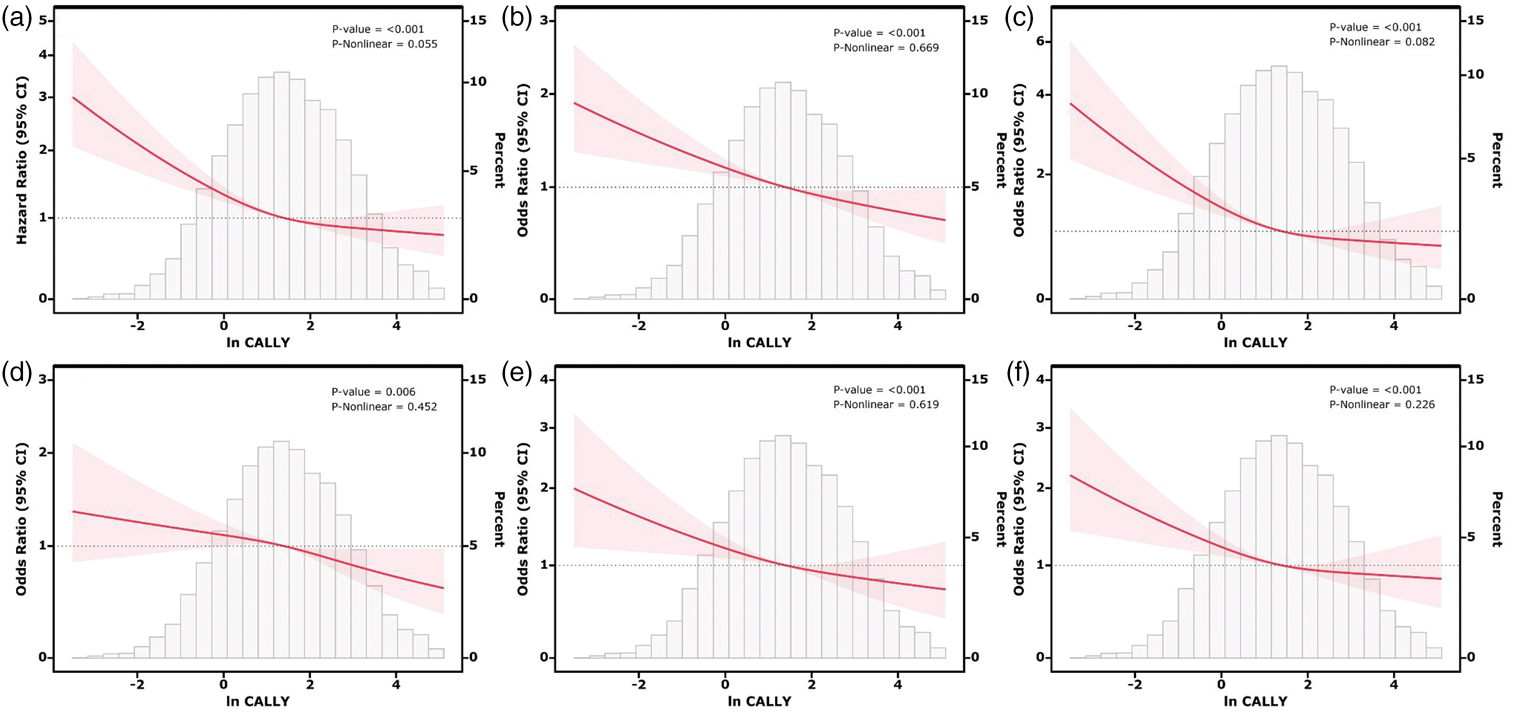
Associations between the ln CALLY index and CVD mortality. (a) CVD, (b) congestive heart failure, (c) coronary heart disease, (d) angina pectoris, (e) and myocardial infarction (f) were evaluated using RCS after adjustment for covariables. ln CALLY index: natural logarithm of the C-reactive protein–albumin–lymphocyte index; CVD: cardiovascular disease; RCS: restricted cubic spline.
Additionally, we performed Kaplan–Meier survival analysis to evaluate CVD mortality across the quartiles of the ln CALLY index (Figure 3). Survival analyses showed that the Q4 group had a significantly better long-term survival rate (p-log rank <0.001).

Kaplan–Meier survival analysis plot for CVD mortality stratified by quartiles of the ln CALLY index. CVD: cardiovascular disease; ln CALLY index: natural logarithm of the C-reactive protein–albumin–lymphocyte index.
The predictive ability of the ln CALLY index for CVD mortality
In predicting CVD mortality, the ln CALLY index yielded AUC values of 0.819, 0.685, and 0.637 at 1, 3, and 5 years, respectively, in time-dependent ROC analysis (Figure 4). To further facilitate clinical application, we calculated the optimal cutoff value for the ln CALLY index using the Youden index derived from the 1-year ROC curve. The optimal cutoff was determined to be 0.097, with a sensitivity of 61.48% and specificity of 83.74%. These results highlight the ln CALLY index as a stable and robust predictor of both short- and long-term CVD mortality. We also compared the predictive accuracy of the ln CALLY index with its individual components (Supplementary Figure 1). The ln CALLY index consistently demonstrated higher AUC values than CRP, albumin, or lymphocyte count alone across all follow-up periods.

Time-dependent ROC curves (a) and time-dependent AUC values (b) of the ln CALLY index for predicting CVD mortality. ROC: receiver operating characteristic; AUC: area under the curve; ln CALLY index: natural logarithm of the C-reactive protein–albumin–lymphocyte index; CVD: cardiovascular disease.
Subgroup analysis
As depicted in Figure 5, the association between the ln CALLY index and outcomes remained uniform across all subgroups, further confirming the stability of this relationship across different population strata.

Subgroup analysis of the association between the ln CALLY index and CVD mortality. ln CALLY index: natural logarithm of the C-reactive protein–albumin–lymphocyte index; CVD: cardiovascular disease.
Discussion
This study represents the first comprehensive analysis of how the CALLY index relates to CVD prevalence and mortality in adults residing in the U.S. This analyses of 22,848 participants revealed a distinct negative correlation between the CALLY index and CVD outcomes. Participants with higher CALLY index values demonstrated a reduced risk of cardiovascular mortality, as indicated by Kaplan–Meier survival curves. Furthermore, time-dependent ROC analyses demonstrated that the CALLY index showed strong predictive power for 1-, 3-, and 5-year CVD mortality. Subgroup analyses revealed that the relationship between the CALLY index and CVD mortality remained consistent across different strata, further supporting the robustness of this link. The results suggest that the CALLY index is a useful predictor of CVD mortality, offering a fresh perspective on survival risk assessment.
Early studies have established the CALLY index as a promising predictive marker for outcomes in several specific populations. In a retrospective analysis using the NHANES data, Zhu et al. assessed 3511 cancer patients and observed that a 1-unit increase in the ln CALLY index correlated with an 18% decrease in CVD mortality (HR = 0.82, 95% CI: 0.74, 0.90). 21 A study conducted in China involving 15,250 coronary artery disease (CAD) patients indicated that a low CALLY index was strongly linked to an elevated risk of major adverse cardiac events (MACEs) and a higher CVD mortality rate. 22 Similarly, a study by Luo’s team demonstrated that lower CALLY index values were linked to higher risks of both overall and heart-related deaths in older patients. 23 These findings are consistent with our results, with the key distinction being that our study was conducted on a broader general population, which further supports the general applicability of the CALLY index.
The intertwined roles of inflammation, nutrition, and immunity create a complex network in CVD development. During the acute inflammatory phase, CRP levels increase while albumin levels decrease. 24 CRP directly impacts vascular disease by activating complement pathways and playing a key role in plaque deposition.25,26 Albumin, the primary serum protein, is closely linked to both nutritional status and inflammation.27,28 Hypoalbuminemia is often associated with malnutrition, inflammation, and cachexia, which in turn exacerbate the inflammatory response, oxidative stress, platelet aggregation, and CVD progression.29,30 Studies have shown that an elevated CRP-to-albumin ratio (CAR) may increase the risk of poor CVD prognosis. 31 Additionally, the Glasgow Prognostic Score (GPS), based on CRP and albumin, has been strongly associated with CVD outcomes. 32 Lymphocytes are essential for immune system function, with dysfunctional T-lymphocytes, particularly the Th1 and Th17 subpopulations, driving CVD through interactions with other immune cells and endothelial cells.33,34 However, low lymphocyte levels often reflect an immunodeficient state and are generally linked to worse outcomes in CAD patients.35,36 Moreover, the Prognostic Nutritional Index (PNI), incorporating both lymphocyte count and albumin levels, has been shown to independently predict CVD mortality, especially in those with advanced heart failure and a low PNI. 37 Considering the strong relationship between CVD, inflammation, nutrition, and immunity, the CALLY index offers a clear advantage over other indices in assessing CVD. By integrating the CRP and albumin levels as well as lymphocyte count, it provides a comprehensive measure of these interconnected factors, which are critical in CVD pathogenesis. Using this holistic approach, the CALLY index reflects a more nuanced risk profile, potentially improving early detection, risk stratification, and prognosis in CVD patients.
Our results highlighted the consistent superiority of the CALLY index over its individual components. This observation underscores the value of a multidimensional approach. We acknowledge that some recent studies have questioned the added value of composite indices. For instance, Wändell et al. have reported that the CAR did not consistently outperform CRP alone in predicting cardiovascular mortality in certain cohorts.38,39 However, unlike simple ratios, the CALLY index incorporates lymphocyte count, thereby capturing the immuno-inflammatory-nutritional axis more comprehensively. Our findings suggest that in the U.S. general population, this holistic integration provides a robust prognostic advantage.
Notably, the results of the time-dependent ROC curves demonstrated that the CALLY index is valuable for early risk assessment in CVD patients, with a 1-year AUC of 0.819. This finding is consistent with a single-center study conducted by Ji’s team, which reported an AUC of 0.815 for the CALLY index in predicting short-term mortality in ST-segment elevation myocardial infarction (STEMI) patients. 40 However, the predictive accuracy of the CALLY index decreased as the follow-up duration extended, suggesting that the CALLY index alone may be insufficient for comprehensive long-term risk assessment. To improve prediction accuracy, it should be used in combination with other clinical indicators or biomarkers. Future research should focus on optimizing the use of the CALLY index alongside other factors to enhance its clinical utility in long-term CVD mortality prediction.
This study has several strengths. The analysis leveraged a large NHANES sample, incorporating adjustments for survey design and sample weights to enhance representativeness while controlling for multiple potential confounders to reinforce reliability. Stability of the findings was further assessed through subgroup analyses. However, certain limitations remain. The cross-sectional nature of the NHANES prevents causal inference between the CALLY index and CVD. Some critical covariates, including medication use, were not available, which may have introduced confounding and affected the assessment of true associations. Moreover, since the predictive accuracy of the CALLY index declined over time, repeated measurements may be required to maintain its long-term prognostic value. Future prospective studies are warranted to establish standardized monitoring intervals. Finally, owing to the specific characteristics of the NHANES cohort, external generalizability to populations outside the U.S. warrants further investigation.
Conclusion
Taken together, this study presents compelling evidence of a strong, independent, negative association between the CALLY index and CVD prevalence and mortality. Notably, the CALLY index showed excellent predictive accuracy for short-term CVD mortality, highlighting its usefulness in the early identification of high-risk patients in clinical settings. Additionally, these findings offer valuable insights for large-scale epidemiological research. Further evaluation of its reliability and generalizability through multicenter, prospective large-scale clinical trials is needed.
Supplemental Material
sj-pdf-1-imr-10.1177_03000605261422016 - Supplemental material for The negative association between C-reactive protein–albumin–lymphocyte index and cardiovascular disease
Supplemental material, sj-pdf-1-imr-10.1177_03000605261422016 for The negative association between C-reactive protein–albumin–lymphocyte index and cardiovascular disease by Shuaiqing Chen, Mingshen Lin and Jing Ye in Journal of International Medical Research
Footnotes
Acknowledgments
We would like to acknowledge the participants and investigators of the National Health and Nutrition Examination Survey (NHANES).
Clinical trial number
Not applicable.
Consent for publication
Not applicable.
Conflict of interest
The authors declare that they have no competing interests.
Data availability
Declaration of conflicting interests
The study was designed by JY. Data analysis and initial drafting of the manuscript were performed by SC. The manuscript was revised by ML. All authors have read and approved the final manuscript.
Ethics approval and consent to participate
The NHANES study was approved by the National Center for Health Statistics (NCHS) Ethics Review Board and was conducted in accordance with the Declaration of Helsinki (1974, revised in 2024), and all participants provided written informed consent. Since all data were obtained from the NHANES, no additional ethical approval was required for this study involving human participants.
Funding
This work was supported by the Zhejiang Province Traditional Chinese Medicine Science and Technology Plan Project (project number 2025ZL616). The funding body did not participate in study design, data collection, analysis, data interpretation, or manuscript writing.
Supplemental material
Supplemental material for this article is available online.
References
Supplementary Material
Please find the following supplemental material available below.
For Open Access articles published under a Creative Commons License, all supplemental material carries the same license as the article it is associated with.
For non-Open Access articles published, all supplemental material carries a non-exclusive license, and permission requests for re-use of supplemental material or any part of supplemental material shall be sent directly to the copyright owner as specified in the copyright notice associated with the article.