
Abstract
Objective
Depressive symptoms are a common disorder influenced by various factors, including genetic, environmental, and psychosocial aspects. This study aimed to explore the association between depressive symptoms and the number of close friends.
Methods
This cross-sectional study employed data from the 2005–2008 National Health and Nutrition Examination Survey. Weighted logistic regression was used to analyze the relationship between the number of close friends and depressive symptoms, and restricted cubic spline plots were constructed. Subgroup and sensitivity analyses were also performed.
Results
This study included 5564 participants. After grouping participants based on the number of close friends into tertiles, a negative association was found between the number of close friends and depressive symptoms. After adjustment, the group with a higher number of close friends exhibited a 48% lower risk of depressive symptoms. An approximately L-shaped relationship was observed (nonlinear P = 0.001). Depressive symptoms decreased with an increasing number of close friends up to 10, beyond which the association plateaued.
Conclusion
An approximately L-shaped relationship exists between the number of close friends and depressive symptoms. When the number of close friends was ≤10, a higher number of close friends was associated with a lower level of depressive symptoms.
Introduction
Depression, a prevalent mental disorder, is characterized by a loss of interest in daily activities, sleep disturbances, reduced ability to experience pleasure, and suicidal ideation. 1 Currently, studies on depressive symptoms have uncovered their global prevalence. It is anticipated that by 2030, depressive symptoms may emerge as the leading contributor to the global disease burden.1–3 Furthermore, the associated economic burden has increased by 37.9%, hitting an astounding level of US$326.2 billion in 2020. 4 The increasing economic pressure highlights the urgent need to strengthen research on the etiology, prevention, and treatment of depressive symptoms to effectively manage the disease and mitigate its far-reaching social impacts.
The pathogenesis of depressive symptoms is complex and can be influenced by various factors, including genetic, environmental, and psychosocial aspects. 5 Twin and family studies indicate that genetic susceptibility accounts for approximately 40% of the variance in depressive symptoms, highlighting the role of heredity in depressive symptoms. 6 Nevertheless, environmental contributors such as chronic stress, traumatic experiences, and socioeconomic disparities significantly influence both the onset and progression of depressive symptoms. 7 Among psychosocial factors, social support has emerged as a key protective factor against depressive symptoms. Social support, defined as the perception or experience of being cared for, valued, and embedded in a network of mutual obligations, has been proven to buffer the effects of stress and reduce the risk of depressive symptoms. 8
Close friends play a significant role in an individual's social life. 9 The number of close friends reflects the strength of the social support network and is a variable that may influence mental health outcomes. Close friends are typically those with whom one can comfortably discuss personal issues, seek advice, and share both positive and negative experiences. 10 Previous research has shown that individuals with larger social networks and stronger interpersonal relationships are less likely to experience depressive symptoms. 11 Close friends represent the strongest form of social connection and are regarded as significant relationships. They offer social support and prevent social isolation and loneliness.12–14 More frequent contact with close friends is associated with a reduction in depressive symptoms among the older and other age groups.15,16 Throughout life, friendships serve as a vital source of social and emotional reinforcement, particularly for individuals navigating challenging circumstances. The novelty of the present study lies in its direct test of a nonlinear association, hypothesizing an L-shaped relationship where the protective benefit plateaus after a certain threshold. An individual’s cognitive and emotional resources for maintaining deep, supportive friendships are finite. Although increasing the number of friends from a very low number likely provides substantial gains in social support and a sense of belonging, additional friendships beyond a certain point may be more superficial and consequently contribute less significantly to reducing depressive symptoms. This suggests the existence of an optimal range, which our study aimed to explore.
Therefore, this study aimed to explore the association between the number of close friends and risk of depressive symptoms among participants in the National Health and Nutrition Examination Survey (NHANES) in the United States. The objective was to uncover the unique role of close friendships in mental health and provide information for interventions aimed at enhancing social connections.
Materials and methods
Data source and study design
We conducted a cross-sectional study using data from the 2005–2008 NHANES, which was conducted by the Centers for Disease Control and Prevention (CDC). The purpose of this survey was to evaluate the health and nutritional conditions of the population in the United States. The Research Ethics Review Board of the National Center for Health Statistics provided authorization for the NHANES study protocols. These protocols were in line with the revised Declaration of Helsinki. Each participant provided written informed consent. Additional details about the NHANES program can be found on the CDC website (https://www.cdc.gov/nchs/nhanes/index.htm). 17 The reporting of this study conforms to the Strengthening the Reporting of Observational studies in Epidemiology (STROBE) guidelines. 18
Participant selection adhered to the predefined inclusion criteria of a minimum age of 40 years. The exclusion criteria encompassed pregnant individuals and those with incomplete data for variables pertinent to the study (Figure 1).

Flowchart of participant selection.
The distribution curve of the number of close friends from 2005 to 2006 is similar to the core distribution characteristics of the close friends from 2007 to 2008. The range is approximately 4–5, and there are only minor differences in the details, with the two distributions exhibiting substantial overlapping (Figure 2).

Distribution diagrams of the number of close friends across different years.
Depressive symptoms
The Patient Health Questionnaire-9 (PHQ-9), a validated and extensively used instrument for identifying depressive symptoms, was employed to evaluate participants. 19 Scores on the PHQ-9 scale vary from 0 to 27, where elevated values are correlated with greater symptom severity. When measured against clinical interview benchmarks, a threshold score of ≥10 demonstrates 85% sensitivity and 89% specificity in detecting depressive symptoms. 20
Close friends
Regarding the number of close friends, participants were asked the following: “In general, how many close friends do you have?” A “close friend” is a relative or nonrelative with whom you feel comfortable confiding personal matters and turning to for help.” 10 The numbers of close friends in sets of three digits (0 ≤ Q1 ≤ 3, 3 < Q2 ≤ 6, 6 < Q3 ≤ 50) were used as categorical variables.
Covariates
Demographic and health-related variables were obtained from survey questionnaires and analyzed as categorical data. These covariates encompassed the following: age (40–64 years, ≥65 years), sex (male, female), marital status (married/cohabiting, widowed/divorced/separated, unmarried), racial/ethnic background (Non-Hispanic White, Non-Hispanic Black, Mexican American, other groups), educational attainment (less than high school, high school graduate, post-high school), alcohol use (current, none), smoking history (never, former, current), health insurance coverage (insured, uninsured), hypertension (present, absent), diabetes status (diagnosed, borderline, undiagnosed), cardiovascular disease (CVD) (yes, no), history of tumors (yes, no), body mass index (BMI) categories (<25, 25–30, >30), and poverty–income ratio (PIR) tiers (<1.3, 1.3–3.5, >3.5). Race and ethnicity were self-reported. Race categories included Non-Hispanic White, Non-Hispanic Black, Asian/Pacific Islander, Native American, and Other. Ethnicity was classified as Hispanic or Non-Hispanic, with Mexican American included as a specific Hispanic subgroup following NHANES conventions. Alcohol consumption was determined through a single 24-hour dietary recall survey, with participants classified as drinkers if they reported alcohol intake during this period. Smoking history was categorized into three groups: never smokers (individuals who had smoked fewer than 100 cigarettes), former smokers (those who smoked ≥100 cigarettes but no longer smoked), and current smokers (≥100 cigarettes smoked, currently smoking daily or occasionally). 17 The PIR was calculated by dividing the household income by the federal poverty threshold for the survey year, as outlined in the U.S. Department of Health and Human Services (HHS) guidelines. Conditions such as hypertension, diabetes mellitus, CVD, and tumors were identified through self-reported diagnoses in participant-completed questionnaires.
Statistical analysis
Categorical variables were summarized in descriptive analyses as frequencies, proportions (%), and percentages. Group differences in categorical variables were evaluated using the chi-square test. In compliance with NHANES analytical protocols, sampling weights were incorporated into the analyses to ensure representativeness. All analyses accounted for the complex sampling design of NHANES. Sampling weights, strata, and primary sampling units were incorporated to ensure nationally representative estimates and valid variance estimation. Survey-weighted analyses were conducted using the ‘survey’ package in R, which applies Taylor series linearization to compute standard errors. Weighted logistic regression analyses were separately performed to assess the association between depressive symptoms and the number of close friends. A restricted cubic spline (RCS) plot was used to better describe the dose–response relationship between the number of close friends and depressive symptoms among participants, exploring the optimal number of close friends. The results were further validated through weighted linear regression. Analyses were conducted using R software (version 4.3.3; https://cran.r-project.org/) for data processing and statistical evaluations. Statistical significance was defined as a two-tailed P-value <0.05, which served as the cutoff for significance throughout the study.
Results
Characteristics of the study population
Table 1 presents the baseline characteristics of the study participants (n = 5564), grouped according to the presence of depressive symptoms, with 455 participants exhibiting depressive symptoms. According to Table 1, participants between the ages of 40 and 64 years who were White and female, had a high level of education, and smoked were more likely to develop depressive symptoms.
Characteristic of participants.
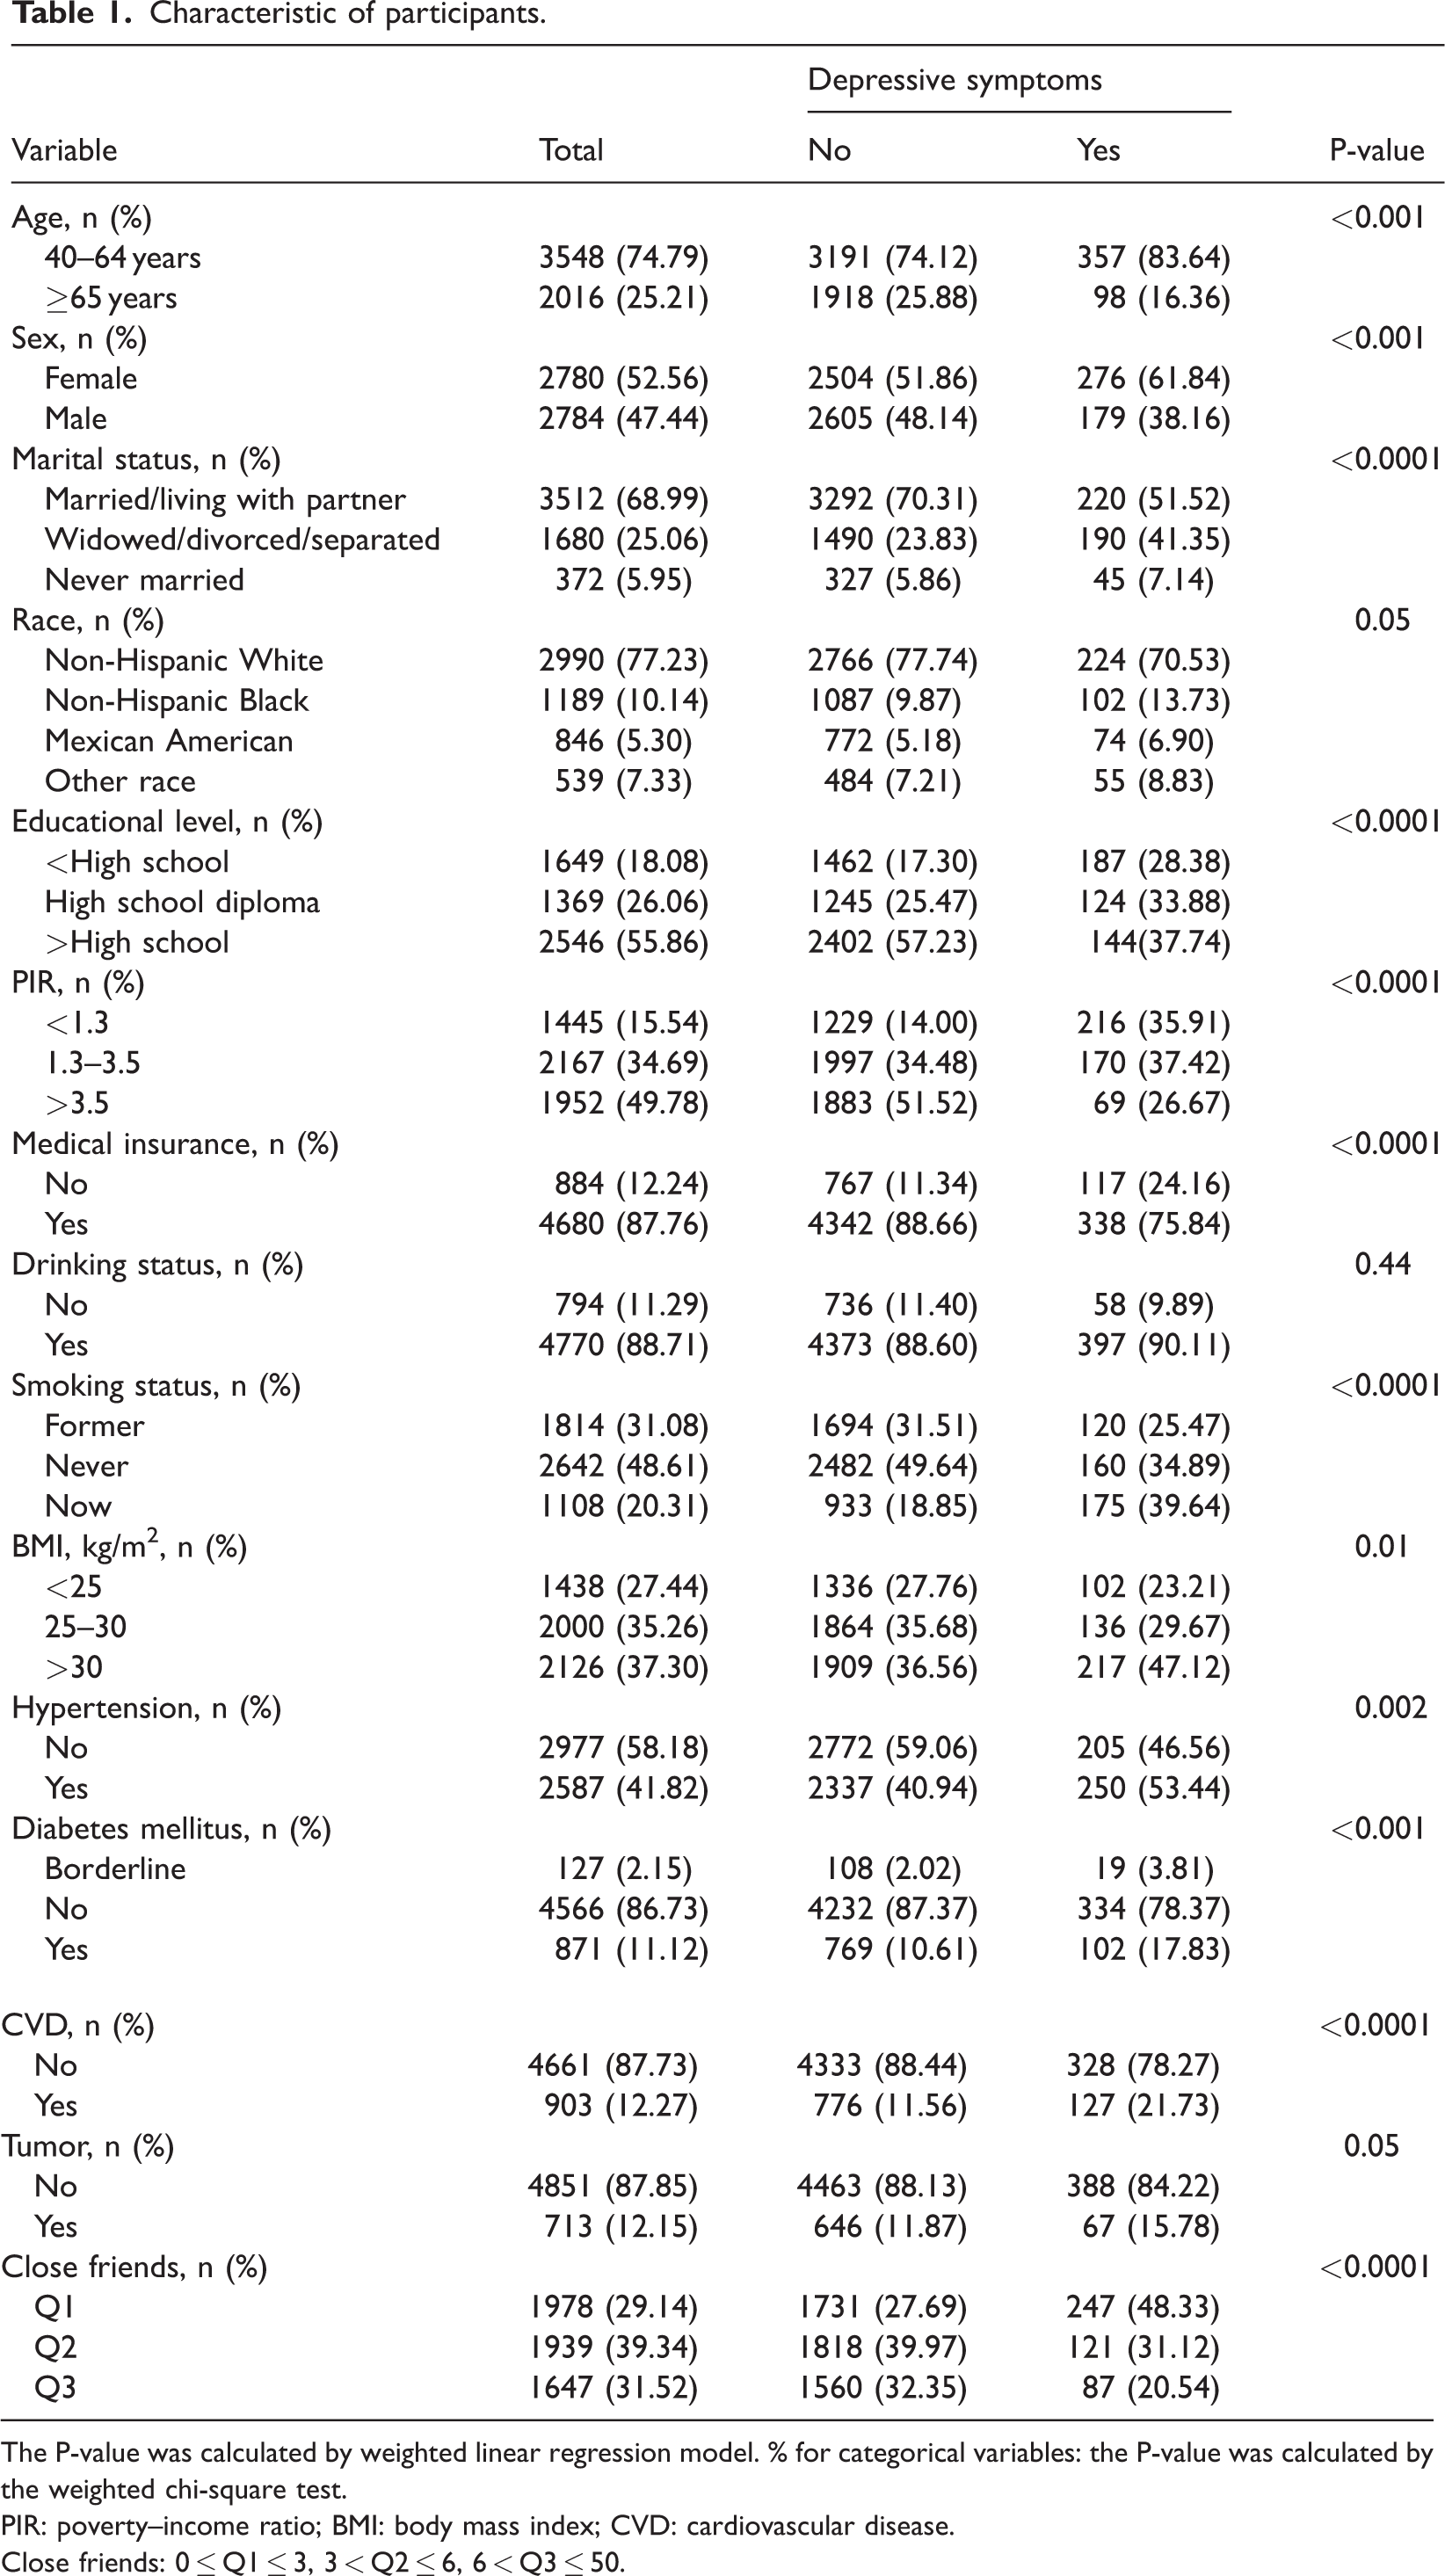
The P-value was calculated by weighted linear regression model. % for categorical variables: the P-value was calculated by the weighted chi-square test.
PIR: poverty–income ratio; BMI: body mass index; CVD: cardiovascular disease.
Close friends: 0 ≤ Q1 ≤ 3, 3 < Q2 ≤ 6, 6 < Q3 ≤ 50.
Association between depressive symptoms and the number of close friends
Table 2 stratifies participants into tertiles based on the number of close friends, using the lowest tertile as the reference group. In the unadjusted analyses employing weighted logistic regression, individuals with a greater number of close friends demonstrated a significantly lower likelihood of depressive symptoms (odds ratio (OR) =0.36, 95% confidence interval (CI): 0.28–0.47). In Model 1, after adjusting for sex, age, educational level, and marital status, the relationship between a higher number of close friends and the occurrence of depressive symptoms remained robust (OR = 0.44, 95% CI: 0.34–0.58). In Model 2, after further adjusting for smoking status, drinking status, insurance, and PIR on the basis of Model 1, similar results were obtained (OR = 0.52, 95% CI: 0.39–0.68). In Model 3, after further adjusting for BMI, CVD, tumor, hypertension, and diabetes mellitus based on Model 2, the association remained robust (OR = 0.52, 95% CI: 0.39–0.70).
Different models of the association between the number of close friends and depressive symptoms.

Results are reported as odds ratios (ORs) with 95% confidence intervals (CIs).
Close friends: 0 ≤ Q1 ≤ 3, 3 < Q2 ≤ 6, 6 < Q3 ≤ 50
The crude model included no covariates.
Model 1 adjusted for sex, age, educational level, and marital status.
Model 2 incorporated additional adjustments for race, smoking status, drinking status, insurance status, and PIR on the basis of Model 1.
Model 3 accounted for sex, age, race, educational level, marital status, smoking status, drinking status, insurance, poverty–income ratio, body mass index, cardiovascular disease, tumor, hypertension, and diabetes mellitus.
Subgroup analysis
As shown in Figure 3, the inverse relationship between a higher number of close friends and a reduced likelihood of depressive symptoms remained stable across subgroups stratified by age, sex, race, educational level, PIR, and BMI. No significant interaction effects were detected between these stratification variables and the association of interest (P > 0.05). However, an interaction was observed in the grouping by marital status. Nevertheless, the results indicated that regardless of marital status, individuals with a higher number of close friends exhibited a lower risk of depressive symptoms than those with a smaller number of close friends.
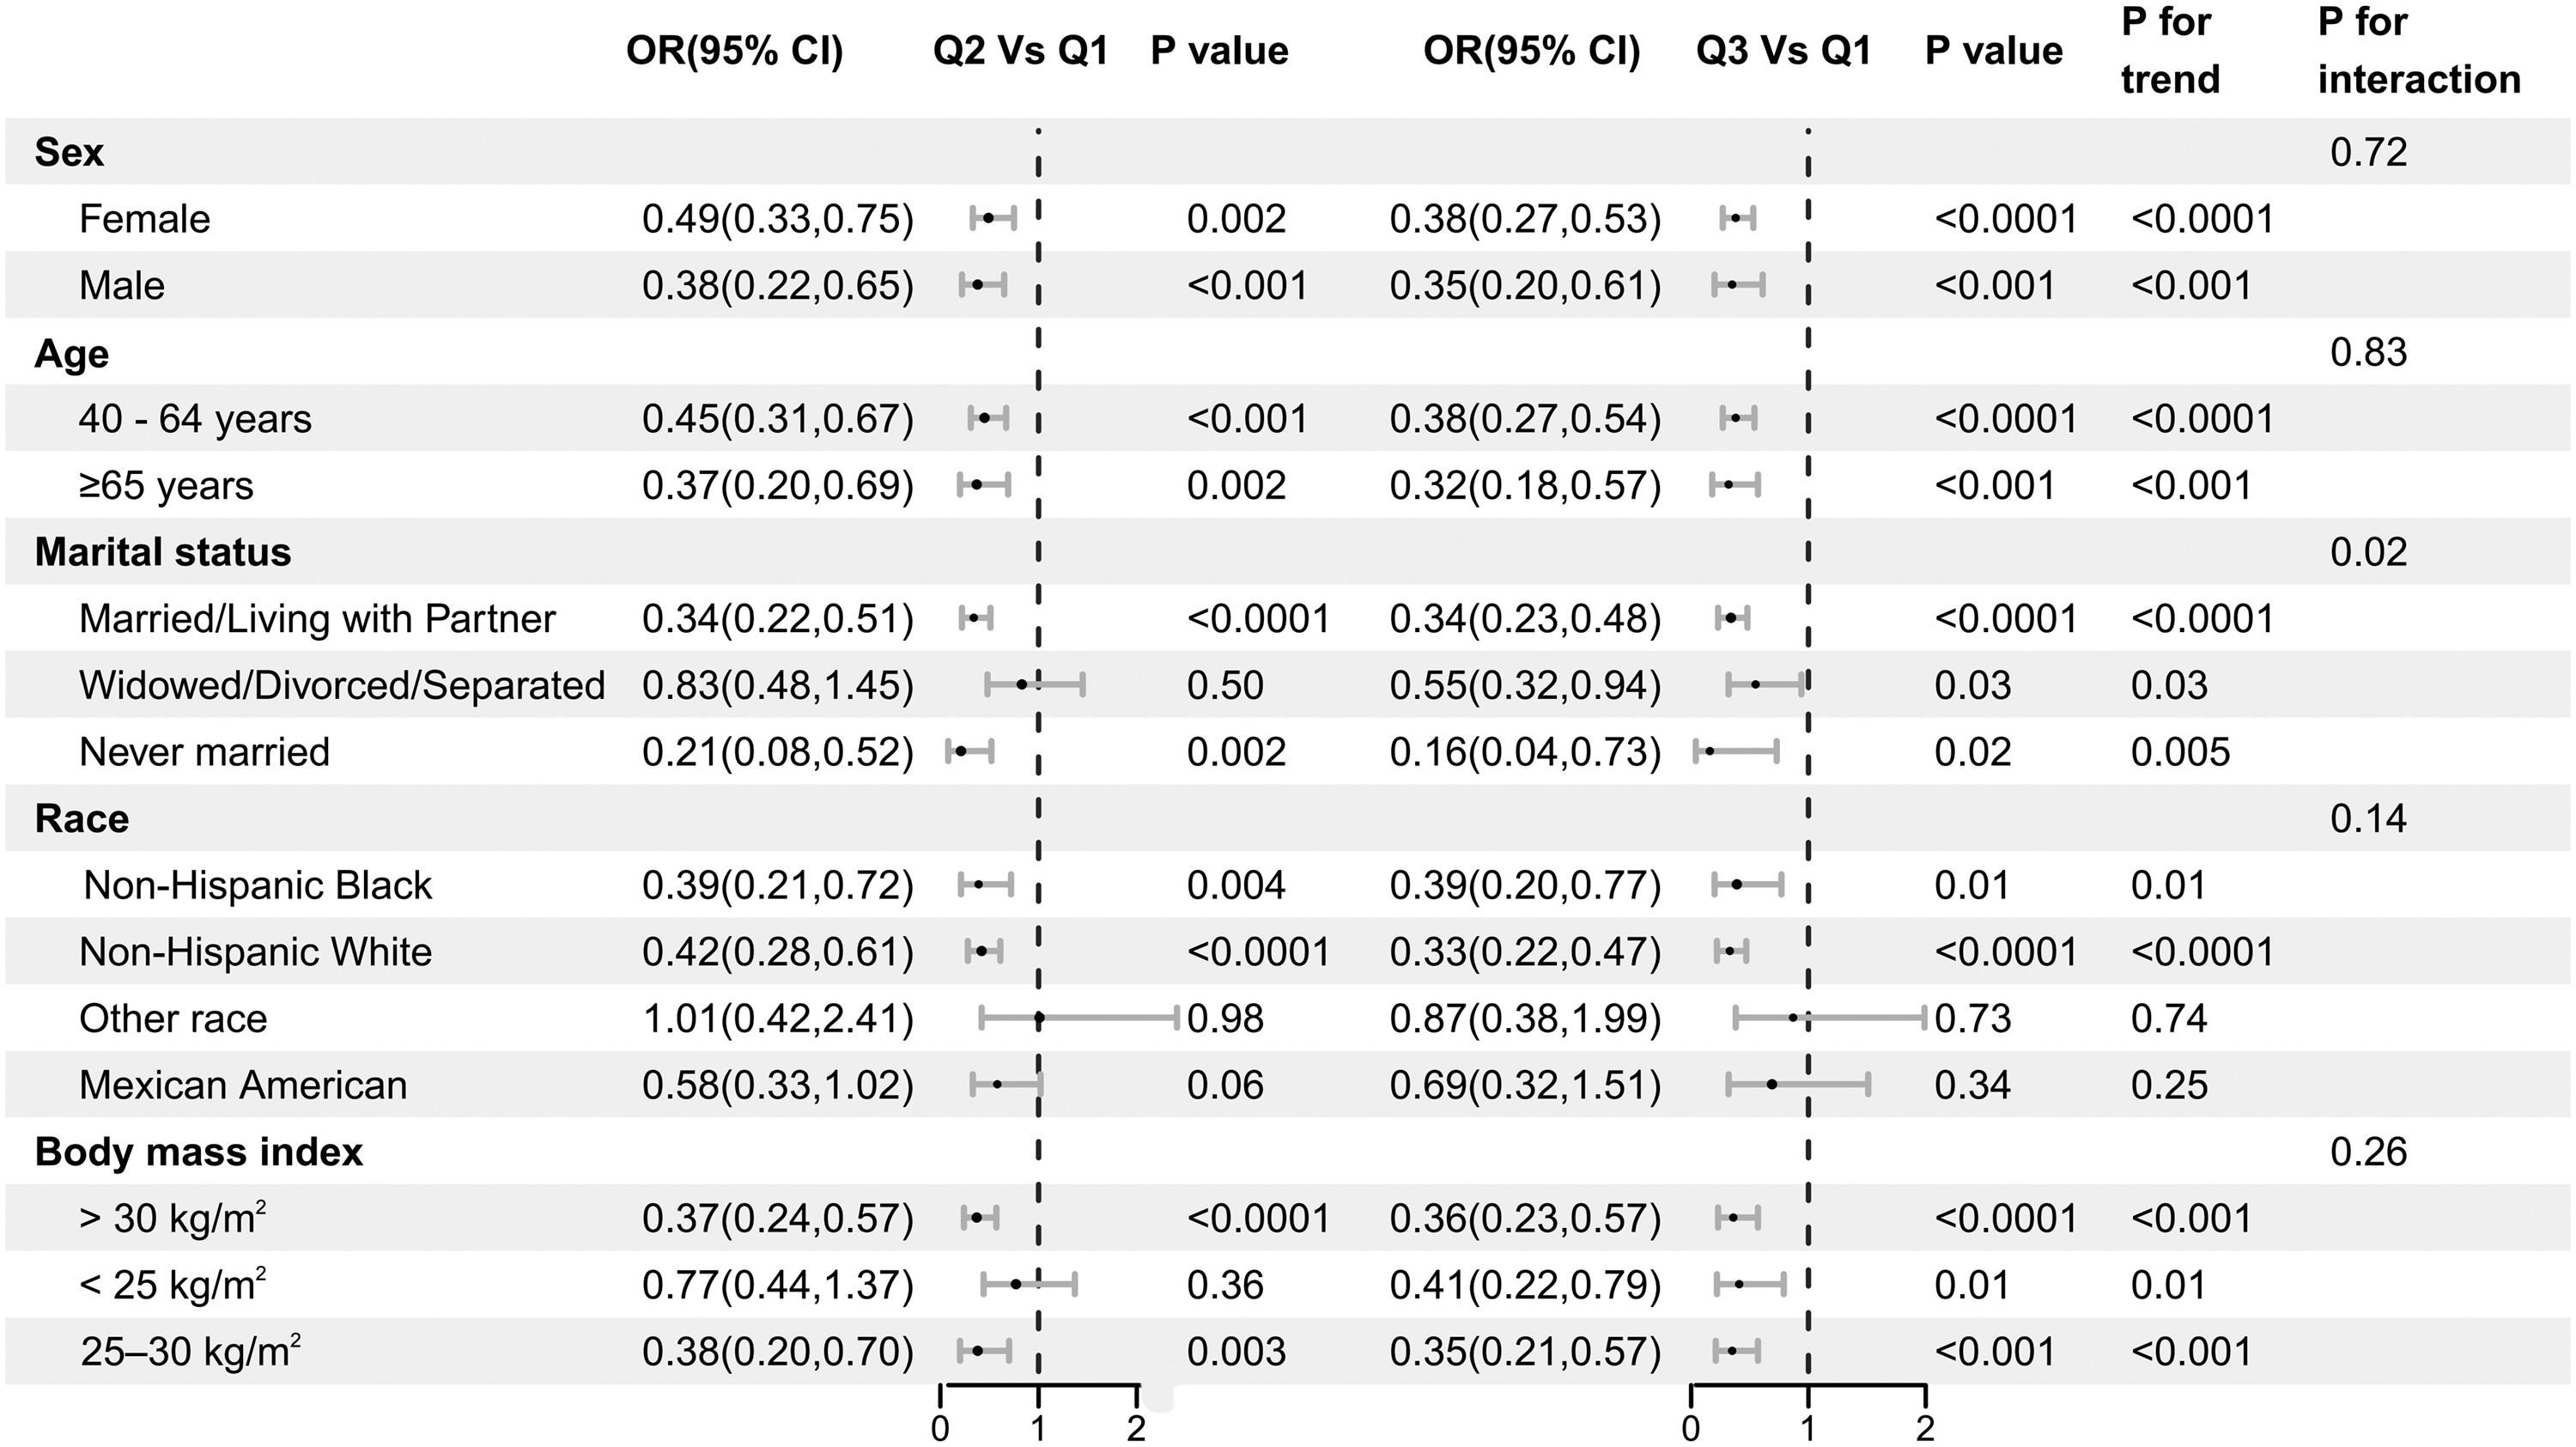
Subgroup analysis of the relationship between the number of close friends and depressive symptoms.
The dose–response relationship between the number of close friends and depressive symptoms was examined using RCS modeling with three knots placed at the 10th, 50th, and 90th percentiles of the exposure distribution. The overall test for nonlinearity was statistically significant, indicating that a nonlinear specification provided a better fit than a linear model. As shown in Figure 4, the spline curve and its 95% CI bands demonstrated an approximately L-shaped association, with a steep decline in depressive symptoms at the lower levels of close-friend support and a progressively flatter slope thereafter. Rather than representing a precise threshold, the pattern suggests diminishing marginal benefits beyond 8–12 close friends, with wider CIs observed at the right tail due to sparser data. Our findings indicated that when the number of close friends was ≤10, the risk of depressive symptoms declined as the number of close friends increased. Nevertheless, when the number of close friends exceeded 10, no additional benefit in terms of alleviating depressive symptoms was observed.

Association between the number of close friends and depressive symptoms in the 2005–2008 National Health and Nutrition Examination Survey.
Sensitivity analysis
Based on the previous analysis, we found that as the number of friends approaches 10, depressive symptoms decline significantly, and the relationship stabilizes when the number of friends exceeds 10. Tumors reportedly have a profound impact on patients’ negative psychological states. Therefore, to gain a more in-depth understanding of the relationship between the number of friends and depressive symptoms, we conducted a sensitivity analysis. In this sensitivity analysis, individuals with more than 10 close friends and patients with tumors were excluded, and a total of 4198 participants were ultimately included in the analysis. We found a significant negative correlation between the number of close friends and depressive symptoms across different models. In the final model, for each additional close friend, the risk of depressive symptoms decreased by 11% (OR = 0.89, 95% CI: 0.84–0.95) (Table 3). Moreover, in the stratified analysis, the above results remained consistent across the subgroups of sex, age, marital status, and BMI. Although an interaction effect was observed regarding race, similar results were observed among the Non-Hispanic White and Non-Hispanic Black populations (Figure 5).
Sensitivity analysis of close friends and depressive symptoms.

Results are reported as odds ratios (ORs) with 95% confidence intervals (CIs).
The crude model included no covariates.
Model 1: Sex, age, race, educational level, and marital status were adjusted.
Model 2: Sex, age, race, educational level, marital status, smoking status, drinking status, insurance, and poverty–income ratio were adjusted.
Model 3: Sex, age, race, educational level, marital status, smoking status, drinking status, insurance, poverty–income ratio, body mass index, cardiovascular disease, hypertension, and diabetes mellitus were adjusted.

Stratified analysis between the number of close friends and depressive symptoms.
To further validate the reliability of our findings, we performed sensitivity analyses using weighted linear regression by treating close friends and depressive symptoms as continuous variables. Consistent with the results reported above, this inverse association remained statistically significant across different models (Table S1).
Discussion
As a leading cause of disability worldwide, depressive symptoms represent a major public health challenge and rank among the most widespread mental disorders, severely affecting hundreds of millions globally. Using data from the NHANES from 2005 to 2008, we investigated the potential association between the number of close friends and depressive symptoms among US adults aged 40 years and above. In this cohort, after adjusting for potential confounders, we observed a negative association between the number of close friends and depressive symptoms within a certain range. In addition, the stratified analyses showed no meaningful effect modification by demographic or health-related variables, suggesting that the association between the number of close friends and depressive symptoms was generally consistent across subgroups. These findings highlight a possible link between social connectedness, reflected by the number of close friends, and depressive symptoms in middle-aged and older adults.
At present, depressive symptoms are regarded as a set of syndromes predominantly triggered by biological and social factors, interpersonal strain, and various other elements. 9 The components of social groups’ structure, along with the capacity to seek assistance and experience enjoyment, all fall under the scope of social support. Social support has an impact on the onset, progression, and prognosis of depressive symptoms. Earlier studies stated that an individual’s social surroundings, particularly social engagement, could have an effect on behavior and mental well-being. 21 Evidence suggests that the amount and nature of social relationships exert an influence on diverse health outcomes, such as mental well-being. 22 An appropriate number of close friends is linked to the least likelihood of depressive symptoms. However, they also noted diminishing returns for extremely large social networks. 23 Similarly, Teo et al. demonstrated that having fewer close friends is a significant risk factor for depressive symptoms, which supports the view that a moderate level of social relationships is optimal for mental health. 24 Our research findings suggest that there is a nonlinear relationship between the number of close friends and depressive symptoms. This suggests that among individuals with an extremely extensive social network, the slight rise in depressive symptoms implies that excessive social interactions or the maintenance of a large number of friendships may introduce new stressors, such as social obligations or conflicts, which could offset the benefits brought by social support. 25
The protective effect of close friends on depressive symptoms can be explained by several mechanisms. First, close friendships provide emotional support, which can buffer the impact of stress and enhance coping strategies. It has been demonstrated that emotional backing from friends can alleviate the sense of loneliness and isolation. These two conditions are notable risk factors for depressive symptoms. 26 Second, close friends can offer practical assistance and advice during stressful life events, thereby improving an individual’s ability to manage challenges and maintain psychological resilience. 27 The research conducted by Hagerty and Williams indicated that the feeling of belonging represents the experience and capacity of the human system to engage with social and environmental elements, along with interpersonal connections. 28 The sense of belonging is one of the most basic human motivations and is directly associated with psychological and social functions. 29 Positive social interactions with friends can strengthen an individual’s self-identity and provide affirmation, which may counteract the negative self-perceptions commonly associated with depressive symptoms. 30
In this nationally representative sample, we observed an inverse, nonlinear association between the number of close friends and depressive symptoms, characterized by diminishing marginal benefits as the number of close friendships increased. Rather than indicating that increasing friend counts directly reduce depressive symptoms, our results should be interpreted as showing that individuals with a richer network of meaningful social ties tend to exhibit lower levels of depressive symptoms. First, reverse causality is possible; individuals experiencing greater depressive symptoms may withdraw socially or have more difficulty maintaining close friendships, which could lead to lower reported connectedness. 31 Second, although we controlled for multiple sociodemographic factors, residual confounding cannot be ruled out. Traits such as loneliness, personality characteristics (e.g. neuroticism), or recent adverse life events may influence both social networks and depressive symptoms but were not fully captured in our dataset.32,33 Finally, the use of self-reported measures—both for social relationships and depressive symptoms—may introduce misclassification or shared method bias. 34
Our study has certain limitations. First, as this was an observational study with a cross-sectional design, we were unable to ascertain the causal link between the number of close friends and depressive symptoms. Second, our key independent variable, the number of close friends, was based on a single self-report item. Although we observed a clear association with depressive symptoms, this measure does not distinguish between friends and relatives who are considered “close,” and it does not reflect the mechanisms through which friendships exert their potential protective effect (e.g. through emotional support, instrumental aid, or a sense of belonging). Future research would benefit from employing multidimensional scales that assess both the quantity and quality of social connections. Finally, our assessment of close friends and depressive symptoms involves questionnaire content, which may be subject to self-reporting bias.
Conclusion
Our cross-sectional study suggests that a greater number of close friends is associated with lower levels of depressive symptoms. Specifically, when the number of close friends is ≤10, a higher number of friends is associated with lower PHQ-9 scores. The lowest level of depressive symptoms was observed in individuals with approximately 10 close friends.
Supplemental Material
sj-pdf-1-imr-10.1177_03000605261429192 - Supplemental material for L-shaped association between depressive symptoms and the number of close friends: A cross-sectional study
Supplemental material, sj-pdf-1-imr-10.1177_03000605261429192 for L-shaped association between depressive symptoms and the number of close friends: A cross-sectional study by Quan Yuan, Jingshan Bai, Wenqiang Li, Ying Yang, Zhiping Deng and Qian Huang in Journal of International Medical Research
Footnotes
Acknowledgments
We would like to thank the US Centers for Disease Control and Prevention for collecting the data and making the data available to the public.
Author contributions
Study conception and design: Quan Yuan and Jingshan Bai. Data analysis and interpretation: Quan Yuan and Jingshan Bai. Manuscript drafting: Quan Yuan, Jingshan Bai, and Wenqiang Li. Table preparation: Quan Yuan, Jingshan Bai, Wenqiang Li, Ying Yang, and Zhiping Deng. Critical revision of the manuscript: Qian Huang.
Data availability statement
Declaration of conflicting interests
The authors have no conflict of interest to be declared.
Ethics statement
The National Center for Health Statistics Research Ethics Review Board has approved NHANES cycles 2005–2008 (https://www.cdc.gov/nchs/nhanes/irba98.htm). Written informed consent was obtained from all participants (![]() genetic_participants.htm).
genetic_participants.htm).
Funding
This work was supported by the 2022 Scientific Research Project of Zigong Academy of Medical Sciences (Open Project) (No. ZGYKY22KF009), Zigong First People’s Hospital (No. 2024GZL06), and the “Bethune Guiding Future Multidisciplinary Research Capacity Building Program” of Bethune Charitable Foundation (No. BCF-QYWL-HX-2025-06).
Supplemental material
Supplemental material for this article is available online.
References
Supplementary Material
Please find the following supplemental material available below.
For Open Access articles published under a Creative Commons License, all supplemental material carries the same license as the article it is associated with.
For non-Open Access articles published, all supplemental material carries a non-exclusive license, and permission requests for re-use of supplemental material or any part of supplemental material shall be sent directly to the copyright owner as specified in the copyright notice associated with the article.