
Abstract
Objective
This study aimed to investigate the association between the non–high-density lipoprotein cholesterol to high-density lipoprotein cholesterol ratio and nonalcoholic fatty liver disease in non-obese individuals, using data from the National Health and Nutrition Examination Survey.
Methods
This cross-sectional study analyzed data from the National Health and Nutrition Examination Survey (2017–2023), including 6265 eligible participants. The ratio of non–high-density lipoprotein cholesterol to high-density lipoprotein cholesterol was calculated, and nonalcoholic fatty liver disease was diagnosed using liver ultrasound transient elastography. The association between the ratio and nonalcoholic fatty liver disease was assessed using multivariable logistic regression and restricted cubic spline models. Threshold effect analysis was conducted to evaluate potential nonlinear relationships, while subgroup analyses and interaction tests were performed to assess consistency across demographic groups. Sensitivity analyses were also conducted using alternative controlled attenuation parameter thresholds to ensure the robustness of the findings.
Results
Among the 6265 participants (mean age, 44.32 years), 1355 (21.62%) had nonalcoholic fatty liver disease. Restricted cubic spline analysis revealed a nonlinear dose–response relationship between the ratio and nonalcoholic fatty liver disease risk (P for nonlinearity <0.0001). When the ratio was below 3.4, the odds ratio was 2.17 (95% confidence interval, 1.51–3.12, P < 0.0001), indicating a strong positive association. However, when the ratio exceeded 3.4, the relationship plateaued (odds ratio, 1.40; 95% confidence interval, 1.11–1.75; P = 0.003). Subgroup analyses showed that the association was more pronounced among non-Hispanic White females aged over 60 years, although further validation is needed. Sensitivity analyses using controlled attenuation parameter thresholds of 248 and 288 dB/m showed similar patterns, supporting the stability of the observed associations.
Conclusions
In non-obese adults, higher levels of non–high-density lipoprotein cholesterol to high-density lipoprotein cholesterol ratio are associated with a greater prevalence of nonalcoholic fatty liver disease, with the strongest association observed when the ratio was below 3.4. As this study is cross-sectional, causal relationships cannot be inferred. This ratio may serve as a simple indicator for identifying individuals at higher risk of nonalcoholic fatty liver disease, but further longitudinal studies are needed to confirm these findings.
Keywords
Introduction
Nonalcoholic fatty liver disease (NAFLD) represents a significant and growing public health concern, encompassing a spectrum of liver conditions that range from simple steatosis to more severe forms, such as nonalcoholic steatohepatitis (NASH), fibrosis, and cirrhosis. The global prevalence of NAFLD is estimated to affect approximately 25% of adults worldwide, with incidence rising in parallel with the obesity epidemic and metabolic syndrome.1,2 Although NAFLD is predominantly associated with obesity, a substantial proportion of non-obese individuals also develop the condition, particularly those with metabolic dysregulation, insulin resistance, or specific ethnic backgrounds. 3 This observation highlights the complexity of NAFLD as a metabolic disorder that extends beyond obesity and underscores the need to investigate its characteristics and risk factors in both obese and non-obese populations.
Compared with obese NAFLD, non-obese NAFLD is often characterized by a normal body mass index (BMI) but a higher prevalence of visceral adiposity, insulin resistance, and dyslipidemia, suggesting distinct pathogenic mechanisms and clinical implications. Therefore, exploring metabolic biomarkers that can effectively identify at-risk non-obese individuals is of considerable clinical significance.
The non–high-density lipoprotein cholesterol to high-density lipoprotein cholesterol ratio (NHHR) serves as a composite lipid marker reflecting both atherogenic and protective lipid components. Elevated NHHR levels have been linked to multiple metabolic disorders, including metabolic syndrome, insulin resistance, and cardiovascular disease (CVD), which are known contributors to NAFLD.4–6 Previous research has shown that individuals with higher NHHR values exhibit a greater risk of developing NAFLD, as the ratio captures underlying dyslipidemia that exacerbates hepatic steatosis.7,8 The association between this ratio and NAFLD is particularly relevant in the context of metabolic dysfunction, in which insulin resistance plays a pivotal role in hepatic fat accumulation. 9 Furthermore, an atherogenic lipid profile, characterized by elevated total cholesterol (TC), low-density lipoprotein cholesterol (LDL-C), and triglycerides (TG), together with reduced high-density lipoprotein cholesterol (HDL-C), has been established as a major risk factor for both CVD and the progression of NAFLD.10,11
This study aimed to explore the association between NHHR and NAFLD in non-obese individuals using data from the National Health and Nutrition Examination Survey (NHANES). Although previous studies have reported a positive relationship between NHHR and NAFLD,12,13 most investigations have focused on general or obese populations, leaving non-obese individuals insufficiently characterized. To the best of our knowledge, no large-scale, nationally representative study has systematically evaluated this association in non-obese adults using recent NHANES data.
NHHR has been reported to exhibit superior predictive ability for NAFLD compared with traditional lipid indicators, such as LDL-C and the TG/HDL-C ratio, with prior studies showing higher area under the curve (AUC) values for this ratio (approximately 0.73–0.81 for NAFLD prediction).5,13 Consequently, a deeper examination of the clinical significance of this lipid ratio in non-obese populations may enhance early detection and individualized management of NAFLD. The NHANES 2017–2023 cycles were selected because of the availability of liver ultrasound transient elastography (LUTE) data, which allows a more accurate, noninvasive assessment of hepatic steatosis.
In summary, this study aimed to clarify the independent and nonlinear association between NHHR and NAFLD among non-obese US adults, thereby addressing an important knowledge gap in metabolic liver disease research and providing potential guidance for risk stratification and targeted prevention in clinical practice.
Methods
Data source
We conducted a cross-sectional analysis using data from the NHANES 2017–2023. The NHANES database is a comprehensive, nationally representative survey that collects extensive health and nutritional information from the US population. It includes a wide range of data, such as demographic characteristics, dietary patterns, physical examination results, and laboratory test outcomes, making it a valuable resource for public health research.1,2 This database has been widely used in observational studies across multiple disciplines, including epidemiology, nutrition, and chronic disease research. 3 Access to the NHANES database is publicly available, allowing researchers to use the data without requiring certification or examination. Given the retrospective nature of this study, which involved no direct patient intervention and only deidentified data, institutional review board approval by the National Center for Health Statistics (NCHS) was not required. Furthermore, our local institutional review board determined that formal assessment was unnecessary because all analyzed data were deidentified.
Study population
A total of 27,493 individuals from the NHANES database were initially included. Several exclusion criteria were applied to derive the final analytic sample. Participants who did not complete LUTE were excluded (n = 12,190), as were those with a history of viral hepatitis (n = 205), defined as testing positive for hepatitis B surface antigen (HBsAg) or hepatitis C antibody (HCV-Ab). 14 Individuals classified as heavy alcohol consumers were also excluded (n = 4395). Heavy alcohol use was defined using self-reported intake from the NHANES Alcohol Use Questionnaire, with thresholds of more than three drinks/day for men and more than two drinks/day for women; Alcohol Use Disorders Identification Test (AUDIT) scores were not available for the survey cycles included in this analysis. 15 Participants with missing data required to calculate NHHR were excluded (n = 997). An assessment of missing data patterns showed no clustering by age, sex, or race, suggesting that missingness was likely random and unlikely to bias the results. Moreover, individuals with a BMI of 30 or higher were excluded (n = 3441). After applying these criteria, 6265 participants were eligible for inclusion, of whom 1355 were diagnosed with NAFLD. The participant selection process is summarized in Figure 1.

Flow diagram of study selection.
NHHR measurements
The NHHR was calculated as non-HDL-C divided by HDL-C. TC, HDL-C, and non-HDL-C were reported in mg/dL. Non-HDL-C was derived by subtracting HDL-C from TC. Lipid measurements in the NHANES were obtained from fasting blood samples according to standardized laboratory protocols.
NAFLD diagnosis
LUTE was used to provide an objective evaluation of liver disease, with a particular focus on hepatic steatosis. All measurements were performed using the FibroScan® device, which applies the controlled attenuation parameter (CAP) as a reliable, noninvasive method for quantifying liver fat content. Recent studies have shown that a CAP value of ≥274 dB/m can effectively identify NAFLD, with sensitivity of up to 90% for detecting all levels of hepatic steatosis.16,17
Study covariates
In accordance with previous studies, a range of covariates with potential influence on the study outcomes was included. Demographic variables comprised age, sex, ethnicity, educational level, poverty–income ratio (PIR), and marital status. Physical examination variables included BMI. Clinical parameters encompassed TC, HDL-C, LDL-C, alanine aminotransferase (ALT), and aspartate aminotransferase (AST). Additionally, questionnaire data were used to assess smoking status, hypertension, and diabetes. Smoking status was categorized as never smokers (individuals who had smoked fewer than 100 cigarettes in their lifetime), former smokers (those who had smoked 100 or more cigarettes in their lifetime but were not current smokers), current smokers, and participants with missing data. Hypertension and diabetes were defined based on a diagnosis by a healthcare professional at any point in the participant’s medical history. A detailed summary of all covariates is provided in Table 1.
Characteristics of population, 2017–2023 NHANES (n = 6265).
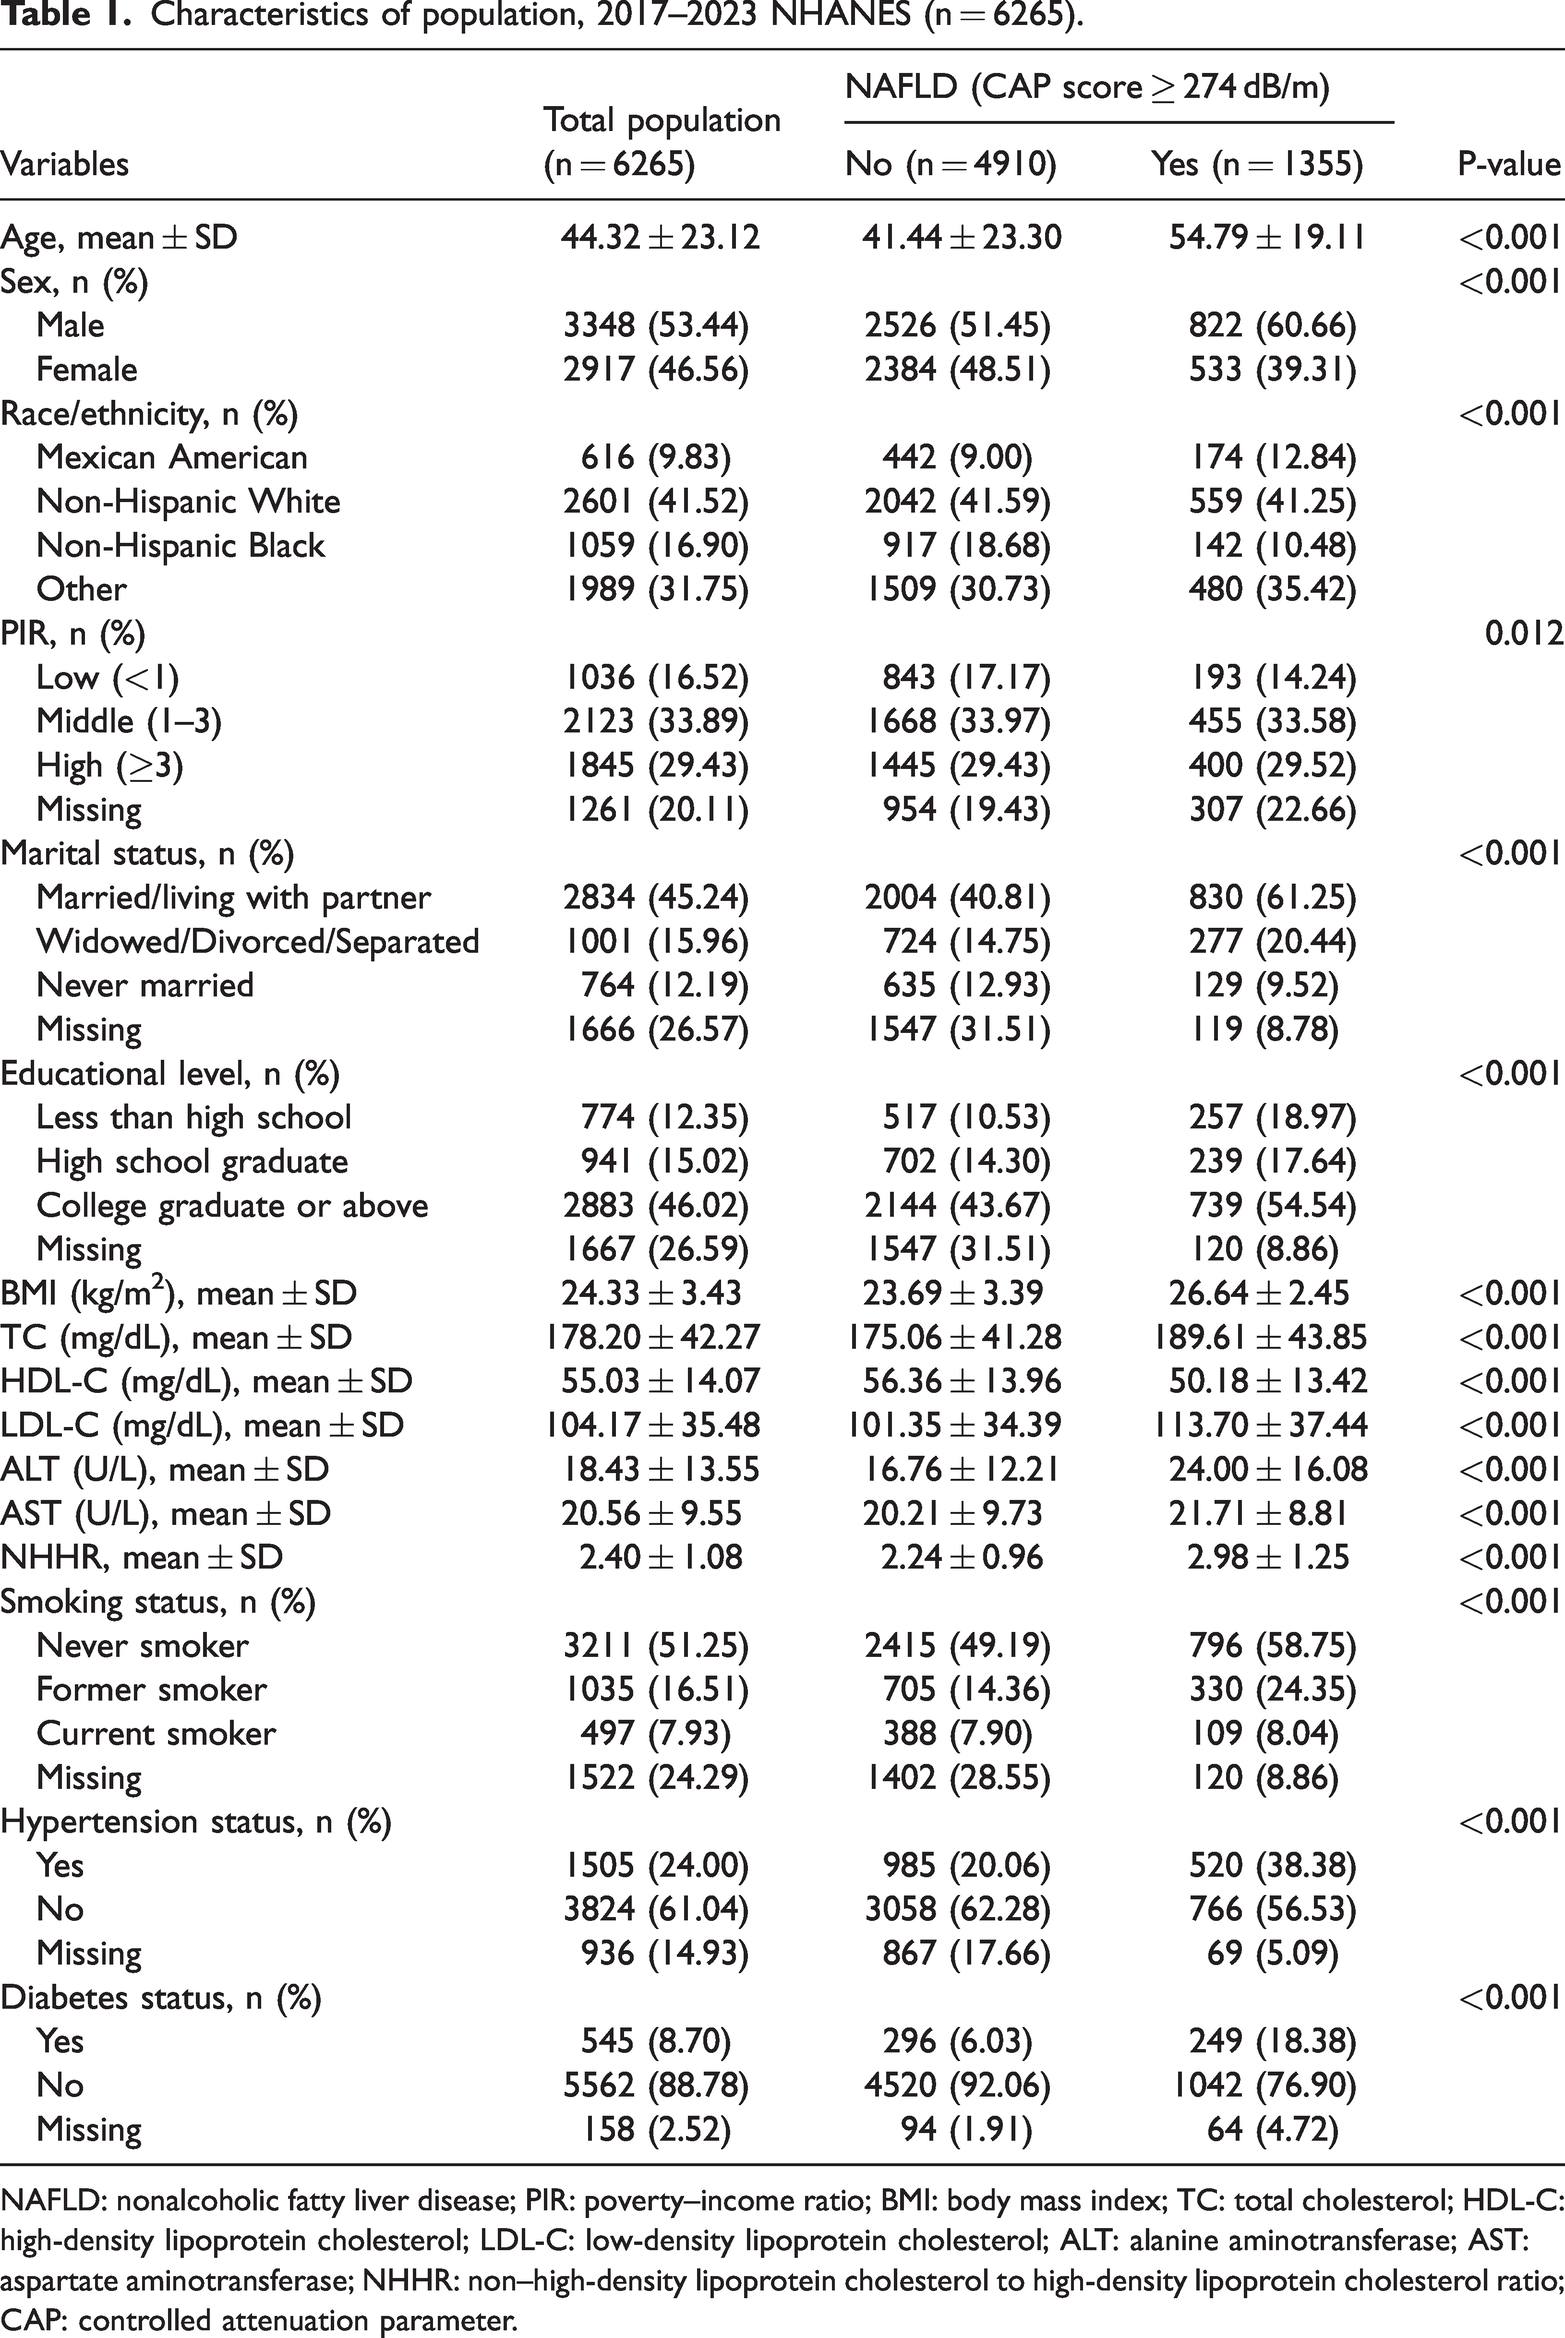
NAFLD: nonalcoholic fatty liver disease; PIR: poverty–income ratio; BMI: body mass index; TC: total cholesterol; HDL-C: high-density lipoprotein cholesterol; LDL-C: low-density lipoprotein cholesterol; ALT: alanine aminotransferase; AST: aspartate aminotransferase; NHHR: non–high-density lipoprotein cholesterol to high-density lipoprotein cholesterol ratio; CAP: controlled attenuation parameter.
Statistical analysis
All analyses incorporated NHANES sampling weights, clustering, and stratification to account for the complex survey design and to ensure national representativeness. Continuous variables are presented as means ± SD, whereas categorical variables are expressed as counts and percentages. Multivariable logistic regression models were applied to evaluate the association between NHHR and NAFLD. To enhance robustness and reduce confounding, three models with progressive adjustment were constructed: an unadjusted model; a model adjusted for age, sex, and race; and a fully adjusted model including all covariates listed in Table 1. Potential nonlinear relationships were examined using smoothed curve fitting and restricted cubic spline (RCS) analyses, implemented with rms and splines packages in R. A two-piecewise linear regression model was subsequently applied to identify potential threshold effects, with the inflection point determined by maximizing model likelihood. A log-likelihood ratio test was used to compare model fit between the one-line and two-piecewise linear models. Subgroup analyses were performed according to age, sex, and race. These analyses were exploratory, and interaction terms between NHHR and subgroup variables were formally tested using likelihood ratio tests. Additionally, we conducted sensitivity analyses using alternative CAP thresholds of 248 dB/m and 288 dB/m to assess the robustness of the association between NHHR and NAFLD. Missing demographic and questionnaire responses coded as “Refused” or “Don’t know” were treated as missing. Dummy variables were used to account for missing covariate data. Variables with more than 2% missingness included PIR, marital status, educational level, smoking status, hypertension status, and diabetes status. To assess multicollinearity among covariates, generalized variance inflation factors (GVIFs) were calculated, and no severe multicollinearity was observed (all values <5) (Supplementary Table 1). All statistical analyses were performed using EmpowerStats (www.empowerstats.com, X&Y Solutions, Inc., Boston, MA) and R software version 4.3.2 (http://www.r-project.org).
Results
Baseline characteristics
Among the 6265 participants included in the analysis, 21.6% had NAFLD, defined by a CAP value of ≥274 dB/m. Participants with NAFLD were significantly older (54.79 ± 19.11 vs. 41.44 ± 23.30 years), were more frequently male (60.66% vs. 51.45%), and had a higher BMI (26.64 ± 2.45 vs. 23.69 ± 3.39 kg/m2) than those without NAFLD (all P < 0.001). They also exhibited less favorable metabolic profiles, with higher TC (189.61 ± 43.85 vs. 175.06 ± 41.28 mg/dL, P < 0.001), LDL-C (113.70 ± 37.44 vs. 101.35 ± 34.39 mg/dL, P < 0.001), and ALT levels (24.00 ± 16.08 vs. 16.76 ± 12.21 U/L, P < 0.001) as well as lower HDL-C levels (50.18 ± 13.42 vs. 56.36 ± 13.96 mg/dL, P < 0.001). Additionally, participants with NAFLD had a higher prevalence of hypertension (38.38% vs. 20.06%) and diabetes (18.38% vs. 6.03%). With respect to ethnicity, Mexican American participants showed a higher prevalence of NAFLD (12.84% vs. 9.00%), whereas non-Hispanic Black participants showed a lower prevalence (10.48% vs. 18.68%) compared with those without NAFLD (Table 1).
Association between NHHR and NAFLD
The association between NHHR and NAFLD was evaluated using three progressively adjusted models. In the unadjusted model (Model 1), NHHR showed a significant positive association with NAFLD (odds ratio (OR), 1.81; 95% confidence interval (CI), 1.71–1.92). This association remained robust after adjustment for age, sex, and race in Model 2 (OR, 1.66; 95% CI, 1.56–1.76) and persisted, although attenuated, in the fully adjusted Model 3 (OR, 1.34; 95% CI, 1.07–1.69). When NHHR was categorized into tertiles (T1, 0.36–1.81; T2, 1.82–2.62; T3, 2.63–9.19), a dose–response relationship was observed. Using the lowest tertile (T1) as the reference, the highest tertile (T3) showed the strongest association with NAFLD in Model 1 (OR, 4.77; 95% CI, 4.05–5.63) and Model 2 (OR, 3.79; 95% CI, 3.19–4.50). Although attenuated, the association remained significant in the fully adjusted Model 3 (OR, 1.40; 95% CI, 1.00–1.96), with a significant trend across tertiles (p for trend = 0.0387) (Table 2).
Association of NHHR with NAFLD in multivariable logistic regression models.

Model 1: unadjusted.
Model 2: adjusted for age, sex, and race.
Model 3: adjusted for age, sex, race, PIR, marital status, educational level, BMI, TC, HDL-C, LDL-C, ALT, AST, smoking status, hypertension status, and diabetes status.
NAFLD: nonalcoholic fatty liver disease; NHHR: non–high-density lipoprotein cholesterol to high-density lipoprotein cholesterol ratio; OR: odds ratio; CI: confidence interval; PIR: poverty–income ratio; BMI: body mass index; TC: total cholesterol; HDL-C: high-density lipoprotein cholesterol; LDL-C: low-density lipoprotein cholesterol; ALT: alanine aminotransferase; AST: aspartate aminotransferase; Ref: reference.
Identification of nonlinear relationship
Figure 2 illustrates the nonlinear association between NHHR and the risk of NAFLD, as assessed using RCS analysis. The red line represents the fitted curve, and the blue lines indicate the 95% confidence intervals. A significant nonlinear relationship was observed (P for nonlinearity < 0.001), with the prevalence of NAFLD showing an overall increasing trend as the NHHR values increased. Further analysis using a two-piecewise linear regression model identified a threshold effect of NHHR on NAFLD risk (Table 3). In the linear regression model, a positive correlation was observed (OR, 1.34; 95% CI, 1.07–1.69). The piecewise linear regression model identified an inflection point at NHHR value of 3.4. Below this threshold, NHHR showed a stronger association with NAFLD (OR, 2.17; 95% CI, 1.51–3.12) than above the threshold (OR, 1.40; 95% CI, 1.11–1.75). The likelihood ratio test (LLR) was statistically significant (P < 0.001), supporting the superiority of the nonlinear model in describing the association between NHHR and NAFLD.

Association between NHHR and NAFLD risk based on GAM. (a) Raw data plot, where each black line represents an individual sample and (b) adjusted smooth curve showing the nonlinear relationship between NHHR and NAFLD. The solid red line indicates the fitted trend, and the blue shaded area represents the 95% CI. All covariates listed in Model 3 were adjusted in the analysis. NHHR: non–high-density lipoprotein cholesterol to high-density lipoprotein cholesterol ratio; NAFLD: nonalcoholic fatty liver disease; GAM: generalized additive model; CI: confidence interval.
Threshold effect analysis for association of NHHR with NAFLD.

All the covariates were adjusted.
NAFLD: nonalcoholic fatty liver disease; NHHR: non–high-density lipoprotein cholesterol to high-density lipoprotein cholesterol ratio; OR: odds ratio; CI: confidence interval; LLR: log-likelihood ratio.
Results of subgroup analysis
Subgroup analyses were performed to examine the association between NHHR and NAFLD across different demographic characteristics, using three progressively adjusted models. In the sex-stratified analysis, the fully adjusted model (Model 3) showed a stronger association in females (OR, 1.70; 95% CI, 1.15–2.51) compared with males (OR, 1.18; 95% CI, 0.87–1.60). Age-stratified analyses revealed differing patterns between age groups. Both age categories showed significant associations in Models 1 and 2; however, in the fully adjusted Model 3, the association remained significant only among participants aged 60 years and older (OR, 1.46; 95% CI, 1.03–2.07), whereas it became nonsignificant in those younger than 60 years (OR, 1.11; 95% CI, 0.80–1.54). For racial and ethnic subgroups, the fully adjusted model (Model 3) indicated that non-Hispanic White participants exhibited the strongest association (OR, 1.68; 95% CI, 1.16–2.42), while the associations were not statistically significant among Mexican Americans (OR, 0.87; 95% CI, 0.44–1.72), non-Hispanic Black participants (OR, 1.73; 95% CI, 0.86–3.45), or other racial groups (OR, 1.05; 95% CI, 0.70–1.57). These results indicate potential demographic differences in the association between NHHR and NAFLD among non-obese individuals (Table 4). Subgroup analyses demonstrated significant interactions for age (P = 0.025) and sex (P = 0.048), but no significant interaction was observed for race (P = 0.108).
Subgroup analysis of association between NHHR and NAFLD.

Model 1: unadjusted.
Model 2: adjusted for age, sex, and race.
Model 3: adjusted for age, sex, race, PIR, marital status, educational level, BMI, TC, HDL-C, LDL-C, ALT, AST, smoking status, hypertension status, and diabetes status. Sex and race were not adjusted in analyses stratified by sex and race, respectively.
NAFLD: nonalcoholic fatty liver disease; NHHR: non–high-density lipoprotein cholesterol to high-density lipoprotein cholesterol ratio; OR: odds ratio; CI: confidence interval; PIR: poverty–income ratio; BMI: body mass index; TC: total cholesterol; HDL-C: high-density lipoprotein cholesterol; LDL-C: low-density lipoprotein cholesterol; ALT: alanine aminotransferase; AST: aspartate aminotransferase.
Sensitivity analyses
Sensitivity analyses using alternative CAP thresholds of 248 dB/m and 288 dB/m yielded results consistent with the primary findings (Supplementary Tables 2 and 3). Across all three regression models, higher values of NHHR remained significantly associated with increased odds of NAFLD. Although the effect estimates were slightly attenuated at both lower and higher thresholds, the overall direction and statistical significance of the associations were maintained, confirming the robustness of the observed relationship.
Discussion
In this cross-sectional analysis of NHANES data from 2017 to 2023, we observed a significant association between elevated levels of the NHHR and a higher prevalence of NAFLD among non-obese adults in the United States. Notably, the association demonstrated a nonlinear pattern, with a stronger correlation observed at NHHR values below 3.4. To the best of our knowledge, this study is the first to specifically examine the relationship between NHHR and NAFLD in a non-obese population, thereby providing novel insights into metabolic health and liver disease risk factors.
Recent studies have examined the association between the NHHR and NAFLD or related conditions, such as hepatic steatosis and liver fibrosis, in US adult populations. A retrospective analysis by Huang et al. used NHANES data from 2017 to 2020, including 6809 individuals. 12 In another study, Yang et al. analyzed NHANES data from 2017 to 2018, comprising 2757 participants. 13 This study specifically assessed the relationship between NHHR and NAFLD, using CAP to evaluate hepatic steatosis. The findings indicated a significant positive association, with individuals in the highest NHHR quartile exhibiting a 228% higher prevalence of NAFLD compared with those in the lowest quartile. Another NHANES-based study by Li et al. analyzed data from 2005 to 2018, including 14,587 participants. 18 This study examined the association between NHHR and hepatic steatosis, NAFLD assessed using the Fatty Liver Index (FLI), and liver fibrosis evaluated with the Fibrosis-4 Index (FIB-4). The findings demonstrated a positive association between NHHR and hepatic steatosis, whereas a negative association was observed with liver fibrosis, indicating a V-shaped relationship. In addition, previous studies have suggested that NHHR may serve as a potential predictor of metabolic syndrome and cardiovascular disease, and its predictive value for other metabolic outcomes has been highlighted in nutritional epidemiology research.19–21
The threshold value of NHHR identified in this study—3.4—may have potential biological significance in discriminating NAFLD risk. Evidence from lipid metabolism research indicates that non-HDL-C reflects the total burden of atherogenic lipoproteins, whereas HDL-C provides anti-inflammatory and antioxidant effects. When NHHR is below 3.4, an increase in non-HDL-C or a modest decrease in HDL-C may indicate early disturbances in lipid metabolism or initial hepatic lipid accumulation, thereby markedly increasing the risk of NAFLD. Beyond this threshold, the liver may enter a metabolic compensation phase, during which the incremental risk tends to plateau. This nonlinear pattern aligns with previous mechanistic studies on cholesterol homeostasis, impaired lipoprotein transport, and hepatocellular steatosis progression.22,23 Therefore, NHHR = 3.4 may represent a potential metabolic threshold associated with NAFLD prevalence, providing a basis for hypotheses in future prospective research.
This finding is associated with previous research by Sun et al., which also identified a nonlinear association, with an inflection point at NHHR = 1.51, suggesting that NHHR may have a threshold effect on NAFLD risk, with greater increases in risk observed at lower NHHR levels before stabilizing at higher values. 12 Moreover, our focus on non-obese adults aligns with a growing body of literature examining NAFLD risk factors in specific subpopulations, including non-obese individuals and adolescents.24,25 However, there are important differences between our study and prior research. First, we specifically targeted non-obese participants, whereas other studies either included individuals with obesity or did not explicitly exclude them. This methodological distinction may have influenced the observed association, as obesity is a well-established risk factor for NAFLD and could confound the relationship between the NHHR and disease prevalence. 26 Second, we identified a saturation point at NHHR = 3.4, beyond which the association with NAFLD risk diminished (OR, 1.40; 95% CI, 1.11–1.75; P = 0.0037). This contrasts with findings by Huang et al., who reported a continuous increase in NAFLD risk across NHHR quartiles without a clear saturation point. 12 These discrepancies may reflect differences in study populations, diagnostic criteria for NAFLD, or statistical modeling approaches. For example, by excluding obese individuals, our study may have captured a distinct metabolic profile in which NHHR plays a more prominent role in NAFLD development, independent of obesity-related factors. 27 Additionally, the use of transient elastography in our assessment, rather than surrogate indices such as the FLI employed by Sun et al., may have contributed to differences in observed associations.12,28 Further research is warranted to clarify these discrepancies and to explore the mechanisms underlying the nonlinear relationship between NHHR and NAFLD risk in non-obese populations.
It is important to note that this study defined “non-obese” as individuals with a BMI below 30 kg/m2, in line with the World Health Organization (WHO) criteria for obesity. However, some prior studies, particularly those investigating “lean NAFLD,” have used a stricter cutoff of BMI <25 kg/m2. Consequently, our study population includes both “lean” and “overweight” non-obese individuals. This broader definition reflects a real-world distribution and enables the assessment of NHHR-related risk across a wider metabolic spectrum. Nonetheless, future research may benefit from conducting subgroup analyses that distinguish between lean (BMI <25) and overweight (BMI 25–29.9) individuals to more precisely characterize differences in risk patterns.
It is important to acknowledge that the participants in this study were exclusively non-obese adults from the United States. This specific population may limit the generalizability of our findings, and caution is warranted when extrapolating the results to other ethnic or geographic groups. Additionally, unique aspects of the US healthcare system, including patterns of access to medical care and lifestyle factors, may further affect the applicability of these findings to other populations. Moreover, CAP is a noninvasive screening tool rather than a histological gold standard and may, under certain conditions, overestimate hepatic steatosis. Furthermore, hypertension and diabetes in the NHANES dataset were determined based on self-reported physician diagnoses, which may be subject to underreporting and should be interpreted with caution. Finally, given the cross-sectional design of NHANES, causal relationships cannot be established; thus, our findings should be interpreted as associations rather than evidence of direct causality. Future studies should aim to include more diverse populations to improve external validity and to better elucidate the complex factors influencing NAFLD across different demographic groups.
Strengths and limitations
This study utilized data from a large, nationally representative US population based on the NHANES, ensuring high data quality and external validity.
Despite careful adjustment for multiple covariates, potential unmeasured confounding factors may still exist and could have influenced the observed associations.
The lack of detailed information on clinical interventions or lifestyle modifications during the initial health stabilization phase may have affected the relationship between the NHHR and NAFLD prevalence.
As the study population was limited to US participants, the findings may not be generalizable to other ethnic or geographic populations, and further validation in diverse cohorts is warranted.
Conclusions
In this cross-sectional study of non-obese US adults, higher NHHR levels were significantly associated with increased NAFLD prevalence, particularly when the NHHR was below 3.4. The association was most pronounced among non-Hispanic White women aged over 60 years. Although these findings underscore the potential utility of NHHR as a screening indicator, they should be considered hypothesis-generating and require confirmation in future longitudinal studies.
Supplemental Material
sj-pdf-1-imr-10.1177_03000605261417053 - Supplemental material for The association between non–high-density lipoprotein cholesterol to high-density lipoprotein cholesterol ratio and nonalcoholic fatty liver disease in non-obese individuals: A cross-sectional study
Supplemental material, sj-pdf-1-imr-10.1177_03000605261417053 for The association between non–high-density lipoprotein cholesterol to high-density lipoprotein cholesterol ratio and nonalcoholic fatty liver disease in non-obese individuals: A cross-sectional study by Shengyi Zhu, Wen Ding, Xiaowei Rui, Yanwen Yao and Linhua Yao in Journal of International Medical Research
Footnotes
Acknowledgments
The authors thank the participants and staff of the NHANES study for their contributions to this research.
Author contributions
ZSY performed the statistical analysis. RXW and YYW cleaned the data. YLH conceived and designed the research. ZSY and DW drafted the manuscript. YLH made critical revisions to the manuscript for key intellectual content.
Data availability statement
Declaration of conflicting interests
The authors declare no competing interests.
Ethics approval
These data are deidentified and publicly available and therefore do not require medical ethics committee approval. Participants provided informed consent prior to participation in the study.
Funding
This work was supported by the Huzhou Science and Technology Program (2021GY22).
Patient and public involvement
Patients and/or the public were not involved in the design, conduct, reporting, or dissemination plans of this research.
Patient consent for publication
Not applicable.
Supplemental material
Supplemental material for this article is available online.
References
Supplementary Material
Please find the following supplemental material available below.
For Open Access articles published under a Creative Commons License, all supplemental material carries the same license as the article it is associated with.
For non-Open Access articles published, all supplemental material carries a non-exclusive license, and permission requests for re-use of supplemental material or any part of supplemental material shall be sent directly to the copyright owner as specified in the copyright notice associated with the article.