
Abstract
Background
Previous research has shown that red cell distribution width and serum albumin concentrations may serve as possible indicators of inflammation and nutritional status. Nevertheless, the relationship between erectile dysfunction and the red cell distribution width to serum albumin ratio (RAR) remains unclear. This study aimed to investigate the association between RAR and erectile dysfunction in a nationally representative cohort of US adults.
Methods
Data for this study were obtained from the National Health and Nutrition Examination Survey conducted between 2001 and 2004. The RAR was calculated by dividing red cell distribution width by serum albumin. Subgroup analyses, restricted cubic spline analysis, and multivariable logistic regression were performed to evaluate the association between RAR and erectile dysfunction. Additionally, receiver operating characteristic (ROC) curve analysis was used to assess the diagnostic performance of RAR for erectile dysfunction.
Results
The study included 3633 participants, of whom 1026 individuals reported erectile dysfunction. After adjustment for various covariates, a significant positive association was observed between the RAR and erectile dysfunction (odds ratio: 1.68, 95% confidence interval: 1.16–2.44, p = 0.012). Higher quartiles of RAR were significantly associated with an increased risk of erectile dysfunction (T3 compared to T1: odds ratio: 1.68, 95% confidence interval: 1.16–2.44, p = 0.012). A smooth curve fitting analysis suggested a linear relationship between RAR and erectile dysfunction, and the positive association between RAR and erectile dysfunction prevalence was further confirmed by interaction tests and stratified analysis. Furthermore, the receiver operating characteristic analysis demonstrated that RAR outperformed conventional serological markers (area under the curve: 0.690). In contrast, albumin yielded an area under the curve of 0.650, red cell distribution width resulted in an area under the curve of 0.656, the platelet-to-albumin ratio had an area under the curve of 0.538, and neutrophil-to-albumin ratio demonstrated an area under the curve of 0.572.
Conclusion
The investigation identifies RAR as a biomarker positively correlated with erectile dysfunction, with particular utility in disease stratification. These findings highlight the potential significance of maintaining an appropriate level of RAR in improving erectile dysfunction.
Keywords
Introduction
The clinical hallmark of erectile dysfunction (ED), a common andrologically significant condition in adult males, is the inability to achieve or sustain the level of penile rigidity required for sexual activity.1–3 Several studies have demonstrated that the incidence of ED increases progressively with age.4–6 An epidemiologic study reported that the incidence of ED among adult males aged 30 years was 19.2%. 7 Relevant studies indicate that the prevalence of ED is 14.8% among males aged 40–59 years and increases to 43.8% in those aged 60–69 years. 8 ED significantly impairs male sexual health and fertility and may also serve as a potential clinical indicator of underlying systemic disease, particularly cardiovascular disease (CVD).9–11
ED has a multifactorial etiology, with atherosclerotic vascular disease and diabetes mellitus (DM) representing two predominant underlying pathologies.12–14 Epidemiological data from US cohort studies indicate that hypoalbuminemia is independently and dose-dependently associated with an elevated risk of ED. 15 Serum albumin (ALB), an essential transporter protein, indicates the nutritional status and also serves as an important marker to assess inflammation and endothelial cell function.16,17 Red cell distribution width (RDW) reflects the degree of heterogeneity in erythrocyte volume18,19 and has long been used as a diagnostic parameter for distinguishing anemia subtypes. A study by Miyataka et al. 20 found that RDW-coefficient of variation (CV) was independently and positively correlated with urinary excretion of liver-type fatty acid-binding protein (L-FABP), suggesting that RDW-CV may serve as a simple and useful biomarker for detecting renal tubular injury in patients with type 2 diabetes. Liu et al. 21 reported that elevated RDW-to-ALB ratio (RAR) was independently associated with clinically relevant depression, highlighting its potential as a novel biomarker for mental health risk assessment. Additional studies have demonstrated that RAR exhibits high sensitivity and specificity in predicting major complications and mortality in patients with perforated peptic ulcers. Moreover, when combined with traditional risk factors in clinical practice, it holds significant potential as a prognostic marker. 22 Studies have shown that elevated RAR in patients with type 2 DM is associated with poorer renal outcomes, indicating its potential as a predictive tool for renal prognosis. 23 RAR is independently associated with all-cause mortality and cause-specific mortality in adults with prehypertension and hypertension, warranting its inclusion in clinical risk stratification. 24 Recent studies have shown that RDW may serve as a new indicator for the prediction of ED.25–27 However, the predictive performance of these individual biomarkers remains limited. 28 The RAR has recently emerged as a novel composite biomarker that integrates the advantages of both RDW and ALB, providing a more comprehensive reflection of systemic inflammation status and nutritional condition. 29 Previous studies have demonstrated that RAR is a predictive biomarker for CVD and diabetes risk assessment.30,31 However, its potential association with ED has not yet been fully elucidated.
Conventional studies in this domain have faced methodological limitations, including restricted cohort sizes and insufficient demographic heterogeneity. Analysis of population-based survey data with national representation (such as the National Health and Nutrition Examination Survey (NHANES)) provides enhanced statistical power and generalizability for evaluating this relationship and its potential clinical significance across diverse populations. Utilizing data from the NHANES from 2001 to 2004, this study aimed to assess its predictive performance.
Research design and methods
Research and participants
Our dataset comprised the NHANES 2001–2004 survey cycles (2001–2002 and 2003–2004), which were selected because they exclusively included the validated erectile function measures within these periods. This selection criterion ensured consistency with established NHANES-based ED research methodologies and enhanced data comparability.32–34 NHANES is a nationally representative surveillance system that employs stratified, multistage probability sampling to collect multidimensional health data from the US civilian population. The innovative design of the research integrates questionnaire data obtained through structured interviews with clinically derived measurements from physical examinations and sophisticated laboratory analyses, creating a robust epidemiological resource for assessing population health trends and nutritional biomarkers.35–37 The survey encompasses data on demographics, socioeconomic status, dietary habits, and health collected through in-person interviews, physical assessments, and comprehensive laboratory analyses. RDW is a clinically useful indicator of red blood cell volume variability that aids in the diagnosis of anemia. Nevertheless, current research indicates that RDW may also act as a novel marker for ED. The study incorporates data on population demographics, socioeconomic status, dietary habits, and health-related factors collected through in-person interviews, physical assessments, and comprehensive laboratory analyses.38,39 Our analysis based on NHANES data from 2001 to 2004 originally included 21,161 individuals within the study cohort. Female participants (n = 10,860) were excluded from the analysis. Furthermore, participants with incomplete data on essential ED indicators (n = 6185) and partial RAR data (n = 166) were also excluded. Finally, 317 participants with missing information on relevant covariates were excluded, resulting in a final study population of 3633 participants, as illustrated in Figure 1.
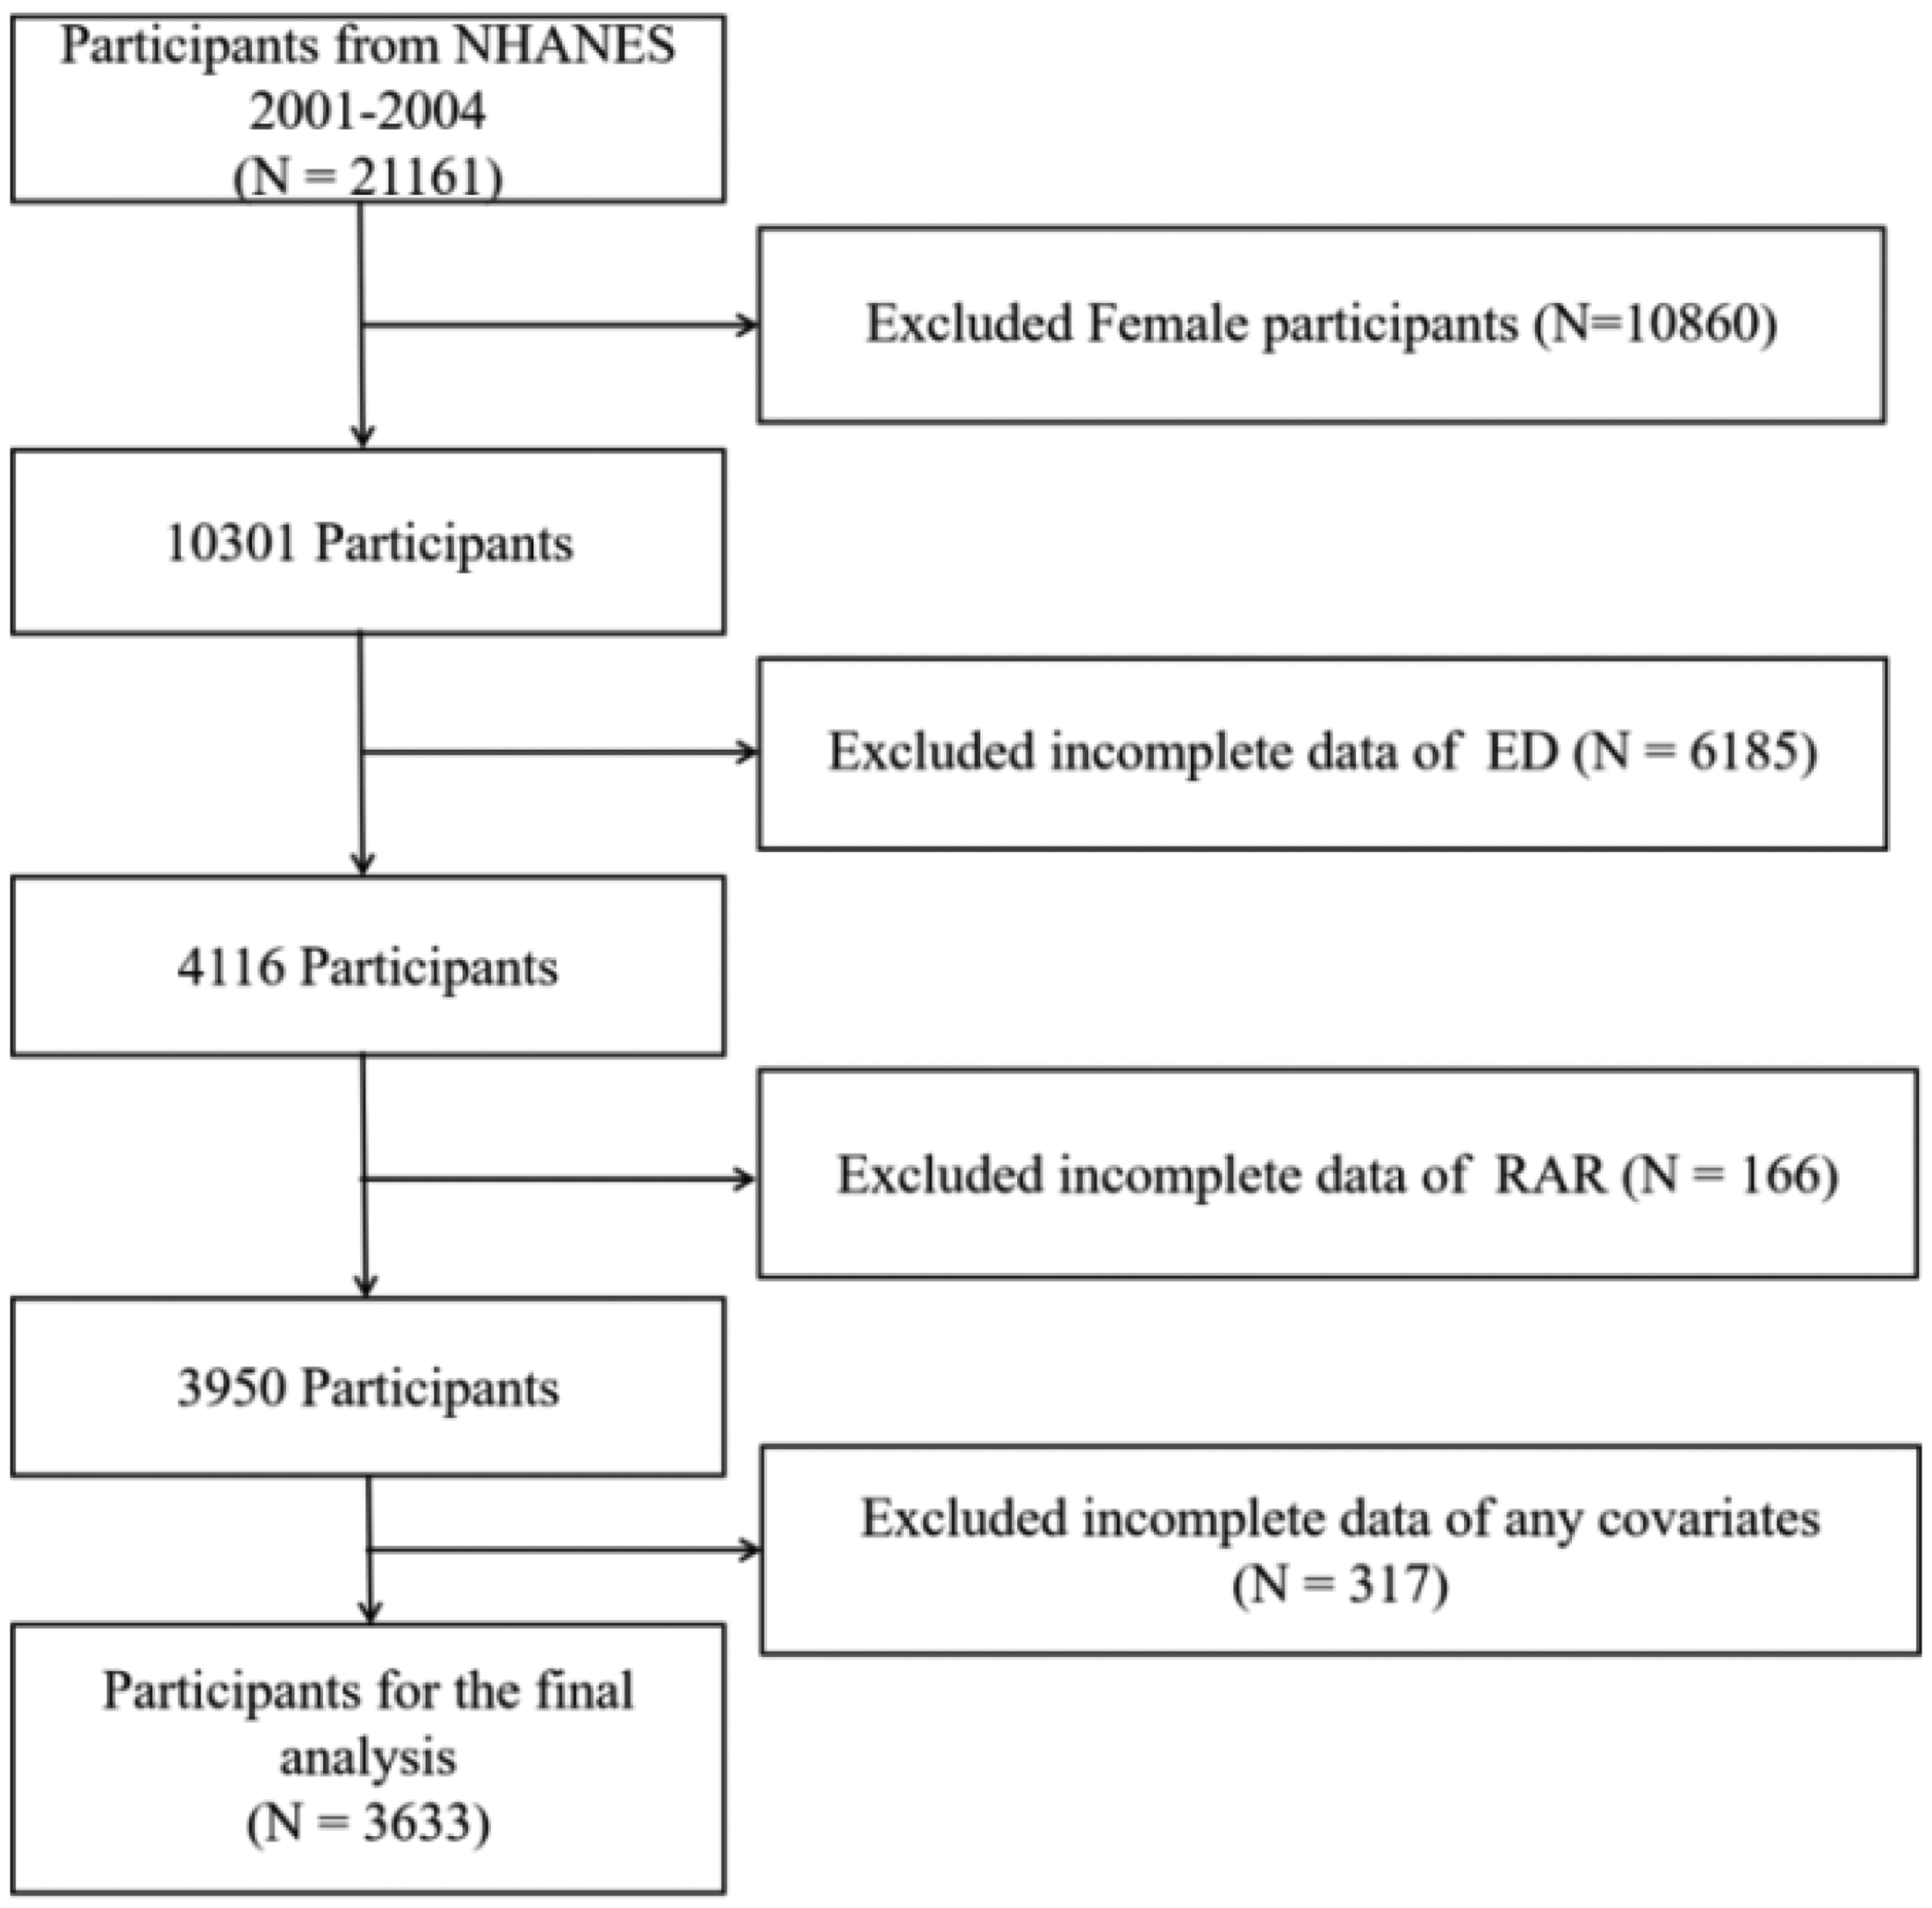
Participant enrollment flowchart.
Research data compilation
Exposure variable: RAR. Blood samples were collected at the NHANES Mobile Examination Center (MEC). RDW was measured as part of a complete blood count analysis using a Beckman Coulter Maximum Model (MAXM) analyzer. This instrument uses Beckman Coulter’s proprietary methodology for automated sample processing, including cell enumeration, size determination, dilution, and mixing. 40 The two-color digital endpoint technique known as DcX800 assesses the concentration of serum ALB. This method includes the formation of a complex between serum ALB and the Bromcresol Purple reagent. 41 We calculated RAR using the formula: RDW (in %)/ALB(in g/dL).
Study outcome measure: ED. ED assessment was conducted in a private setting within the MEC using an audio-enhanced computer-assisted self-interview. A single-item questionnaire derived from the Massachusetts Male Aging Study was utilized for the assessment, asking the participants to rate their ability to achieve and maintain an erection sufficient for satisfactory sexual activity. Response answers included the following: “usually able,” “sometimes able,” “always or almost always able,” and “never able.” For analytical purposes, ED was defined as affirmative answers that were “sometimes able” or “never able.” Conversely, those who endorsed “usually able” or “always or almost always able” were categorized as non-ED patients.
Covariates.
1. Sociodemographic characteristics. The potential influence of NHANES on ED is significant. Participant demographic data were collected via a self-administered questionnaire, including information on age and ethnicity. Ethnicity was categorized as Mexican American, non-Hispanic Black, non-Hispanic White, or other. Marital status was categorized as living alone or cohabiting. Educational attainment was categorized as having completed ≤ high school and > high school. Body mass index (BMI) was calculated as weight (kg)/height (m).2,42
2. Lifestyle characteristics. Smoking status was categorized into three groups: never, currently, and former smokers. Alcohol consumption was categorized as light, moderate, and heavy.
Definitions of smoking frequency and level of alcohol consumption are provided in Table 1. The term “nonsmoker” is used to describe men who have smoked fewer than 100 cigarettes in their lifetime. The term “alcohol intake” was defined as the consumption of at least 12 alcoholic beverages in the past 12 months.
The detail definition and classification of covariates.

BMI: body mass index; CVD: cardiovascular disease; DM: diabetes mellitus; MCQ: multiple choice questionnaire; SP: standardized patient.
3. Comorbidities. Self-reported diagnosis, usage of glucose-lowering drugs, fasting abdominal glucose > 7.0 mmol/L, random or 2 h oral glucose tolerance test (OGTT) glucose ≥ 11.1 mmol/L, or glycated hemoglobin (HbA1c) ≥ 6.5% were all considered indicators of diabetes. Hypertension was diagnosed by blood pressure (BP) ≥140/90 mmHg or through verified antihypertensive medication use. 43 People with a history of clinically verified cardiovascular problems (congestive heart failure, coronary artery disease, angina, myocardial infarction, or stroke) are referred to as having CVD. 44 According to the World Health Organization guidelines, the criterion for defining a patient with anemia is a hemoglobin level below 12 g/dL for women and below 13 g/dL for men. Hyperlipidemia was diagnosed based on established lipid profile criteria or documented history of lipid-lowering pharmacotherapy (Table 2). 45
Weighted characteristics of the study population. a
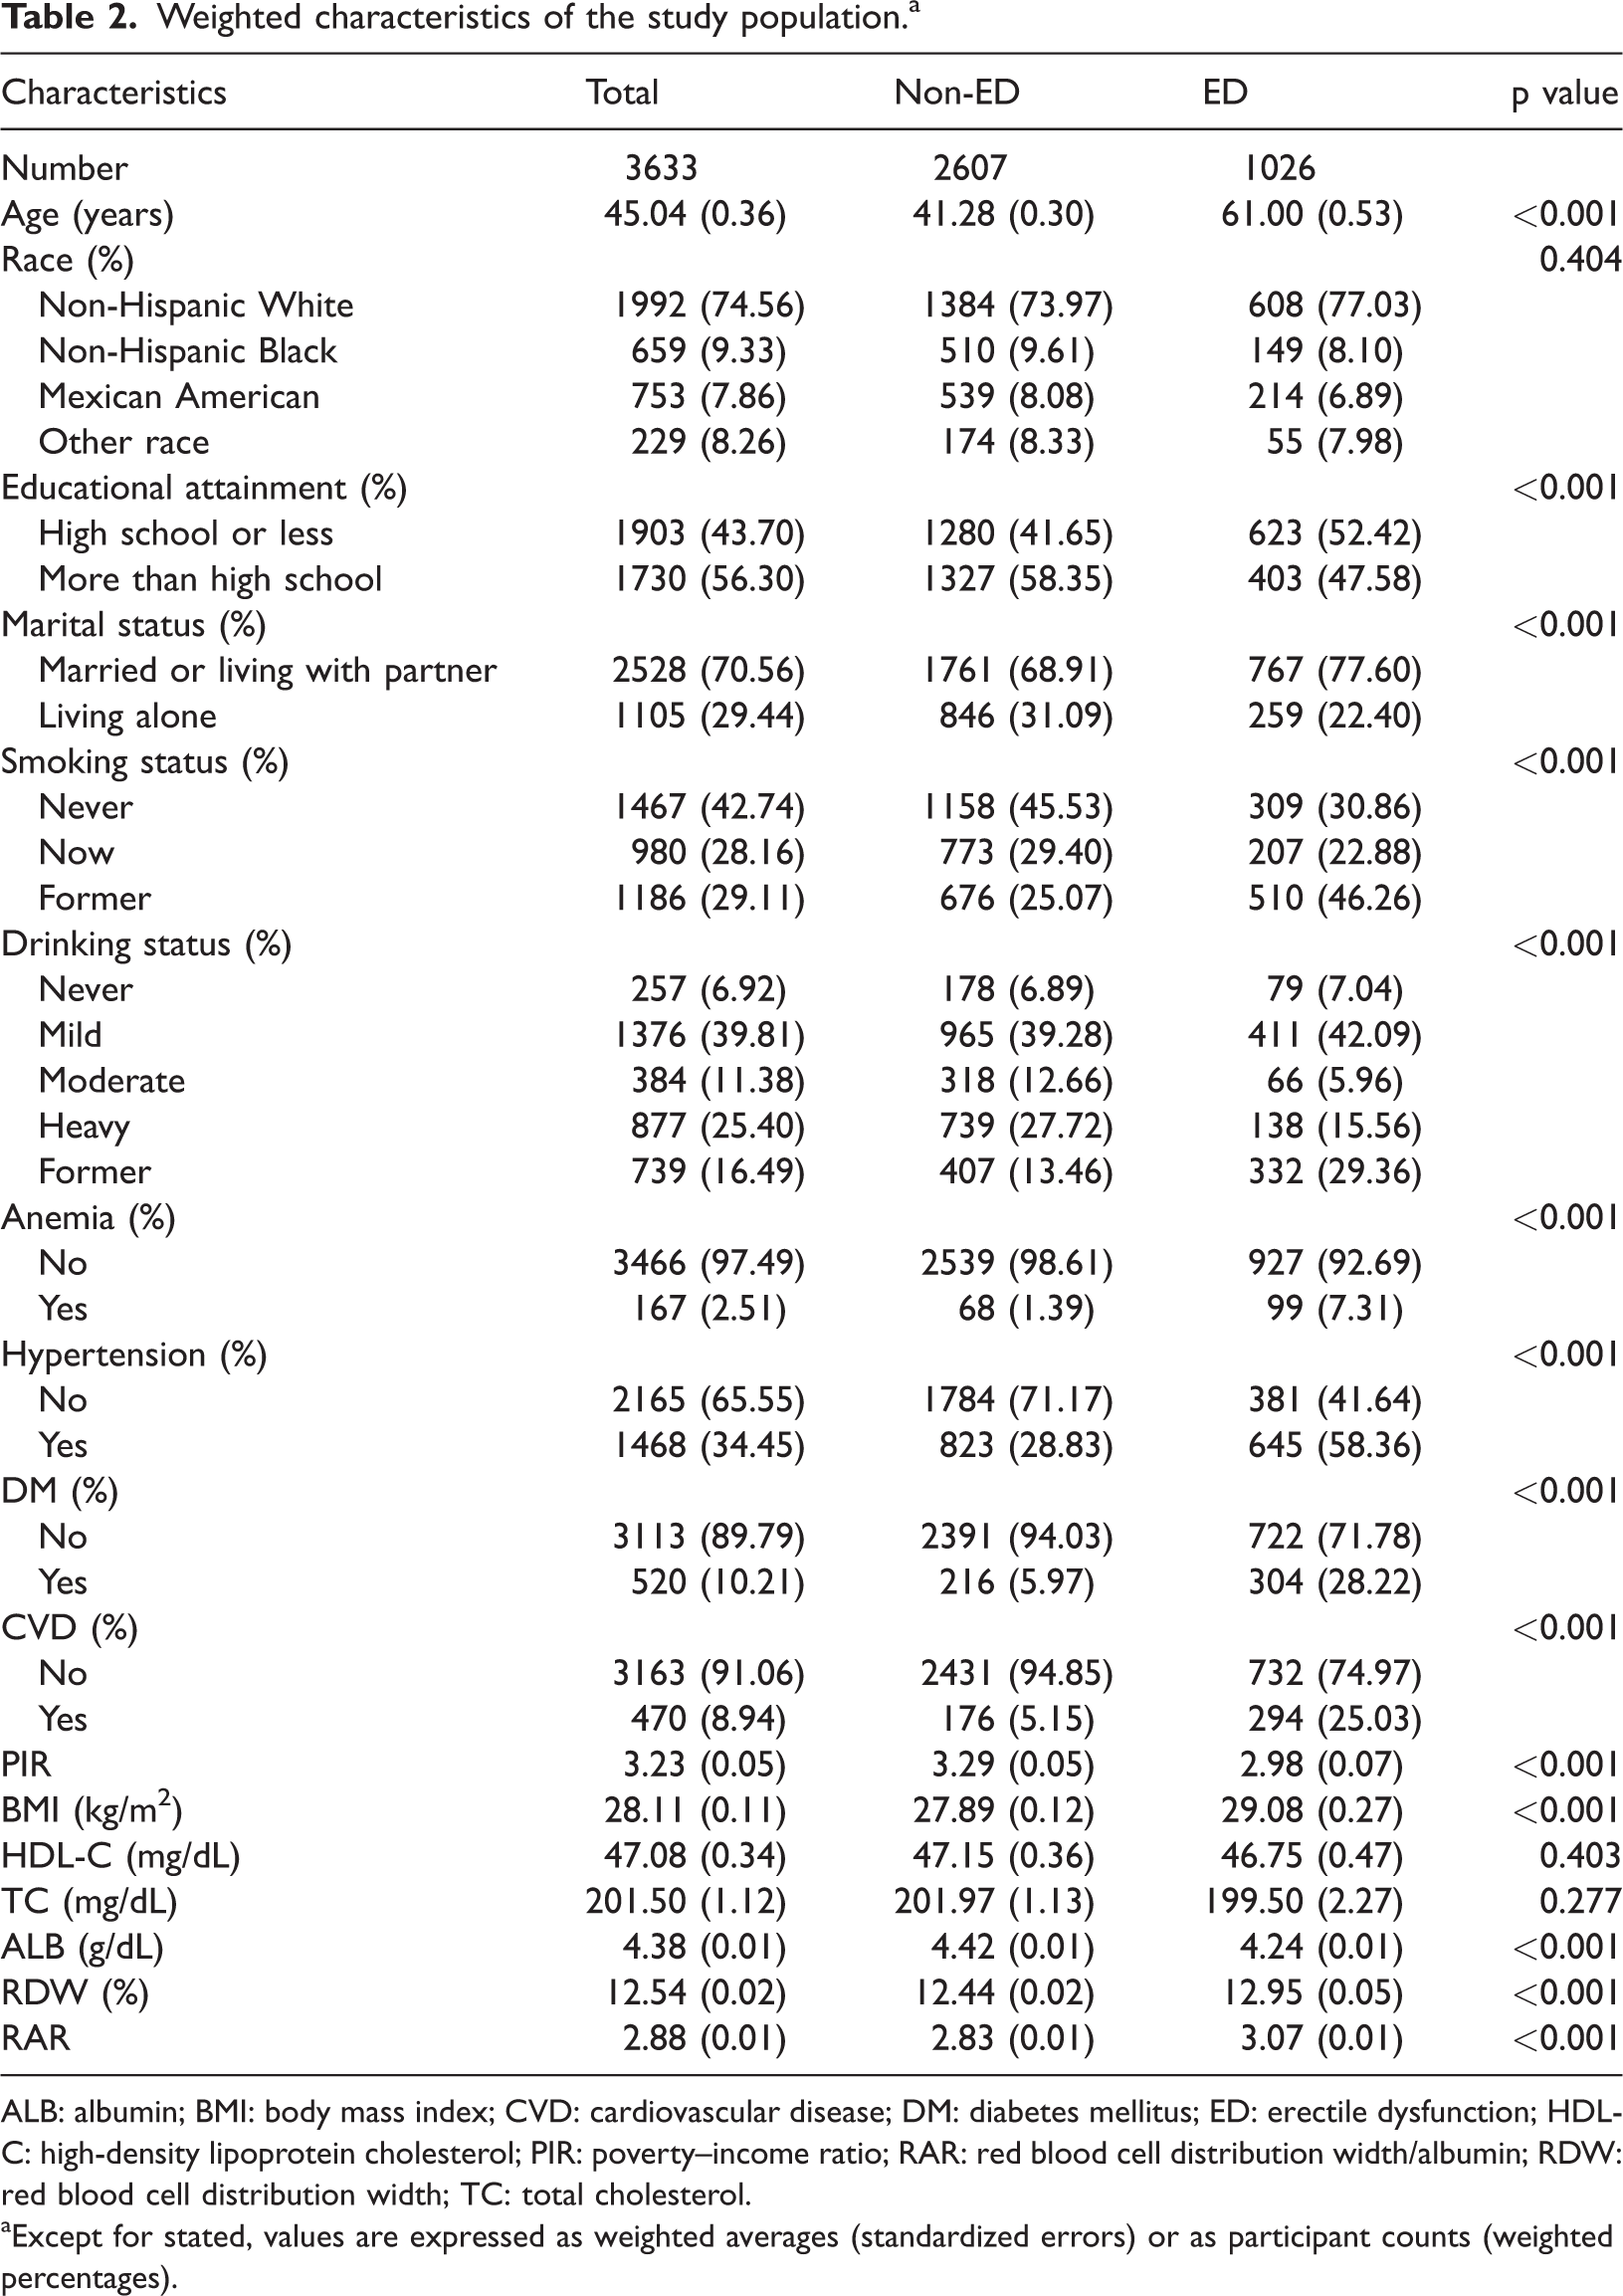
ALB: albumin; BMI: body mass index; CVD: cardiovascular disease; DM: diabetes mellitus; ED: erectile dysfunction; HDL-C: high-density lipoprotein cholesterol; PIR: poverty–income ratio; RAR: red blood cell distribution width/albumin; RDW: red blood cell distribution width; TC: total cholesterol.
Except for stated, values are expressed as weighted averages (standardized errors) or as participant counts (weighted percentages).
We further analyzed the relationship between the ratio of non-HDL/HDL cholesterol and cardiovascular risk markers in the study cohort.
Statistical methods
In accordance with the NHANES guidelines, the survey employed suggested sample weights to enhance the accuracy of the data and reduce the effects of a complicated multistage sampling design. Weighted percentages are used in statistical studies to display the findings for categorical variables, which reflect the intricate survey design of NHANES. Continuous variables were analyzed using one-way analysis of variance. Continuous variables were shown as means ±standard errors. Categorical variables were represented as frequencies with their respective survey-weighted percentages and evaluated using weighted chi-square tests. To explore the possible results, this research employed weighted multivariable logistic regression to analyze associations between RAR and ED. These analyses took into consideration a range of confounding factors and were adjusted for continuous and interquartile outcomes. Three different models were constructed for this analysis.
None of the variables were controlled for in the original model (Model 1). Significant demographic characteristics were adjusted for in the second model (Model 2). In particular, the model takes into account factors such as race/ethnicity, age, sex, education level, and whether a person is single or married. The most complete model, Model 3, was developed from the second model by adjusting for factors such as age, race, educational level, marital status, BMI, poverty–income ratio (PIR), drinking and smoking status, high-density lipoprotein cholesterol (HDL-C), total cholesterol (TC), CVD, hypertension, DM, and anemia.
The study used weighted restricted cubic spline curves (RCS) derived from Model 3 to explore the possible nonlinear relationship between RAR and ED, with adjustments for age category, sex, education level, marital status, smoking history, and chronic comorbid conditions. The RCS analysis was performed with four knots placed at the 5th, 35th, 65th, and 95th percentiles of the RAR distribution. The novel biomarker utility of RAR in predicting ED was subsequently assessed by analyzing receiver operating characteristic (ROC) curves and quantifying the area under the curve (AUC). Platelet-to-ALB ratio (PAR) and neutrophil-to-ALB ratio (NAR) are noninvasive biomarkers of inflammation, applicable to the evaluation and diagnosis of ED. The Youden Index was utilized to identify the most effective diagnostic thresholds for RAR, ALB, RDW, PAR, and NAR in relation to the diagnosis of ED. All analyses were performed using R 4.2.2, with a p value <0.05 considered statistically significant.
Results
The association between ALB levels and ED prevalence was examined using weighted logistic regression models, utilizing various adjustment strategies. The association between RAR and ED is presented in Table 3. When modeled as a continuous variable, RAR was associated with odds ratios (ORs) of 6.64 (p < 0.001), 2.22 (p < 0.001), and 1.66 (p < 0.05) in Models 1, 2, and 3, respectively. In the unadjusted, crude Model 1, participants in the higher RAR tertiles (T2 and T3) exhibited a significantly higher risk of ED compared to those in the lowest tertile (T1) (OR: 5.32, 95% confidence interval (CI): 3.93–7.20, p < 0.001, and OR: 2.52, 95% CI: 1.93–3.30, p < 0.001, respectively). After sequential adjustment, this association remained significant in Model 2 (adjusted for age, race, education level, and marital status), particularly for the highest tertile (OR: 2.06, 95% CI: 1.49–2.85, p < 0.001). In the final, fully adjusted Model 3 (adjusted for age, race, education level, marital status, BMI, household income to PIR, smoking status, alcohol consumption, HDL-C, TC, CVD, hypertension, DM, and anemia), both the comparison of the highest and lowest tertiles and continuous RAR values demonstrated consistent results (OR: 1.68, 95% CI: 1.16–2.44, p = 0.012).
Weighted multivariate logistic regression analysis of RAR and ED. a
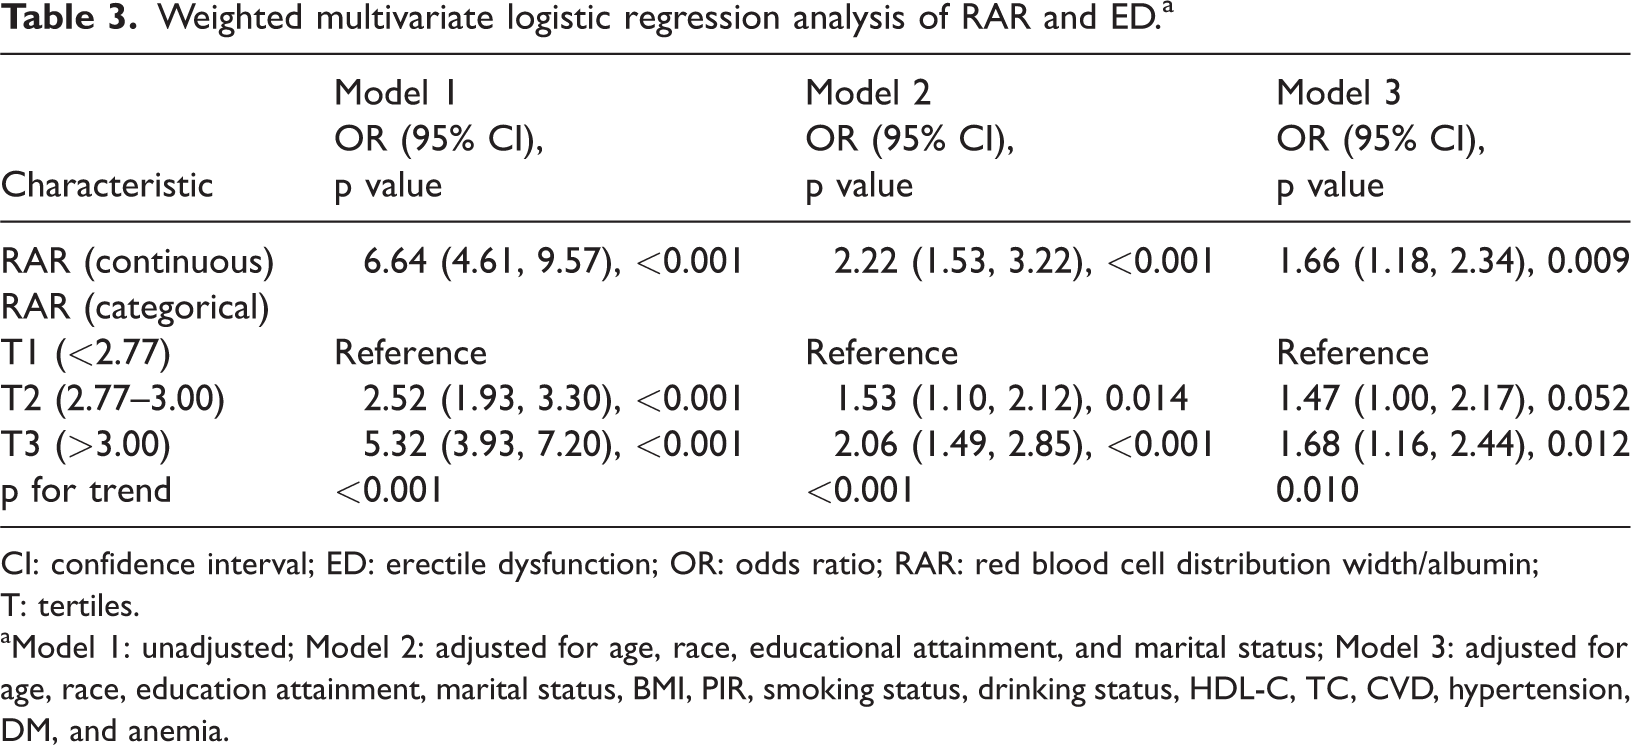
CI: confidence interval; ED: erectile dysfunction; OR: odds ratio; RAR: red blood cell distribution width/albumin; T: tertiles.
Model 1: unadjusted; Model 2: adjusted for age, race, educational attainment, and marital status; Model 3: adjusted for age, race, education attainment, marital status, BMI, PIR, smoking status, drinking status, HDL-C, TC, CVD, hypertension, DM, and anemia.
Dose–response analysis of RAR for ED
To further investigate the relationship between RAR and ED, a logistic regression model was employed in an RCS analysis. This analysis took into account a variety of confounding factors, such as demographic characteristics (including age, race, education, marital status, BMI, and PIR) as well as lifestyle elements (which encompassed physical activity, smoking habits, alcohol consumption, and existing comorbidities such as hypertension, hyperlipidemia, DM, and cardiovascular issues). The RCS curves effectively revealed a positive relationship between RAR levels and the degree of ED risk, with no significant inflection points, indicating a steady linear relationship in Figure 2.
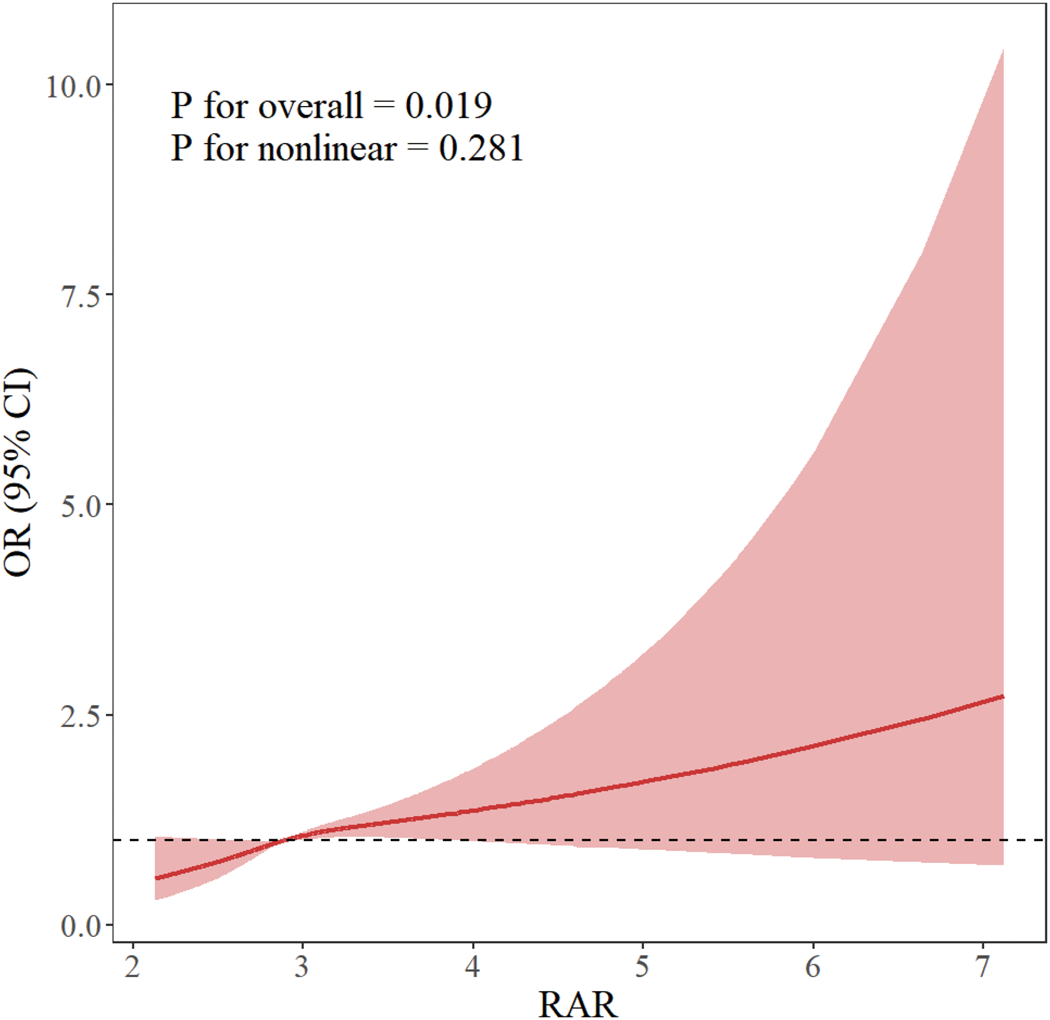
Relationship of RAR with ED. Age, race, educational attainment, marital status, BMI, PIR, drinking and smoking habits, HDL-C, TC, CVD, hypertension, DM, and anemia were among the adjustment factors (The solid line represents the adjusted OR, and the shaded area represents the 95% CI). BMI: body mass index; CI: confidence interval; CVD: cardiovascular disease; DM: diabetes mellitus; ED: erectile dysfunction; HDL-C: high-density lipoprotein cholesterol; OR: odds ratio; PIR, poverty–income ratio; RAR: red cell distribution width to albumin ratio; TC: total cholesterol.
Subgroup analyses
To better clarify the relationship between RAR and ED in different populations, we performed a range of subgroup analyses. In these analyses (Figure 3), subgroups were defined according to age, education, smoking level, BMI, presence of anemia, hypertension, DM, and cardiovascular events. The results demonstrated a significant effect of smoking status on the association between the risk of developing RAR and ED, with a particularly higher risk in former smokers (p = 0.036, OR = 2.57, 95% CI: 1.53–4.33). The associations between RAR and ED incidence risk for other subgroup variables that included age, education, smoking status, BMI, anemia, hypertension, DM, and CVD were not significant, and none of them had a significant interaction (p > 0.05).

Subgroup analyses between RAR and ED. ED: erectile dysfunction; RAR: red cell distribution width to albumin ratio.
Comparison of RAR, ALB, RDW, PAR, and NAR as diagnostic indicators of ED
ROC analysis (Table 4 and Figure 4) demonstrated that the performance of RAR in the diagnosis of ED (AUC: 0.693) was higher than that of ALB (0.517), RDW (0.554), PAR (0.295), or NAR (0.602). The Delong’s test confirmed that the diagnostic performance of RAR for ED was significantly superior to that of other biomarkers (p < 0.001).
The AUC of the RAR, ALB, RDW, PAR, and NAR for the risk of ED.

ALB: albumin; AUC: area under curve; ED: erectile dysfunction; NAR: neutrophil-to-albumin ratio; NPV: negative predictive value; PAR: platelet-to-albumin ratio; PPV: positive predictive value; RAR: red cell distribution width to albumin ratio; RDW: red blood cell distribution width; CI: confidence interval.
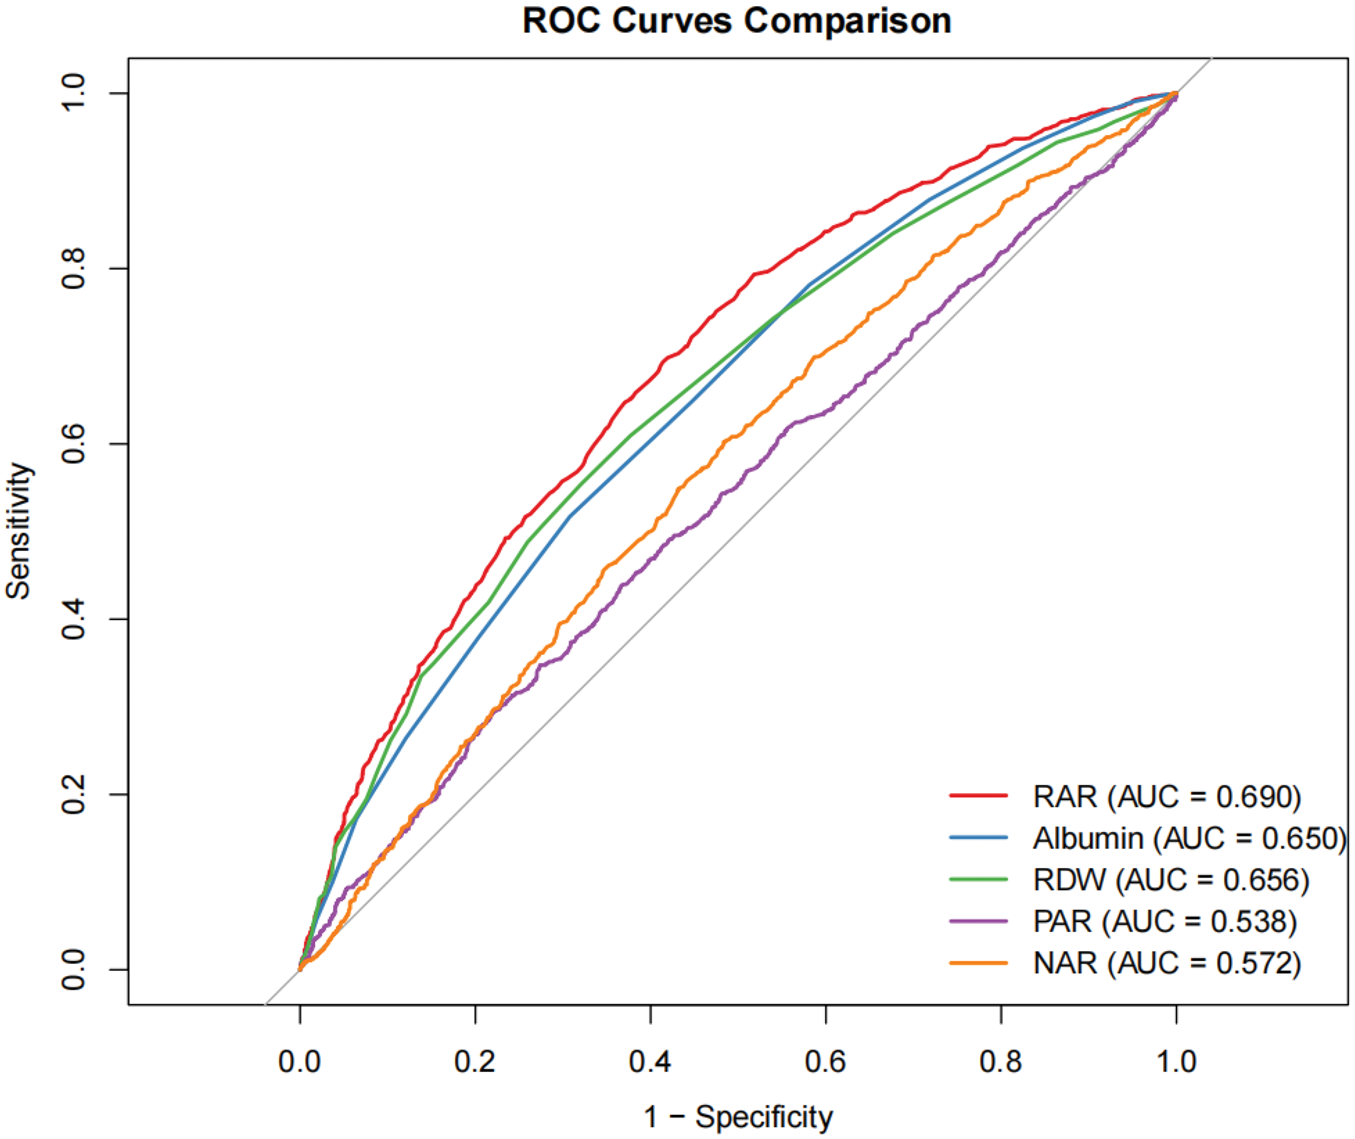
The ROC curves of the RAR, ALB, RDW, PAR, and NAR for ED. ALB: albumin; ED: erectile dysfunction; NAR, neutrophil to albumin ratio; PAR, platelet-to-albumin ratio; RAR: red cell distribution width to albumin ratio; RDW: red blood cell distribution width; ROC: receiver operating characteristic.
Discussion
This study pioneers a novel approach by exploring the association of RAR and ED prevalence using a cross-sectional analysis. After adjustment for a wide range of potential confounders, the study demonstrated that RAR remained an independent potential diagnostic factor associated with ED in weighted multivariable logistic regression models. RCS analysis revealed a linear relationship between RAR levels and the probability of ED. Subgroup analyses indicated that factors such as age, educational attainment, smoking status, BMI, anemia, hypertension, DM, and CVD modulate the likelihood of ED. Comparative analyses with other hematological parameters, including ALB, RDW, PAR, and NAR, demonstrated the superior diagnostic performance of RAR for ED. The findings demonstrated the specific effectiveness of RAR as an indicator of ED occurrence, with elevated RAR levels correlating with an increased ORs for developing ED.
The RAR biomarker synergistically integrates inflammatory and nutritional parameters, providing a multidimensional evaluation of overall health that surpasses individual marker analysis. Unlike isolated RDW measurements—principally indicative of red blood cell heterogeneity—or ALB levels, which predominantly signal nutritional status, RAR uniquely characterizes the dynamic interactions among inflammatory processes, oxidative damage, and vascular function.46,47 This integrative characteristic may enhance the detection of ED susceptibility, particularly in individuals with metabolic abnormalities. 48
In this study, RDW represents a quantitative measurement of variation in red blood cell size (anisocytosis), while ALB reflects a serum protein that reflects nutritional status and systemic inflammation. RAR, calculated as the ratio of these two parameters, was utilized to assess an individual’s inflammatory state and erythrocyte function. Through several mechanisms, higher plasma ALB levels may reduce the risk of ED. First, more ALB has the ability to absorb and store NO, a vital vasodilating molecule that is necessary to sustain an erection. This, in turn, ensures that the corpus cavernosum’s smooth muscle is then better relieved by NO, thereby promoting cavernosal engorgement and facilitating erectile function. 49 Second, the antioxidant and anti-inflammatory properties of ALB may mitigate endothelial cell damage caused by free radicals and reactive oxygen species (ROS). By preserving endothelial integrity, ALB helps maintain the vasodilatory capacity of the corpus cavernosum.50–52 Furthermore, ALB contributes to androgen transport, helping maintain free testosterone levels that support erectile reflex sensitivity. 53 Therefore, it is biologically plausible that moderately elevated plasma ALB levels may ameliorate hemodynamic regulation required for erectile function through the aforementioned mechanisms, potentially reducing the risk of ED.
At lower RAR levels (<2.77), the increased risk of ED may arise from the combined impact of low ALB levels and increased RDW. Low ALB levels, indicative of malnutrition or chronic inflammation, negatively affect the production of endothelial nitric oxide (NO)—an essential factor for erectile function—and reduce the availability of testosterone by interfering with steroid hormone transport.54,55 The antioxidant properties of ALB mitigate oxidative stress; its deficiency permits the uninhibited accumulation of ROS, thereby exacerbating endothelial dysfunction. Concurrently, elevated RDW reflects inflammation- or oxidative stress-driven erythrocyte heterogeneity, which has been associated with impaired microvascular perfusion. 56 Research has indicated that increased RDW correlates with reduced NO-mediated vasodilation, a pivotal deficit in the pathophysiology of ED. 57 In ED at low RAR values, these converging pathways may create a confluence of circumstances where nutritional inadequacies and inflammation combine to upset hormonal and vascular balance.
Once a certain threshold of retinol activity equivalents (RAR > 3.00) is reached, the observed stabilization in ED risk may reflect compensatory responses to chronic inflammatory conditions. Sustained inflammatory states may activate counter-regulatory mechanisms, including the enhanced expression of anti-inflammatory mediators (e.g. interleukin (IL)-10) and endogenous antioxidant defenses, potentially attenuating endothelial injury. 58 Furthermore, prolonged periods of hypoxia could stimulate angiogenesis via vascular endothelial growth factor, potentially augmenting collateral circulation to tissues, even in the presence of systemic inflammation.59,60 The extent of this compensation, however, is likely finite, which might account for the diminished increase in risk observed at elevated levels of RAR. It is also important to acknowledge that unquantified confounding variables, such as subclinical hepatic dysfunction or deficiencies in micronutrients, may modulate both RDW and concentrations, thus potentially obscuring the nonlinear relationship under investigation. 61 Future investigations should address these factors to better elucidate the underlying mechanisms.
The well-established association between ED and coronary artery disease is well documented, proposing ED and vascular aging as key mechanisms underlying the pathophysiology. RDW, recognized as a biomarker of vascular aging, has also been shown to correlate with CVD. Given that coronary artery disease and ED share common pathophysiological etiologies, RDW could be a helpful metric for assessing and forecasting ED, according to several investigations. Additionally, ED has been associated with obstructive sleep apnea syndrome, and extracorporeal shockwave therapy serves as an effective treatment for ED without compromising reproductive or testicular hormonal function.62,63 Consequently, the observed relationship between RAR and ED appears robust and warrants further investigation in future research.
Strengths and limitations
This study has several potential advantages. First, to the best of our knowledge, this is among the early large-scale, cross-sectional studies utilizing the NHANES data to investigate the relationship between RAR and ED in a nationally representative sample of US adults, identifying a positive and linear relationship. Second, the study used some statistical techniques such as multivariable logistic regression, RCS analysis, and stratified subgroup analyses as well as sample weights and adjustments for a variety of potential confounders. These methodological decisions enhance the findings’ accuracy and resilience. The study concludes by comparing RAR’s diagnostic performance with other indicators in detecting ED, demonstrating that RAR has better diagnostic potential.
When analyzing the data, it is important to consider several limitations. 1. This study’s cross-sectional methodology and retrospective evaluation of ED make it impossible to establish a causal link between RAR and ED. 2. Because the study population was geographically confined, the findings may only be applicable to populations living in the United States. 3. Limited by the constraints of research time, the use of NHANES 2001–2004 data, although robust, may not capture recent shifts in ED prevalence or management. Future studies are needed to validate these findings in more recent cohorts. 4. ED was assessed via self-report, which may introduce misclassification bias. Clinical validation tools (e.g. International Index of Erectile Function (IIEF)-5) were unavailable in the NHANES, potentially affecting outcome accuracy. It is possible that participants’ memories do not always reflect their current state of health. The specificity may decrease due to an increase in false positives. Single-item self-assessment tools (such as the one used in this study) often misclassify temporary erectile difficulties (e.g. those caused by fatigue or stress) as ED, while also incorrectly including some non-ED patients with elevated RAR into the case group, diluting the true exposure-outcome association and resulting in lower specificity compared to gold standards such as IIEF-5. The sensitivity may be limited due to the risk of false negatives. Social desirability bias may lead patients to avoid reporting sensitive symptoms, while those with lower health literacy may misinterpret questions and fail to report genuine symptoms, leading to some true patients with ED being incorrectly classified into the control group. The research findings may be potentially impacted, as nondifferential misclassification (false positives unrelated to RAR) could lead to a conservative bias, driving the OR toward the null value, while differential misclassification (inflammatory patients being more likely to self-report ED) might exaggerate the association between RAR and ED. Additionally, measurement errors could result in the observed AUC (0.693) being lower than the true value. Finally, it is impossible to completely rule out the possibility of residual confounding from unknown or unmeasured variables. The self-reported measure of ED, without clinical validation (e.g. IIEF-5), is a key limitation that could introduce misclassification bias. We also more strongly caution against generalizing the findings beyond the US population and note that the 2001–2004 data may not reflect current trends.
The measurement of RAR is a one-time assessment, which inherently comes with limitations. RAR is calculated based on two dynamically changing indicators: RDW and ALB, both of which can exhibit temporary fluctuations due to short-term physiological or pathological conditions. As a result, a single time-point RAR value may not accurately reflect an individual’s long-term RAR level and may fail to capture short-term variations, leading to “exposure misclassification.” Such short-term fluctuations may have a dual impact on the accuracy of research findings. For individuals whose true long-term RAR level is near the cutoff value, random variations in a single measurement could lead to their misclassification into either the high-risk or low-risk group. Additionally, it may be difficult to distinguish between the clinical significance of “transient abnormalities” and “persistent abnormalities.” From the perspective of disease mechanisms, the pathophysiology of ED involves long-term pathological changes such as vascular endothelial dysfunction, chronic inflammation, and nutritional and metabolic disturbances. Its association with biomarkers is more likely to reflect long-term exposure levels rather than short-term transient abnormalities. A single time-point measurement cannot distinguish whether an elevated RAR is due to a “transient abnormality” (such as short-term stress or acute illness) or a “persistent abnormality” (such as chronic inflammation or long-term malnutrition), and the mechanisms and impact of these two types of abnormalities on ED may differ.
From the perspective of long-term variability, based on existing clinical evidence, both RDW and ALB exhibit significant long-term within-individual variability. Their combined effect makes the long-term variability of RAR even more pronounced. This long-term variability may lead to substantial differences between a participant’s RAR level at baseline (2001–2004) and their RAR level during the critical window for ED onset (e.g. 5–10 years after baseline), thereby affecting the accuracy of the association analysis. Regarding the strength of association, if some patients with ED in this study had a temporarily low RAR at baseline (e.g. due to short-term nutritional improvement causing elevated ALB) but exhibited persistently high RAR during the critical period before ED onset, then an analysis based on single time-point baseline data would underestimate the true association strength between RAR and ED. Conversely, if some non-ED participants had a temporarily high RAR at baseline (e.g. due to acute inflammation causing elevated RDW) but subsequently saw their RAR return to normal, this would lead to an overestimation of the association strength, potentially even causing bias in the direction of the association. The association result derived from single time-point data in this study may not represent the true risk effect and requires further validation through long-term repeated-measurement data. This study, through ROC analysis, confirmed that the AUC for RAR in diagnosing ED is 0.690, which is superior to single biomarkers such as ALB (0.650) and RDW (0.656), suggesting its potential clinical application value. However, this conclusion is based on single time-point measurement data. If RAR exhibits significant long-term variability, its diagnostic stability and predictive accuracy would be challenged, consequently affecting its effectiveness in clinical application scenarios. From a disease prediction standpoint, the onset of ED is a long-term process, requiring biomarkers to predict risk well before the disease manifests. Single time-point measurement cannot reflect the long-term trend of RAR. Subsequent research will involve prospective repeated-measurement cohort studies, where participants’ RAR will be measured multiple times (e.g. annually for 3–5 years). By calculating long-term averages and trend indicators (e.g. annual rate of change) of within-individual RAR, we can more accurately assess the association between long-term RAR exposure levels and ED. This design can not only reduce exposure misclassification caused by short-term fluctuations but also clarify the temporal sequence between RAR trends and ED onset, strengthening the credibility of causal inference. For example, participants could be categorized into groups based on long-term RAR trends, such as “consistently normal,” “consistently elevated,” “initially high then decreasing,” and “initially low then increasing.” Comparing the differences in ED incidence among these groups could reveal the impact of long-term RAR change patterns on ED risk, providing more detailed evidence for mechanistic research.
Although RAR’s overall linear association with ED was robust, its predictive strength varied by smoking status. This suggests that RAR may be particularly useful in populations with heightened inflammatory burden, although further studies are needed to define optimal thresholds for clinical use.
Meanwhile, when our analysis rigorously adjusted for a wide range of demographic, lifestyle, and clinical covariates, the potential influence of unmeasured confounders cannot be entirely ruled out. For instance, hormonal profiles (e.g. testosterone levels) and specific medications (e.g. antidepressants and antihypertensives), known to affect erectile function, were not accounted for in our models due to data limitations. These factors may independently alter both RAR levels (via inflammatory or nutritional pathways) and ED risk, thereby introducing residual confounding.
Additionally, psychosocial determinants such as stress, depression, or relationship dynamics—although implicated in ED pathogenesis—were not evaluated in the NHANES dataset. Future studies incorporating these variables through targeted questionnaires or biomarker assessments (e.g. cortisol and serotonin) could further clarify the robustness of the RAR–ED association. Despite these limitations, the consistency of our findings across multiple adjusted models and subgroup analyses supports the validity of RAR as a potential diagnostic marker, albeit with room for refinement in more comprehensive cohorts.
Conclusion
Although RAR demonstrated potential as a biomarker, its generalizability to non-US populations requires further investigation, particularly in cohorts with differing ethnic and socioeconomic profiles. The current research represents the initial effort to explore the potential positive association between RAR and the effectiveness of ED diagnosis. These results suggest RAR as a potential biomarker for ED and may facilitate earlier identification and guide prompt treatment strategies. Although RAR may reflect inflammatory or endothelial dysfunction pathways, this study lacked direct measures (e.g. C-reactive protein (CRP) and NO levels). Future work should integrate these biomarkers to validate mechanistic hypotheses. The examination showed a prospective relationship between RAR and ED. This relationship was particularly pronounced in participants who smoked cigarettes. In addition, RAR was superior in the diagnosis of ED compared to traditional “blood markers such as RDW, ALB, PAR, and NAR.” These findings suggest the possible benefits of preserving appropriate RAR values in reducing the risk of ED problems.
Footnotes
Acknowledgments
We acknowledge the NHANES participants and staff.
Author contributions
The authors were responsible for the following: Yanbin Zhang was the one who planned the study and was mostly in charge of the finished product. Cunyao Li: performed analysis and composed the paper’s initial draft. All authors reviewed and accepted the final submitted version of the paper, while Xiaoliang Yang, Xu Yan, Yu Wu, and Wei Qi made revisions.
Clinical trial registration
Our study is a cross-sectional analysis using publicly available data (NHANES) and does not constitute a clinical trial; therefore, registration was not required.
Data availability statement
Declaration of conflicting interests
The authors report no conflicts of interest.
Ethics statement
The NCHS Ethics Board approved the study with written participant consent. No competing interests are declared.
Funding
The authors received no financial support for the research, authorship, and/or publication of this article.
Human ethics and consent to participate
The NHANES study protocol was approved by the National Center for Health Statistics (NCHS) Research Ethics Review Board. Written informed consent was obtained from all participants prior to data collection. This study utilized de-identified, publicly available NHANES data and was exempt from additional ethical approval.
Patient consent
NHANES obtained written informed consent from all participants; this study used de-identified data.
Permission to reproduce material
No copyrighted material was reproduced in this study. All NHANES data are publicly available for research use.