
Abstract
Background
The red cell distribution width-to-albumin ratio (RAR) is a novel composite biomarker that reflects both inflammatory and nutritional status. Although the RAR has been associated with various chronic disease outcomes, its relationship with mortality risk in adults with reduced muscle mass has not been systematically evaluated.
Methods
We analyzed data from 1494 adults with reduced muscle mass enrolled in 6 cycles of the US National Health and Nutrition Examination Survey (2003–2006 and 2011–2018). Kaplan–Meier survival analysis, Cox proportional hazards regression, restricted cubic spline models, and time-dependent receiver operating characteristic curves were used to comprehensively assess the association between RAR and mortality risk. Subgroup and interaction analyses were conducted to evaluate the robustness of the findings.
Results
During a median follow-up of 104 months, a higher RAR was linearly associated with increased risks of all-cause and cardiovascular mortality. Compared with Q1, Q4 was associated with a 154% and 216% higher risk of all-cause and cardiovascular mortality, respectively. These associations were generally consistent across subgroups, with a significant interaction by sex indicating stronger associations among men. Time-dependent area under the curve analyses demonstrated that the RAR outperformed the neutrophil-to-lymphocyte ratio, systemic immune-inflammation index, and neutrophil-to-albumin ratio at most time points, with the exception that the neutrophil-to-lymphocyte ratio slightly exceeded RAR for 5-year cardiovascular mortality.
Conclusion
RAR is positively associated with mortality risk in adults with reduced muscle mass. RAR may serve as a practical biomarker for risk stratification in this population.
Keywords
Introduction
Low muscle mass, defined as reduced skeletal muscle mass assessed by imaging or body composition analysis, has been established as a significant risk factor for functional impairment and increased mortality in older adults and in patients with various chronic diseases.1,2 Epidemiological studies have demonstrated that low muscle mass is not only associated with all-cause and cardiovascular mortality but also significantly increases the risk of hospitalization and decline in quality of life.3,4 The pathogenesis of low muscle mass is complex and involves multiple pathological processes, including chronic inflammation, hormonal imbalance, and protein–energy malnutrition.4–6 Given its multifactorial etiology, identifying biomarkers that can simultaneously reflect both inflammatory and nutritional status is of great significance for risk stratification and early intervention in high-risk populations.
Red cell distribution width (RDW), as an indicator of inflammation and hematopoietic stress, and albumin, reflecting nutritional and inflammatory status, have both been shown to be associated with various chronic diseases and mortality risk.7,8 In recent years, the red cell distribution width-to-albumin ratio (RAR), a novel biomarker integrating inflammation and nutritional status, has demonstrated important prognostic value in hypertension, type 2 diabetes, and critically ill patients with chronic obstructive pulmonary disease.9–12 Moreover, emerging studies have linked RAR or related indices to conditions such as diabetic kidney disease and depressive disorder, further highlighting the broad clinical applicability of this biomarker.13,14 Nevertheless, evidence regarding the association between RAR and mortality risk in individuals with low muscle mass remains limited and insufficiently characterized.
It should be noted that the international definition of sarcopenia requires both low muscle mass and reduced muscle strength or physical performance. 2 Due to the lack of complete muscle strength and physical performance data in the National Health and Nutrition Examination Survey (NHANES) database, this study focuses on low muscle mass as assessed by dual-energy X-ray absorptiometry (DXA). Given the aforementioned background, the present study seeks to systematically investigate the association between RAR and all-cause and cardiovascular mortality among US adults with low muscle mass.
Methods
Study design and participants
This is a retrospective cohort study based on data from the NHANES. The NHANES utilizes a nationwide, multistage stratified probability sampling framework that combines structured interviews, standardized physical assessments, and laboratory investigations to collect data. All data collection protocols were approved by the National Center for Health Statistics (NCHS) Ethics Review Board, and all participants provided written informed consent. This study was conducted in accordance with the principles of the Declaration of Helsinki (as revised in 2024). All data used in these analyses are deidentified and publicly available, with no personally identifiable information.
This study included data from six survey cycles (2003–2006 and 2011–2018) that incorporated comprehensive DXA body composition measurements. The 2007–2010 survey cycles were excluded because DXA measurements were not conducted during these years. Although DXA data from 1999 to 2006 were released with multiply imputed datasets to address nonrandom missingness, we intentionally restricted the analysis to directly measured DXA values from 2003 to 2006 and 2011 to 2018. This approach was chosen to prioritize analytic consistency and avoid potential heterogeneity introduced by scanner transitions and imputation algorithms. In accordance with the established inclusion and exclusion criteria, 1494 eligible participants were ultimately enrolled in this study.Participants were excluded if they met any of the following criteria: (a) age <20 years; (b) missing data on RAR, appendicular lean mass (ALM), or body mass index (BMI); (c) not meeting the criteria for low muscle mass; and (d) incomplete covariate information, presence of extreme outliers, or the lack of mortality follow-up data. Ultimately, 1494 participants with complete data and who met the criteria for low muscle mass were included in the final analysis (Figure 1). To evaluate the potential impact of exclusions within the low muscle mass group, we further compared the baseline characteristics of participants who were excluded due to missing covariate or follow-up data (n = 458) with those of the final analytical cohort (n = 1494) (Table S1).
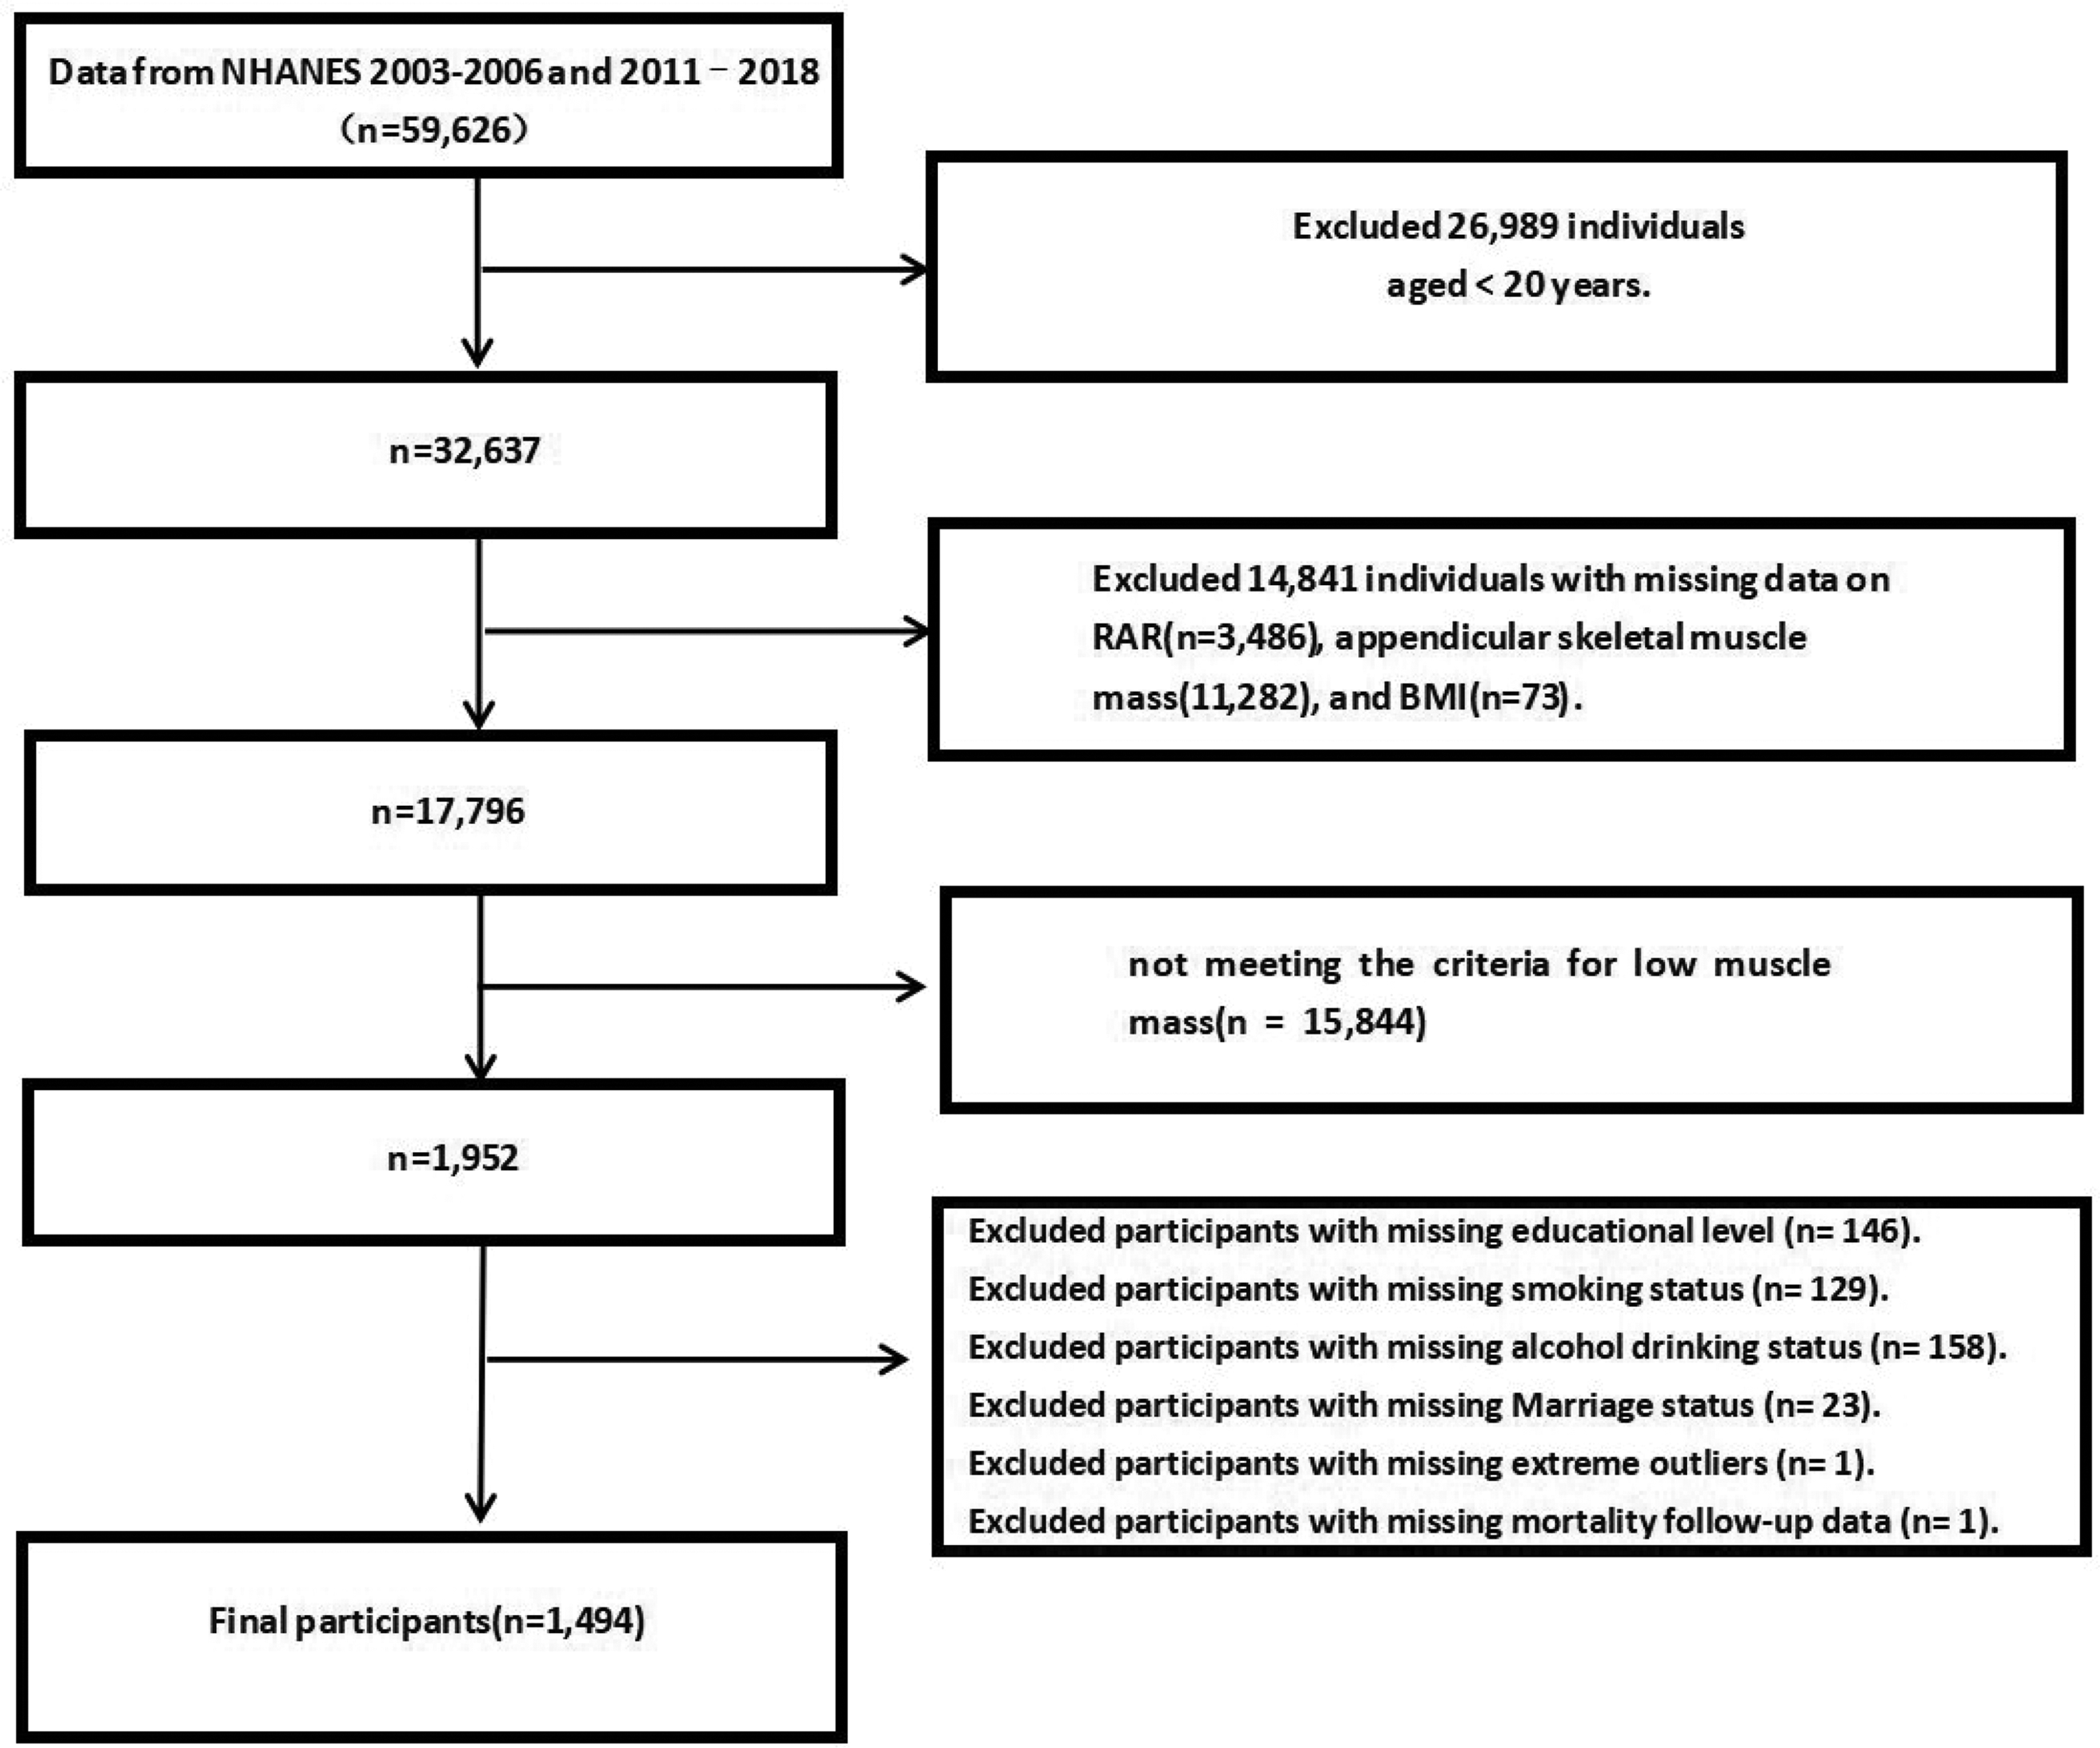
Flow chart of the study.
Definition of low muscle mass
Reduced muscle mass was defined according to the thresholds proposed by the Foundation for the National Institutes of Health (FNIH) Sarcopenia Project, 2 using the ratio of ALM (assessed by DXA) to BMI (<0.789 for men and <0.512 for women).
Due to the absence of functional data, such as handgrip strength and gait speed, in the NHANES database, the complete international consensus diagnostic criteria for sarcopenia could not be applied in this study. Instead, participants were classified solely based on DXA-measured low muscle mass.
Measurement of RAR
RDW (%) was measured using a Coulter hematology analyzer, and albumin (g/dL) was determined using the bromocresol purple method. RAR was calculated as the ratio of RDW (%) to albumin (g/dL). 15 Based on the distribution of RAR, all participants were categorized into four quartiles: Q1 ≤ 2.91; 2.91 < Q2 ≤ 3.12; 3.12 <Q3 ≤ 3.41; and Q4 > 3.41, with Q1 serving as the reference group for subsequent comparative analyses.
Covariates
Sociodemographic variables included age, sex, race, poverty–income ratio, marital status, and educational level.
Lifestyle factors included smoking status and alcohol consumption. Smoking status was classified using the NHANES questionnaire item smoking questionnaire (SMQ020), and alcohol consumption was defined based on item alcohol use questionnaire (ALQ101).
Health-related covariates included hypertension, diabetes, and cardiovascular disease (CVD). Hypertension was defined as meeting any of the following criteria: self-reported physician diagnosis, current use of antihypertensive medication, or an average measured blood pressure ≥140/90 mmHg. Diabetes was defined as a self-reported diagnosis, current use of antidiabetic medications, or laboratory evidence of fasting plasma glucose ≥126 mg/dL or hemoglobin A1c ≥6.5%. CVD was determined based on standardized medical questionnaires and self-reported physician diagnosis, including a history of coronary heart disease, congestive heart failure, myocardial infarction, angina, or stroke.
Additionally, laboratory indicators included serum alanine aminotransferase, aspartate aminotransferase, triglycerides, and total cholesterol.
All covariates were selected based on established evidence and biological plausibility.16,17
Mortality data
Mortality outcomes were ascertained through linkage of NHANES data to the National Death Index, with follow-up through 31 December 2019. The primary outcomes were all-cause mortality and cardiovascular mortality, with the latter defined according to International Classification of Diseases (ICD)-10 codes I00–I99.
Statistical analysis
We conducted complete-case analyses, excluding participants with missing data on exposure, outcomes, or covariates. Statistical analyses were performed using the NHANES complex survey design variables (SDMVSTRA and SDMVPSU) along with appropriately adjusted examination weights. When pooling multiple 2-year cycles, we divided WTMEC2YR by the number of cycles included, as recommended by the NCHS. Categorical variables were expressed as counts and percentages (%), while continuous variables were presented as means ± standard deviations (SD). Survival disparities among RAR quartiles were illustrated using Kaplan–Meier (KM) curve analysis. Multivariable Cox proportional hazards regression models were utilized to assess the association between RAR and mortality risk, with adjustment for multiple potential confounding variables. When modeled as a continuous variable, hazard ratios (HR) for RAR were estimated per 1-unit increase. To investigate the potential nonlinear relationships between RAR and mortality outcomes, restricted cubic spline (RCS) models were employed. We modeled RAR as a continuous variable using a four-knot RCS function, with knots located at the 5th, 35th, 65th, and 95th percentiles of RAR distribution. Subgroup analyses were conducted to examine possible effect modification by factors such as sex, age, alcohol consumption, smoking status, hypertension, diabetes, and CVD. In addition, sex-stratified Cox regression models were conducted using both continuous and quartile-based RAR variables, and HRs with 95% confidence intervals (CIs) were estimated separately for men and women across Models 1–3, using the same covariate adjustment strategy as in the primary analysis.
To account for competing risks (e.g. deaths from noncardiovascular causes), we additionally applied the Fine–Gray subdistribution hazard models to estimate subdistribution hazard ratios (SHR) and corresponding 95% CI for cardiovascular mortality, considering noncardiovascular deaths as competing events.
As a sensitivity analysis, we also conducted unweighted Cox regression models to evaluate whether the main associations were consistent without applying survey weights. In addition, propensity score matching was performed to minimize baseline imbalances between the highest (Q4) and lowest (Q1) RAR quartiles. Participants were matched 1:1 using nearest-neighbor matching without replacement, based on age, sex, race/ethnicity, educational level, income, smoking, alcohol consumption, hypertension, diabetes, and CVD. The matched cohort was subsequently analyzed using Cox regression models to reassess the association between RAR and mortality outcomes. Furthermore, to address potential concerns about nonrandom missingness in earlier NHANES DXA data, we performed a sensitivity analysis restricted to the 2011–2018 cycles, where DXA coverage is near-complete.
Furthermore, time-dependent receiver operating characteristic (ROC) curves were constructed to dynamically assess the predictive performance of RAR for mortality risk, accounting for variations in sensitivity and specificity over time. To complement the ROC analysis, we additionally calculated Harrell’s concordance index (C-index) to summarize overall discrimination across the entire follow-up as well as time-dependent C-indices at 3, 5, and 10 years using a marginal censoring model. These indices were estimated for both all-cause and cardiovascular mortality. All statistical analyses were conducted using R software (version 4.3.3). The reporting of this study conforms to the Strengthening the Reporting of Observational Studies in Epidemiology guidelines for observational studies. 18 Statistical significance was defined as a two-tailed p value less than 0.05.
Results
Baseline characteristics
A total of 1494 participants meeting the inclusion criteria were enrolled in this study, representing an estimated 9,003,146 adults with low muscle mass in the US community after applying survey weights. Among these participants, 769 (53.1%) were male, and 725 (46.9%) were female, with a mean age of 50.16 ± 15.63 years. The RAR ranged from 2.37 to 5.00, with a mean ± SD of 3.19 ± 0.42. As shown in Table 1, the results showed that among participants in the higher quartiles of RAR, there was a higher proportion of older individuals, females, and Non-Hispanic Blacks. Additionally, this group had a relatively higher educational level, and the prevalence rates of diabetes, hypertension, and CVD were all significantly increased (all p < 0.05). In addition, as shown in Table S1, participants with low muscle mass who were excluded due to missing covariate or follow-up data (n = 458) did not differ significantly from the final analytical cohort (n = 1494) in key demographic and clinical characteristics, suggesting that exclusions due to missing data are unlikely to have biased the findings.
Basic characteristics of participants among US adults by RAR quartiles.
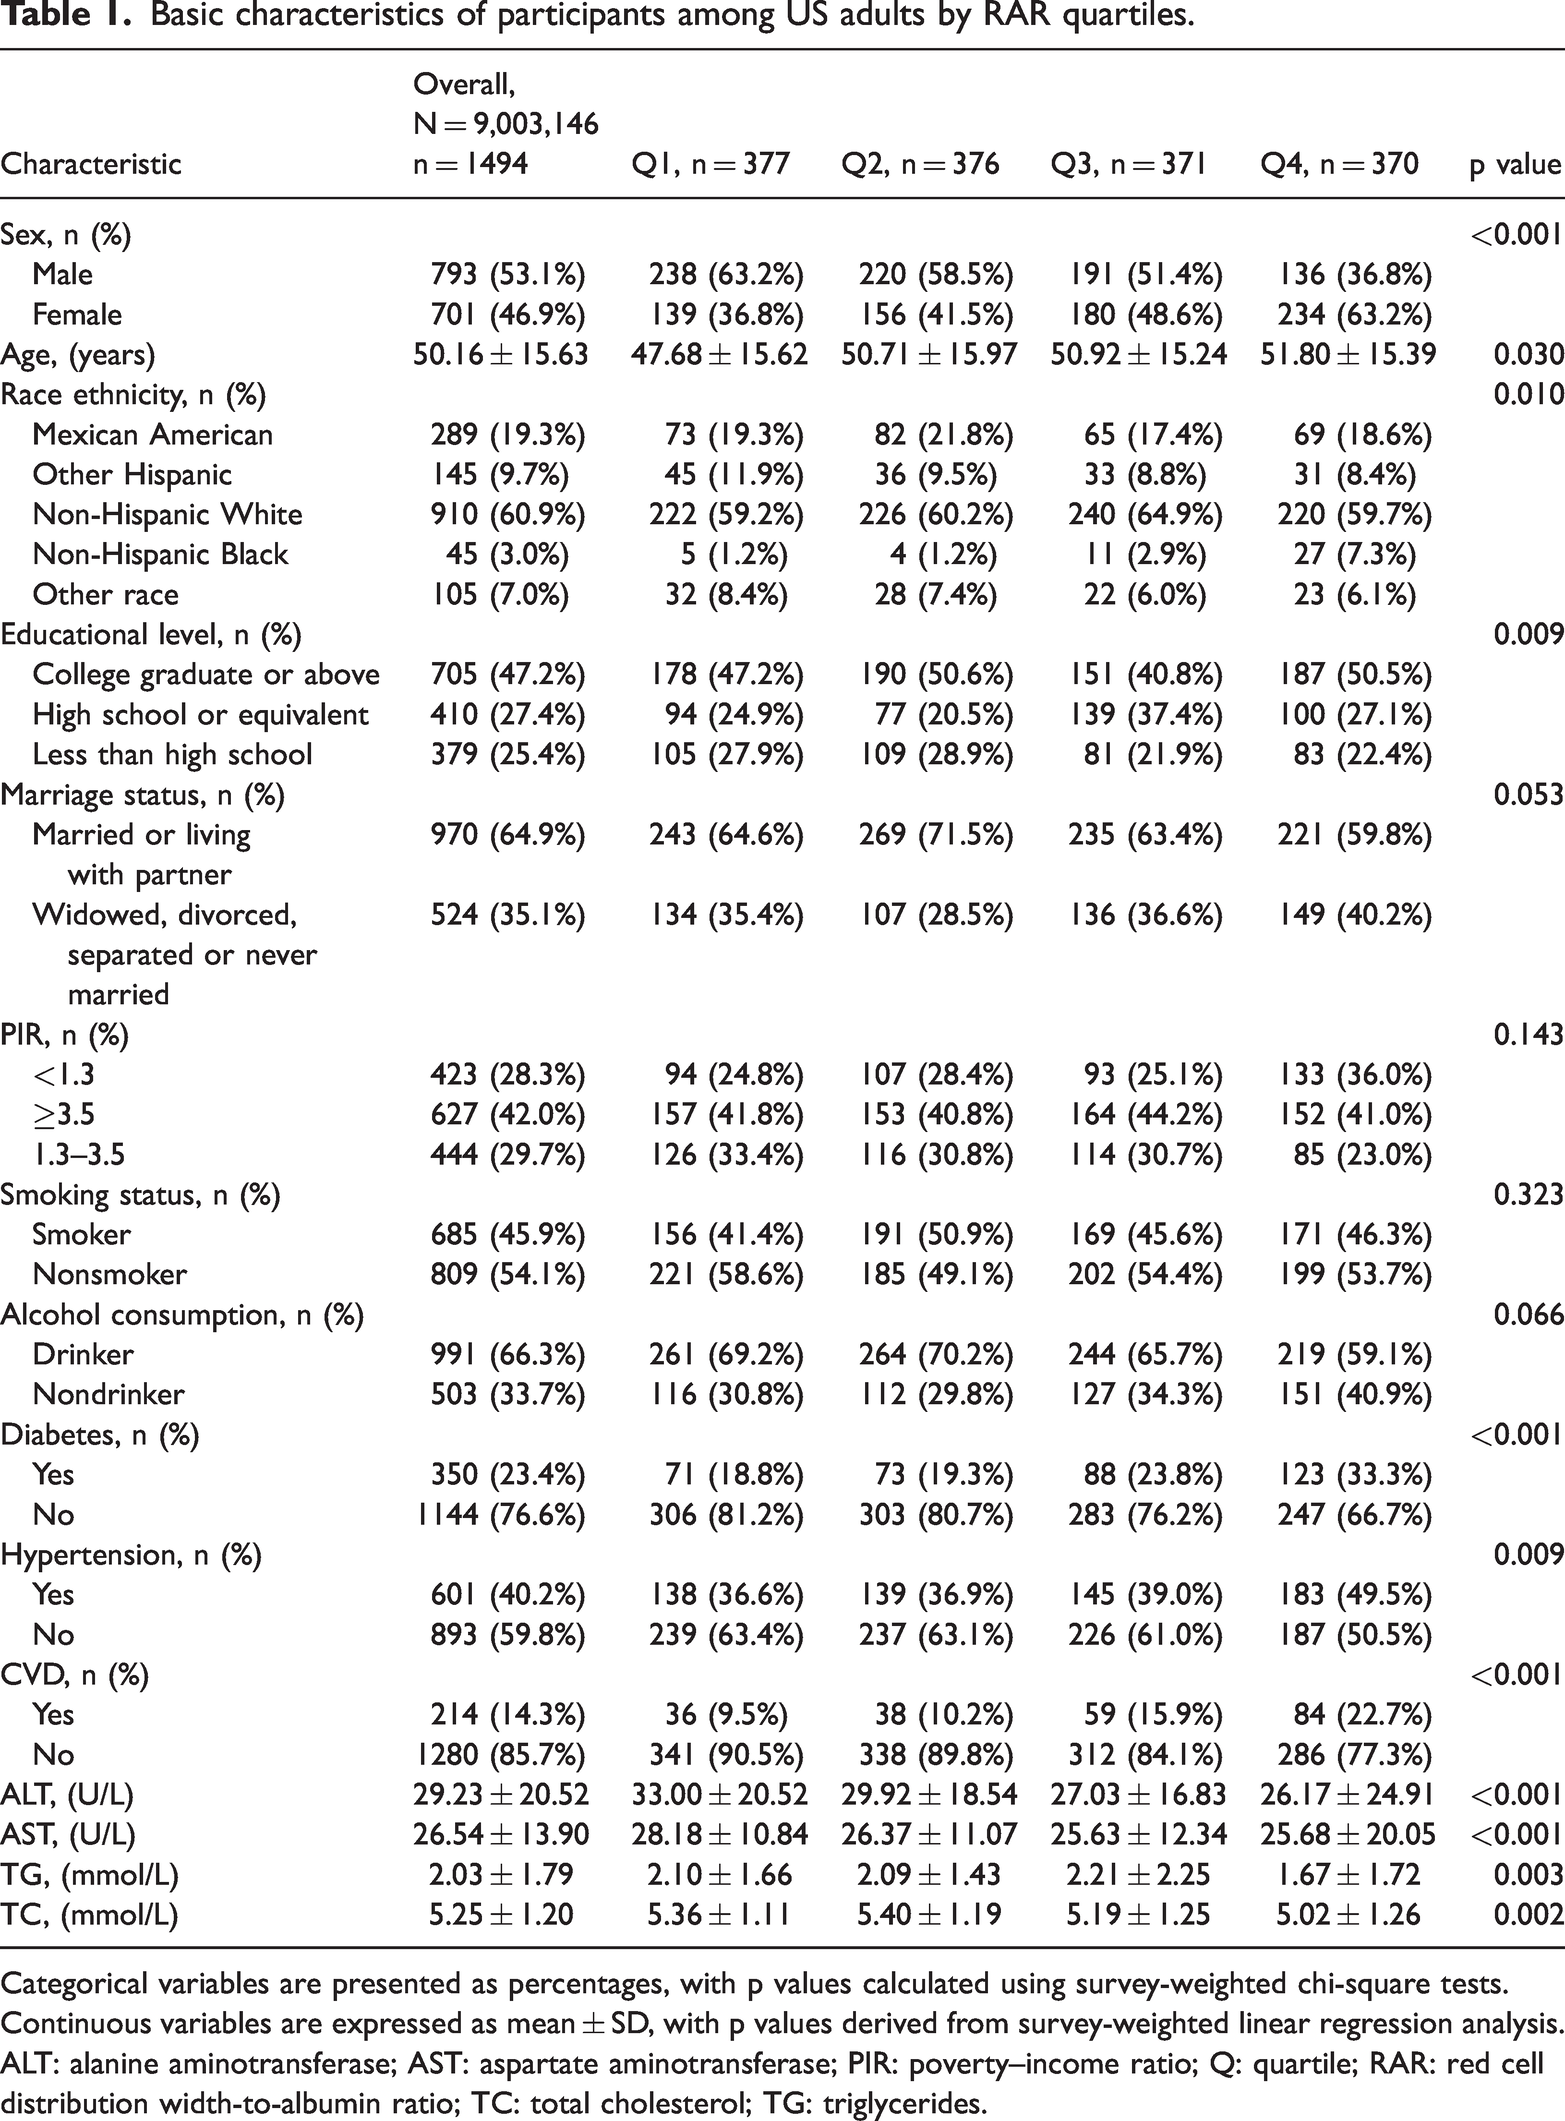
Categorical variables are presented as percentages, with p values calculated using survey-weighted chi-square tests. Continuous variables are expressed as mean ± SD, with p values derived from survey-weighted linear regression analysis.
ALT: alanine aminotransferase; AST: aspartate aminotransferase; PIR: poverty–income ratio; Q: quartile; RAR: red cell distribution width-to-albumin ratio; TC: total cholesterol; TG: triglycerides.
Mortality outcomes and survival analysis in participants with low muscle mass
During a median follow-up of 104 months, 381 all-cause deaths and 107 cardiovascular deaths were documented among 1494 participants with low muscle mass. KM survival curves demonstrated significant differences in both all-cause and cardiovascular mortality across RAR quartiles, with markedly lower survival rates observed in the highest RAR group (Figure 2).
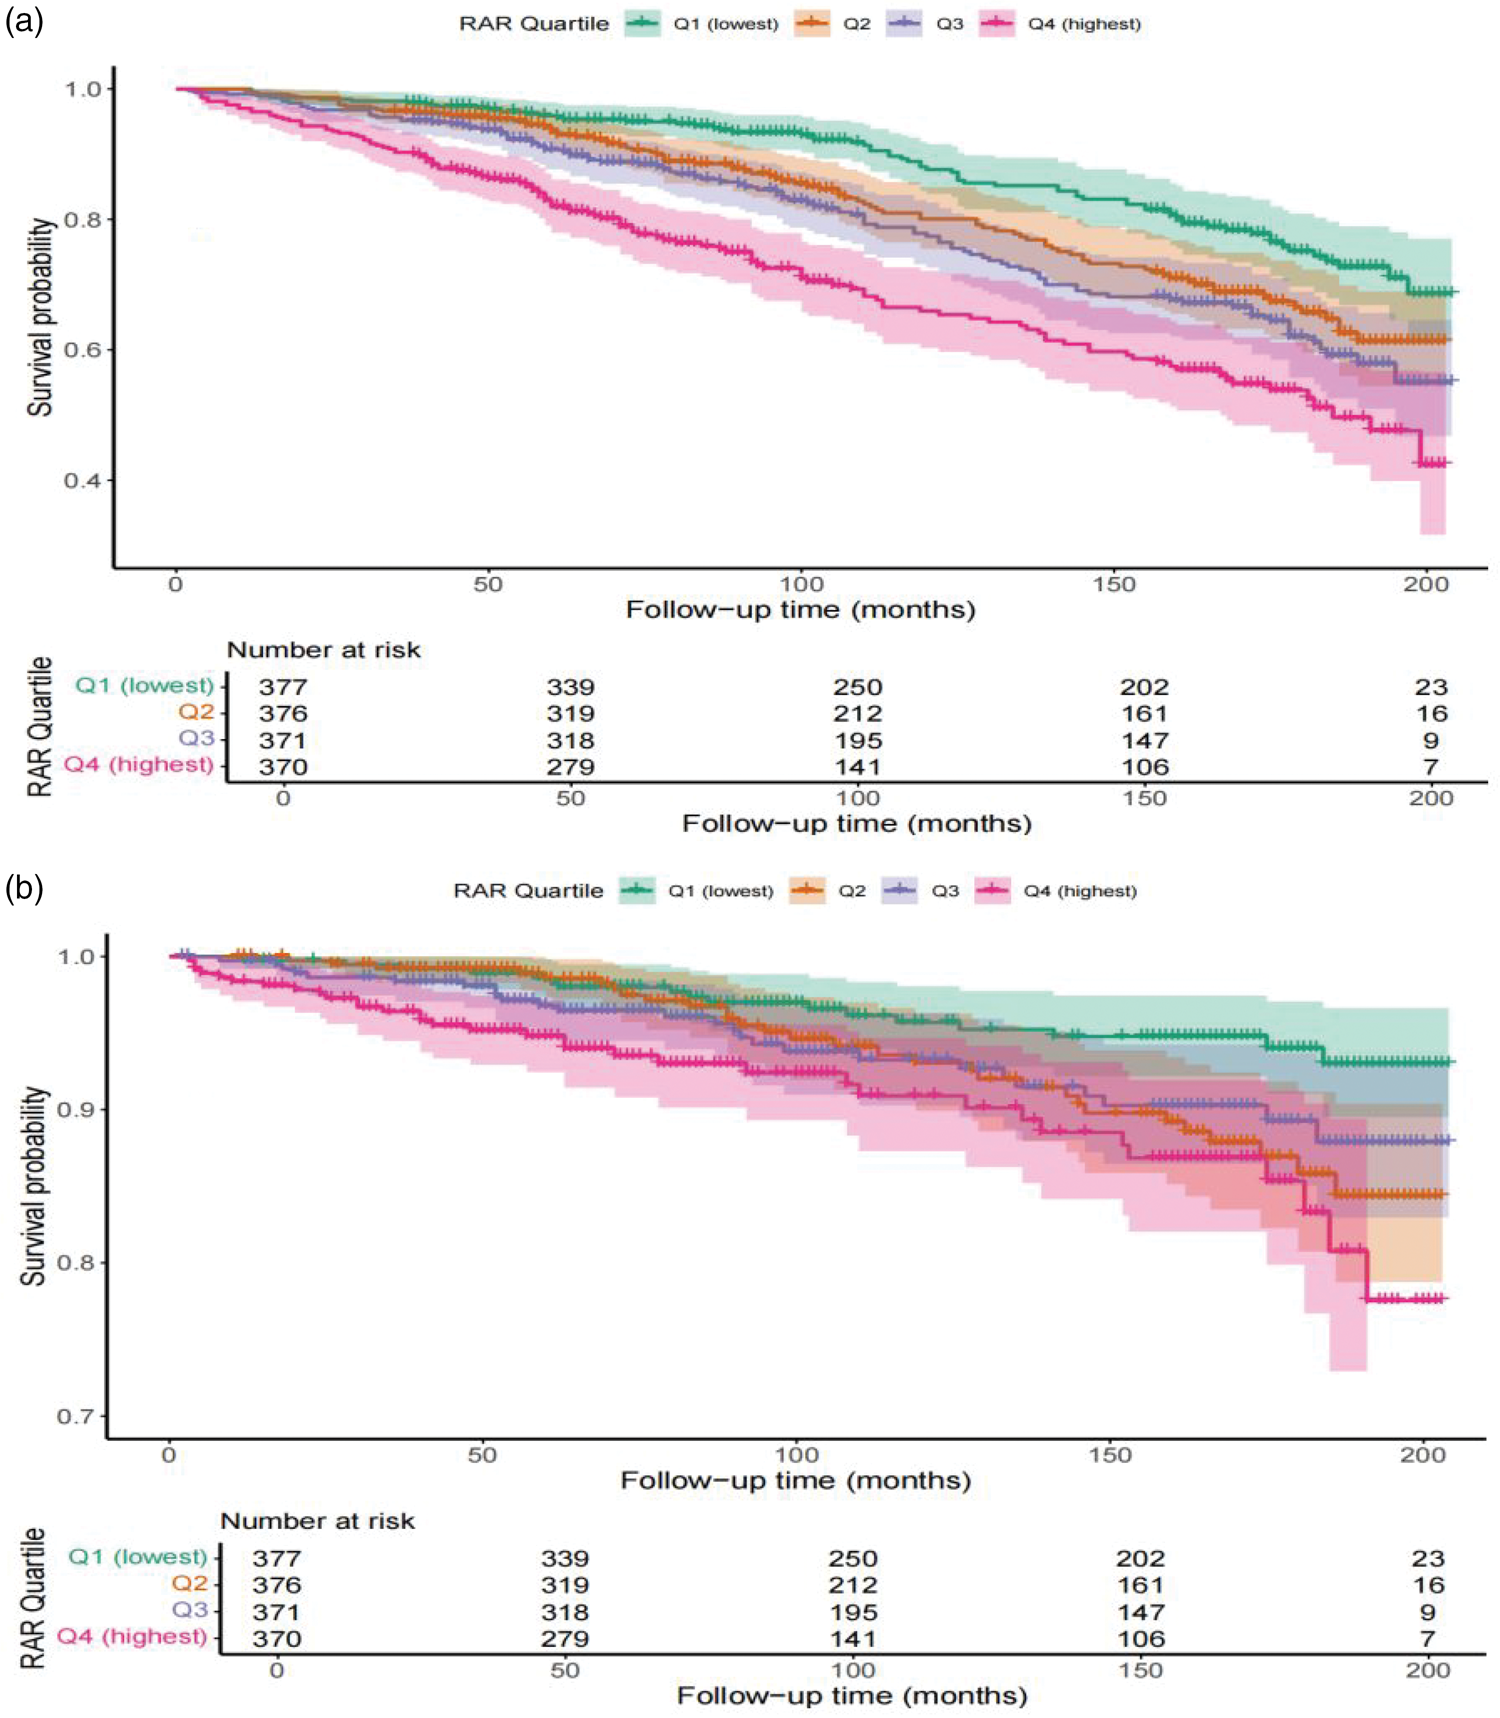
Kaplan–Meier survival analysis plot for all-cause mortality with quartile groups of RAR (a). Kaplan–Meier survival analysis plot for cardiovascular mortality with quartile groups of RAR (b). RAR: red cell distribution width-to-albumin ratio.
After full adjustment for covariates, Cox regression analysis showed that participants in the highest RAR quartile had significantly higher risks of all-cause mortality (HR = 2.54, 95% CI: 1.76–3.65) and cardiovascular mortality (HR = 3.16, 95% CI: 1.86–5.34) compared with those in the lowest quartile, with a significant linear trend (p < 0.001) (Table 2).
HRs (95% CI) for outcomes across groups of RAR.

Model 1: Unadjusted for covariates. Model 2: Adjusted for age, sex, and race/ethnicity. Model 3: Further adjusted for sex, age, race/ethnicity, educational level, marital status, PIR, smoking status, alcohol consumption as well as hypertension, CVD, diabetes, alanine aminotransferase, aspartate aminotransferase, triglycerides, and total cholesterol.
95% CI: 95% confidence interval; HR: hazard ratio; RAR: red cell distribution width-to-albumin ratio; PIR: poverty–income ratio; CVD: cardiovascular disease.
The results of the RCS analyses did not demonstrate significant nonlinear relationships between RAR and either all-cause or cardiovascular mortality, as indicated by p values for nonlinearity of 0.0637 and 0.157, respectively (Figure 3).

RCS analyses showed no evidence of nonlinearity in the associations of RAR with all-cause (a) and cardiovascular mortality (b); the relationships were approximately linear. The solid blue line represents the adjusted HR, and the shaded area represents the 95% CI. Model were further adjusted for sex, age, race/ethnicity, educational level, marital status, poverty–income ratio, smoking status, alcohol consumption, hypertension, CVD, diabetes, alanine aminotransferase, aspartate aminotransferase, triglycerides, and total cholesterol. CI: confidence interval; HR: hazard ratios; RAR: red cell distribution width-to-albumin ratio; CVD: cardiovascular disease; RCS: restricted cubic spline.
Subgroup and sensitivity analyses
Across strata of age, alcohol consumption, smoking, hypertension, diabetes, and CVD, the associations between RAR and mortality were directionally consistent, and no significant interactions were observed (all p for interaction >0.05; Figure 4). In contrast, a significant interaction by sex was detected (p for interaction <0.05): higher RAR was associated with increased risks of all-cause and cardiovascular mortality in men, whereas associations were attenuated and not statistically significant in women. In sex-stratified Cox analyses consistent with the primary modeling strategy, RAR remained strongly associated with both all-cause and cardiovascular mortality in men, while no significant associations were observed in women (Table S3). As a sensitivity analysis, unweighted Cox regression yielded HR that were materially unchanged compared with the weighted models (Table S4). Furthermore, propensity score matching analysis between the highest (Q4) and lowest (Q1) RAR quartiles demonstrated that baseline characteristics were well balanced after matching (Table S5), and the associations between RAR and both all-cause and cardiovascular mortality remained robust (Table S6). In supplementary analyses among participants without low muscle mass, higher RAR was likewise associated with increased risks of all-cause and cardiovascular mortality; effect sizes were comparable to those in adults with low muscle mass (Table S2). These findings align with prior population-based evidence that RAR predicts mortality in the general population. Finally, when restricting analyses to the 2011–2018 cycles, where DXA coverage was near-complete, the results were highly consistent with the primary findings, further supporting the robustness of our conclusions (Table S7). Additionally, to account for competing risks such as noncardiovascular deaths, a Fine–Gray subdistribution hazard model was applied. The results remained consistent with the Cox regression analyses, with higher RAR levels being significantly associated with increased risk of cardiovascular mortality (fully adjusted SHR = 1.54, 95% CI: 1.05–2.34, p = 0.037; Table S8), further confirming the robustness of our findings.
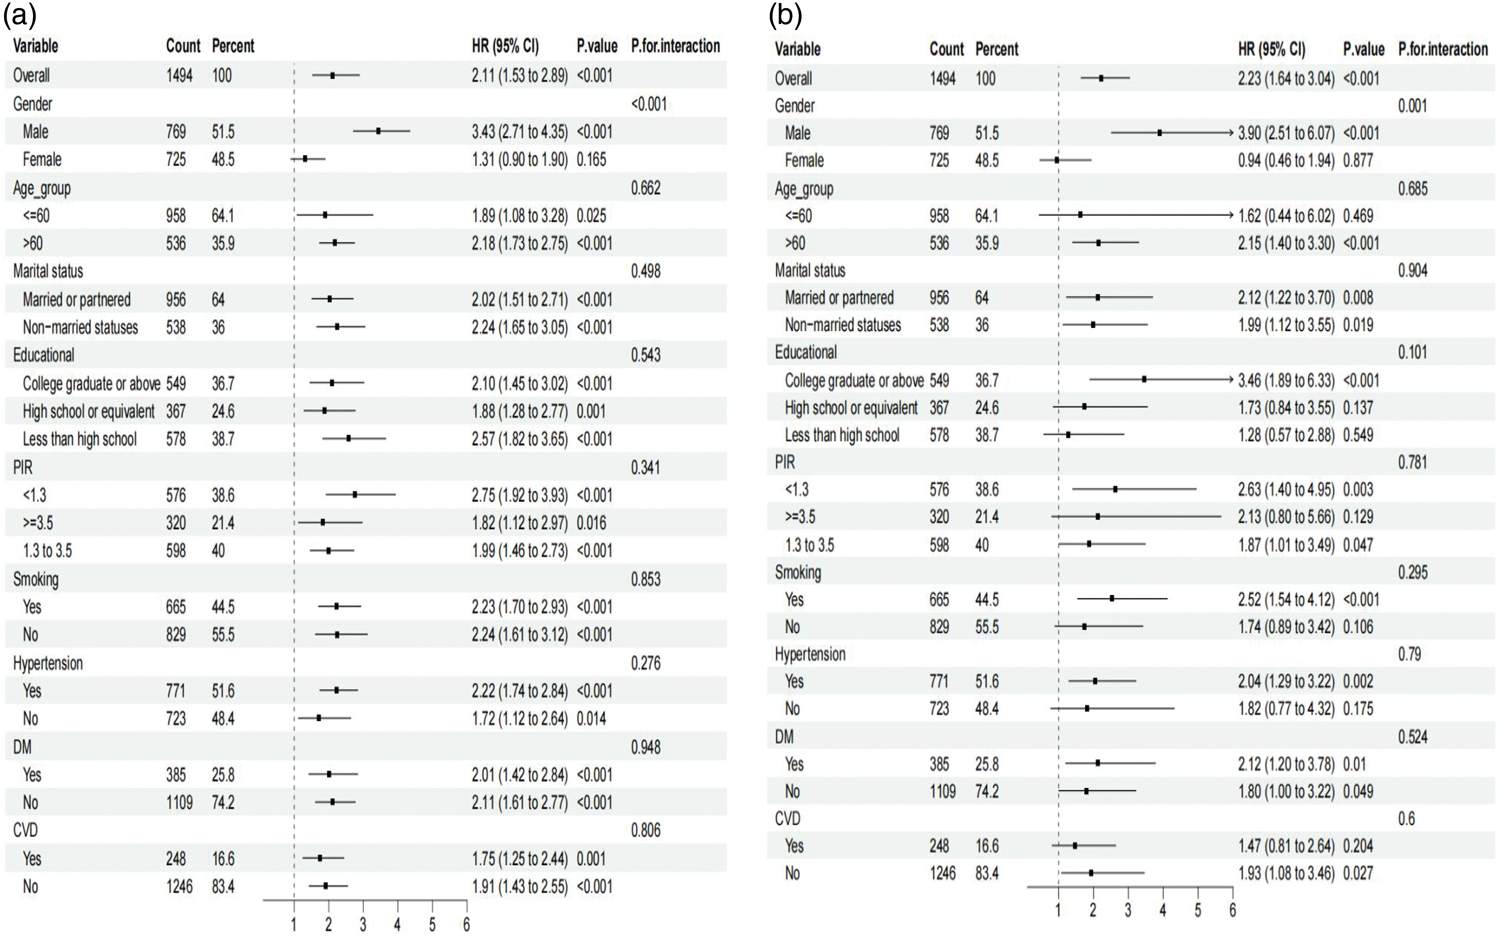
Subgroup analyses of RAR with all-cause (a) and cardiovascular mortality (b) among US adults with low muscle mass. RAR: red cell distribution width-to-albumin ratio.
Predictive performance of RAR
ROC curve analyses demonstrated that the area under the curve (AUC) values for RAR in predicting all-cause mortality at 3, 5, and 10 years were 0.693, 0.688, and 0.656, respectively (Figure 5). For cardiovascular mortality, the corresponding AUCs were 0.727, 0.694, and 0.618 (Figure 6). Compared with the neutrophil-to-albumin ratio, neutrophil-to-lymphocyte ratio, and systemic immune-inflammation index, RAR demonstrated superior predictive accuracy for both all-cause and cardiovascular mortality at most time points. It is noteworthy that the neutrophil-to-lymphocyte ratio had a slightly higher AUC than RAR for predicting 5-year cardiovascular mortality; however, apart from this, RAR showed better predictive performance for all other time points and outcomes.
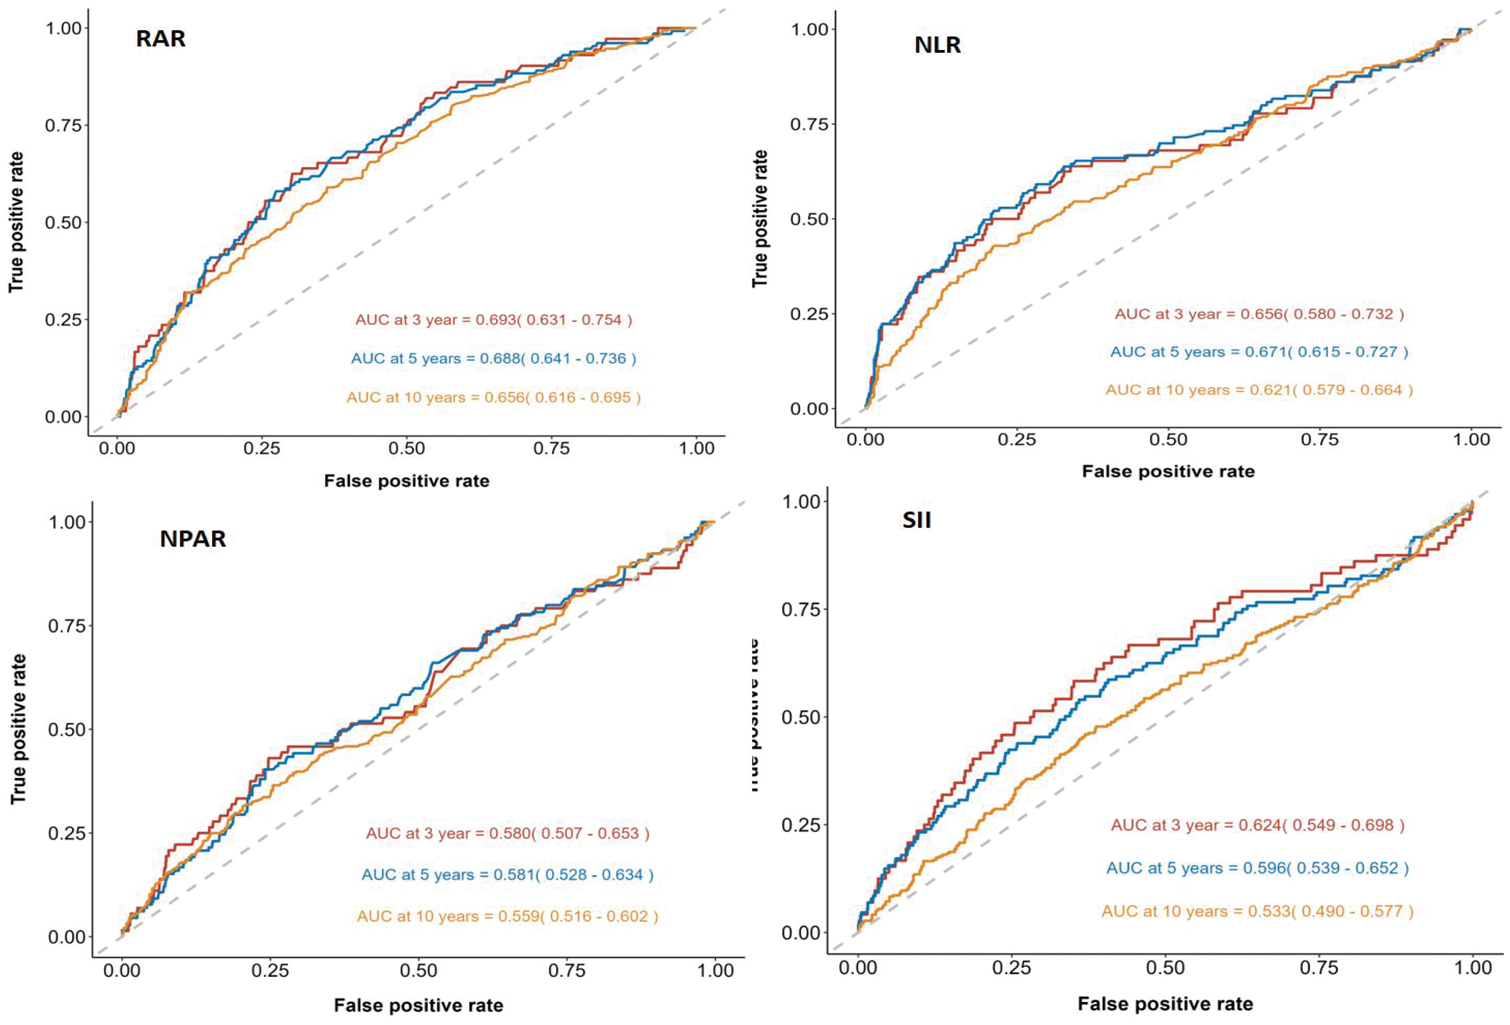
Time-dependent ROC curve analysis demonstrated that the predictive performance of RAR, NLR, NPAR, and SII for all-cause mortality. NLR: neutrophil-to-lymphocyte ratio; NPAR; neutrophil-to-albumin ratio; RAR: red cell distribution width-to-albumin ratio; ROC: receiver operating characteristic; SII: systemic immune-inflammation index.

Time-dependent ROC curve analysis demonstrated that the predictive performance of RAR, NLR, NPAR, and SII for cardiovascular mortality. NLR: neutrophil-to-lymphocyte ratio; NPAR; neutrophil-to-albumin ratio; RAR: red cell distribution width-to-albumin ratio; ROC: receiver operating characteristic; SII: systemic immune-inflammation index.
In addition, Harrell’s concordance index (C-index) was calculated to further evaluate the discriminative ability of RAR. The overall C-index was 0.851 (95% CI: 0.832–0.870) for all-cause mortality and 0.882 (95% CI: 0.854–0.911) for cardiovascular mortality. Time-dependent C-index values at 3, 5, and 10 years consistently indicated good predictive performance, with details presented in Table S9.
Discussion
This study, based on nationally representative cohort data including 1494 adults with low muscle mass, found that an elevated baseline RAR was significantly associated with increased risks of all-cause and cardiovascular mortality. Over approximately 9 years of follow-up, the survival probability in the highest RAR quartile was notably lower than that in the lowest quartile. Time-dependent ROC curve analysis further confirmed the good predictive performance of RAR for 3-, 5-, and 10-year survival outcomes. Subgroup analyses showed that this association remained robust across different demographic and clinical subpopulations. Notably, a significant interaction by sex was observed, with the association between RAR and mortality risk being more pronounced among men with low muscle mass. To the best of our knowledge, this is the first study to systematically evaluate the prognostic value of RAR for mortality risk in individuals with low muscle mass, providing new evidence in this field.
Interestingly, the prognostic performance of RAR was more evident in male patients. This sex difference may be attributed to several interrelated factors. First, influenced by testosterone, men generally have higher baseline skeletal muscle mass but also experience a more rapid decline in muscle mass with aging; consequently, a similar increase in RAR may indicate more severe malnutrition or inflammatory burden in men. 19 Moreover, differences in immune and inflammatory responses exist between the sexes. Women typically exhibit stronger innate and adaptive immune responses, leading to more robust responses to infections, but tend to maintain more stable chronic inflammation levels.20,21 This inherent difference may partially buffer the adverse effects associated with elevated RAR in women. Finally, the impact of age-related sex hormone changes is crucial. Testosterone levels decline significantly in aging men, potentially accelerating muscle atrophy and triggering systemic inflammation. 22 Low testosterone status is associated with higher levels of proinflammatory cytokines and relatively insufficient anti-inflammatory factors, further increasing the inflammatory burden. Therefore, in older men, inflammation and muscle loss related to testosterone deficiency likely amplify the predictive efficacy of RAR for mortality risk. 21 Taken together, these mechanisms explain why RAR demonstrates stronger predictive value for mortality risk, particularly among men with low muscle mass.
RDW reflects the variability in the volume of circulating erythrocytes and is a simple and inexpensive routine laboratory parameter. Increasing evidence indicates that elevated RDW is closely associated with adverse outcomes in a variety of diseases. For example, higher RDW levels have been confirmed to be associated with an increased risk of mortality in heart failure, acute myocardial infarction, sepsis, and coronavirus disease 2019 (COVID-19).23–27 A study involving 8884 individuals from the general population found that elevated RDW was significantly positively associated with cardiovascular mortality. 28 In a cohort of 1148 patients with aortic valve stenosis, baseline RDW was also an independent predictor of mortality risk. 29 Additionally, increased RDW has been linked to poor outcomes in cancer patients (such as higher all-cause mortality risk in those with breast cancer). 30 Recently, RDW has been proposed as a significant nonspecific indicator of all-cause mortality in the general population. A large prospective study in the UK involving 240,477 participants further confirmed that RDW was closely associated with all-cause mortality as well as the incidence of cardiovascular and cancer events, over a 9-year follow-up period. 31
Serum albumin is a classic biomarker of nutritional status, synthesized by the liver and accounting for more than 50% of total plasma protein. Albumin is a negative acute-phase reactant, which indicates that its level decreases in inflammatory states, thus reflecting both an individual’s nutritional reserves and inflammatory burden. In addition, albumin plays multiple biological functions, including maintaining colloid osmotic pressure, exerting anti-inflammatory and antioxidant effects, and providing anticoagulant properties. 32 Numerous studies have shown that serum albumin levels are inversely correlated with functional status, disease severity, and risk of mortality.33,34 A systematic review of sarcopenia (including 630 studies) demonstrated that patients with sarcopenia frequently present with hypoalbuminemia and that albumin levels are negatively correlated with the severity of sarcopenia. 34 Hypoalbuminemia not only suggests malnutrition but may also exacerbate chronic inflammatory burden, further worsening clinical outcomes. Inflammatory states, through proinflammatory cytokines such as interleukin (IL)-6 and tumor necrosis factor (TNF)-α, can significantly suppress hepatic albumin synthesis and increase capillary permeability, leading to extravasation of albumin and ultimately decreased serum albumin levels. 32 A Dutch study further found that low albumin levels were closely associated with decreased muscle strength, slower walking speed, and reduced skeletal muscle mass, indicating that albumin reflects the combined effects of malnutrition and chronic inflammation. 35
By combining RDW and albumin, RAR integrates information on both chronic inflammation and nutritional status, forming a composite index. Therefore, RAR is expected to provide a more comprehensive assessment of the inflammation–nutrition imbalance than either marker alone, enabling more accurate prediction of all-cause and cardiovascular mortality risks among individuals with low muscle mass. Previous studies have already established the prognostic value of RAR across a range of diseases, Hao et al. 8 conducted a large population-based study using UK Biobank and NHANES data and confirmed that higher RAR was significantly associated with increased risks of all-cause and cause-specific mortality in the general population. In a cohort of 725 patients with diabetic retinopathy, elevated RAR was similarly predictive of increased all-cause and cardiovascular mortality. 36 Another study in patients with severe acute pancreatitis found that RAR had good predictive power for short-term mortality, with 28- and 90-day mortality rates significantly higher in those with elevated RAR. 37 In 628 critically ill patients with rheumatic diseases, baseline RAR above 6.07 was associated with markedly increased 90- and 360-day mortality, and regression analysis confirmed RAR as an independent risk factor for poor prognosis in this population. 38 More recently, an observational study among patients with hypertension also demonstrated that elevated RAR was significantly associated with both cardiovascular and all-cause mortality, further supporting the clinical utility of RAR in cardiometabolic populations. 39 These findings are consistent with those of the present study, further supporting the clinical value of RAR as a composite biomarker and offering new perspectives on the prognosis of individuals with low muscle mass. Together with population-based data showing that RAR predicts all-cause and cause-specific mortality in the general population, our supplementary results indicate that RAR has general prognostic utility, whereas focusing on adults with low muscle mass remains clinically salient, given their vulnerability and the potential for targeted risk stratification.
The results of this study suggest that RAR may serve as a practical tool for mortality risk assessment in patients with low muscle mass and could help clinicians improve risk stratification to guide early nutritional support and anti-inflammatory interventions. The role of inflammation and nutritional imbalance in the prognosis of sarcopenia and related diseases is receiving increasing attention. For example, inflammatory markers such as high-sensitivity C-reactive protein (hs-CRP) are closely linked to cardiovascular mortality risk, and statins can effectively lower hs-CRP levels and improve patient outcomes. 40 Given the observed association between RDW (an inflammatory marker) and cardiovascular mortality, future research should explore whether improving inflammation–nutrition status can reduce mortality risk among individuals with low muscle mass. Drugs such as statins, sodium–glucose cotransporter 2 (SGLT2) inhibitors, glucagon-like peptide (GLP)-1 receptor agonists, and aspirin all possess anti-inflammatory or metabolic regulatory effects. Notably, SGLT2 inhibitors have been shown to suppress proinflammatory activation of tissue macrophages in both diabetic and nondiabetic models, thereby reducing chronic inflammation. 41 GLP-1 receptor agonists have also demonstrated benefits in weight loss, metabolic improvement, and potentially antiatherosclerotic inflammation. 42 Thus, it is necessary to evaluate whether these interventions can lower RDW or improve RAR, thereby improving clinical outcomes for individuals with low muscle mass. This would provide new approaches for comprehensive management of sarcopenia and low muscle mass, ultimately helping us to reduce the excess risk of premature mortality in this population.
However, several limitations should be noted. First, some individuals with low muscle mass were excluded due to missing key information, which may have introduced a degree of selection bias. Although the study adjusted for numerous known confounders and conducted subgroup analyses, it is still not possible to completely eliminate the influence of potential unknown confounding factors. Furthermore, the study population was based on US adults with low muscle mass; hence, the generalizability of these findings to other countries or populations remains to be determined. In this study, low muscle mass was defined solely by the ALM/BMI ratio, without incorporating muscle strength or physical performance measures as required by international standards for sarcopenia; this is a common limitation in current population-based database studies. In addition, RAR was measured only once at baseline, and potential long-term variability in RDW or albumin levels could not be assessed, which may have introduced some degree of measurement error and attenuated the observed associations. Finally, it should be emphasized that RAR itself is a nonspecific indicator. Conditions such as anemia, chronic infections, and liver disease can all affect RDW or albumin levels, potentially confounding the ability of RAR to specifically indicate risk related to low muscle mass. This highlights the need to comprehensively consider other comorbidities when applying RAR in clinical practice.
Conclusion
Higher RAR was independently associated with increased risks of all-cause and cardiovascular mortality in US adults with low muscle mass, particularly in men. As a simple and accessible index, RAR may be useful for risk stratification and prognostic assessment in this population.
Supplemental Material
sj-pdf-1-imr-10.1177_03000605251413087 - Supplemental material for Association of red cell distribution width-to-albumin ratio with mortality in adults with low muscle mass: A retrospective cohort study
Supplemental material, sj-pdf-1-imr-10.1177_03000605251413087 for Association of red cell distribution width-to-albumin ratio with mortality in adults with low muscle mass: A retrospective cohort study by Dongmei Xu, Jiajing Wu, Yan Zhu, Jionghao Guo and Yang Li in Journal of International Medical Research
Footnotes
Acknowledgments
We would like to acknowledge the participants and investigators of the National Health and Nutrition Examination Survey (NHANES).
Author Contributions
The study was designed by JW and JG. Data analysis and initial drafting of the manuscript were carried out by YL and DX. The manuscript was revised by YZ and YL. All authors have read and approved for the final manuscript.
Clinical trial number
Not applicable.
Consent for publication
Not applicable.
Data availability
Declaration of conflicting interests
The authors declare that they have no competing interests.
Ethics approval and consent to participate
This study was conducted in accordance with the ethical guidelines of the Declaration of Helsinki. Detailed methods and protocols for the NHANES study were approved by the CDC/NCHS Research Ethics Review Board. They are publicly available through the CDC.gov website; this includes informed consent procedures for all participants. All methods in this study were performed by the relevant guidelines and regulations. This study was exempt from human subject ethical review as the data is freely available in the public domain.
Funding
This study received no external funding.
Supplemental material
Supplemental material for this article is available online.
References
Supplementary Material
Please find the following supplemental material available below.
For Open Access articles published under a Creative Commons License, all supplemental material carries the same license as the article it is associated with.
For non-Open Access articles published, all supplemental material carries a non-exclusive license, and permission requests for re-use of supplemental material or any part of supplemental material shall be sent directly to the copyright owner as specified in the copyright notice associated with the article.