
Abstract
Objective
Hepatocellular carcinoma is a leading cause of cancer mortality, and early detection remains limited by the low sensitivity of alpha-fetoprotein. This study aimed to identify serum-derived exosomal microRNAs with diagnostic potential for hepatocellular carcinoma and to explore their regulatory molecular networks.
Methods
This observational case–control study included 50 patients with hepatocellular carcinoma and 50 matched healthy controls. Serum exosomes were isolated and verified by transmission electron microscopy, nanoparticle tracking analysis, and flow cytometry for CD9, CD63, and CD81. High-throughput small RNA sequencing (three hepatocellular carcinoma samples vs three control samples) identified differentially expressed microRNAs. Predicted target genes were analyzed using protein–protein interaction networks based on the Search Tool for the Retrieval of Interacting Genes/Proteins database, Gene Ontology analysis, and Kyoto Encyclopedia of Genes and Genomes pathway enrichment. Candidate microRNAs were validated by reverse transcription quantitative polymerase chain reaction, and diagnostic performance was evaluated using receiver operating characteristic analysis.
Results
Seven differentially expressed microRNAs were identified, and bioinformatic network analysis revealed forkhead box O1 and serine/arginine-rich splicing factor 11 as central hub genes potentially targeted by hsa-miR-27a-3p and hsa-miR-493-3p, respectively. Reverse transcription quantitative polymerase chain reaction confirmed significant upregulation of miR-27a-3p (P = 0.003) and downregulation of miR-493-3p (P = 0.014) in hepatocellular carcinoma. Receiver operating characteristic analysis demonstrated high diagnostic accuracy for miR-493-3p (area under the curve = 0.840) and miR-27a-3p (area under the curve = 0.827). Importantly, the combined biomarker panel (alpha-fetoprotein, miR-27a-3p, and miR-493-3p) achieved markedly improved performance (area under the curve = 0.943), outperforming alpha-fetoprotein alone (area under the curve = 0.828).
Conclusions
Serum exosomal miR-27a-3p and miR-493-3p exhibit strong diagnostic potential and are associated with forkhead box O1 and serine/arginine-rich splicing factor 11. These findings highlight their promise as complementary biomarkers and provide new insight into exosome-mediated molecular regulation in hepatocarcinogenesis.
Keywords
Background
Hepatocellular carcinoma (HCC) is the predominant form of primary liver cancer and represents a major global health burden. 1 It accounts for the vast majority of primary hepatic malignancies and is strongly associated with chronic hepatitis virus infection, cirrhosis, and metabolic liver disease.2,3 According to recent global statistics, approximately 905,677 new cases and 830,180 deaths were reported in 2022, making HCC the sixth most common cancer and the third leading cause of cancer-related mortality worldwide. 4
Despite advances in treatment, late diagnosis remains a major barrier to improving survival outcomes. 5 Current diagnostic tools are suboptimal. Alpha-fetoprotein (AFP), the most widely used biomarker, has limited sensitivity and specificity for early-stage disease, while imaging modalities such as computed tomography (CT) and magnetic resonance imaging (MRI), though informative, are costly and less accessible in resource-limited settings.6,7 Therefore, identifying novel diagnostic biomarkers and understanding the molecular mechanisms of HCC are urgently needed to enhance early detection and therapeutic strategies.
Introduction
In response to the diagnostic challenges of HCC, research into novel biomarkers has intensified, with a growing focus on noninvasive and molecular approaches such as microRNAs (miRNAs) and exosomal components.8,9 miRNAs are small, noncoding RNAs that regulate gene expression at the post-transcriptional level and are frequently dysregulated in cancer.10–12 Exosomes are small extracellular vesicles (30–150 nm) secreted by diverse cell types that carry stable molecular cargoes including miRNAs, thereby protecting them from degradation and facilitating intercellular communication within the tumor microenvironment.13–15
Exosomal miRNAs have attracted considerable attention as promising noninvasive biomarkers because of their stability in bodily fluids and their functional roles in tumor-associated intercellular signaling. Specific exosomal miRNAs show potential for the early detection of HCC and for monitoring disease progression. 10 Moreover, modulation of exosomal miRNA expression has emerged as a potential therapeutic strategy. For example, targeting miR-21 within exosomes may disrupt the tumor-supportive microenvironment and inhibit HCC growth. 16 Although individual exosomal miRNAs have been implicated in HCC pathogenesis, the broader regulatory networks linking exosomal miRNAs, their target genes, and associated signaling pathways remain insufficiently characterized.17,18
In this study, we integrated serum exosomal miRNA profiling with bioinformatic network construction and functional enrichment analysis to identify key regulatory axes in HCC. By focusing on hub gene–miRNA interactions and validating candidate miRNAs in patient cohorts, this approach aims to bridge molecular mechanisms with clinical applicability, thereby advancing the development of precision diagnostic strategies for HCC.
Materials and methods
Patient and clinical samples
This study was conducted at The First Affiliated Hospital of Guilin Medical University. Patients were consecutively recruited, and serum samples were collected from 50 healthy individuals and 50 patients with HCC between February 2022 and February 2024. The age (56.07 ± 1.17 years) and sex of the healthy controls were matched to those of the patients with HCC to minimize potential confounding. Healthy controls were recruited on the basis of normal liver function test results and no history of liver disease, cancer, or other significant chronic illnesses. All participants provided written informed consent before enrollment, in accordance with the Declaration of Helsinki. The study protocol was approved by the Institutional Review Board of The First Affiliated Hospital of Guilin Medical University (Approval No. 2022YJSLL-25). All patient information was fully de-identified prior to analysis. Fasting peripheral blood samples were collected from all participants, and serum was separated and stored at −80°C for subsequent exosomal RNA extraction and high-throughput sequencing.
Exosome isolation from samples
Peripheral blood samples were collected and allowed to stand at room temperature for 30 min. Samples were then centrifuged at 3000 r/min for 10 min at 4°C to separate 1.5 mL of serum, which was transferred to an Eppendorf (EP) tube. Exosome purification and RNA extraction from serum were performed using the Minute™ High-Efficiency Exosome Precipitation Reagent Kit (Invent Biotechnologies, Minnesota, USA). A total of 750 µL of Exosome Precipitation Reagent was added to each serum sample, followed by incubation for 60 min at 4°C. After incubation, samples were centrifuged at 10,000 × g for 15 min at 4°C. The supernatant was discarded, and the pellet was washed with phosphate-buffered saline (PBS). A further centrifugation at 10,000 × g for 1 min at 4°C was performed. The final pellet was resuspended in 100 µL of PBS to obtain purified serum exosomes.
Identification of exosomes from serum samples
Exosome identification was performed using transmission electron microscopy (TEM) and nanoparticle tracking analysis (NTA). Purified exosomes from patients with HCC and non-tumor donors were negatively stained with 2% phosphotungstic acid on a copper grid for 2 min, followed by air drying for 10 min. The stained exosomes were then observed and imaged using a Tecnai G2 Spirit TEM (FEI, Thermo Fisher Scientific, Waltham, Massachusetts, USA) at the core facility of Zhejiang University. NTA was conducted using a NanoSight NS300 instrument (Malvern, UK) to determine the hydrodynamic diameter distribution of the exosomes, in accordance with the manufacturer’s instructions.
The surface markers of exosomes, including CD9, CD63, and CD81, were analyzed by flow cytometry. Immunofluorescence staining was performed using fluorescein isothiocyanate (FITC)-labeled antibodies: mouse anti-human CD9 (clone M-L13), CD63 (clone H5C6), and CD81 (clone JS-81), obtained from BD Pharmingen™. Isolated exosome samples (30 µL) were resuspended in 60 µL of PBS, and 20 µL of each FITC-labeled antibody was added, resulting in an approximate particle concentration of 1 × 10¹⁰ particles/mL. The mixtures were incubated at 37°C for 30 min, followed by two washes with PBS and centrifugation at 100,000 × g for 30 min at 4°C. The final pellet was resuspended in 100 µL of PBS and analyzed using a NanoFCM (N30E, NanoFCM Inc., China).
RNA extraction for sequencing and quality control
Total RNA was extracted from purified serum exosomes using the Total RNA Extraction Kit (Thermo Fisher Scientific, Massachusetts, USA) following the manufacturer’s instructions. RNA quantity and purity were assessed using a NanoDrop 2000 spectrophotometer (Thermo Fisher Scientific, Massachusetts, USA), and RNA integrity was assessed with an Agilent 2100 Bioanalyzer system (Agilent Technologies, California, USA). Only samples with an RNA integrity number (RIN) ≥7 were included to ensure suitability for high-quality RNA sequencing (RNA-seq) library construction.
Small RNA sequencing and data analysis
For library preparation, 1 μg of total RNA or 10 ng of small RNA was used. The 3′ SR Adaptor for Illumina was ligated to the small RNA using a 3′ ligation enzyme, and excess adaptor was blocked by hybridization with the SR RT Primer for Illumina to prevent adaptor-dimer formation. The 5′ SR Adaptor for Illumina was the ligated using a 5′ ligation enzyme, followed by first-strand cDNA synthesis with ProtoScript II Reverse Transcriptase. Each sample underwent polymerase chain reaction (PCR) amplification using P5 and P7 primers. PCR products were purified with DNA clean beads, selecting fragments of 140–160 bp, and further purified via polyacrylamide gel electrophoresis (PAGE). Library quality was validated using an Agilent 2100 Bioanalyzer. Libraries with unique indices were multiplexed, and qualified libraries were sequenced using paired-end 150 bp (PE150) reads on the Illumina MGI2000 System (MGI Tech Co., Ltd., China).
Differential expression analysis and target gene prediction
Differential expression analysis was performed using the DESeq2 Bioconductor package, which models count data with a negative binomial distribution. P-values were adjusted using the Benjamini–Hochberg method to control the false discovery rate. miRNAs with an adjusted P-value <0.05 were considered significantly differentially expressed. Target genes of the differentially expressed miRNAs (DEMs) were predicted using TargetScan Human 8.0, miRWalk, and the Comparative Toxicogenomics Database (CTD). Overlapping target genes identified by all three tools were determined using Venny 2.1.0.
Construction of the protein–protein interaction (PPI) regulatory network
PPI analysis was performed using the Search Tool for the Retrieval of Interacting Genes/Proteins (STRING) database, a comprehensive resource for both known and predicted PPIs. DEMs from HCC patients and healthy controls were analyzed to identify their target gene interactions. The species was set to Homo sapiens, and unconnected nodes were excluded. The resulting PPI network was visualized using Cytoscape 3.10.3, and network centrality analysis was performed with the CytoNCA plug-in to identify key hub genes and interactions.
Screening of potential key genes
Potential key genes were identified using the cytoHubba plug-in in Cytoscape, which ranks network nodes based on their topological attributes. Among the 11 methods available in cytoHubba, 3 topological algorithms were applied:19,20 degree centrality (DC), which assesses the influence of nodes within the network; betweenness centrality (BC), which measures the frequency at which a node lies on the shortest paths between other nodes; and closeness centrality (CC), which calculates the average shortest distance from a node to all other nodes in its connected component. Expression profiles and prognostic relevance of the identified genes were further analyzed using the GEPIA2 web server (http://gepia2.cancer-pku.cn/), which integrates RNA-seq data from The Cancer Genome Atlas (TCGA) and the Genotype-Tissue Expression (GTEx) projects. All GEPIA2 data are uniformly processed and normalized via the UCSC Xena Toil pipeline, allowing direct comparison between TCGA tumor samples and GTEx normal tissues.
GOSeq (v1.34.1) was employed to identify Gene Ontology (GO) terms enriched among the predicted miRNA target genes, with significance defined as an adjusted P-value <0.05. Kyoto Encyclopedia of Genes and Genomes (KEGG), a comprehensive resource encompassing genomes, biological pathways, diseases, drugs, and chemical substances, was used to perform pathway enrichment analysis of significantly differentially expressed genes.
Exosomal RNA extraction and real-time quantitative PCR (RT-qPCR)
The differential expression of candidate miRNAs (DEMs) was validated using RT-qPCR in plasma-derived exosome samples. Exosome isolation and miRNA purification were performed as described previously. Total RNA was extracted from the stored plasma exosome samples using the Total RNA Extraction Kit (Thermo Fisher Scientific, Massachusetts, USA) according to the manufacturer’s instructions. RT-qPCR was conducted using the TB Green® Premix Ex Taq™ II (Tli RNaseH Plus) Kit (Takara Bio, Japan) on an ABI 7500 Real-Time PCR System (Thermo Fisher Scientific, Waltham, Massachusetts, USA). Cycling conditions included an initial denaturation at 95°C for 30 s, followed by 40 cycles of 95°C for 5 s and 60°C for 34 s. Each sample was run in triplicate. Primers used for RT-qPCR are listed in Table 1 and were designed and synthesized by Shanghai Shenggong Bioengineering Co., Ltd. U6 small nuclear RNA served as the internal control, and relative expression levels of target miRNAs were calculated using the 2−ΔΔCq method.
Primer sequences for RT-qPCR used in exosomal miRNA experiments.
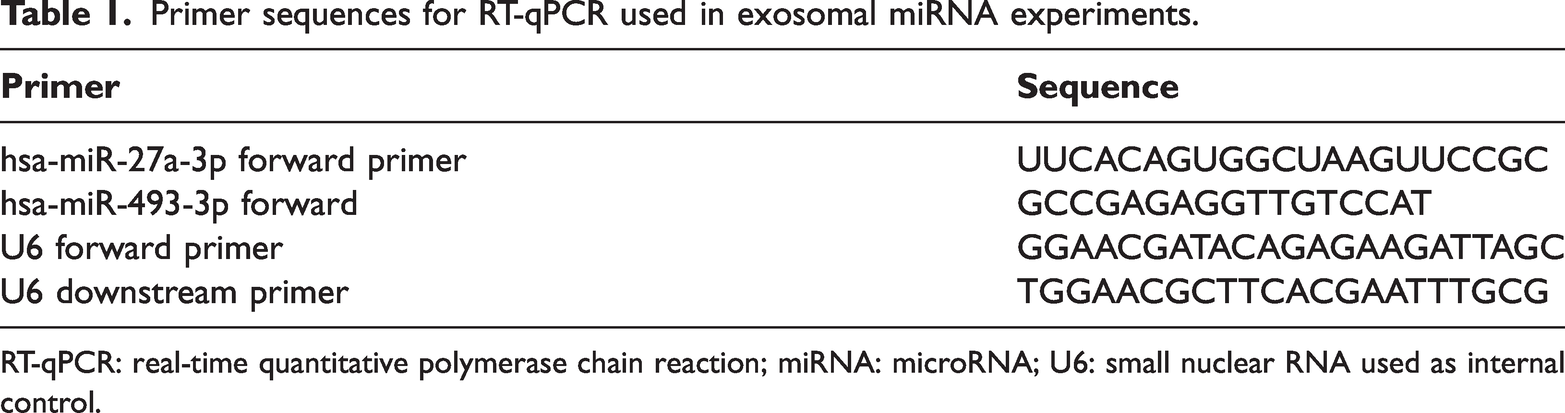
RT-qPCR: real-time quantitative polymerase chain reaction; miRNA: microRNA; U6: small nuclear RNA used as internal control.
Tumor biomarker detection
Serum AFP levels were measured using an electrochemiluminescence immunoassay (ECLIA) on a Cobas Elecsys 801 automated analyzer (Roche Diagnostics GmbH, Mannheim, Germany) following the manufacturer’s instructions. Original matched reagents (AFP assay kit, Roche Diagnostics, Germany) and quality control materials, including low- and high-level controls, were used to ensure assay accuracy and precision.
Strengthening the Reporting of Observational Studies in Epidemiology (STROBE) compliance
The reporting of this observational case–control study adheres to the STROBE guidelines for observational research. 21
Statistical analysis
All statistical analyses were performed using GraphPad Prism (version 10.0; GraphPad Software, San Diego, California, USA) and Statistical Package for the Social Sciences (SPSS) (version 24.0; IBM Corp., Armonk, New York, USA). Data distribution was assessed using the Shapiro–Wilk test. Normally distributed variables are presented as mean ± standard deviation (SD) and compared using the independent-samples t-test, whereas non-normally distributed variables are expressed as median (interquartile range) and compared using the Mann–Whitney U test. Categorical variables are summarized as counts and percentages and analyzed using the χ2 test or Fisher’s exact test, as appropriate. Receiver operating characteristic (ROC) curves were generated to evaluate the diagnostic performance of exosomal miRNAs and AFP. The area under the curve (AUC), sensitivity, specificity, 95% confidence interval (CI), and Youden index were calculated. Differences between AUCs were compared using the DeLong test. Correlations between miRNA expression levels and clinical characteristics were assessed using Pearson’s or Spearman’s correlation coefficients, depending on data distribution.
The study included 50 HCC patients and 50 matched healthy controls, a sample size determined based on feasibility and conventions in diagnostic biomarker research. Post hoc power analysis using observed effect sizes indicated ≥80% power (α = 0.05) to detect significant between-group differences and to identify AUC values ≥0.80 in ROC analyses, confirming adequate statistical power for the primary diagnostic endpoints. All statistical tests were two-tailed, with P < 0.05 considered statistically significant. Graphs were generated using GraphPad Prism version 10.0.
Results
Comparison of general characteristics of study subjects
General characteristics of the validation cohort are summarized in Table 2. There were no statistically significant differences in age or sex between the healthy control group and the HCC group.
Comparison of the general data of the patients in the validation cohort.

CNLC: Chinese Liver Cancer Staging System; HCC: hepatocellular carcinoma.
Characterization of exosomes isolated from HCC serum
Purified serum exosomes were characterized using TEM, NTA, and flow cytometry to confirm their identity. TEM imaging revealed the typical bilayer membrane structure of exosomes (Figure 1(a)).

Identification of exosomes. (a) TEM images of exosomes derived from the serum of HCC patients. (b) NTA results for exosomes from the serum of HCC patients and (c) the expression of exosomal surface marker proteins by flow cytometry analysis. TEM: transmission electron microscopy; NTA: nanoparticle tracking analysis; HCC: hepatocellular carcinoma.
NTA using a NanoSight NS300 particle size analyzer demonstrated an average particle size of 118.1 ± 2.8 nm for serum-derived exosomes, consistent with typical exosome diameters and indicating successful isolation (Figure 1(b)).
Exosome surface markers were analyzed using Nano FCM, focusing on CD9, CD63, and CD81. All three markers were detected on exosomes from both HCC patients and healthy controls, confirming the identity of the isolated vesicles (Figure 1(c)).
Expression analysis of DEMs in serum exosomes
Small RNA sequencing of serum-derived exosome from 3 HCC patients and 3 healthy controls detected 2777 miRNAs, of which 2569 were differentially expressed. A clustering heatmap illustrated the expression patterns of the top 43 significantly DEMs across the 6 samples in the HCC and healthy control groups (Figure 2(a)). Volcano plot analysis highlighted the top 10 miRNAs with the largest fold changes and smallest P-values (Figure 2(b)), while scatter plot analysis annotated the top 10 miRNAs ranked by ascending P-value that were also highly expressed (Figure 2(c)).

Clustering analysis of differential miRNAs. (a) Serum exosome-derived miRNA clustering heatmap. (b) Volcano plot of serum exosome-derived miRNAs and (c) Clustering scatter plot of serum exosome-derived miRNAs. miRNA: microRNA.
Integration of differential expression results identified seven significantly differentially expressed exosomal miRNAs, comprising five downregulated and two upregulated miRNAs (Table 3).
Differentially expressed miRNAs identified in serum exosomes, with log2-fold changes and mean normalized counts.

log2(FC): log2 (fold change); Padj: adjusted P-value using the Benjamini and Hochberg method to control the false discovery rate (FDR); HCC: hepatocellular carcinoma.
Prediction of target genes, network construction, and functional enrichment
The seven DEMs were analyzed using miRWalk, yielding 5703 predicted target genes. Cross-validation with TargetScan, miRDB, and miRTarBase identified 53 consensus target genes, of which 18 remained after excluding unconnected nodes in the STRING-derived PPI network (Figure 3(a)). Functional enrichment analysis indicated that these genes were involved in pathways related to cell cycle regulation and tumor progression, highlighting their potential role in HCC.
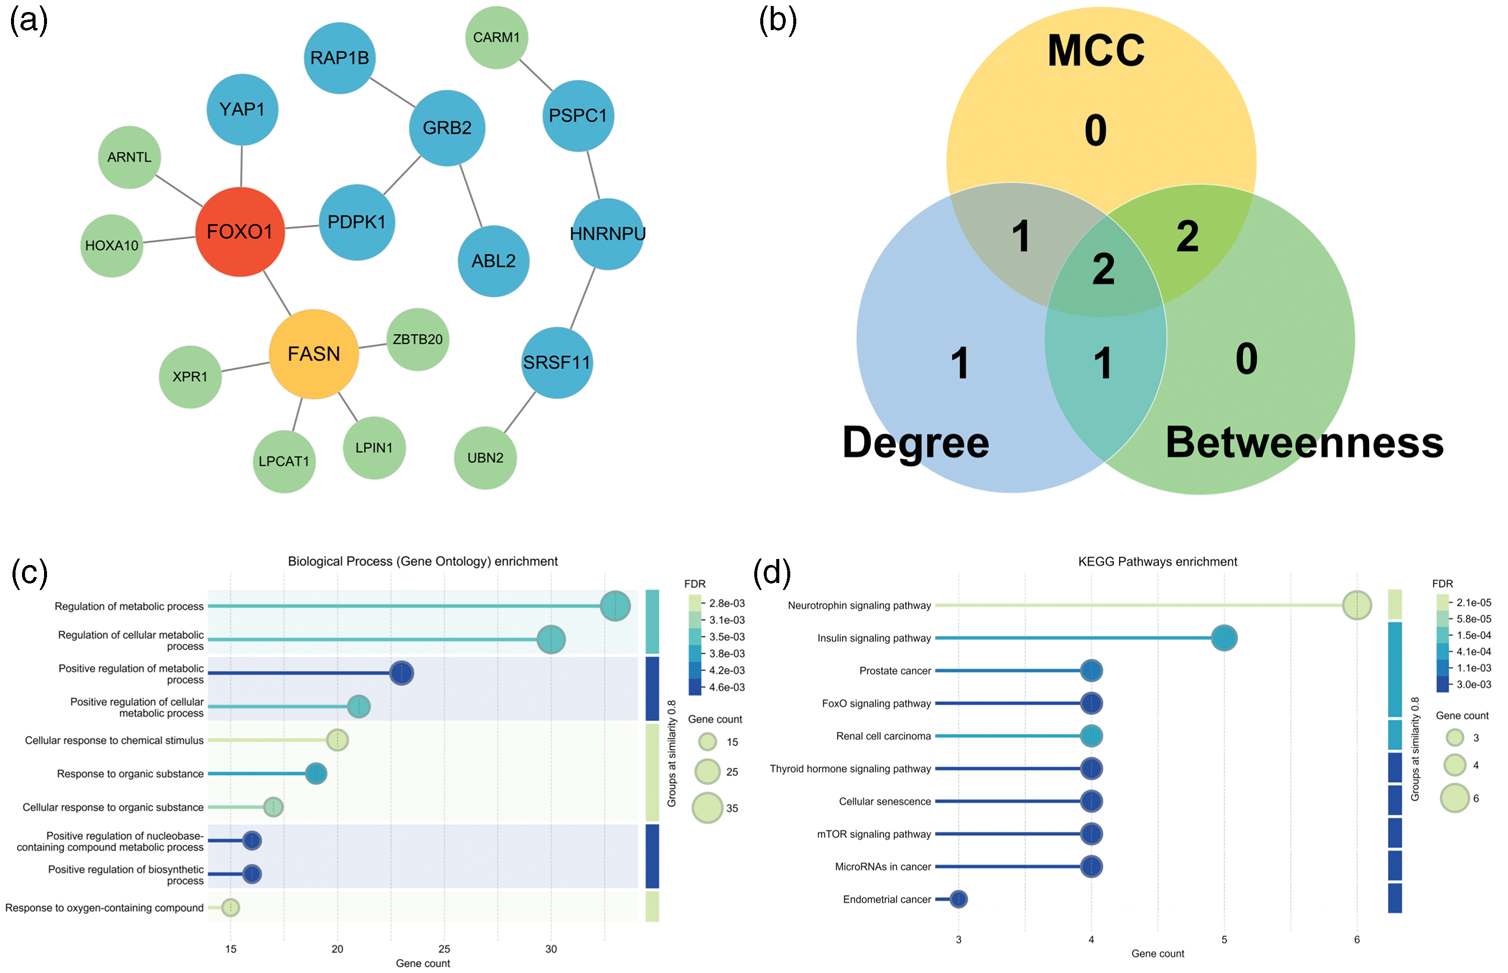
PPI diagram. (a) PPI regulatory network diagram. The network color is the progressive distribution from green to red, and the node size is the progressive arrangement from small to large. (b) Venn diagram of the intersection of the top 10 key nodes via the MCC, BC, and DC algorithms. Blue: top 10 key nodes according to the DC algorithm. Green: top 10 key nodes according to the BC algorithm. Yellow: top 10 key nodes according to the CC algorithm. (c) GO clustering analysis and (d) KEGG pathway enrichment analysis. PPI: protein–protein interaction; MCC: maximal clique centrality; BC: betweenness centrality; DC: degree centrality; CC: closeness centrality; GO: Gene Ontology; KEGG: Kyoto Encyclopedia of Genes and Genomes.
Topological analysis using DC, BC, and maximal clique centrality (MCC) ranked forkhead box O1 (FOXO1) as the most central hub gene, consistently appearing among the top five across all algorithms. Comparison of genes identified by each method (Table 4) and Venn diagram analysis (Figure 3(b)) revealed that FOXO1 and serine/arginine-rich splicing factor 11 (SRSF11) were among the top five genes recommended by all three algorithms. FOXO1 was identified as a shared high-ranking gene, suggesting its potential as a key diagnostic biomarker and regulatory driver in HCC.
Top five DEGs ranked by degree, betweenness, and MCC score.

DEG: differentially expressed gene; MCC: maximal clique centrality.
GO enrichment identified 21 significant biological processes, with the most relevant terms related to metabolic regulation, including fat cell differentiation, response to insulin stimulus, and nuclear-transcribed miRNA catabolic processes (Figure 3(c)). KEGG pathway analysis revealed 13 significantly enriched pathways, notably the neurotrophin signaling pathway (immune-related), the insulin signaling pathway (associated with invasive potential), and the FOXO signaling pathway, further supporting FOXO1 as a key regulator in HCC pathogenesis (Figure 3(d)).
Expression and survival analysis of key genes
Analysis using the GEPIA2 web server (http://gepia2.cancer-pku.cn/), which integrates RNA-seq data from TCGA and GTEx processed via the UCSC Xena Toil pipeline, showed that FOXO1 expression was significantly lower in HCC tissues compared with normal liver tissues (Figure 4(a)). Kaplan–Meier survival analysis indicated that reduced FOXO1 expression was significantly associated with shorter overall survival in HCC patients (Figure 4(b)). These findings suggest that FOXO1 downregulation is closely linked to poor clinical outcomes, highlighting its potential as both a diagnostic biomarker and therapeutic target in HCC.
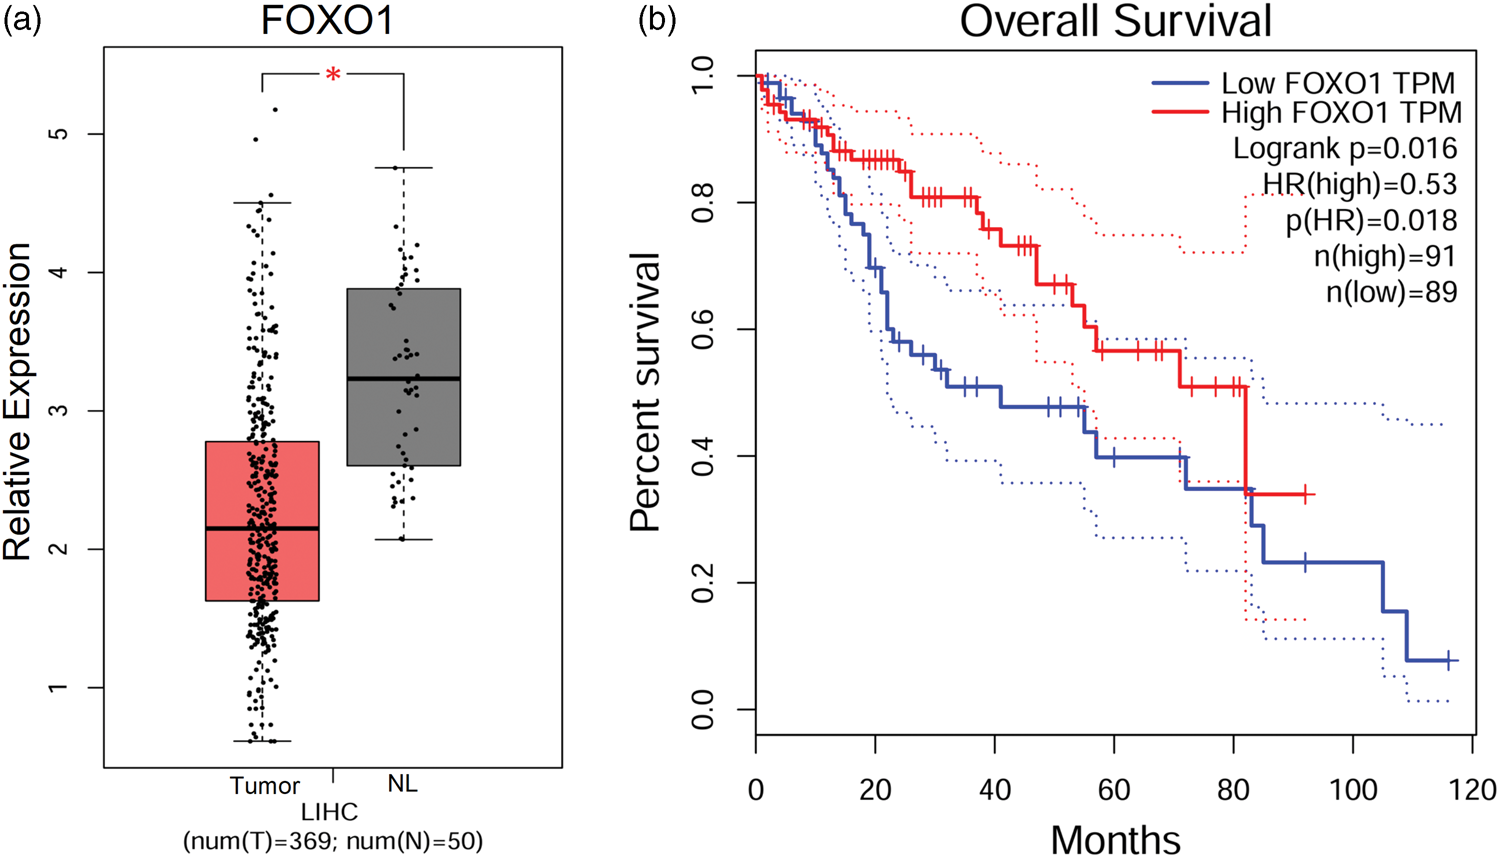
Expression and survival analysis of central genes. (a) Expression of FOXO1 in HCC tissues and normal tissues and (b) survival analysis of FOXO1 in HCC patients. HCC: hepatocellular carcinoma; FOXO1: forkhead box O1.
miRNA–mRNA pathway regulatory network and clinical validation
To investigate upstream regulatory mechanisms of the identified hub genes, target prediction was performed for four DEMs—hsa-miR-27a-3p, hsa-miR-424-5p, hsa-miR-493-3p, and hsa-miR-493-5p—using the miRWalk database, with cross-validation through TargetScan, miRDB, and miRTarBase. Integration of these data highlighted two key miRNAs—hsa-miR-27a-3p and hsa-miR-493-3p—that are closely associated with the hub genes (Figure 5). In the regulatory network, hsa-miR-27a-3p was predicted to target FOXO1, suggesting a potential axis contributing to HCC progression, while hsa-miR-493-3p was predicted to target SRSF11, HNRNPU, and XPR1. This integrative miRNA–mRNA network reveals post-transcriptional regulatory circuits in HCC, illustrating interactions between exosome-derived miRNAs and key oncogenic pathways.
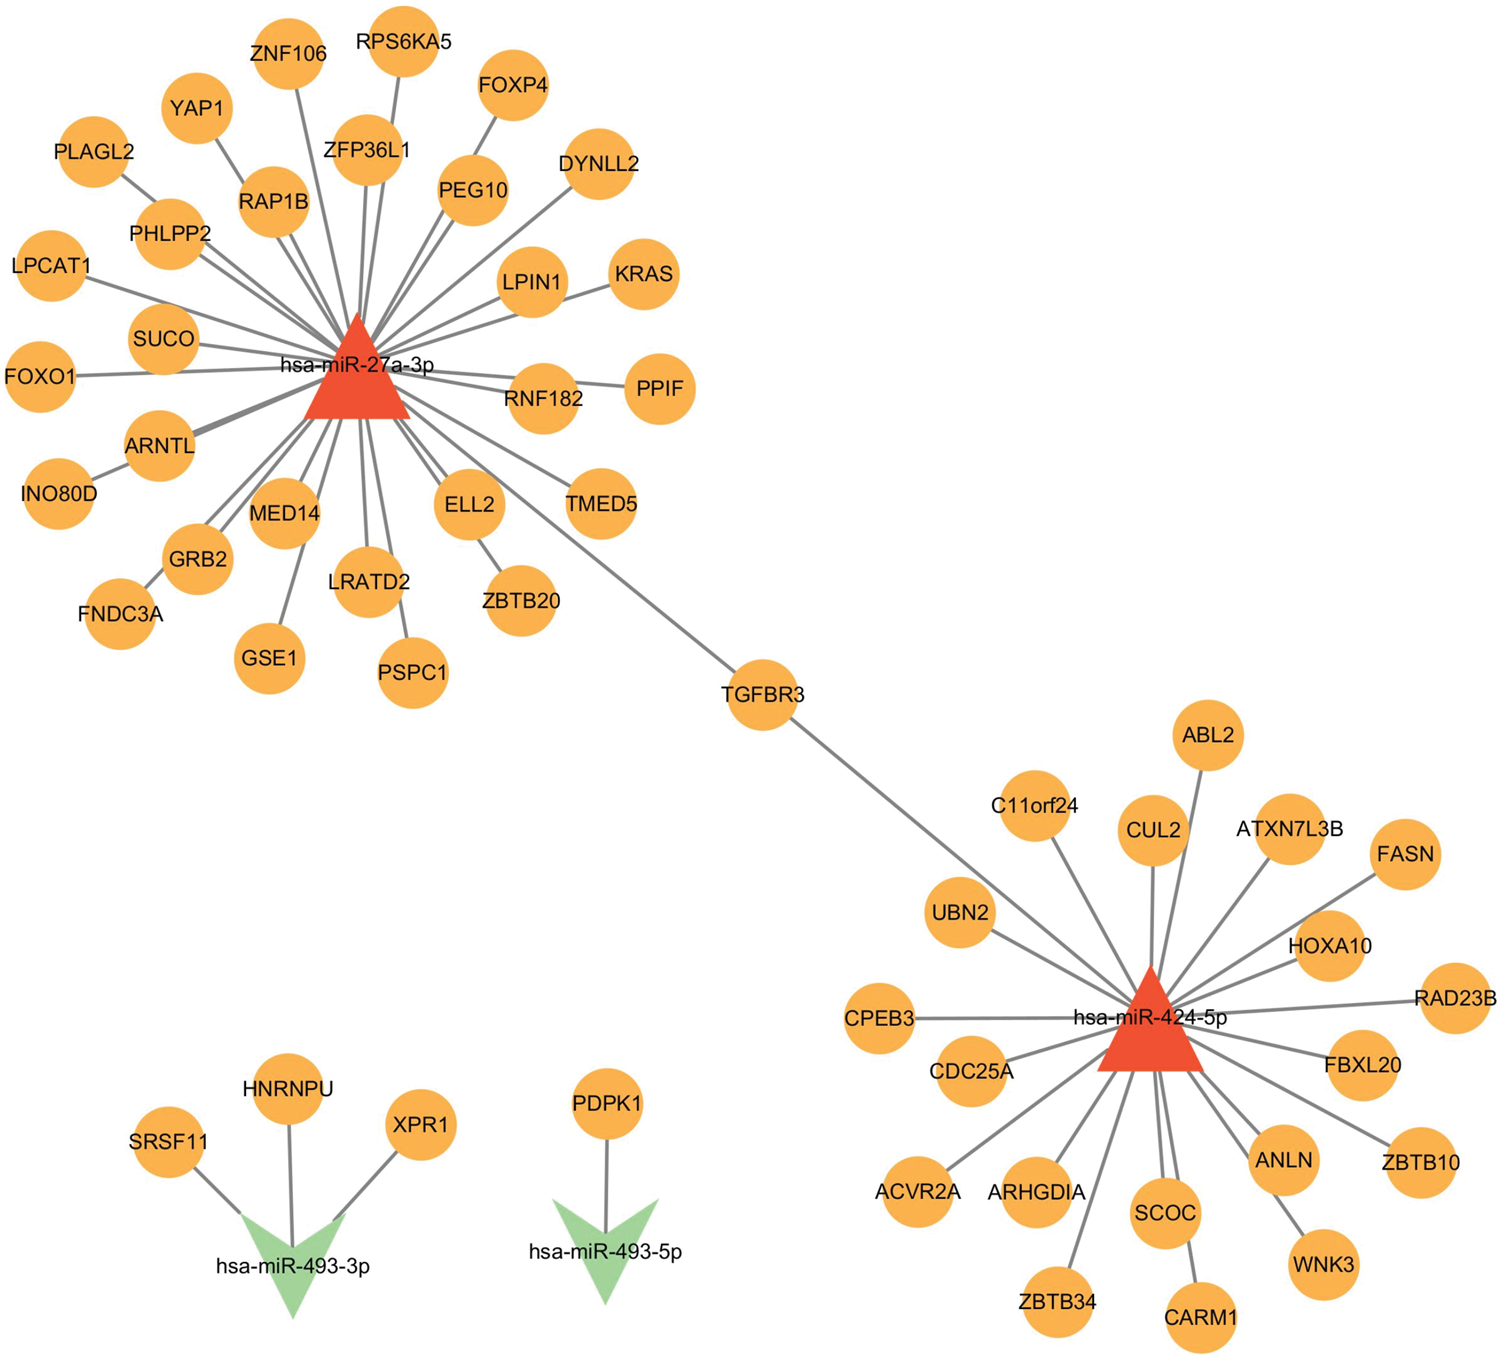
miRNA–mRNA–pathway regulatory network. Red triangle: upregulated miRNAs. Yellow dots: target mRNAs. Green triangle: downregulated miRNAs. miRNA: microRNA; mRNA: messenger RNA.
Based on these predicted targeting relationships, hsa-miR-27a-3p and hsa-miR-493-3p were selected for experimental validation. RT-qPCR analysis of plasma exosomes from 50 HCC patients and 50 healthy controls confirmed significant upregulation of hsa-miR-27a-3p (P = 0.003; Figure 6(a)) and significant downregulation of hsa-miR-493-3p (P = 0.014; Figure 6(b)) in HCC (Table 5).

Differentially expressed exosomal miRNAs expression and their diagnostic value. (a) Relative expression of miR-27a-3p between patients with HCC and the health control group. (b) Relative expression of miR-493-3p between patients with HCC and the NL group and (c) ROC curves of miR-27a-3p, miR-493-3p, AFP, and combined markers. *P < 0.05, **P < 0.01. miRNA: microRNA; HCC: hepatocellular carcinoma; NL: normal liver; ROC: receiver operating characteristic; AFP: alpha-fetoprotein.
Expression analysis of AFP and exosomal miRNAs in serum from HCC patients and healthy controls.

AFP: alpha-fetoprotein; HCC: hepatocellular carcinoma; SD: standard deviation.
Diagnostic performance compared with AFP
To evaluate the diagnostic value of exosomal miRNAs and their potential to improve upon AFP, ROC curve analysis was performed (Figure 6(c)). As summarized in Table 6, hsa-miR-493-3p showed the highest individual diagnostic accuracy (AUC = 0.840, 95% CI = 0.745–0.909), followed by hsa-miR-27a-3p (AUC = 0.827, 95% CI = 0.765–0.914) and AFP (AUC =0.828, 95% CI = 0.750–0.907). Optimal cutoff values derived from Youden’s index were 22.5 ng/mL for AFP, 7.186 for hsa-miR-27a-3p, and 3.163 for hsa-miR-493-3p, with corresponding sensitivities and specificities ranging from 0.72 to 0.76 (Table 6).
Diagnostic performance of AFP and exosomal miRNAs in serum from HCC patients.
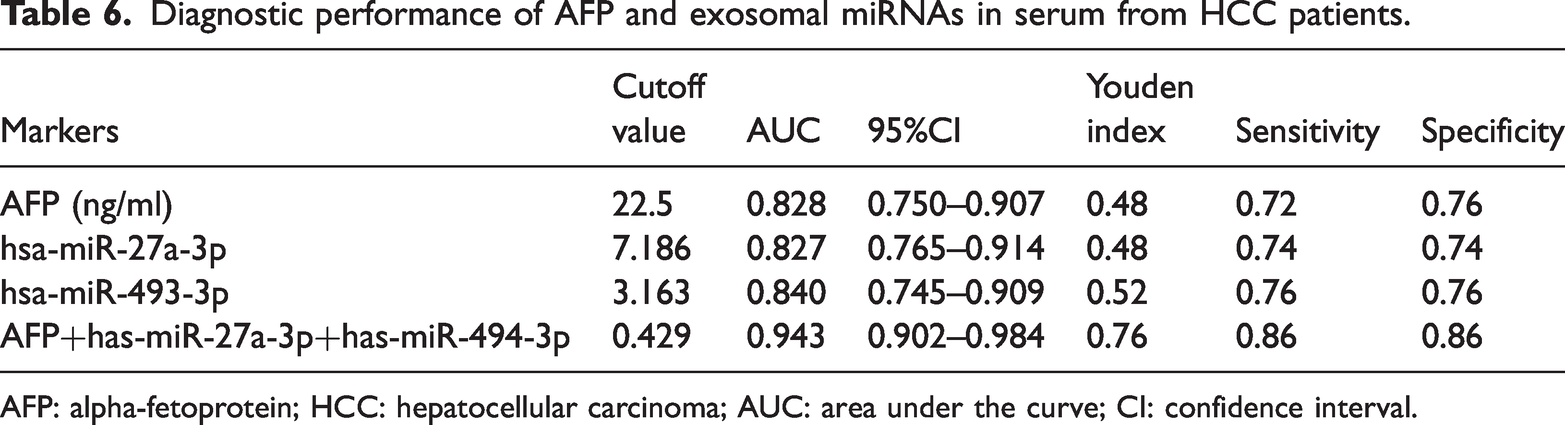
AFP: alpha-fetoprotein; HCC: hepatocellular carcinoma; AUC: area under the curve; CI: confidence interval.
Notably, the combined biomarker panel (AFP + hsa-miR-27a-3p + hsa-miR-493-3p) demonstrated superior diagnostic performance, achieving an AUC of 0.943 (95% CI = 0.902–0.984), Youden index = 0.76, sensitivity = 0.86, and specificity = 0.86. This improvement over AFP alone indicates that integration of exosomal miRNAs with AFP could substantially enhance early detection of HCC.
Discussion
Early detection of HCC remains a critical challenge despite advances in surveillance, imaging, and therapeutic strategies. 4 Although AFP is widely used in clinical practice, its limited sensitivity and specificity highlight the need for novel biomarkers with improved diagnostic performance.22,23 In this study, we identified and validated two serum exosomal miRNAs—hsa-miR-27a-3p and hsa-miR-493-3p—as promising diagnostic candidates, each associated with key regulatory genes implicated in HCC progression. These results expand current understanding of exosome-mediated molecular alterations in HCC and emphasize their potential application in precision diagnostics.
Intercellular communication plays a pivotal role in HCC development. Beyond traditional autocrine and paracrine signaling, exosomes provide a unique mechanism for cell-to-cell interactions. 24 Given the importance of intercellular communication in HCC progression, exosomal miRNAs represent promising avenues for the identification of novel biomarkers and therapeutic targets, owing to their stability in circulation and tumor-specific expression profiles. 25 Nevertheless, the complex regulatory networks of HCC necessitate further investigation to elucidate the specific mechanisms by which exosomal miRNAs modulate tumorigenesis.
By integrating high-throughput sequencing, bioinformatics, and RT-qPCR validation, we identified seven differentially expressed exosomal miRNAs—hsa-miR-136-3p, hsa-miR-27a-3p, hsa-miR-382-3p, hsa-miR-411-5p, hsa-miR-424-5p, hsa-miR-493-3p, and hsa-miR-493-5p—with network analysis highlighting FOXO1 as the most central hub in the PPI network. These miRNAs likely contribute to HCC pathogenesis and show promise as disease biomarkers. The identification of these miRNAs, consistent with previous studies, reinforces their reliability as biomarkers.26–29 Notably, analysis using the GEPIA2 web server, which integrates RNA-seq data from TCGA and GTEx processed via the UCSC Xena Toil pipeline, revealed marked downregulation of FOXO1 in HCC, with low expression significantly associated with shorter overall survival. These findings support previous reports of FOXO1 functioning as a tumor suppressor through the Wnt/β-catenin and transforming growth factor-beta (TGF-β) signaling pathways.30,31
Our regulatory network analysis indicated that FOXO1 is a putative downstream target of hsa-miR-27a-3p, suggesting that overexpression of this miRNA may facilitate tumor progression by repressing FOXO1-mediated tumor suppression. Previous studies have reported that hsa-miR-27a-3p is frequently upregulated in HCC, promoting proliferation, invasion, and metastasis through activation of oncogenic pathways such as PI3K/AKT by targeting FOXO1, PPARγ, and other genes.32,33 Its expression level has been correlated with HCC progression and poor prognosis, although a few studies have suggested a potential tumor-suppressive role. 34 hsa-miR-27a-3p may serve as a diagnostic biomarker, and targeted inhibition of miR-27a has shown antitumor effects in preclinical models, offering a potential therapeutic approach for HCC. 35 However, the precise underlying mechanisms remain to be fully elucidated. Similarly, SRSF11, a pre-mRNA splicing factor, has been implicated in tumor cell proliferation and metastasis,36–38 and our bioinformatic analysis suggests that hsa-miR-493-3p may regulate SRSF11 expression post-transcriptionally. Together, these predicted interactions highlight potential regulatory networks connecting exosome-derived miRNAs to hepatocarcinogenesis.
Quantitative analysis of diagnostic performance demonstrated that both exosomal miRNAs provide measurable improvements over AFP alone. As presented in Tables 5 and 6, hsa
Beyond the diagnostic implications highlighted in this study, several future directions warrant attention. Integrating exosomal miRNAs into multi-omic surveillance frameworks that combine circulating nucleic acids, tumour-derived proteins, and imaging data could enhance early detection capabilities. Longitudinal monitoring of hsa-miR-27a-3p and hsa-miR-493-3p may also elucidate dynamic molecular changes during HCC progression and treatment response. From a translational standpoint, emerging therapeutic strategies—including GLP-1-based metabolic interventions, selective 20S proteasome inhibitors, and natural compounds such as hinokitiol with immunomodulatory and antitumor effects39–41—may complement biomarker-driven early detection, supporting mechanism-informed therapeutic development. Collectively, the integration of exosomal miRNAs with advanced molecular and pharmacological tools has the potential to improve precision screening and personalized management of HCC.
In summary, this study identifies two serum exosomal miRNAs—hsa-miR-27a-3p and hsa-miR-493-3p—as promising diagnostic biomarkers for HCC. Both miRNAs exhibited significant differential expression and demonstrated superior diagnostic performance compared with AFP alone. When combined with AFP, the three-marker panel achieved the highest diagnostic accuracy, highlighting the added value of exosomal miRNAs for early HCC detection. Bioinformatic analyses suggest that hsa-miR-27a-3p and hsa-miR-493-3p may regulate FOXO1 and SRSF11, respectively, although these interactions remain predictive and require functional validation. Incorporating exosomal miRNAs into AFP-based screening strategies could enhance early detection, improve risk stratification, and potentially lead to better clinical outcomes. Future large-scale and mechanistic studies are warranted to confirm their clinical applicability and clarify their roles in hepatocarcinogenesis.
Strengths of the study
This study has several key strengths. First, it employed a well-matched case–control design with rigorous exosome isolation and characterization using TEM, NTA, and flow cytometry. Second, the multi-phase approach—integrating high-throughput sequencing, bioinformatic analysis, and RT-qPCR validation—provides a robust framework for reliable biomarker discovery. Third, linking dysregulated miRNAs to hub genes (FOXO1 and SRSF11) enhances biological interpretability and supports their potential mechanistic role in HCC pathogenesis.
Limitations
Several limitations warrant consideration. First, the sample size was relatively small (50 HCC patients and 50 healthy controls), potentially limiting statistical power and generalizability. Second, the study was conducted at a single center, and external validation in independent, multicenter cohorts is needed to confirm the diagnostic performance of hsa-miR-27a-3p and hsa-miR-493-3p. Third, the inferred miRNA–mRNA interactions (miR-27a-3p→FOXO1 and miR-493-3p→SRSF11) were primarily based on bioinformatic predictions and expression correlations; functional validation experiments such as luciferase reporter assays, gene knockdown, or overexpression studies were not performed, so these associations should be interpreted as potential regulatory relationships rather than confirmed causal mechanisms. Finally, this study focused on diagnostic value, leaving the prognostic potential and therapeutic relevance of exosomal hsa-miR-27a-3p and hsa-miR-493-3p unexplored. Future studies integrating experimental validation with longitudinal clinical data will be essential for translating these biomarkers into routine HCC screening and management.
Conclusions
This study identifies two serum exosomal miRNAs, hsa-miR-27a-3p and hsa-miR-493-3p, as promising noninvasive biomarkers for HCC. Both miRNAs exhibited significant differential expression and outperformed AFP in diagnostic accuracy, with the combined panel achieving the highest AUC. Bioinformatic analyses indicate potential regulatory associations with FOXO1 and SRSF11, which require further functional validation. These findings support the integration of exosomal miRNAs into AFP-based screening strategies to enhance early detection and improve clinical management of HCC.
Footnotes
Acknowledgments
The authors thank the Department of Laboratory Medicine and The First Affiliated Hospital of Guilin Medical University for their support, and the authors are grateful to all sample donors for their contributions.
Author contributions
Conceptualization, X.J. and Y.J.; methodology, S.Q. and M.S.; software, X.J.; validation, X.J., M.S. and L.S.; formal analysis, T.Q.; investigation, X.J.; resources, Y.J.; data curation, M.S.; writing—original draft preparation, X.J. and Y.J.; writing—review and editing, S.Q. and Y.J.; visualization, Y.J.; supervision, S.Q.; project administration, Y.J.; funding acquisition, Y.J. and X.J. All authors have read and approved the published version of the manuscript. Xiao Jingwen and Ma Shiyue contributed equally to this work and share first authorship. Yang Jun and Shi Qingfeng are the co-corresponding authors.
Data availability statement
Publicly available datasets were analyzed in this study. Gene expression and survival data were obtained from the GEPIA2 database (![]() ), which integrates RNA-seq expression data from The Cancer Genome Atlas (TCGA) and the Genotype-Tissue Expression (GTEx) projects. Specifically, the TCGA-LIHC (liver HCC) dataset and corresponding GTEx normal liver tissue data were used. The RNA-seq data generated in this study have been deposited in the Gene Expression Omnibus (GEO) database under accession number GSE306252. No preprint of this manuscript has been published.
), which integrates RNA-seq expression data from The Cancer Genome Atlas (TCGA) and the Genotype-Tissue Expression (GTEx) projects. Specifically, the TCGA-LIHC (liver HCC) dataset and corresponding GTEx normal liver tissue data were used. The RNA-seq data generated in this study have been deposited in the Gene Expression Omnibus (GEO) database under accession number GSE306252. No preprint of this manuscript has been published.
Declaration of conflicting interests
The authors declare no conflicts of interest.
Funding
This research was supported by the Guangxi Natural Science Foundation of China (Grant Nos. 2020GXNSFAA297157 and 2024JJH140492), the Guangxi Medical and Health Appropriate Technology Development and Promotion Application Project (Grant No. S2018018), and the Self-funded Research Project of Guangxi Health Commission (Grant No. ZC-C20231594).
Informed consent statement
Informed consent was obtained from all participants involved in the study.
Institutional review board statement
The study was conducted in accordance with the Declaration of Helsinki and approved by the Ethics Committee of The First Affiliated Hospital of Guilin Medical University.