
Abstract
Objective
Our objective was to investigate a novel cancer-associated fibroblast–related gene signature for predicting clinical outcomes in patients with diffuse large B cell lymphoma.
Methods
The cancer-associated fibroblast–related module genes were identified from Gene Expression Omnibus datasets using weighted gene co-expression network analysis in our retrospective study. Least Absolute Shrinkage and Selection Operator Cox regression was applied to screen a minimal set of genes and construct a prognostic cancer-associated fibroblast–related gene signature for diffuse large B cell lymphoma. Kaplan–Meier plots and receiver operating characteristic curves were used to assess the prognostic performance of the prognostic cancer-associated fibroblast–related genes. A nomogram encompassing the clinical information and prognostic scores of the patients was constructed. Additionally, the relationships of the gene signature with the immune landscape and drug sensitivity were explored.
Results
Capitalizing on machine learning, we developed a prognostic cancer-associated fibroblast–related gene signature risk model, efficiently categorizing patients with diffuse large B cell lymphoma into high- and low-risk groups and exhibiting a more robust capacity for survival prediction. The nomogram showed stronger prognostic ability than the clinical factor–based model or the risk score alone. We also observed significant differences in immune cell profiles and therapeutic responses between the two groups, offering valuable insights for developing personalized treatments for diffuse large B cell lymphoma.
Conclusions
We developed a prognostic cancer-associated fibroblast–related gene–based genetic risk model to predict the prognosis of diffuse large B cell lymphoma, potentially aiding in treatment selection.
Keywords
Introduction
Diffuse large B cell lymphoma (DLBCL), accounting for approximately 30% of all non-Hodgkin lymphomas, is a heterogeneous and aggressive disease showing differences in clinical presentation, pathological characteristics, and molecular features. 1 DLBCL is typically treated with rituximab, cyclophosphamide, doxorubicin, vincristine, and prednisone (R-CHOP). However, only 60% of patients with DLBCL have been cured with R-CHOP, with one of three patients experiencing relapse or refractory disease.2,3 Thus, identifying novel prognostic markers and therapeutic targets is crucial to advancing precision medicine in DLBCL.
A crucial factor in the pathobiology of DLBCL, with possible prognostic and predictive values, is the tumor microenvironment (TME). 4 Cancer-associated fibroblasts (CAFs) are a prominent component of the TME with substantial heterogeneity and plasticity. In various types of cancer, the origins, phenotypes, and functions of CAFs are distinct. CAFs modulate cancer metastasis through synthesis and remodeling of the extracellular matrix (ECM) and production of growth factors, influencing angiogenesis, tumor mechanics, drug access, and therapeutic responses. 5 A study demonstrated that CAFs can inhibit CD8+ T cells and activate FoxP3+ lymphocytes by secreting interleukin 6 (IL-6), thus promoting immunosuppression of the TME. 6 Activated CAFs in breast cancer and possibly in other carcinomas are associated with immunosuppressive populations of T lymphocytes. 7 In contrast, some subtypes of CAFs, such as Slit2+ and CD146+CAFs, exert tumor-suppressive effects and even increase the sensitivity of chemotherapy. 8 Regarding DLBCL, the stromal 1 gene signature shows enrichment in CAFs, with its expression being inversely correlated with the tumor stage. 9 A recent study reported that understanding CAFs and the interaction process in the TME may help develop a prognostic model and improve the efficacy of cancer treatments in the future. 10 Despite its crucial role in tumor development, there are currently no reliable prognostic markers for CAFs to predict DLBCL prognosis and treatment responses. Thus, exploring reliable prognostic markers for CAFs is critical for formulating and optimizing treatment strategies.
Herein, we determined a new prognostic biomarker for CAFs, which may serve as a robust prognostic marker for DLBCL, thus aiding in appropriate clinical treatment recommendation. We analyzed the sequencing data of DLBCL cohorts from the Gene Expression Omnibus (GEO) database using weighted gene co-expression network analysis (WGCNA), which is a bioinformatics tool used to analyze gene expression patterns across multiple samples and identify associations between modules and specific traits or phenotypes by clustering genes with similar expression patterns. 11 Then, we developed and validated a prognostic risk-score model using the Least Absolute Shrinkage and Selection Operator (LASSO), a commonly used method that provides satisfactory prediction accuracy and interpretability in establishing prognostic models. 12 The established risk signature strongly correlates with immune cells and immune checkpoints and may also guide medication choices for patients with DLBCL.
Materials and methods
Data collection and preparation
We obtained the microarray data from GSE10846 and GSE11318 datasets using the same platform GPL570 and the corresponding clinical information from the GEO database (https://www.ncbi.nlm.nih.gov/geo/). After excluding samples with incomplete transcriptomic and clinical data, we retained 412 DLBCL samples and 20,059 genes for further analysis. To validate the robustness of our model, we performed external validation using the GSE53786 dataset. This retrospective study was performed in accordance with the Helsinki Declaration of 1975, as revised in 2024. All patient details have been de-identified. The reporting of this study conforms to the Strengthening the Reporting of Observational Studies in Epidemiology (STROBE) guidelines. 13
Identification of CAF-specific markers
CAF infiltration and stromal scores were calculated using a microenvironment cell population (MCP) counter 14 and Estimation of Stromal and Immune Cells in Malignant Tumor Tissues using Expression Data (ESTIMATE) algorithms. 15 A WGCNA was performed on the expression profiles of 247 prognostic genes (Supplementary Table 1) identified via univariate Cox analysis to explore their relationship with CAF abundance. We then identified significant gene modules positively correlated with CAF fractions. Based on the mean connectivity and scale-free topology model fit, the soft threshold power (β) value was selected (scale-free topology r2 > 0.8). Similar genes were grouped into the same candidate module using a “dynamic tree-cutting” algorithm, with a minimum module size of 40. Finally, the correlation between the CAF score and module eigengenes was assessed using Pearson’s correlation coefficient, and the gene module with the smallest p-value was selected as the most relevant module for the CAF score. Genes in the module were defined as CAF-related markers and extracted for further analyses.
Construction and validation of a prognostic CAF-related gene signature
We randomly categorized 412 patients with DLBCL in a 7:3 ratio, yielding 288 patients in the training set and 124 in the validation cohort. A LASSO Cox dimension reduction analysis was performed using ‘glmnet’ and survival packages in R. The λ value corresponding to the minimum partial likelihood of deviance was selected as the optimal λ in our study. Finally, the candidate genes and corresponding λ values were obtained based on the overall survival (OS) of patients with DLBCL in the training group. The risk score of each patient was calculated. We classified all samples into low-risk and high-risk groups based on the median risk score of samples from the training set. We used the R package ‘forestplot’ to screen 13 prognostic CAF-related genes based on univariate Cox analysis in the total dataset. Principal component analysis (PCA) and t-distributed stochastic neighbor embedding (t-SNE) were used to evaluate the classification accuracy of the gene signature. We used the Kaplan–Meier survival curve to compare the OS between high-risk and low-risk groups. We used the ‘timeROC’ package to assess the accuracy of our model predictions. Finally, we used the validation database to assess the reliability of our model.
Analysis of prognostic independence
To further investigate the prognostic independence between clinical prognostic factors and risk score, clinical factors and risk scores from the DLBCL data were included in both univariate and multivariate Cox regression models. Using a threshold of p < 0.05, independent prognostic factors were screened.
Nomogram construction
Nomogram analysis was conducted in the training group using ‘rms’ package in R. The upper part indicated the scoring system and the lower part indicated the prediction system. Calibration curves and C-index values were used to show the accuracy of survival prediction.
Evaluation of potential prognostic values of risk score and other clinical characteristics
Relevant grouping information and clinicopathological features are shown in Supplementary Table 2. Boxplots were used to indicate the distribution of risk scores across different clinical characteristics of DLBCL. The significance of the difference between the two groups was assessed using the Wilcoxon test, whereas differences among more than two groups were evaluated using the Kruskal–Wallis test (Statistical Package for Social Sciences (SPSS) version 22; IBM Inc., Armonk, New York).
Assessment of immune cell infiltration
The ESTIMATE algorithm, accessible through the ‘estimate’ package in R, facilitated the analysis of variations in the stromal score, immune score, and ESTIMATE score. Using single-sample gene set enrichment analysis (ssGSEA) through the ‘GSVA’ package, enrichment scores were compared. These scores indicated the relative abundance of tumor-infiltrating immune cell types and functions.
Drug sensitivity prediction
We used the ‘OncoPredict’ R package to obtain susceptibility data in the Genomics of Drug Sensitivity in Cancer 2 (GDSC2) database and predict the therapeutic response of DLBCL to various drugs. The difference in drug sensitivity between the high-risk and low-risk groups was compared using sensitivity score, which was positively correlated with the higher half inhibitory concentration (IC50) value of chemotherapeutic agents. 16
Results
Construction of weighted gene co-expression networks and identification of CAF-related modules
CAF infiltration and stromal scores were calculated using MCP counter and ESTIMATE algorithms in 412 patients with DLBCL from the cohort of GSE10846 and GSE11318. Using univariate Cox regression analysis, we screened 247 genes significantly associated with a prognosis of DLBCL by setting a threshold of adjusted p < 0.05 (Supplementary Table 1). We constructed a weighted gene co-expression network using WGCNA to obtain gene modules associated with CAFs based on the expression profiles of 247 prognostic genes. A soft threshold of β = 8 (Figure 1(a)) was chosen for the scale-free topological network model fitting (r2 = 0.86). The dynamic tree-cutting algorithm assigned highly similar genes to the same module, resulting in three gene modules that were clustered together through average linkage hierarchical clustering, meeting the hierarchical clustering analysis threshold of <0.30. Furthermore, the correlations between CAFs and each module were analyzed and presented as a heatmap (Figure 1(b)). The results suggested that the blue module (r = 0.69, p = 6e−56), which included 58 module genes, showed the strongest correlation with CAF infiltration scores (Figure 1(c), Supplementary Table 1). Furthermore, we displayed a correlation between the 58 module genes for CAFs (Figure 1(d)).

CAF-related gene module was identified by WGCNA. (a) The test of scale independence and mean connectivity for constructing a scale-free network. (b) Hierarchical clustering dendrogram of co-expressed genes after module fusion. (c) Heatmap of the correlation between module and trait and (d) results of gene correlation analysis between 58 module genes. CAF: cancer-associated fibroblast; WGCNA: weighted gene co-expression network analysis.
Establishment of the prognostic CAF-related risk score model
We performed LASSO regression analysis of 58 genes in the blue module and extracted 13 genes related to CAFs in DLBCL when the first-rank value of log(λ) was the minimum likelihood of deviance (Figure 2(a)). We ultimately identified 13 prognostic CAF-related genes (PCRGs): ALDH2, TOM1L1, TNFRSF11B, CSTA, KAL1, ASAP2, IGFBP3, PMEPA1, LXN, SLC12A8, C15orf48, CCDC71L, and FNDC1. Subsequently, these 13 candidate genes and their corresponding λ values were used to calculate the risk score for each patient, using the following formula: risk score = (−0.0841 × expALDH2) + (−0.1379 × expTOM1L1) + (−0.0132 × expTNFRSF11B) + (−0.0820 × expCSTA) + (−0.0557 × expKAL1) + (−0.0369 × expASAP2) + (−0.0591× expIGFBP3) + (−0.0144 × expPMEPA1) + (−0.0445 ×expLXN) + (−0.0972 × expSLC12A8) + (−0.0188 × expC15orf48) + (−0.0726 × expCCDC71L) + (−0.1566 × expFNDC1). The median risk score of the database was set as the cutoff value. A forest plot was used to visualize the results, highlighting 13 genes significantly associated with patient prognosis (Figure 2(b)).

Identification and establishment of the CAF-related risk score model. (a) LASSO coefficient profile of 13 PCRGs. (b) Forest plot of PCRGs. (c) PCA of patients with DLBCL in the training and validation databases. (d) t-distributed stochastic neighbor embedding (t-SNE) analysis of patients with DLBCL in the training and validation databases. (e)–(f) Distribution of the risk score in the training (e) and validation databases (f). (g)–(h) Distribution of survival status with an increasing risk score in the training (g) and validation databases (h). CAF: cancer-associated fibroblast; LASSO: Least Absolute Shrinkage and Selection Operator; PCA: principal component analysis; DLBCL: diffuse large B cell lymphoma; PCRGs: prognostic CAF-related genes.
The risk score reliably predicts the prognosis of patients with DLBCL
To assess the prognostic value of these PCRGs, the samples from GSE10846 and GSE11318 databases were classified randomly into two groups: training group and validation group. PCA (Figure 2(c)) and t-SNE (Figure 2(d)) based on the calculated risk score distinctly segregated patients with DLBCL into two groups, emphasizing the representative nature of these genes. Based on the risk score of each patient, patients in the training and validation groups were divided into high-risk and low-risk groups (Figure 2(e)–(f)). The distribution of the OS status was visualized to demonstrate that the samples of the two risk groups were reasonably distributed (Figure 2(g)–(h)). Kaplan–Meier analysis revealed that the higher risk scores were significantly associated with poorer OS in both the training set (log-rank p < 0.001) and validation set (log-rank p = 0.007) (Figure 3(a)–(b)). Time-dependent receiver operating characteristic (ROC) curves indicated that the risk model effectively distinguished 1-, 3-, and 5-year OS rates. The area under the curve (AUC) values for 1, 3, and 5 years were 0.826, 0.808, and 0.795, respectively, indicating that this model was a strong prognosticator (Figure 3(c)). Next, a 1-year ROC curve analysis was performed, revealing that the ROC of the risk score (AUC = 0.826) was significantly higher than that of the prognostic-related clinical parameters, such as stage (AUC = 0.569) (Figure 3(d)), validating the accuracy of the risk model. We performed external validation using the GSE53786 dataset, which confirmed the predictive accuracy and generalizability of our findings (Supplementary Figure S1(a) to (f)).
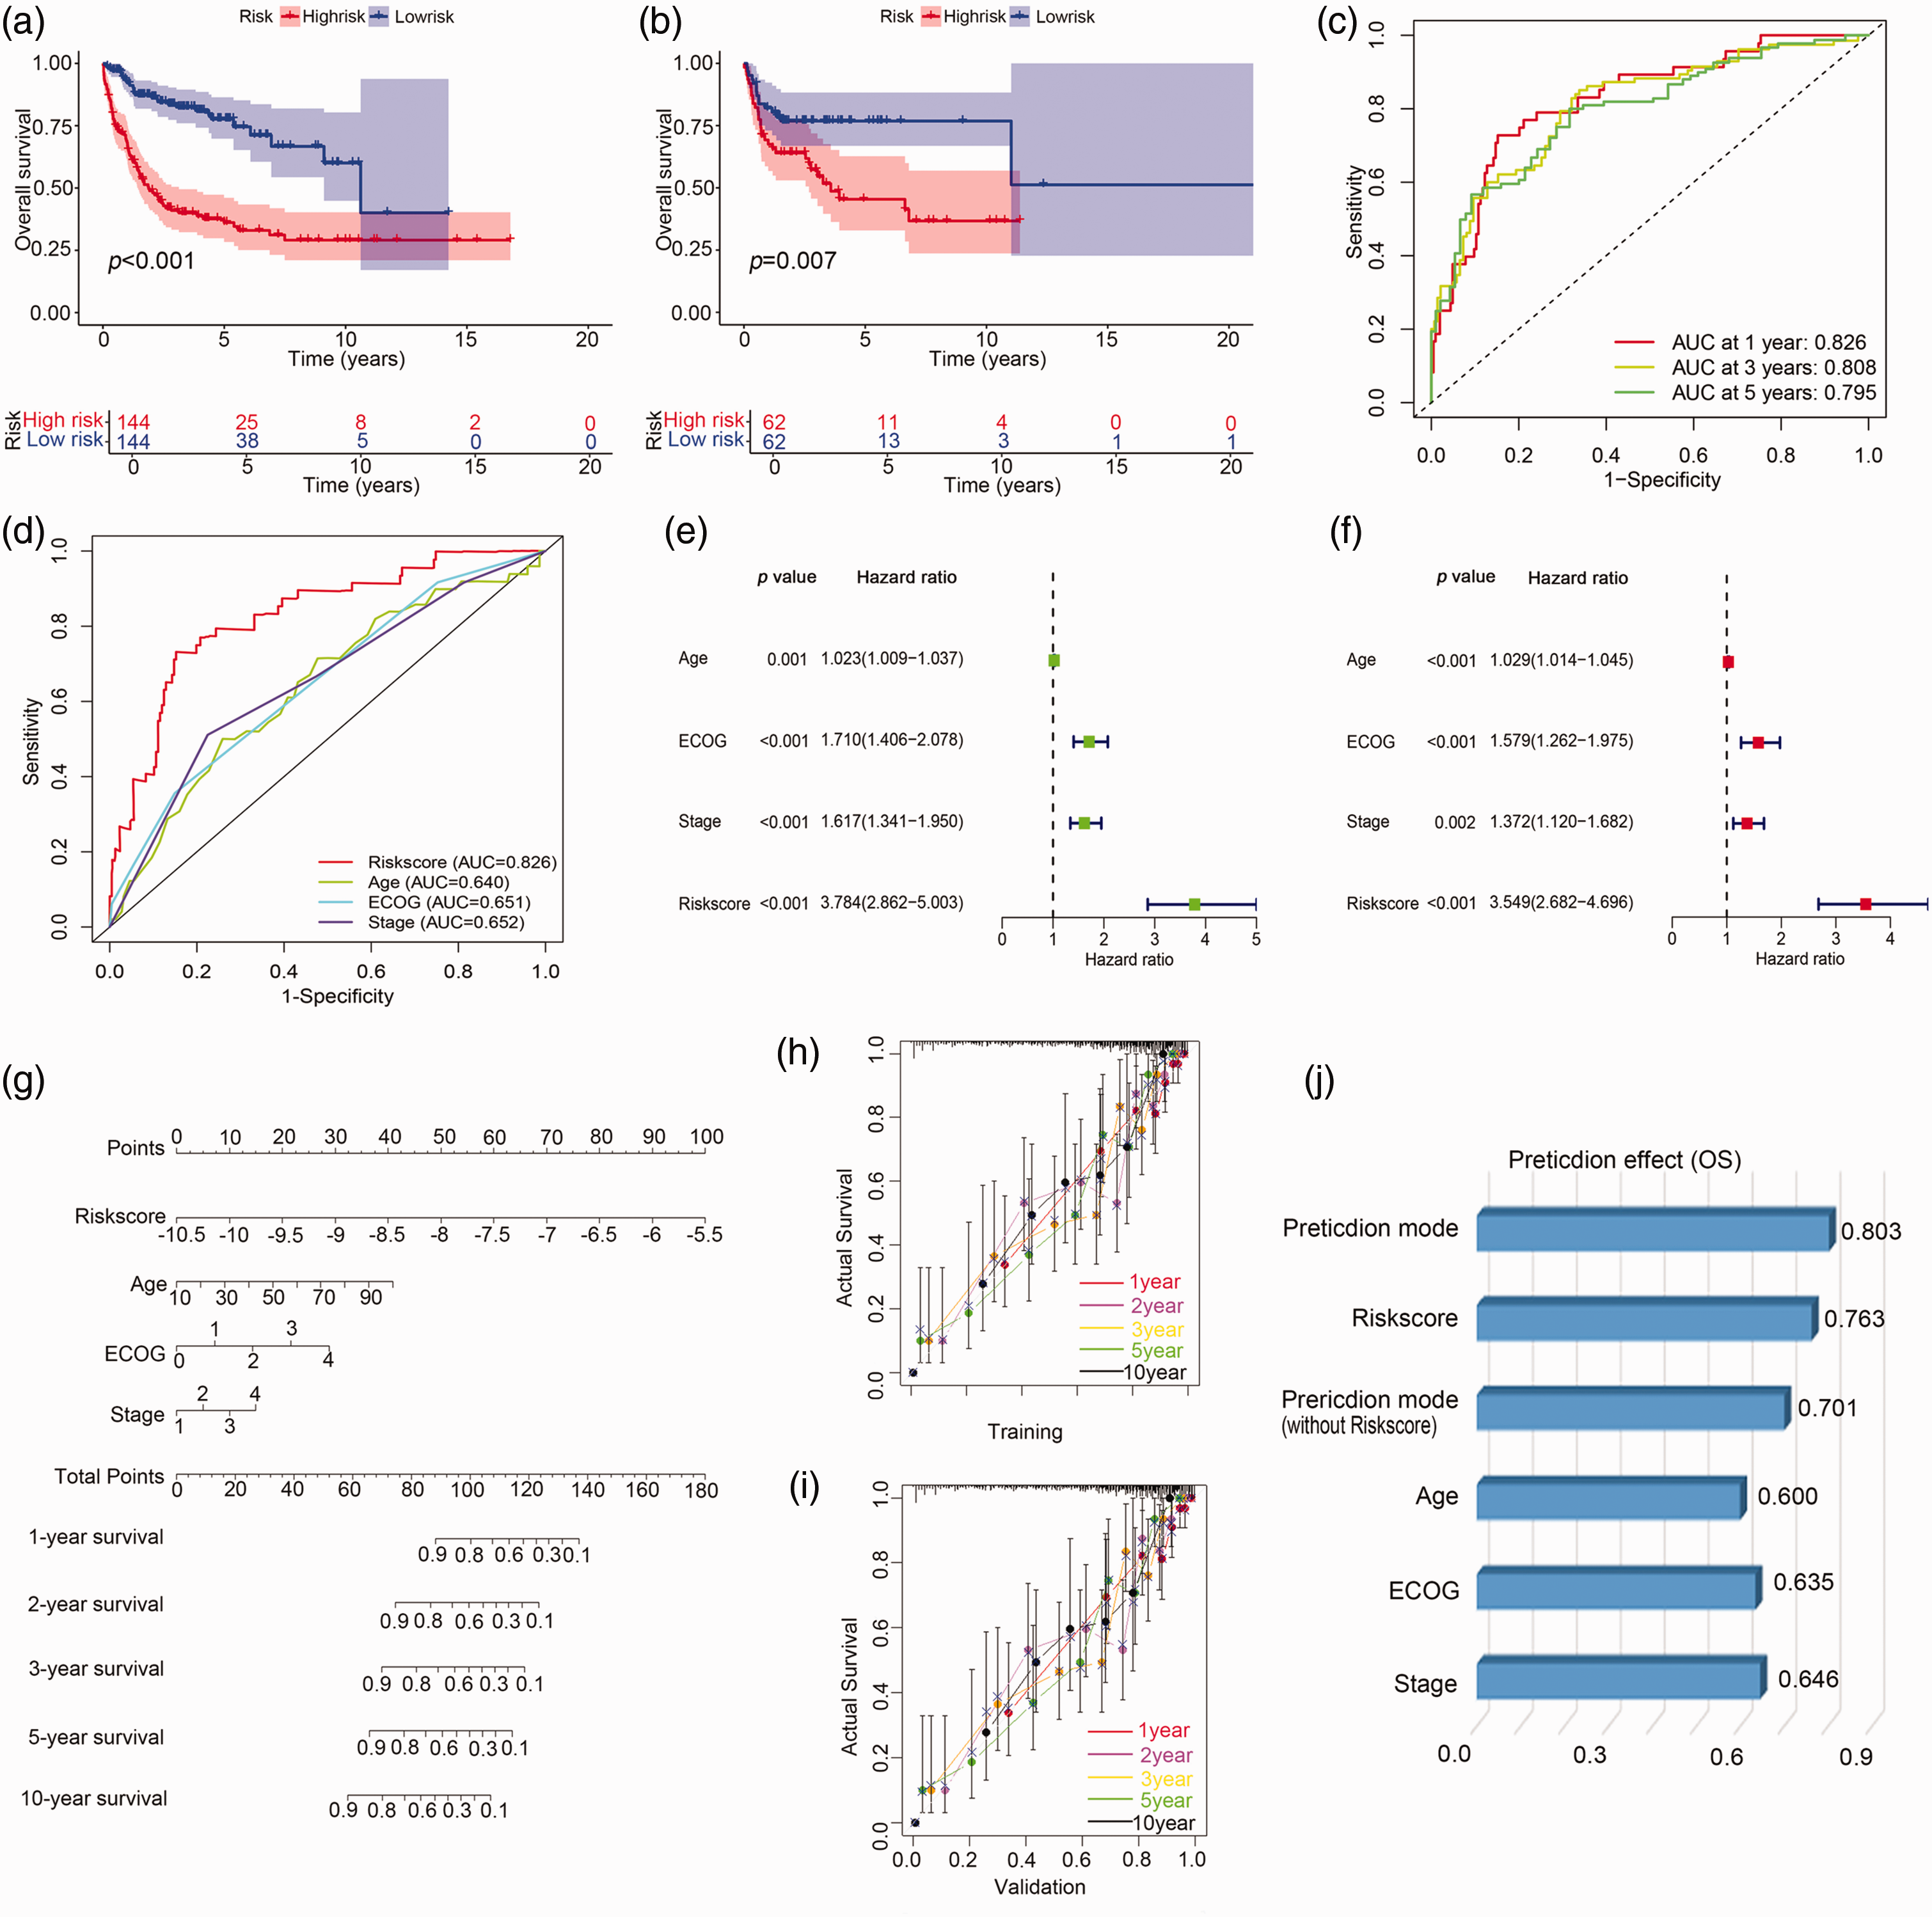
Prognosis value of the 13 prognostic CAF-related gene model and nomogram. (a)–(b) Kaplan–Meier plots of the risk score and OS were generated for the training database (a) and validation database (b). (c)–(d) The ROC curve shows the potential of the 13 prognostic CAF-related gene signature in predicting 1-, 3-, and 5-year OS in the training database. (e) Survival prediction ROC curves of the risk model and other clinical indices from the training cohort. (e) Univariate independent prognostic analysis in the training database. (f) Multivariate independent prognostic analysis in the training database. (g) A nomogram predicting the 1-, 2-, 3-, 5-, and 10-year OS rate of patients with DLBCL. (h)–(i) The calibration plots showed the comparison between predicted and actual PFS for 1-, 2- 3-, 5-, and 10-year survival probabilities in the training (h) and validation databases (i). (j) The predictive effect of the individualized prediction model, risk score, prediction model without the risk score, and clinical prognostic factors of patients with DLBCL on OS was evaluated by C-index. CAF: cancer-associated fibroblast; OS: overall survival; ROC: receiver operating characteristic; DLBCL: diffuse large B cell lymphoma; PFS: progression-free survival.
Independent prognostic value of the CAF-related gene signature
To assess the independent prognostic value and clinical correlations of the gene signature, univariate and multivariate prognostic analyses were conducted. In the training database, univariate analysis revealed that age, Eastern Cooperative Oncology Group (ECOG) score, stage, and risk score were significantly associated with OS, and the hazard ratio (HR) of the risk score was 3.784 (95% confidence interval (CI): 2.862–5.003, p < 0.001) (Figure 3(e)). Multivariate analysis confirmed that the HR of the risk score was 3.549 (95% CI: 2.682–4.696, p < 0.001) (Figure 3(f)). Furthermore, in the external validation GSE53786 dataset, the risk score was confirmed as a reliable independent prognostic factor for OS in DLBCL (HR = 3.960, 95% CI: 2.378–6.595, p < 0.001; HR = 4.012, 95% CI: 2.386–6.746, p < 0.001) (Supplementary Figure S1(g) and (h)). Collectively, these data showed that the PCRGs had a good correlation with clinical prognosis and might predict the clinical outcome independently.
The individualized prediction model showed robust predictive accuracy
To facilitate the clinical application of the prognostic prediction model, an individualized prediction model was constructed. The individualized prediction model for OS prediction was constructed based on various predictive factors, including risk score, age, ECOG score, and stage. As shown in Figure 3(g), the (1-, 2-, 3-, 5-, and 10-year) OS probability in patients with DLBCL could be estimated by the individualized prediction model. The nomogram and actual observations in the calibration curve showed a satisfactory overlap in training (Figure 3(h)) and validation databases (Figure 3(i)), indicating an optimal predictive accuracy. The C-index of this nomogram model was 0.803, which was higher than that of any other prediction model (Figure 3(j)).
Relationship between risk scores of the prognostic CAF-related gene signature and clinical characteristics
Patients with varying expression levels of risk score showed distinct patterns of clinical characteristics. Increases in risk score, gender, age, stage, ECOG score, chemotherapy, classification, and lactate dehydrogenase (LDH) ratio showed asymmetric distributions in the training (Figure 4(a)) and validation databases (Figure 4(b)) and GSE53786 dataset (Supplementary Figure S1(i)). All 13 genes were upregulated in the low-risk group in the database (Figure 4(a)–(b), Supplementary Figure S1(i)). The functions of each PCRG are provided in Supplementary Table 3. We compared the association between risk scores and clinical factors across the two risk groups. The risk score significantly increased following CHOP chemotherapy in the training and validation databases (p < 0.0001) (Supplementary Figure S2(a) and (b)). The risk score demonstrated a positive correlation with stage, indicating that as the stage advances, the risk score increases correspondingly in the training database (Supplementary Figure S2(b)). However, no significant associations were observed between risk scores and age, gender, ECOG, classification, or LDH ratio in either the training or validation database.

The relationship between the risk score and clinical characteristics in patients with DLBCL. (a)–(b) The heatmap showed the clinical factors and 13 representative genes for each patient with DLBCL in an ascending order of the risk score in training (a) and validation databases (b). DLBCL: diffuse large B cell lymphoma.
Immune-related analysis of patients with DLBCL using the prognostic CAF-related risk score
To quantify the immune infiltration of DLBCL samples, we used ssGSEA, a computational method that estimates the relative abundance of immune cell types from gene expression data. Heatmaps exhibited the distribution of tumor-infiltrating immune cells between the high-risk and low-risk groups based on the PCRG signature (Figure 5(a), Supplementary Figure S3(a)). The correlation analysis between risk score and ssGSEA scores for various immune cell subsets revealed several significant associations (Figure 5(b), Supplementary Figure S3(b)). Effector memory CD8 T cells showed the strongest positive correlation with risk score (p < 0.001), followed by effector memory CD4 T cells, activated dendritic cells, and immature dendritic cell, all of which had significant positive correlations (p < 0.001). These results suggested that higher risk scores are associated with increased levels of these immune cells in the TME. Conversely, CD56dim natural killer cells, mast cells, natural killer cells, and gamma delta T cells showed significant negative associations with risk score (p < 0.001). This indicated a potential decrease in these immune cell populations in patients with higher risk scores. Then, we conducted a comparative analysis of immune cell infiltration between high and low-risk groups. In the high-risk group in the training database (Figure 5(c)), we observed higher enrichment scores for effector memory CD8 T cells, effector memory CD4 T, and CD56bright natural killer cells. Conversely, in the low-risk group, higher enrichment scores were identified for activated B cells, activated CD4 T cells, CD56dim natural killer cells, gamma delta T cells, mast cells, myeloid-derived suppressor cells, natural killer cells, and type 2T-helper cells. These findings suggested distinct immune cell infiltration patterns between the two risk groups, potentially reflecting differences in their immune microenvironments. In the validation cohort, a similar pattern was observed (Supplementary Figure S3(c)).

Analysis of the immune cell infiltration landscape and drug sensitivity in patients with DLBCL. (a) Heatmap of immune cells in the training database. (b) The correlation between risk score and ssGSEA scores of immune cells in the training database. (c) The boxplots for the comparison of the immune cells between the high-risk and low-risk groups in patients with DLBCL in the training database. (d) Stroma, immune, and ESTIMATE scores in the high-risk and low-risk groups in patients with DLBCL in the training database. (e) The correlation between risk score and inhibitory immune checkpoints in the training database. (f) Boxplots showed the mean differences in estimated drug sensitivity values of 10 representative drugs (vincristine_1818, epirubicin_1511, cyclophosphamide_1512, OTX015_1626, cisplatin_1005, oxaliplatin_1806, oxaliplatin_1089, ibrutinib_1799, cytarabine_1006, gemcitabine_1190) in the training database. ****p < 0.0001; ***p < 0.001; **p < 0.01; *p < 0.05; ns, no significant. DLBCL: diffuse large B cell lymphoma; ESTIMATE: Estimation of Stromal and Immune Cells in Malignant Tumor Tissues using Expression Data.
Furthermore, ESTIMATE analysis showed that the stromal score, immune score, and ESTIMATE score were significantly higher in the low-risk group than in the high-risk group (p < 0.05) (Figure 5(d), Supplementary Figure S3(d)).
We also compared the expression levels of immune checkpoint genes between the high-risk and low-risk groups. As shown in Figure 5(e) and Supplementary Figure S3(e), the inhibitory immune checkpoints, including HAVCR2 (TIM3), LGALS9 (Galectin9), CD274 (PDL1), CD47, and BTLA, were positively correlated with the risk score. However, most immune checkpoints were negatively correlated with the 13 CAF-related genes.
Drug sensitivity in different risk groups
We used the drug sensitivity data from the GDSC2 database to validate our analytical model and identified several drugs associated with the risk score. We selected 10 representative drugs from the GDSC2 database that showed significant correlation between risk scores and drug sensitivity, and drug sensitivity was positively correlated with IC50. The drug sensitivity of vincristine_1818 and epirubicin_1511 was lower in the high-risk group than in the low-risk group (p < 0.05). There was no significant difference in the drug sensitivity of cyclophosphamide_1512 between the two risk groups. These seven drugs were OTX015_1626, cisplatin_1005, oxaliplatin_1806, oxaliplatin_1089, ibrutinib_1799, cytarabine_1006, and gemcitabine_1190, which could be potential drugs for DLBCL treatment. Patients in the low-risk group had higher IC50 values than those in the high-risk group, indicating that they were less sensitive to these seven antitumor therapeutic drugs (Figure 5(f), Supplementary Figure S3(f)). Obviously, the risk score might help us choose appropriate and effective treatment strategies.
Discussion
DLBCL is one of the most common aggressive B cell malignancies with heterogeneity in its morphological and genetic characteristics. The International Prognostic Index (IPI), which has been used since 1993 to predict prognosis in aggressive non-Hodgkin lymphoma, relies solely on clinical characteristics and does not capture the biological heterogeneity in patients with DLBCL. 17 Specifically, age and stage are key components of the IPI, with advanced age and later stages typically correlating with higher IPI scores and worse prognosis. The prognosis of DLBCL is affected by multiple factors, including clinical characteristics, molecular subtype, and the TME. Given the limitations of the current prognostic assessment system, there is an urgent need to develop a new model incorporating genetic information to improve prognosis prediction for patients with DLBCL. 18 Evaluation of the TME has been one of the areas of recent interest for understanding the pathophysiology and outcomes of this disease. By integrating WGCNA with supervised machine learning algorithms, we identified a novel CAF-related panel consisting of 13 genes, which can distinguish high-risk and low-risk groups of patients with DLBCL. The multigene may become a potential biomarker panel to guide therapy in the future. Our model demonstrated superior predictive performance compared with traditional clinical parameters in IPI, such as age, stage, and ECOG score, as evidenced by the higher AUC of the risk score (0.826) in the 1-year ROC curve analysis. Notably, the risk score may be an independent prognostic factor for OS in DLBCL, and a novel risk score–based nomogram was developed, offering superior predictive accuracy than models based solely on clinical factors or risk scores.
CAFs play a crucial role in the TME, forming the supportive framework of the tumor, known as the stroma. However, research in this field has faced several challenges, primarily because CAFs can exert both protumorigenic and antitumorigenic effects. In particular, CAFs are not permanent and can shift back and forth between subtypes using the TGF-β signaling pathway. 19 More specifically, two distinct gene expression profiles of stromal cells have been identified in patients with DLBCL. 20 These groups are linked to different prognostic and predictive outcomes, with the stromal-1 signature being associated with a better prognosis, whereas higher expression of the stromal-2 signature was correlated with poorer outcomes and increased tumor vascular density. 21 In our study, the risk score was inversely correlated with DLBCL prognosis, with higher scores indicating poorer outcomes. Notably, 13 CAF-related genes within the model were expressed at lower levels in the high-risk group, suggesting that these genes play a protective role. The functions of these genes were consistent with those of the previously reported stromal-1 signature, which was associated with a favorable prognosis in DLBCL. 22 Theoretically, CAFs contribute to the trapping of B cells in a specific anatomical location, thereby preventing their spread.9,22 We discovered that these genes were linked to immune checkpoints (TIM3, Galectin9, PDL1, and BTLA), with most of them showing a negative correlation with inhibitory immune checkpoints. This suggested that these genes contribute to antitumor effects by enhancing the antitumor activity of immune cells. Nonetheless, the underlying mechanisms warrant further investigation.
Based on the results of our LASSO regression, FNDC1(fibronectin type III domain containing 1) appeared to play a significant role in the prognosis of DLBCL, as it had the largest risk coefficient. FNDC1 has been implicated in the progression of various cancers and serves as a key regulator of tumor metastasis. 23 Recent studies have demonstrated that higher FNDC1 expression correlates with improved survival outcomes in DLBCL, reinforcing its potential as a prognostic biomarker. 18 Moreover, FNDC1 has been identified as a significantly downregulated gene in primary central nervous system lymphoma, where its loss was associated with genomic deletions. 24 These findings suggest that FNDC1 may function as a potential tumor suppressor in DLBCL, and further investigations are warranted to elucidate its precise role in DLBCL pathogenesis.
Since CAFs are the architects of matrix remodeling in the TME, we applied the risk assessment model to compare the immune cell composition in tumors with high- or low-risk scores and observed significant differences, indicating that CAF-related processes may further influence the immune landscape in patients with DLBCL. The low-risk group exhibited an enrichment of immune cells, such as NK cells, which are typically associated with a more effective antitumor immune response and a better ability to suppress tumor growth. The role of NK cells in tumor immunosurveillance is well-established, and they can prevent the progression of B cell lymphoma.25,26 Consequently, patients in the low-risk group demonstrated better prognoses. These suggest that the distinct patterns of immune infiltration between the two risk groups not only reflect differences in the TME but may also play a critical role in influencing patient survival outcomes. The high immune, stromal, and ESTIMATE scores for the low-risk group further indicated a heightened immune activity in these cases. The link between the robust immune infiltration and the notably improved survival prognosis in low-risk groups indicated the role of immune response in cancer progression and OS outcomes, which is consistent with a study by Gonzalez et al. 27 This proposition underscores the implications it might have for disease management, particularly in designing more personalized and effective immunotherapy strategies.
Although most patients with DLBCL respond to standard chemotherapy, up to 40% do not achieve significant benefits from standard chemotherapy. 28 A recent meta-analysis confirmed the safety and efficacy of immune checkpoint inhibitors in patients with non-Hodgkin lymphoma, suggesting that clinicians may use immune checkpoint inhibitor therapy as an adjunct. 29 The expression level of the immune checkpoint is the predictive biomarker of immunotherapy response. 30 We further explored the differences in the expression of inhibitory molecules between the PCRG groups, finding that the risk score was positively correlated with TIM3, Galectin9, PDL1, and BTLA. Therefore, high-risk score patients might benefit from immune checkpoint blockades, which might improve the prognosis of high-risk patients by enhancing their immunoreactivity. In addition, our exploration into potential therapeutic interventions has been further expanded by assessing drug sensitivity. We found that, in addition to traditional R-CHOP or CHOP regimens, patients in the high-risk group are more likely to benefit from cisplatin_1005, oxaliplatin_1089, oxaliplatin_1806, cytarabine_1006, gemcitabine_1190, BET inhibitors (OTX015_1626), and BTK inhibitor (ibrutinib_1799). Although oncoPredict provides useful data for understanding potential responses to single agents or components of treatment, it does not capture the synergistic effects and drug interactions that occur within combination regimens such as R-CHOP. The results derived from oncoPredict should be interpreted with caution when applied to complex multidrug regimens, and further validation of combination therapies would require more comprehensive models that incorporate the dynamics of multidrug interactions.
Some limitations of this risk model should be addressed. This model was based on retrospective data from the GEO database, which may introduce biases from patient population characteristics. However, it is necessary to further validate the findings in multicenter clinical trials and prospective studies in different regions. Furthermore, the roles of CAFs vary across different tumors due to the complex and diverse immune microenvironment. The molecular mechanisms of the 13 PCRGs in DLBCL require further clarification. Another limitation of our model is the lack of interpretability, which may hinder clinical adoption. Although our model offers promising insights into the prognostic value of CAF-related genes in DLBCL, we recognize that the integration of genetic analyses with clinical risk scores requires further refinement before it can be easily translated into routine clinical settings.
In conclusion, we identified prognostic genes related to CAFs and developed a 13-gene model that generates an independent prognostic score. We further confirmed the model’s robustness through various validation methods, achieving favorable results. Our study may not only analyze the predictive performance of the risk model but also screen for prospective treatment drugs.
Supplemental Material
sj-pdf-1-imr-10.1177_03000605251331250 - Supplemental material for A novel cancer-associated fibroblast–related gene signature for predicting diffuse large B cell lymphoma prognosis using weighted gene co-expression network analysis and machine learning
Supplemental material, sj-pdf-1-imr-10.1177_03000605251331250 for A novel cancer-associated fibroblast–related gene signature for predicting diffuse large B cell lymphoma prognosis using weighted gene co-expression network analysis and machine learning by Hongxia Cui, Menglu Chen, Meifang Zhao and Bingzong Li in Journal of International Medical Research
Supplemental Material
sj-pdf-2-imr-10.1177_03000605251331250 - Supplemental material for A novel cancer-associated fibroblast–related gene signature for predicting diffuse large B cell lymphoma prognosis using weighted gene co-expression network analysis and machine learning
Supplemental material, sj-pdf-2-imr-10.1177_03000605251331250 for A novel cancer-associated fibroblast–related gene signature for predicting diffuse large B cell lymphoma prognosis using weighted gene co-expression network analysis and machine learning by Hongxia Cui, Menglu Chen, Meifang Zhao and Bingzong Li in Journal of International Medical Research
Supplemental Material
sj-pdf-3-imr-10.1177_03000605251331250 - Supplemental material for A novel cancer-associated fibroblast–related gene signature for predicting diffuse large B cell lymphoma prognosis using weighted gene co-expression network analysis and machine learning
Supplemental material, sj-pdf-3-imr-10.1177_03000605251331250 for A novel cancer-associated fibroblast–related gene signature for predicting diffuse large B cell lymphoma prognosis using weighted gene co-expression network analysis and machine learning by Hongxia Cui, Menglu Chen, Meifang Zhao and Bingzong Li in Journal of International Medical Research
Supplemental Material
sj-pdf-4-imr-10.1177_03000605251331250 - Supplemental material for A novel cancer-associated fibroblast–related gene signature for predicting diffuse large B cell lymphoma prognosis using weighted gene co-expression network analysis and machine learning
Supplemental material, sj-pdf-4-imr-10.1177_03000605251331250 for A novel cancer-associated fibroblast–related gene signature for predicting diffuse large B cell lymphoma prognosis using weighted gene co-expression network analysis and machine learning by Hongxia Cui, Menglu Chen, Meifang Zhao and Bingzong Li in Journal of International Medical Research
Supplemental Material
sj-pdf-5-imr-10.1177_03000605251331250 - Supplemental material for A novel cancer-associated fibroblast–related gene signature for predicting diffuse large B cell lymphoma prognosis using weighted gene co-expression network analysis and machine learning
Supplemental material, sj-pdf-5-imr-10.1177_03000605251331250 for A novel cancer-associated fibroblast–related gene signature for predicting diffuse large B cell lymphoma prognosis using weighted gene co-expression network analysis and machine learning by Hongxia Cui, Menglu Chen, Meifang Zhao and Bingzong Li in Journal of International Medical Research
Supplemental Material
sj-pdf-6-imr-10.1177_03000605251331250 - Supplemental material for A novel cancer-associated fibroblast–related gene signature for predicting diffuse large B cell lymphoma prognosis using weighted gene co-expression network analysis and machine learning
Supplemental material, sj-pdf-6-imr-10.1177_03000605251331250 for A novel cancer-associated fibroblast–related gene signature for predicting diffuse large B cell lymphoma prognosis using weighted gene co-expression network analysis and machine learning by Hongxia Cui, Menglu Chen, Meifang Zhao and Bingzong Li in Journal of International Medical Research
Supplemental Material
sj-pdf-7-imr-10.1177_03000605251331250 - Supplemental material for A novel cancer-associated fibroblast–related gene signature for predicting diffuse large B cell lymphoma prognosis using weighted gene co-expression network analysis and machine learning
Supplemental material, sj-pdf-7-imr-10.1177_03000605251331250 for A novel cancer-associated fibroblast–related gene signature for predicting diffuse large B cell lymphoma prognosis using weighted gene co-expression network analysis and machine learning by Hongxia Cui, Menglu Chen, Meifang Zhao and Bingzong Li in Journal of International Medical Research
Footnotes
Acknowledgements
We want to thank the data contributors and curators of the GEO databases.
Author contributions
Bingzong Li provided crucial guidance in performing data analysis, refining the manuscript, and addressing reviewers’comments. Hongxia Cui contributed to the study design and provided overall supervision. Menglu Chen constructed the figures and revised the manuscript. Meifang Zhao performed the research and wrote the paper.
Competing interests
The authors declare no competing interests.
Data availability statement
Ethics approval
Ethics approval was not required for this study because the research analysis was based on bioinformatics and did not involve patient data.
Funding
This study was supported by National Natural Science Foundation of China (82270197); Suzhou City Basic Research Program–Key Clinical Technology Research (SKY2023010); The Project of State Key Laboratory of Radiation Medicine and Protection, Soochow University (GZK12023020); The special project of “Technological innovation” project of CNNC Medical Industry Co. Ltd. (ZHYLYB2021002); Suzhou Science and Technology Agency Project (SKYD2023215); Discipline Development Support Program–Medical Innovation Team, The Second Affiliated Hospital of Soochow University (XKTJ-TD202404-3).
Supplementary material
Supplemental material for this article is available online.
References
Supplementary Material
Please find the following supplemental material available below.
For Open Access articles published under a Creative Commons License, all supplemental material carries the same license as the article it is associated with.
For non-Open Access articles published, all supplemental material carries a non-exclusive license, and permission requests for re-use of supplemental material or any part of supplemental material shall be sent directly to the copyright owner as specified in the copyright notice associated with the article.