
Abstract
Objective
This retrospective study aimed to investigate the correlation between the cardiopulmonary exercise test (CPET) and the severity of coronary stenosis (SYNTAX score) in patients with stable coronary artery disease (SCAD), thereby assessing CPET’s diagnostic value.
Methods
We classified 220 patients who underwent coronary angiography into coronary heart disease (CHD) and non-CHD groups based on stenosis severity. Patients with SCAD were categorized into mild, moderate, and severe groups by the SYNTAX score. CPET was performed, and data on the general information, serological indicators, and echocardiographic parameters were collected. CPET parameters included oxygen uptake related to the work rate (△VO2/△WR), peak metabolic equivalent (Peak Mets), anaerobic threshold (AT), peak oxygen consumption per kilogram (PVO2/kg), and metabolic equivalent at anaerobic threshold (Met@AT).
Results
Patients without SCAD demonstrated significantly higher CPET parameters than those with SCAD. The CPET parameters varied significantly across severity groups in the SCAD group, with the mild group exhibiting higher values than the moderate and severe groups. No significant differences were observed in the baseline data between the groups or among patients with varying numbers of lesion branches.
Conclusion
CPET parameters demonstrated a significant negative correlation with the SYNTAX score in patients with SCAD, indicating its potential clinical value in assessing the severity of coronary stenosis and diagnosing SCAD.
Introduction
The “China Cardiovascular Health and Disease Report 2019” 1 has revealed a growing trend in cardiovascular disease (CVD) mortality in China, with 312 deaths per 100,000 in rural areas and 268 deaths per 100,000 in urban areas. CVD accounts for 45.91% of total deaths in rural areas and 43.56% in urban areas. 1 With 330 million individuals diagnosed with CVD worldwide, CVD prevention and treatment are critical to improving global health outcomes. 1 Coronary artery disease (CAD), a prevalent form of CVD, impacts 11.396 million individuals,1–3 and is the leading global cause of death according to the 2018 Global Burden of Disease Study. 4 CAD, also known as ischemic heart disease (IHD), results from coronary artery blockages that cause heart damage. 5 Despite advancements in the understanding of the pathophysiology, diagnosis, and treatment of stable coronary artery disease (SCAD), risk factors such as smoking and hypertension have been increasing.6,7 As the mortality rate from SCAD increases, so does public awareness. Although coronary angiography (CAG) is considered the diagnostic gold standard, 8 its invasive nature has prompted research on non-invasive alternatives, such as coronary computed tomography angiography, cardiac magnetic resonance, and stress echocardiography, each with its own limitations and influencing factors. 8 Thus, the quest for a straightforward, non-invasive diagnostic method for SCAD remains a key point of medical discussion.
Cardiopulmonary exercise testing (CPET) is a non-invasive method that assesses cardiopulmonary responses to exertion by measuring gas exchange during physical activity. 9 It provides a comprehensive evaluation of cardiopulmonary function, both at rest and during dynamic exercise, identifying respiratory issues and offering insights into a patient’s exercise capacity. 10 CPET is the gold standard for evaluating cardiac, pulmonary, and metabolic responses to exercise, crucial for quantifying cardiac function and assessing exercise tolerance in patients with coronary heart disease (CHD). 11 The American Heart Association recommends using CPET parameters, along with clinical signs and left ventricular ejection fraction, for individualized exercise prescriptions for cardiac rehabilitation. 11 CPET is diagnostically valuable and can quantitatively assess the cardiopulmonary reserve in patients with CAD. 12 CPET aids in evaluating suspected CAD patients with angina and dyspnea. Miao Mengdan et al. 13 found that CPET had 86.4% sensitivity and 98.5% specificity in 131 suspected CAD patients, confirming it as an effective and safe diagnostic method. 14 CPET is an affordable, objective, safe, simple, and quantitatively effective method. It is widely used in Europe and America as the gold standard for cardiopulmonary function evaluation, assisting in CAD diagnosis and the development of exercise prescriptions for patient recovery. 14
Vascular reconstruction is crucial for treating CAD, with the selection of treatment modalities such as percutaneous coronary intervention (PCI) and coronary artery bypass grafting (CABG) based on lesion complexity. This complexity is assessed using the SYNTAX score, 15 which quantifies coronary lesions. 5 Physicians utilize SYNTAX scoring derived from CAG to evaluate the severity of the stenosis for selecting the optimal vascular reconstruction method. 16 Non-invasive diagnostic methods are of particular interest in China, where patients with SCAD are predominant. This study aimed to investigate the correlation between CPET parameters and the SYNTAX score in patients with SCAD, thereby assessing the diagnostic value of CPET. CPET is gaining increasing interest among clinicians due to its ability to identify heart dysfunction in patients with SCAD. 17 Miao Mengdan et al. 13 found that CPET’s sensitivity for CAD diagnosis was 86.4%, and its specificity was 98.5%, thereby validating its effectiveness in diagnosing CAD. 14 CPET is a cost-effective, objective, safe, and quantitative non-invasive method widely used for cardiopulmonary function evaluation. It holds diagnostic value for CAD and can guide exercise prescriptions for recovery. 14
Study participants and methods
Study participants
Sample size determination
This study is a retrospective case-control study. After reviewing domestic and international literature, the exposure ratio in the control group was determined to be 0.28, with an odds ratio of 2.7. Using a grouped design and with the assistance of Power Analysis and Sample Size 15.0 (PASS 15.0), the sample size was calculated based on the relevant literature. The required sample sizes were determined to be N1 = 91 for the experimental group and N2 = 91 for the control group.
Diagnostic standards
Patient diagnoses were performed by a pair of experienced interventional physicians within our department. Following CAG through the right radial artery was conducted using a digital subtraction angiography device (General Electric, USA). The Judkins technique 18 was employed for multi-view imaging, and selective CAG was performed. Diagnoses were made in accordance with the “Guidelines for the Diagnosis and Treatment of Stable Coronary Artery Disease” published in 2018. 19 The criteria for diagnosing SCAD included the presence of ≥50% stenosis in the primary large vessels and their branches, as confirmed by CAG. Conversely, non-SCAD was defined by <50% stenosis in the primary large vessels and their branches, as indicated by CAG. This study was conducted in accordance with the Helsinki Declaration of 1975, as revised in 2013, and conforms to the STROBE guidelines. 20
Inclusion criteria
1. All patients who underwent percutaneous CAG. 2. Patients capable of independently completing a CPET. 3. Patients aged 30–70 years.
Exclusion criteria
Patients were excluded if they met any of the following criteria:
Diagnosis of acute coronary syndrome, congestive heart failure, unstable angina, myocarditis, pericarditis, acute myocardial infarction, rheumatic heart disease, cardiomyopathy, or valvular heart disease. Presence of cancer, bone and joint disorders, or liver or kidney dysfunction. Untreated hypertension or diabetes warranting insulin management. Rapid arrhythmias (e.g., atrial fibrillation, atrial flutter, or paroxysmal ventricular tachycardia). Chronic obstructive pulmonary disease, thoracic deformities, respiratory failure, lung cancer, pulmonary hypertension, asthma, pulmonary fibrosis, or other lung conditions. Chronic connective tissue diseases, hyperthyroidism, hematological disorders, severe anemia, or hypothyroidism. Left ventricular ejection fraction below 40%. Age younger than 30 years or older than 70 years. Other conditions deemed unsuitable for exercise testing.
Study population and group assignment
A cohort of 220 patients who underwent CAG met the inclusion and diagnostic criteria; comprehensive clinical data were obtained from the Cardiovascular Department. Participants were divided into two groups based on the angiography results: the SCAD and non-SCAD groups. The SCAD group included 110 patients with ≥50% stenosis in the main vessels and their branches, while the non-SCAD group included 110 patients with <50% stenosis or no stenosis in the main vessels and their branches. All patients exhibited stable clinical symptoms and underwent CPET.
Study Population and Group Assignment
Each patient with SCAD included in the study was assigned a SYNTAX score derived from their CAG results using the SYNTAX Score Online Calculation System: www.syntaxscore.com (Figure 1). Based on the SYNTAX score,15,16 the SCAD group was further stratified into three subgroups: the mild subgroup with 69 cases (0–22 points), the moderate subgroup with 21 cases (23–32 points), and the severe subgroup with 20 cases (≥33 points). Additionally, patients with SCAD were categorized into three groups according to the number of affected vessels: the single-vessel group with 60 cases (one affected vessel), the double-vessel group with 23 cases (two affected vessels), and the multi-vessel group with 27 cases (three or more affected vessels).

(a) Correlation between the Peak VO2 and SYNTAX score, (b) Correlation between anaerobic threshold (AT) and SYNTAX score, (c) Correlation between Peak Mets and SYNTAX score, (d) Mets@AT Correlation with SYNTAX score, (e) Correlation between O2 plus and SYNTAX score and (f) Correlation between the oxygen uptake related to the work rate (△ VO2/△ WR) and SYNTAX score.
Methods
Data collection
General Information
In-patient medical records were reviewed for data collection, including calculation of the body mass index (BMI) 21 using the formula BMI =weight (kg)/height (m)2. Additional information recorded included age, gender, smoking history (considered positive if the patient smoked more than one cigarette per day for over one year), 22 alcohol consumption history (considered positive if intake exceeded 15 g/day for women or 25 g/day for men, and occurred more than twice a week), 22 systolic blood pressure (SBP), diastolic blood pressure (DBP), and resting heart rate (RHR).
Medical History
This included a history of diabetes (defined as fasting blood glucose ≥7.0 mmol/L, random capillary blood glucose ≥11.1 mmol/L, or 2-hour postprandial blood glucose ≥11.1 mmol/L) and hypertension (diagnosed when resting blood pressure, measured three times on different days using a medical sphygmomanometer after 10 minutes of rest, was ≥140 mmHg for systolic or ≥90 mmHg for diastolic).
Medication History
Information was collected regarding the use of beta-blockers, ACE inhibitors/ARBs, and statins.
Serum Indices
Measured serum parameters included total cholesterol (TC), urea, creatinine (CREA), white blood cells, triglycerides (TGs), red blood cells (RBC), hemoglobin (Hgb), platelets, high-density lipoprotein (HDL), blood glucose, glycosylated Hgb (HbA1c), and low-density lipoprotein (LDL).
CPET-related Parameters
Key parameters from the CPET included PVO2/kg, anaerobic threshold (AT), peak metabolic equivalents (Peak Mets), oxygen uptake related to work rate (ΔVO2/ΔWR), metabolic equivalents at (Met@AT), and peak oxygen consumption (PVO2/kg)
Echocardiographic Indices
The left ventricular ejection fraction (LVEF) was also recorded as part of the echocardiographic assessment.
Implementation methods
CAG: Skilled interventional physicians performed this procedure after obtaining consent; they inserting an arterial sheath after and puncturing the radial artery. A GE angiography machine was used with the Judkins method for clear coronary lesion imaging.
CPET: CPET was performed on a bicycle ergometer. Generalized ramp protocols were followed for obtaining a time period of between 8 and 10 minutes. The ventilation expired gas analyses were performed using a Sensormedic metabolic cart. Before the test, the apparatus was calibrated using reference gases according to the specifications. Standard 12-lead electrocardiography (ECG) was performed at rest, at each minute during exercise, and for at least 5 minutes during the recovery period; BP was measured during the procedure. Heart rate was calculated at rest, peak exercise, and 1 minute of recovery period. An active cool-down period for at least 1 minute was used for all patients. The peak VO2 and peak respiratory exchange ratio were calculated as the highest 10-second averaged sample acquired during the last 20 seconds of the procedure. Participants provided consent and rested and fasted pre-test. Our hospital uses the COSMED system for CPET, which is conducted post-lunch with rescue equipment led by technicians. The test is halted upon the occurrence of severe arrhythmias or cardiac events. After a warm-up, a cycling incremental load protocol is used to reach maximum workload, adjusting load and cycling rate until symptoms limit further exercise. Participants must not speak and indicate discomfort by raising their hand. Termination of the test was considered when symptoms such as dyspnea and/or fatigue, ventricular tachycardia, >2 mm of horizontal or downsloping of ST-segment depression, and drop in systolic BP of >20 mm Hg occurred during the exercise test. ECG, HR, BP, VO2, VCO2, and other metrics were recorded, along with PVO2/kg, AT, and other parameters.
Transthoracic Echocardiography: All the participants were examined by 1–2 experienced physicians in our hospital’s cardiac color Doppler ultrasound room, using the IE-33 color Doppler computer ultrasound diagnostic instrument (USA PHILIPS company), with a probe frequency of 2.5 MHz; the left ventricular end-systolic dimension (LVESd), left ventricular end-diastolic dimension (LVEDd), and the LVEF was calculated using the computer.
Technical approach
We collected 220 cases adhering to the established criteria and analyzed the data using SPSS26.0 and GraphPad Prism8. The general data were compared using serum indices, CPET parameters, and LVEF between the groups for statistical significance. Patients with SCAD were categorized by the SYNTAX score into mild, moderate, and severe, and by diseased vessel count into single-, double-, and multiple-branch groups. We assessed the CPET parameter differences among groups, and correlated the CPET parameters with the SYNTAX score, and created receiver operating characteristic (ROC) curves to determine the diagnostic value for SCAD.
Statistical methods
Data are organized in a database, compiled in Excel, and analyzed with SPSS26.0 and GraphPad Prism8. Quantitative data undergo normality checks; normally distributed data are expressed as mean ± standard deviation (X ± S) and were compared using t-tests for two groups and analysis of variance (ANOVA) for multiple groups. Non-normally distributed data are expressed as interquartile range (M [Q25–Q75]) and were compared using Mann–Whitney U tests for two groups and Kruskal–Wallis H tests for multiple groups. Qualitative data are presented as counts and percentages, with chi-square (χ2) tests for analysis. Correlation analysis used Pearson’s test for normally distributed and equal variance data, and Spearman’s test otherwise. ROC curves were used to assess the diagnostic value of exercise test parameters in patients with SCAD. All tests were two-tailed, with α = 0.05; P < 0.05 was considered statistically significant.
Results
Comparison between the SCAD group and Non-SCAD group
Comparison of the baseline data between the two groups
For normally distributed variables with equal variances (LDL-C, TC, Hgb, RBC, SBP, DBP, RHR), X ± S values were reported, and independent samples t-tests were used for comparison. For non-normally distributed variables (age, BMI, HbA1c, TG, HDL-C, and LVEF), M (Q25–Q75) values were reported, and Mann–Whitney U tests were used for comparison. Qualitative data (gender; smoking history; alcohol consumption history; medication history with beta-blockers, angiotensin-converting enzyme inhibitor/angiotensin receptor blocker [ACEI/ARB], and statins; and medical history of hyperlipidemia, hypertension, and diabetes) are presented as percentages (n [%]) and were compared using chi-square (χ2) tests.
Results revealed no significant differences in hypertension, diabetes, hyperlipidemia, gender, age, alcohol consumption history, LVEF, HbA1c, TC, BMI, TG, RBC, LDL-C, Hgb, and HDL-C (P > 0.05), but significant differences in the medication history of ACEI/ARB, beta-blockers, and statins, and smoking history (P < 0.05). Overall, the baseline data of the two groups were comparable (Table 1).
Comparison of the baseline data (clinical data, serological indicators, etc.) between the two groups n (%) (X ± S) [M(Q25–Q75)].

SCAD: stable coronary artery disease; BMI: body mass index; ACEI/ARB: angiotensin-converting enzyme inhibitor/angiotensin receptor blocker; SBP: systolic blood pressure; DBP: diastolic blood pressure; RHR: resting heart rate; RBC: red blood cell; Hgb: hemoglobin; HbA1c: glycosylated hemoglobin; TC: total cholesterol; TG: triglyceride; CREA: creatinine; LDL-C: low-density lipoprotein cholesterol; HDL-C: high-density lipoprotein cholesterol; LVEF: left ventricular ejection fraction.
Analysis of the differences in the CPET parameters between the two groups
CPET parameters (PVO2/kg), AT, peak Mets, Met@AT, O2 plus, ΔVO2/ΔWR) were not normally distributed and were reported as M (Q25–Q75). Independent samples U tests were used for comparison. The non-SCAD group demonstrated significantly higher values for PVO2/kg, AT, peak Mets, Met@AT, O2 plus, and ΔVO2/ΔWR than the SCAD (P < 0.001) (Table 2).
Differential analysis of the CPET parameters between the two groups.
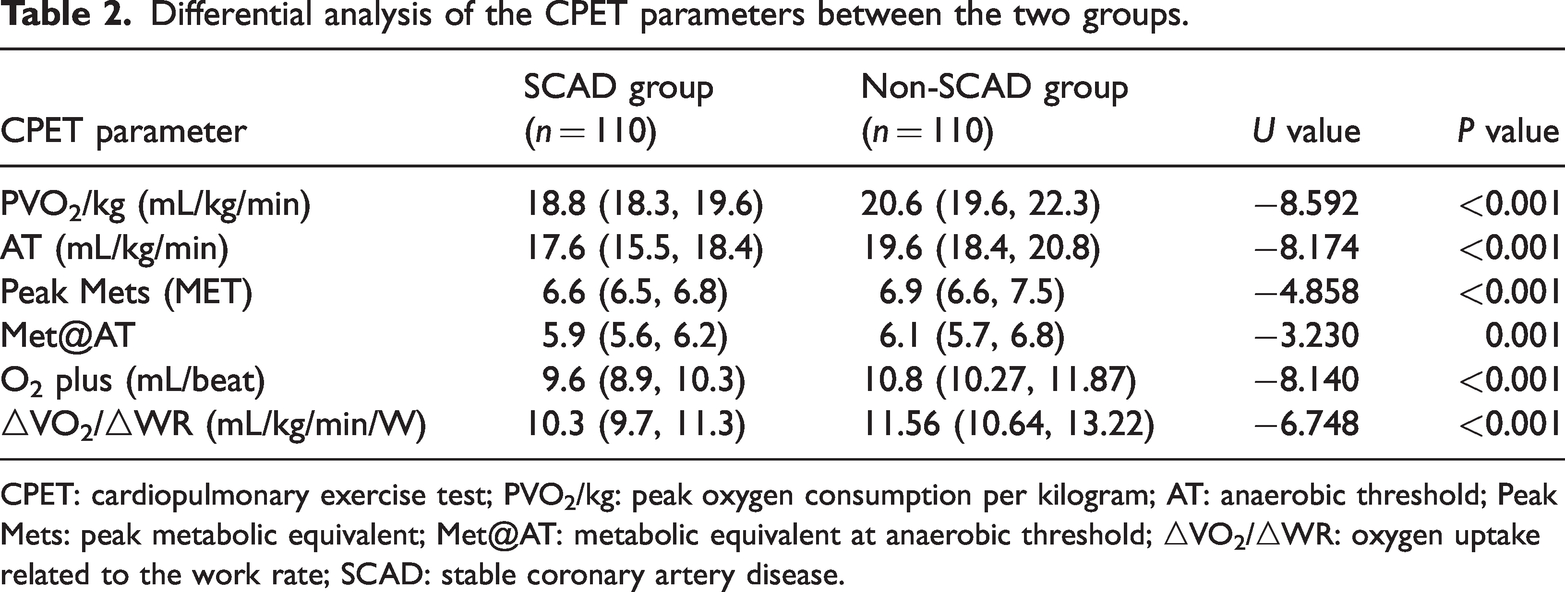
CPET: cardiopulmonary exercise test; PVO2/kg: peak oxygen consumption per kilogram; AT: anaerobic threshold; Peak Mets: peak metabolic equivalent; Met@AT: metabolic equivalent at anaerobic threshold; △VO2/△WR: oxygen uptake related to the work rate; SCAD: stable coronary artery disease.
Comparison of the SYNTAX score coronary lesion severity within the SCAD group
Comparison of general data among the three groups within the SCAD group
All quantitative data underwent normality (Shapiro–Wilk test) and variance homogeneity testing. Variables including RBC, age, TG, BMI, LDL-C, Hgb, TC, SBP, DBP, and RHR, which were normally distributed and had equal variances, are presented as X ± S and were compared using one-way ANOVA. Variables LVEF, CREA, HbA1c, and HDL-C, which were not normally distributed, are expressed as M (Q25–Q75) and were compared using the Kruskal–Wallis H test among the three severity groups. Qualitative data such as medication history (beta-blockers, statins), alcohol consumption history, gender, smoking history, and medical history (hypertension, diabetes, and hyperlipidemia) are presented as percentages [n (%)] and were compared using the chi-square (χ2) test.
Findings indicated no significant differences in the age; gender; BMI; smoking history, alcohol consumption history; history of hypertension, diabetes, and hyperlipidemia; medication history including beta-blockers, ACEI/ARB, and statins; RBC; Hgb; HbA1c; TC; TG; LDL-C; HDL-C; and LVEF among the mild, moderate, and severe stenosis groups (P ≥ 0.05). The baseline data across the three groups were essentially consistent and comparable (Table 3).
Comparison of the general information among the mild, moderate, and severe groups.
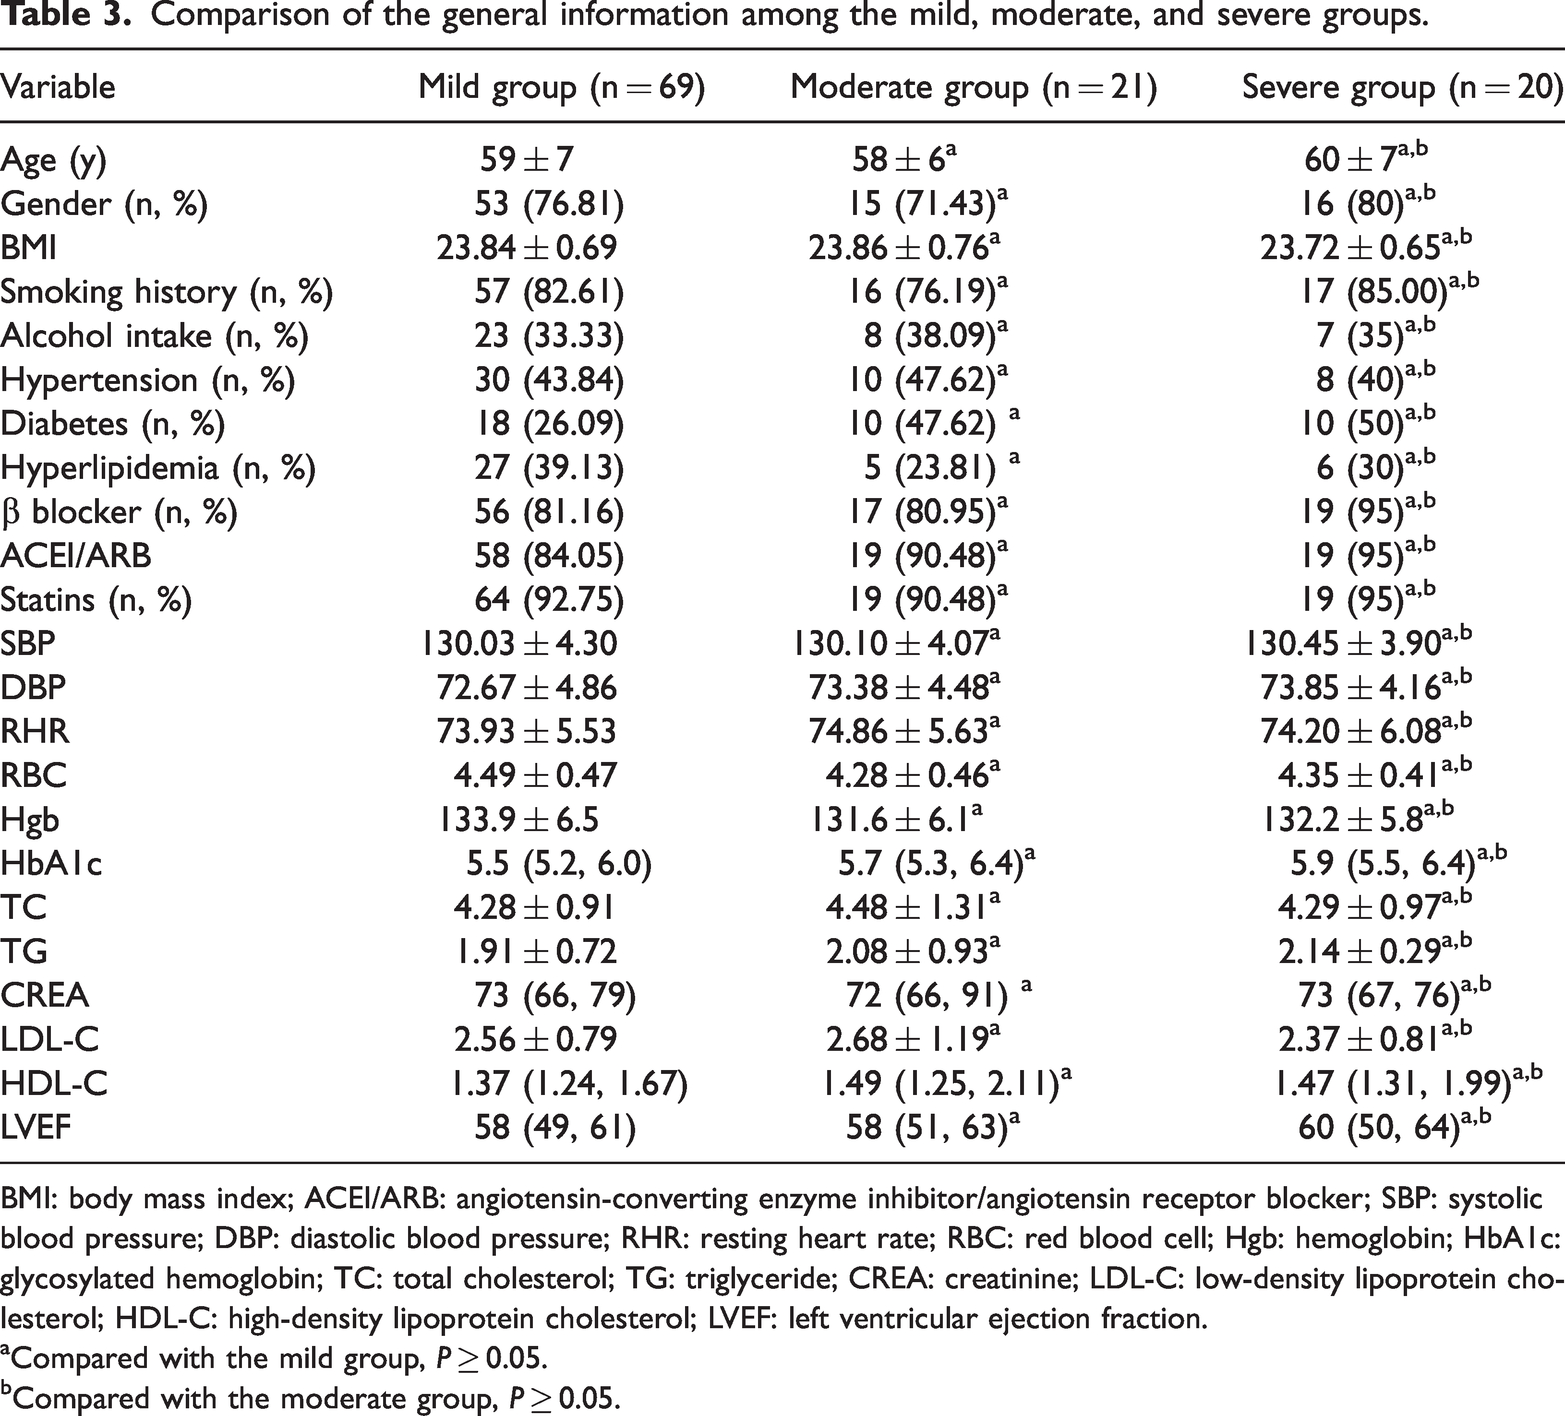
BMI: body mass index; ACEI/ARB: angiotensin-converting enzyme inhibitor/angiotensin receptor blocker; SBP: systolic blood pressure; DBP: diastolic blood pressure; RHR: resting heart rate; RBC: red blood cell; Hgb: hemoglobin; HbA1c: glycosylated hemoglobin; TC: total cholesterol; TG: triglyceride; CREA: creatinine; LDL-C: low-density lipoprotein cholesterol; HDL-C: high-density lipoprotein cholesterol; LVEF: left ventricular ejection fraction.
Compared with the mild group, P ≥ 0.05.
Compared with the moderate group, P ≥ 0.05.
CPET parameter differences among the severity groups
Analysis of the CPET Parameters
The CPET parameters (PVO2/kg, AT, peak Mets, Met@AT, O2 pulse, and ΔVO2/ΔWR) for the mild, moderate, and severe groups were normally distributed with equal variances, as confirmed by the Kolmogorov–Smirnov test. These parameters are reported as mean ± SD (X ± SD). One-way ANOVA was used for comparisons among the groups.
As shown in Table 4, the moderate and severe groups exhibited significantly lower values for PVO2/kg, AT, peak Mets, Met@AT, O2 pulse, and ΔVO2/ΔWR than the mild group (P < 0.05). Additionally, the severe group demonstrated significantly lower values for PVO2/kg, AT, peak Mets, Met@AT, and ΔVO2/ΔWR than the moderate group (P < 0.05). However, O2 pulse did not demonstrate a significant difference between the severe and moderate groups (P > 0.05). Thus, the mild group had higher CPET parameter values than both the moderate and severe groups.
Analysis of the CPET parameter differences among the mild, moderate, and severe groups.

CPET: cardiopulmonary exercise test; PVO2/kg: peak oxygen consumption per kilogram; AT: anaerobic threshold; Peak Mets: peak metabolic equivalent; Met@AT: metabolic equivalent at anaerobic threshold; △VO2/△WR: oxygen uptake related to the work rate.
Compared with the mild group, P < 0.05.
Compared with the moderate group, P < 0.05.
Analysis of differences in the CPET parameters among different lesion branch groups within the SCAD group
Comparison of the general data in the SCAD groups
Quantitative data for the single-branch, double-branch, and multiple-branch groups within the SCAD group were tested for normality (Shapiro–Wilk test) and variance homogeneity. Variables such as age, RBC, LDL-C, Hgb, TC, BMI, TG, CREA, SBP, DBP, and RHR, which were normally distributed and had equal variances (P > 0.05), are presented as X ± S and were compared using one-way ANOVA. Variables LVEF, HDL-C, and HbA1c, which were not normally distributed, are expressed as M (Q25–Q75) and were compared using the Kruskal–Wallis H test among the three groups. Qualitative data including alcohol consumption history, gender, medical history (hypertension, diabetes, hyperlipidemia), smoking, and medication history (beta-blockers, statins) are presented as n (%) and were compared using the chi-square (χ2) test.
The results indicated no significant differences in the age; gender; BMI; smoking history; alcohol consumption history; history of hypertension, diabetes, and hyperlipidemia; medication history including beta-blockers and statins; HDL-C; RBC; TG; Hgb; HbA1c; LVEF; TC; and LDL-C among the three groups (P > 0.05). The baseline data across the three groups were essentially consistent and comparable (Table 5).
Comparison of the general information for the single-, double-, and multiple-branch groups.

BMI: body mass index; ACEI/ARB: angiotensin-converting enzyme inhibitor/angiotensin receptor blocker; SBP: systolic blood pressure; DBP: diastolic blood pressure; RHR: resting heart rate; RBC: red blood cell; Hgb: hemoglobin; HbA1c: glycosylated hemoglobin; TC: total cholesterol; TG: triglyceride; CREA: creatinine; LDL-C: low-density lipoprotein cholesterol; HDL-C: high-density lipoprotein cholesterol; LVEF: left ventricular ejection fraction.
Compared with the single-branch group, P ≥ 0.05.
Compared with the double-branch group, P ≥ 0.05.
CPET parameter differences among different branch groups
CPET parameters for the single-, double-, and multiple-branch groups were tested for normality using the Kolmogorov–Smirnov test and found to be normally distributed with equal variances (P ≥ 0.05). These parameters are reported as X ± S and were compared using one-way ANOVA.
Table 6 indicates that the multiple-branch group had significantly lower values for PVO2/kg, AT, peak Mets, Met@AT, O2 plus, and ΔVO2/ΔWR than both the single- and double- branch groups (P < 0.05). The double- branch group also demonstrated significantly lower values for PVO2/kg, AT, peak Mets, O2 plus, and ΔVO2/ΔWR than the single- branch group (P < 0.05), except for Met@AT, which was not significantly different between the double- and single-branch groups (P ≥ 0.05). Thus, the single-branch group had higher CPET parameter values than the double- and multiple-branch groups.
Analysis of the CPET parameter differences among the single, double, and multiple branch groups.

CPET: cardiopulmonary exercise test; PVO2/kg: peak oxygen consumption per kilogram; AT: anaerobic threshold; Peak Mets: peak metabolic equivalent; Met@AT: metabolic equivalent at anaerobic threshold; △VO2/△WR: oxygen uptake related to the work rate.
aCompared to a single-branch group, P < 0.05.
bCompared with the double-branch group, P < 0.05.
Correlation analysis of the CPET parameters with the coronary SYNTAX score in patients with SCAD
The CPET parameters for patients with SCAD, including PVO2/kg, AT, peak Mets, Met@AT, O2 plus, and ΔVO2/ΔWR, were tested for normality using the Kolmogorov–Smirnov test and were found to be not normally distributed (P < 0.05). Consequently, Spearman correlation analysis was conducted to assess the degree of correlation, with the correlation coefficient r representing the strength of the relationship. The correlation findings revealed that all the aforementioned CPET parameters in the patients with SCAD exhibited a negative correlation with the coronary SYNTAX score, indicating that as the SYNTAX score increased, the CPET parameters decreased (P < 0.001). This suggests a significant inverse relationship between the CAD severity, as measured by the SYNTAX score, and the patients’ CPET results (Table 7 and Figure 1(a) to (f)).
Correlation analysis between coronary SYNTAX score and CPET-related parameters.
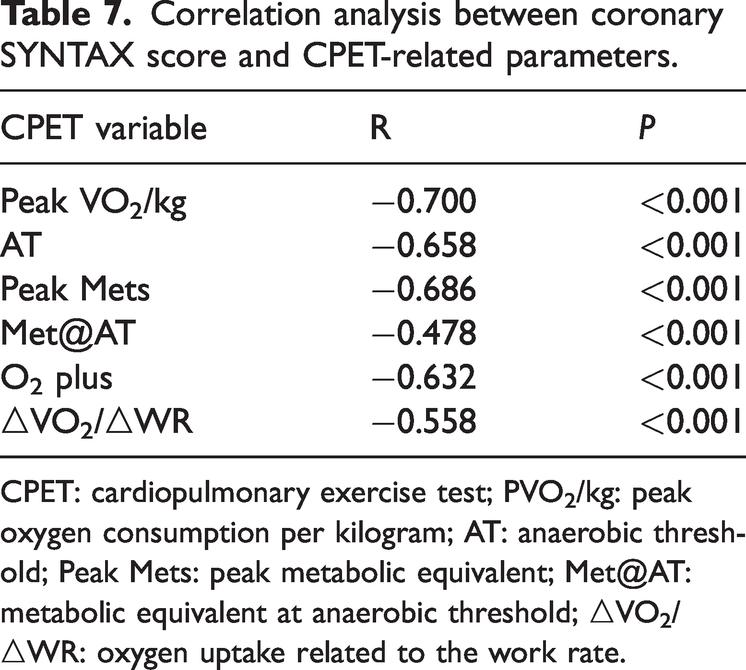
CPET: cardiopulmonary exercise test; PVO2/kg: peak oxygen consumption per kilogram; AT: anaerobic threshold; Peak Mets: peak metabolic equivalent; Met@AT: metabolic equivalent at anaerobic threshold; △VO2/△WR: oxygen uptake related to the work rate.
ROC curve analysis for SCAD diagnosis using CPET parameters
The diagnostic value of the CPET parameters for SCAD was assessed using the ROC curve analysis. The areas under the ROC curves (AUCs) for diagnosing SCAD using the parameters PVO2/kg, AT, peak Mets, Met@AT, O2 plus, and ΔVO2/ΔWR were 0.835, 0.819, 0.689, 0.626, 0.817, and 0.763, respectively.
When these six indicators were combined for the diagnosis of SCAD, the AUC increased to 0.924, which was higher than any single parameter. This combined approach offered a sensitivity, specificity, and Youden index of 83.6%, 90.9%, and 0.745, respectively, indicating an improved diagnostic accuracy compared to that of individual parameters.
Table 8 and Figure 2(a) and (b) represent a comprehensive analysis. These results highlight the potential of CPET parameters, particularly when combined, for diagnosing SCAD with high accuracy.
Receiver operating characteristic curve analysis of the clinical value of CPET in diagnosing stable coronary artery disease.
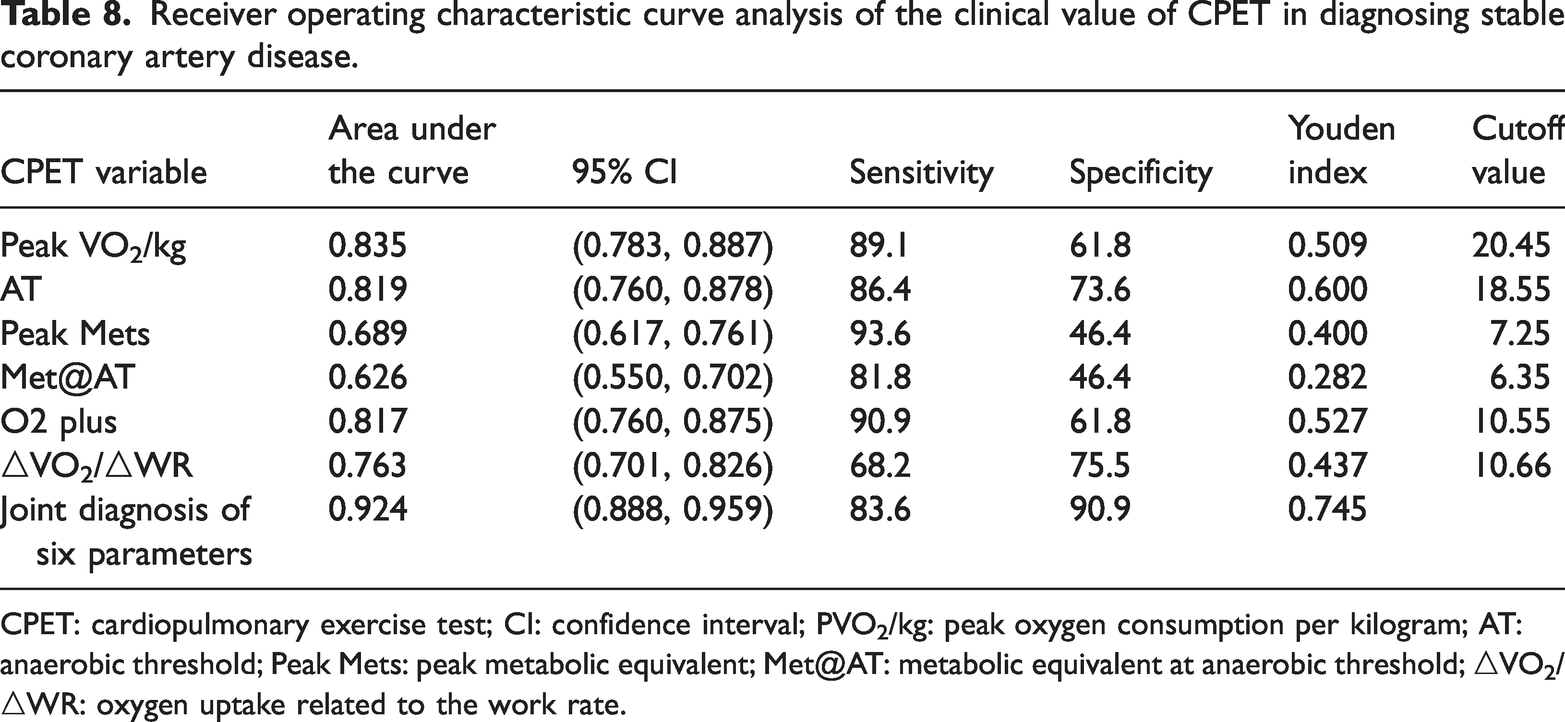
CPET: cardiopulmonary exercise test; CI: confidence interval; PVO2/kg: peak oxygen consumption per kilogram; AT: anaerobic threshold; Peak Mets: peak metabolic equivalent; Met@AT: metabolic equivalent at anaerobic threshold; △VO2/△WR: oxygen uptake related to the work rate.

(a) Receiver operating characteristic (ROC) curves of the clinical value of cardiopulmonary exercise test (CPET) parameters in diagnosing stable coronary artery disease (SCAD) and (b) ROC curves of the six CPET parameters combined in diagnosing SCAD.
Discussion
Clinical utility of CPET in cardiovascular disease management
CPET is increasingly recognized for its value in managing cardiovascular disease, particularly in predicting the CHD risk, assessing the prognosis in CAD, and guiding patient rehabilitation through tailored exercise prescriptions. Although its use remains limited in China, the 2012 joint statement from the European Association of Preventive Cardiology and Rehabilitation and the American Heart Association (AHA) 23 highlighted CPET’s clinical utility in CAD management. Evidence supports CPET’s ability to evaluate cardiopulmonary reserve function, which is crucial for managing patients with CAD. 5 CAD, caused by atherosclerotic changes in the coronary arteries, results in myocardial ischemia and potential necrosis, clinically presenting as chest pain and tightness. 5 While CAG remains the diagnostic gold standard for CAD, CPET parameters offer significant diagnostic insights.12,13 The impact of CAD on cardiopulmonary function varies with the type of vascular lesion. For example, occlusion of the proximal left anterior descending (LAD) artery affects a larger myocardial area, leading to more severe heart failure than other branches. 24 The SYNTAX score is a valuable tool for quantifying lesion severity and guiding revascularization strategies in patients with CAD. 25
Miao Mengdan et al. 13 found that the CPET parameters correlate with lesion severity and demonstrated a diagnostic sensitivity and specificity of 86.4% and 98.5%, respectively for CAD. Akıncı Özyürek et al. 12 also demonstrated the predictive value of CPET parameters in diagnosing CAD in patients with suspected angina. These studies underscore the importance of CPET in assessing CAD severity and highlight the need for personalized exercise prescriptions to enhance patient rehabilitation. Further research aims to explore the differences in the CPET parameters among SCAD patients with varying lesion branches and degrees, investigate the correlation between the CPET parameters and lesion severity, and validate CPET’s diagnostic value for SCAD through an ROC curve analysis.
Differences in the CPET parameters for coronary artery lesions of varying degrees of severity
The “Guidelines for the Diagnosis and Treatment of Stable Ischemic Heart Disease” from 2018 [19] define CHD as having ≥50% stenosis in major coronary vessels. The left coronary artery, which is further divided into the left main stem, LAD artery, and left circumflex artery, along with the right coronary artery, are the primary suppliers of the myocardium. 26 CPET parameters vary with the degree of stenosis or occlusion in different coronary vessels. 27 This study found significant differences in the PVO2/kg, AT, peak METs, METs at, O2 pulse, and ΔVO2/ΔWR among patients with single-, double-, and multi-vessel disease, particularly between the multi- and single/double-vessel groups (P < 0.05). The double-vessel group also demonstrated significant differences than the single-vessel group in most parameters, except for METs at (P ≥ 0.05). The single-vessel group exhibited better cardiopulmonary reserve function, indicating that a higher number of involved vessels and more severe lesions lead to poorer cardiopulmonary function and prognosis. Popovic et al. 28 also demonstrated worse CPET parameters in patients with three or more vessel diseases, aligning with our study findings, confirming the impact of vessel involvement on CPET parameters and cardiorespiratory fitness (CRF). 27
In clinical practice, the SYNTAX score is used to assess the complexity of CAD and aid in choosing the appropriate revascularization methods. 29 The score evaluates the severity of coronary lesions based on anatomical criteria, including various coronary segments, bifurcations, calcified lesions, chronic total occlusions, thrombotic lesions, and diffuse small-vessel disease.15,16,30
In this study, patients with CAD were categorized according to their SYNTAX score, and significant differences in the CPET parameters were noted between the mild, moderate, and severe groups, particularly between the severe and moderate groups (P < 0.05), except for O2 pulse (P > 0.05). This suggests that patients in the mild group had better cardiopulmonary reserve function. Although no studies have directly compared the CPET parameters using SYNTAX score grouping, some have linked the number of coronary lesions to CPET parameters and predicted lesion severity.27,31
A multicenter trial involving 8,518 patients found no significant difference in exercise tolerance between genders among CAD patients with ischemia; however, patients with severe ischemia had poorer exercise tolerance. 32 Gender differences and physical activity levels also influence cardiopulmonary endurance in cardiac rehabilitation patients, with women potentially demonstrating poorer endurance than men.33,34 These findings highlight the need for individualized exercise prescriptions based on CPET parameters for CAD patient rehabilitation.
The latest European Society of Cardiology guidelines have downgraded CPET to a Class 2b recommendation. 35 Historically, the accuracy of Exercise Stress Test has been assessed and validated based on its ability to detect obstructive CAD, using visual diameter stenosis on CAG as the reference standard. However, myocardial ischemia can occur in nearly one-third of the cases without obstructive CAD due to coronary microvascular dysfunction (CMD). 36 Ischemic heart disease remains the leading cause of mortality and morbidity worldwide. In clinical practice, a significant proportion of patients with suspected CAD undergo invasive CAG revealing normal or non-obstructive coronary arteries. 37 Despite being considered as having normal coronary arteries, these patients often exhibit ischemia without obstructive CAD, which is associated with increased cardiovascular risk and higher rates of repeat CAG. 38 Recent guidelines acknowledge the diverse etiopathogenesis of ischemic heart disease and chronic coronary syndromes. 35 The pathophysiology of myocardial ischemia is complex and may involve not only coronary atherosclerosis but also microcirculatory disorders and vasomotion abnormalities. CMD is increasingly recognized as a significant contributor to ischemic heart disease. CMD diagnosis can be established through invasive cardiac catheterization or non-invasive imaging techniques.
Relationship between CPET and SYNTAX score in patients with SCAD
The increasing prevalence of CAD has been associated with societal development and economic growth. CAG remains the gold standard for diagnosis. 8 Treatments for CAD include medical therapy, PCI, and CABG. The condition is fundamentally atherosclerotic, leading to coronary artery narrowing and blockage. 5 Timely revascularization is crucial for extending life. 5 The SYNTAX score, which ranges from 0 to 60, assists cardiologists in selecting the appropriate revascularization methods by assessing lesion complexity, including various types of lesions.15,16,25 Scores of 0–22 indicate mild lesions, 23–32 indicate moderate lesions, and over 33 indicate severe lesions. SYNTAX scoring guides treatment selection, with mild cases often opting for PCI or CABG. Moderate cases require detailed assessment, while severe cases often benefit from CABG.
Post-surgical rehabilitation is crucial for improving long-term outcomes and survival in patients with CAD. Dynamic assessment of cardiopulmonary reserve function is essential for tailoring individualized exercise prescriptions.13,27,31,39,40 CPET measures CRF and correlates with the severity of coronary lesions in patients with CAD. 41 Aerobic exercise has been shown to be safe and beneficial for patients with single-vessel CAD (SCAD), and short-term rehabilitation exercises can improve exercise capacity and quality of life. 42 This study innovates by using SYNTAX scores to evaluate CAD lesion severity and correlating them with CPET parameters to provide more precise, individualized exercise prescriptions to support cardiac rehabilitation. 42 The findings of this study align with previous research, confirming a correlation between CPET parameters and SYNTAX scores.
The diagnostic value of CPET in patients with SCAD
CPET is a valuable tool for assessing myocardial ischemia and hypoxia, and it can identify early-stage CAD patients. CPET parameters hold diagnostic significance in SCAD.12,13,43 Zhu et al. 44 demonstrated that PVO2, O2 pulse, and ΔVO2/ΔWR are valuable for CAD diagnosis, with ΔVO2/ΔWR and O2 pulse showing higher sensitivity than electrocardiogram stress tests (P < 0.01). De Lorenzo et al. 45 found the O2 pulse to be useful in CAD diagnosis but noted its limited diagnostic performance.
Peak oxygen uptake (PVO2) indicates the maximum oxygen consumption during peak exercise and is a standard measure of cardiopulmonary function, although it varies with age, gender, height, and weight. 9 The AT marks the transition from aerobic to anaerobic metabolism and is less influenced by subjective factors. 9 Popovic et al. 46 found that more severe CAD correlates with lower PVO2, which aligns with the findings of this study. The study identified several exercise test parameters- PVO2/kg, O2 pulse, AT, peak Mets, ΔVO2/ΔWR, and Met@AT—with PVO2/kg having the largest area under the ROC curve (0.835), peak Mets the highest sensitivity (93.6%), and ΔVO2/ΔWR the highest specificity (75.5%). Combining these parameters increased the area under the curve to 0.924, with 83.6% sensitivity and 90.9% specificity, supporting the findings of Belardinelli et al. 47 In clinical practice, if the result of this index is less than 20.45, CHD should be suspected, and all other indicators should be considered together, and further examination should be recommended. The study concludes that there is a correlation between the severity of CAD and cardiopulmonary reserve function. CPET parameters inversely correlate with the severity of CAD in SCAD patients, making CPET a valuable non-invasive diagnostic tool. Medical professionals can use CPET parameters to create personalized exercise prescriptions for CAD patients, potentially reducing subsequent cardiovascular events and aiding in-patient rehabilitation.
As cardiac rehabilitation advances, the emphasis increasingly shifts toward enhancing the cardiovascular fitness of patients with cardiovascular diseases. Modern cardiac treatment extends beyond revascularization procedures, such as PCI or CABG, and pharmacotherapy. For individuals with CAD, especially those with severe CAD who have experienced ST-segment elevation myocardial infarction (STEMI), it is crucial to assess the cardiopulmonary function, develop exercise training programs, and plan other follow-up treatments, incorporating CPET as part of disease management.
Li et al. 48 revealed that patients with STEMI who underwent primary PCI exhibited lower peak oxygen uptake (VO2 peak) and peak O2-pulse, along with a relatively high ventilatory equivalent for carbon dioxide (VE/VCO2) slope if they had CMD. AccuIMR demonstrated a significant correlation with these parameters, according to our correlation analysis. Multivariable logistic regression analysis also indicated that AccuIMR was independently associated with reduced VO2 peak, elevated VE/VCO2 slope, and ischemia-related indicators.
CRF, typically defined by VO2 peak measured during maximal CPET, is a crucial marker in both healthy and diseased populations due to its strong prognostic value. Previous research has demonstrated that patients with non-obstructive CAD and CMD, diagnosed by echocardiographic assessment of coronary flow velocities in the LAD artery, had lower VO2 peak, indicating reduced exercise capacity. 49 Li et al. 48 also found that patients with IHD had lower peak oxygen uptake and cardiac output than the healthy population, with similar results observed in IHD patients with non-obstructive CAD following adjusted analysis. Patients with epicardial coronary obstruction or microvascular obstruction may exhibit similar responses following CPET despite different coronary catheterization findings. 50 Therefore, the value of CPET in assessing patients with complete revascularization following PCI is particularly important for disease management and prognosis.
Limitations
This single-center, retrospective study, limited by a small sample size, may not fully represent the broader population of patients with CAD, potentially leading to biased results. The CPET parameters in both the SCAD and non-SCAD groups were not normally distributed, necessitating the use of non-parametric tests, which may reduce the statistical power. The small sample size, short observation period, and single-center design might contribute to this bias. Additionally, the continued use of β-blockers during testing could influence the analysis of CPET parameters, and patients’ subjective feelings during CPET might result in false positives for CAD diagnosis. Larger, prospective, multicenter studies are warranted to validate these findings. Despite these limitations, CPET’s simplicity, low cost, and non-invasive nature contribute to its diagnostic value for CAD, allowing for an indirect assessment of CAD severity and widespread clinical use.
Conclusions
CPET parameters demonstrated a significant negative correlation with the SYNTAX score in patients with SCAD, highlighting its clinical utility in evaluating coronary stenosis severity and diagnosing SCAD. As the SYNTAX score rises, indicating increased coronary disease complexity, CPET parameters decrease, signifying deteriorating cardiopulmonary function. This inverse relationship can inform clinical assessments of CAD severity and support diagnostic efforts. CPET’s role as a non-invasive diagnostic tool offers valuable insights into patient conditions, facilitating more informed treatment decisions.
Footnotes
Acknowledgements
All authors should be considered as first co-authors.
Author contributions
JX: Concept/design, data analysis/interpretation, drafting article, critical revision of article, approval of article, statistics, funding, data collection.
YL: Concept/design, data analysis/interpretation, drafting article, critical revision of article, approval of article, statistics, funding, data collection.
XH: Concept/design, data analysis/interpretation, drafting article, critical revision of article, approval of article, statistics, funding, data collection.
YQ: Concept/design, interpretation, critical revision of article, approval of article.
HH: Concept/design, interpretation, critical revision of article, approval of article.
JL: Concept/design, data analysis/interpretation, drafting article, critical revision of article, approval of article, statistics, funding, data collection.
Availability of data and materials
Not applicable. Please contact author for data requests.
Consent for publication
Not applicable.
Ethics approval and consent to participate
The protocol was approved by the Chengdu Second People’s Hospital, Clinical Research Ethics Committee, and all the participants provided informed consent.
Funding
Not applicable.
Statement of competing interests
The authors declare that they have no competing interests.