
Abstract
Objective
This study was performed to evaluate the interaction effect of salusin-α and salusin-β on coronary artery injury or stenosis.
Methods
The salusin-α and salusin-β concentrations were measured by enzyme-linked immunosorbent assay in 256 patients who underwent coronary angiography for chest pain, and coronary artery stenosis was assessed by the SYNTAX scoring system. Multivariate logistic regression was used to analyze the correlation between variables and coronary artery stenosis. The interaction of salusin-α and salusin-β on coronary artery stenosis was further explored by multiple linear regression.
Results
The model goodness of fit (R) for the interaction effect of salusin-α and salusin-β on coronary artery stenosis was 0.863, and the adjusted R value revealed that the interaction could explain 74.3% of the variation in SYNTAX scores. The F-statistic exceeded F0.05 (3.031485935) and P < 0.001, further showing that salusin-α and salusin-β had a significant interaction effect on coronary artery stenosis. The standard coefficient for salusin-β (0.797) was higher than that for salusin-α (−0.367, indicating an inhibitory effect), showing that salusin-β had a greater effect on coronary artery stenosis.
Conclusions
Salusin-β, a potential marker for assessing coronary atherosclerosis, was superior to salusin-α, contributing to our understanding of the etiology of coronary artery stenosis.
Introduction
Salusin-α and salusin-β are two small peptides derived from alternative splicing at the C-terminal end of TOR2A.1,2 They are composed of 28 and 20 amino acids, respectively, and are expressed in many types of cells.3–5 These two low-molecular-weight peptides exhibit hemodynamic effects and play important roles in atherosclerosis and cardiovascular disease.1,4,6 Although the two peptides have various functions,4–6 recent clinical studies have focused on their roles in the pathogenesis of atherosclerosis and cardiovascular disease.7–9
Immunological analyses have shown that the plasma concentrations of salusin-α and salusin-β in healthy adults are 23.3 ± 8.1 pmol/L and 4.1 ± 0.9 nmol/L, respectively.10,11 Studies have shown that the concentration of salusin-α in patients with coronary artery stenosis is significantly lower than that in healthy people, while the concentration of salusin-β is higher.9,12 Studies have also shown that the salusin-α concentration is significantly negatively correlated and that the salusin-β concentration is positively correlated with coronary artery injury or stenosis.13,14 Therefore, salusin-α and salusin-β are potential markers of atherosclerosis. 15 However, the interaction effects of salusin-α and salusin-β on coronary artery injury or stenosis and the relative magnitudes of their effects have not been determined. In this study, the salusin-α and salusin-β concentrations were measured in different groups of patients and their interaction effect on coronary artery stenosis was evaluated to determine the utility of these two molecular markers in evaluating coronary artery injury or stenosis in the clinical setting. Our aim is to provide comprehensive data for use in clinical analysis.
Materials and methods
Baseline characteristics of study population
Patients who underwent invasive coronary angiography (ICA) for chest pain in our clinical cardiovascular department were classified into four groups, and their serum samples were collected. The serum was set aside for 30 minutes at 37°C, separated by centrifugation, and stored at −30°C until use. The four groups of patients were as follows: those without coronary artery lesions or <50% stenosis (non-vessel disease [non-VD] group), those with single-vessel coronary artery lesions and >50% stenosis (1-VD group), those with two-vessel coronary artery disease (2-VD group), and those with coronary artery disease involving three or more vessels (3-VD group). In addition, the VD group comprised the 1-VD, 2-VD, and 3-VD groups. Age, sex, smoking status, statin therapy, body mass index, systolic blood pressure, diastolic blood pressure, total cholesterol concentration, triglyceride concentration, low-density lipoprotein cholesterol concentration, and high-density lipoprotein cholesterol concentration were recorded for all patients.
Additionally, a control group of healthy volunteers was established, and their basic information was collected. The participants in this group were free from hypertension, diabetes mellitus, hyperlipidemia, and ischemic heart disease and were taking no medications.
This clinical investigation was conducted according to the principles expressed in the Declaration of Helsinki. The study protocol was approved by the Medical Ethical Committee of the Central Hospital of Wuhan (approval number: clinical research (2014) No. 153). Written informed consent was obtained from all participants in accordance with the guidelines of the Chinese Ministry of Health.
ICA
ICA was used to evaluate the severity of coronary artery stenosis, and a SYNTAX score was obtained for each patient. ICA was performed according to the standard Judkins technique in all cases. At least two views of the right coronary artery and six views of the left coronary artery were visualized, recorded, and stored. Coronary artery segments were classified according to the guidelines of the American Heart Association. The severity of stenosis was evaluated using Quantitative Coronary Analysis (QCA, Innova 2000; GE Medical Systems, Waukesha, WI, USA). A >50% reduction in the minimal lumen diameter compared with the proximal reference was defined as significant stenosis. The angiograms were judged by one experienced cardiologist who was not involved in the data read-out of the dual-source computed tomography. All vessels with luminal diameters of ≥1.5 mm were analyzed. 16 The SYNTAX scoring system 17 was used to calculate the patients’ SYNTAX scores. The SYNTAX score of each patient was evaluated three times by the above-mentioned experienced cardiologist according to the results of ICA, and the statistical analysis showed no significant differences among the three scores. Before the data analysis was performed, all patients’ SYNTAX scores were reviewed three times by two experts based on the imaging data. The statistical analysis showed no significant differences in the results of the three ratings of each expert or in the SYNTAX score of each patient obtained by the three experts.
Enzyme-linked immunosorbent assay
Human salusin-α and salusin-β enzyme-linked immunosorbent assay (ELISA) kits were obtained from USCN Life Science Inc. (Wuhan, China). Two standard curves were generated according to the manufacturer’s instructions. Before examining the samples, the best dilution for human serum samples was determined. A microtiter plate provided with the kit was pre-coated with an antibody specific to salusin-α or salusin-β. Standards or samples were added to the appropriate microtiter plate wells with a biotin-conjugated polyclonal antibody preparation specific for salusin-α or salusin-β. Avidin–horseradish peroxidase conjugate was then added to each microplate well, and the plate was incubated. Next, a 3,3′5,5′-tetramethylbenzidine (TMB) substrate solution was added to each well. Only wells containing salusin-α or salusin-β, biotin-conjugated antibody, and enzyme-conjugated avidin exhibited a change in color. The enzyme–substrate reaction was terminated by the addition of a sulfuric acid solution, and the color change was measured spectrophotometrically at a wavelength of 450 nm. The concentration of salusin-α or salusin-β in the samples was then determined by comparing the optical density of the samples with the standard curve depending on the dilution.
Comparison of salusins and SYNTAX scores
The mean values of all variables in the different groups of patients and in the control group of healthy volunteers were calculated for comparisons among groups. Multivariate logistic regression was used to determine the odds ratio (OR) and 95% confidence interval (CI) of clinical variables associated with coronary artery stenosis. The VD group (comprising the 1-VD, 2-VD, and 3-VD groups) was valued as positive, while the non-VD group was valued as negative. Multivariate linear regression was used to evaluate the effect of the interaction between salusin-α and salusin-β on the SYNTAX scores, and their respective roles were analyzed.
Statistical analysis
SPSS version 19.0 (IBM Corp., Armonk, NY, USA) was used for the data analyses. All values are expressed as mean ± standard error of the mean. Data were compared by the χ2 test and one-way analysis of variance (ANOVA). The correlations between clinical variables and coronary artery stenosis were analyzed using multivariate logistic regression. Multiple linear regression was used to analyze the synergistic effect of salusin-α and salusin-β on the SYNTAX scores of all patients. As shown in Table 3, the R value indicated the goodness of fit of the model, where a value close to 1.0 indicated a good model fit. The adjusted R2 value was estimated to more accurately determine whether independent variables could explain variation in the dependent variable. In the ANOVA, an F-value corresponding to a significance value of <0.05 indicated that the regression equation was useful. If F > Fα (k, n – k − 1), the synergistic effect of the independent variables in the model on the dependent variable was significant; otherwise, there was no significant effect of the interaction. The k value indicates the number of independent variables, n is the sample capacity, n – k − 1 is the degrees of freedom, and α is the significance level. The α value was set to 0.05, and Fα (0.05, 2, 253) = 3.031485935. To analyze the effects of salusin-α and salusin-β on the SYNTAX scores, the regression coefficients were determined; the greater the beta value, the greater the influence of the independent variable. A P-value of <0.05 indicated statistical significance.
Results
In total, 256 patients were included in this study. The non-VD, 1-VD, 2-VD, and 3-VD groups comprised 68, 72, 50, and 66 patients, respectively. The control group comprised 37 healthy adults (22 men, 15 women; mean age, 58.46 ± 11.88 years).
The clinical characteristics of the enrolled patients and healthy volunteers are summarized in Table 1. There were no significant differences in age, sex, or smoking status among the groups. The percentage of patients treated with statins was significantly lower in the non-VD group than in the 3-VD group (P < 0.05). Both the mean body mass index and high-density lipoprotein cholesterol concentration were significantly higher in the non-VD group than in the 1-VD group and 3-VD group (P < 0.05), but there were no significant differences among the other groups. The mean systolic and diastolic blood pressures were significantly lower in the control group than in the non-VD, 1-VD, 2-VD, and 3-VD groups (P < 0.05), but there were no significant differences in the mean values among the four patient groups. The mean concentrations of total cholesterol and triglycerides were significantly lower in the control group than in the 1-VD, 2-VD, and 3-VD groups (P < 0.05), but there was no significant difference between the control group and the non-VD group. The SYNTAX score increased with the severity of coronary artery stenosis (P < 0.05).
Baseline characteristics of the study population.

Data are presented as mean ± standard error of the mean or n (%).
BMI, body mass index; SBP, systolic blood pressure; DBP, diastolic blood pressure; TC, total cholesterol; TG, triglycerides; LDL-c, low-density lipoprotein cholesterol; HDL-c, high-density lipoprotein cholesterol; Non-VD, no coronary artery lesions or stenosis of <50%; 1-VD, single-vessel coronary artery disease; 2-VD, two-vessel coronary artery disease; 3-VD, three-vessel coronary artery disease and above.
*Significant difference between control group and Non-VD, 1-VD, 2-VD, and 3-VD groups (P < 0.05).
%Significant difference between control group and 1-VD, 2-VD, and 3-VD groups (P < 0.05).
&Significant difference between Non-VD and 3-VD groups (P < 0.05).
#Significant difference between Non-VD and 1-VD groups (P < 0.05).
$Significant difference between Non-VD and 1-VD, 2-VD, and 3-VD groups (P < 0.05).
†Significant difference between 1-VD and 2-VD, 3-VD groups (P < 0.05).
‡Significant difference between 2-VD and 3-VD groups (P < 0.05).
ICA was successfully performed in all 256 patients with chest pain, and the coronary artery lesions of each patient were scored by the SYNTAX scoring system. The mean SYNTAX score was significantly lower in the non-VD group than in the VD group (P < 0.05) (Figure 1). The standard curve equations for the serum concentrations of salusin-α and salusin-β as measured by ELISA were y = 4.227x + 0.442 (R = 0.97) and y = 4.779x + 10.247 (R = 0.98), respectively (Figure 2). The mean salusin-α concentration in the non-VD group was significantly higher than that in the VD group (P < 0.05) but significantly lower than that in the control group (P < 0.001). However, the results obtained for the mean salusin-β concentration differed from those obtained for the mean salusin-α concentration (Figure 2). Further analysis of the differences in the mean salusin-α and salusin-β concentrations in the different subgroups of the VD group showed that there was no significant difference in the salusin-α concentration between the non-VD and 1-VD groups, between the 1-VD and 2-VD groups, or between the 2-VD and 3-VD groups. However, there was a significant difference in the mean salusin-β concentration between these groups (P < 0.001) (Figure 3).

SYNTAX scores in different groups. Upper row shows representative images of coronary artery lesions in different branches. (a, b) No-vessel (right and left branches) coronary artery stenosis. (c, d) Single-vessel (right and left branches) coronary artery stenosis. (e) Two-vessel coronary artery stenosis. (f) Three or more-vessel coronary artery stenosis. Lower row shows the comparison of mean SYNTAX scores between the Non-VD and VD groups. Non-VD, no coronary artery lesions or stenosis of <50%; VD, coronary artery lesions and stenosis of >50%.
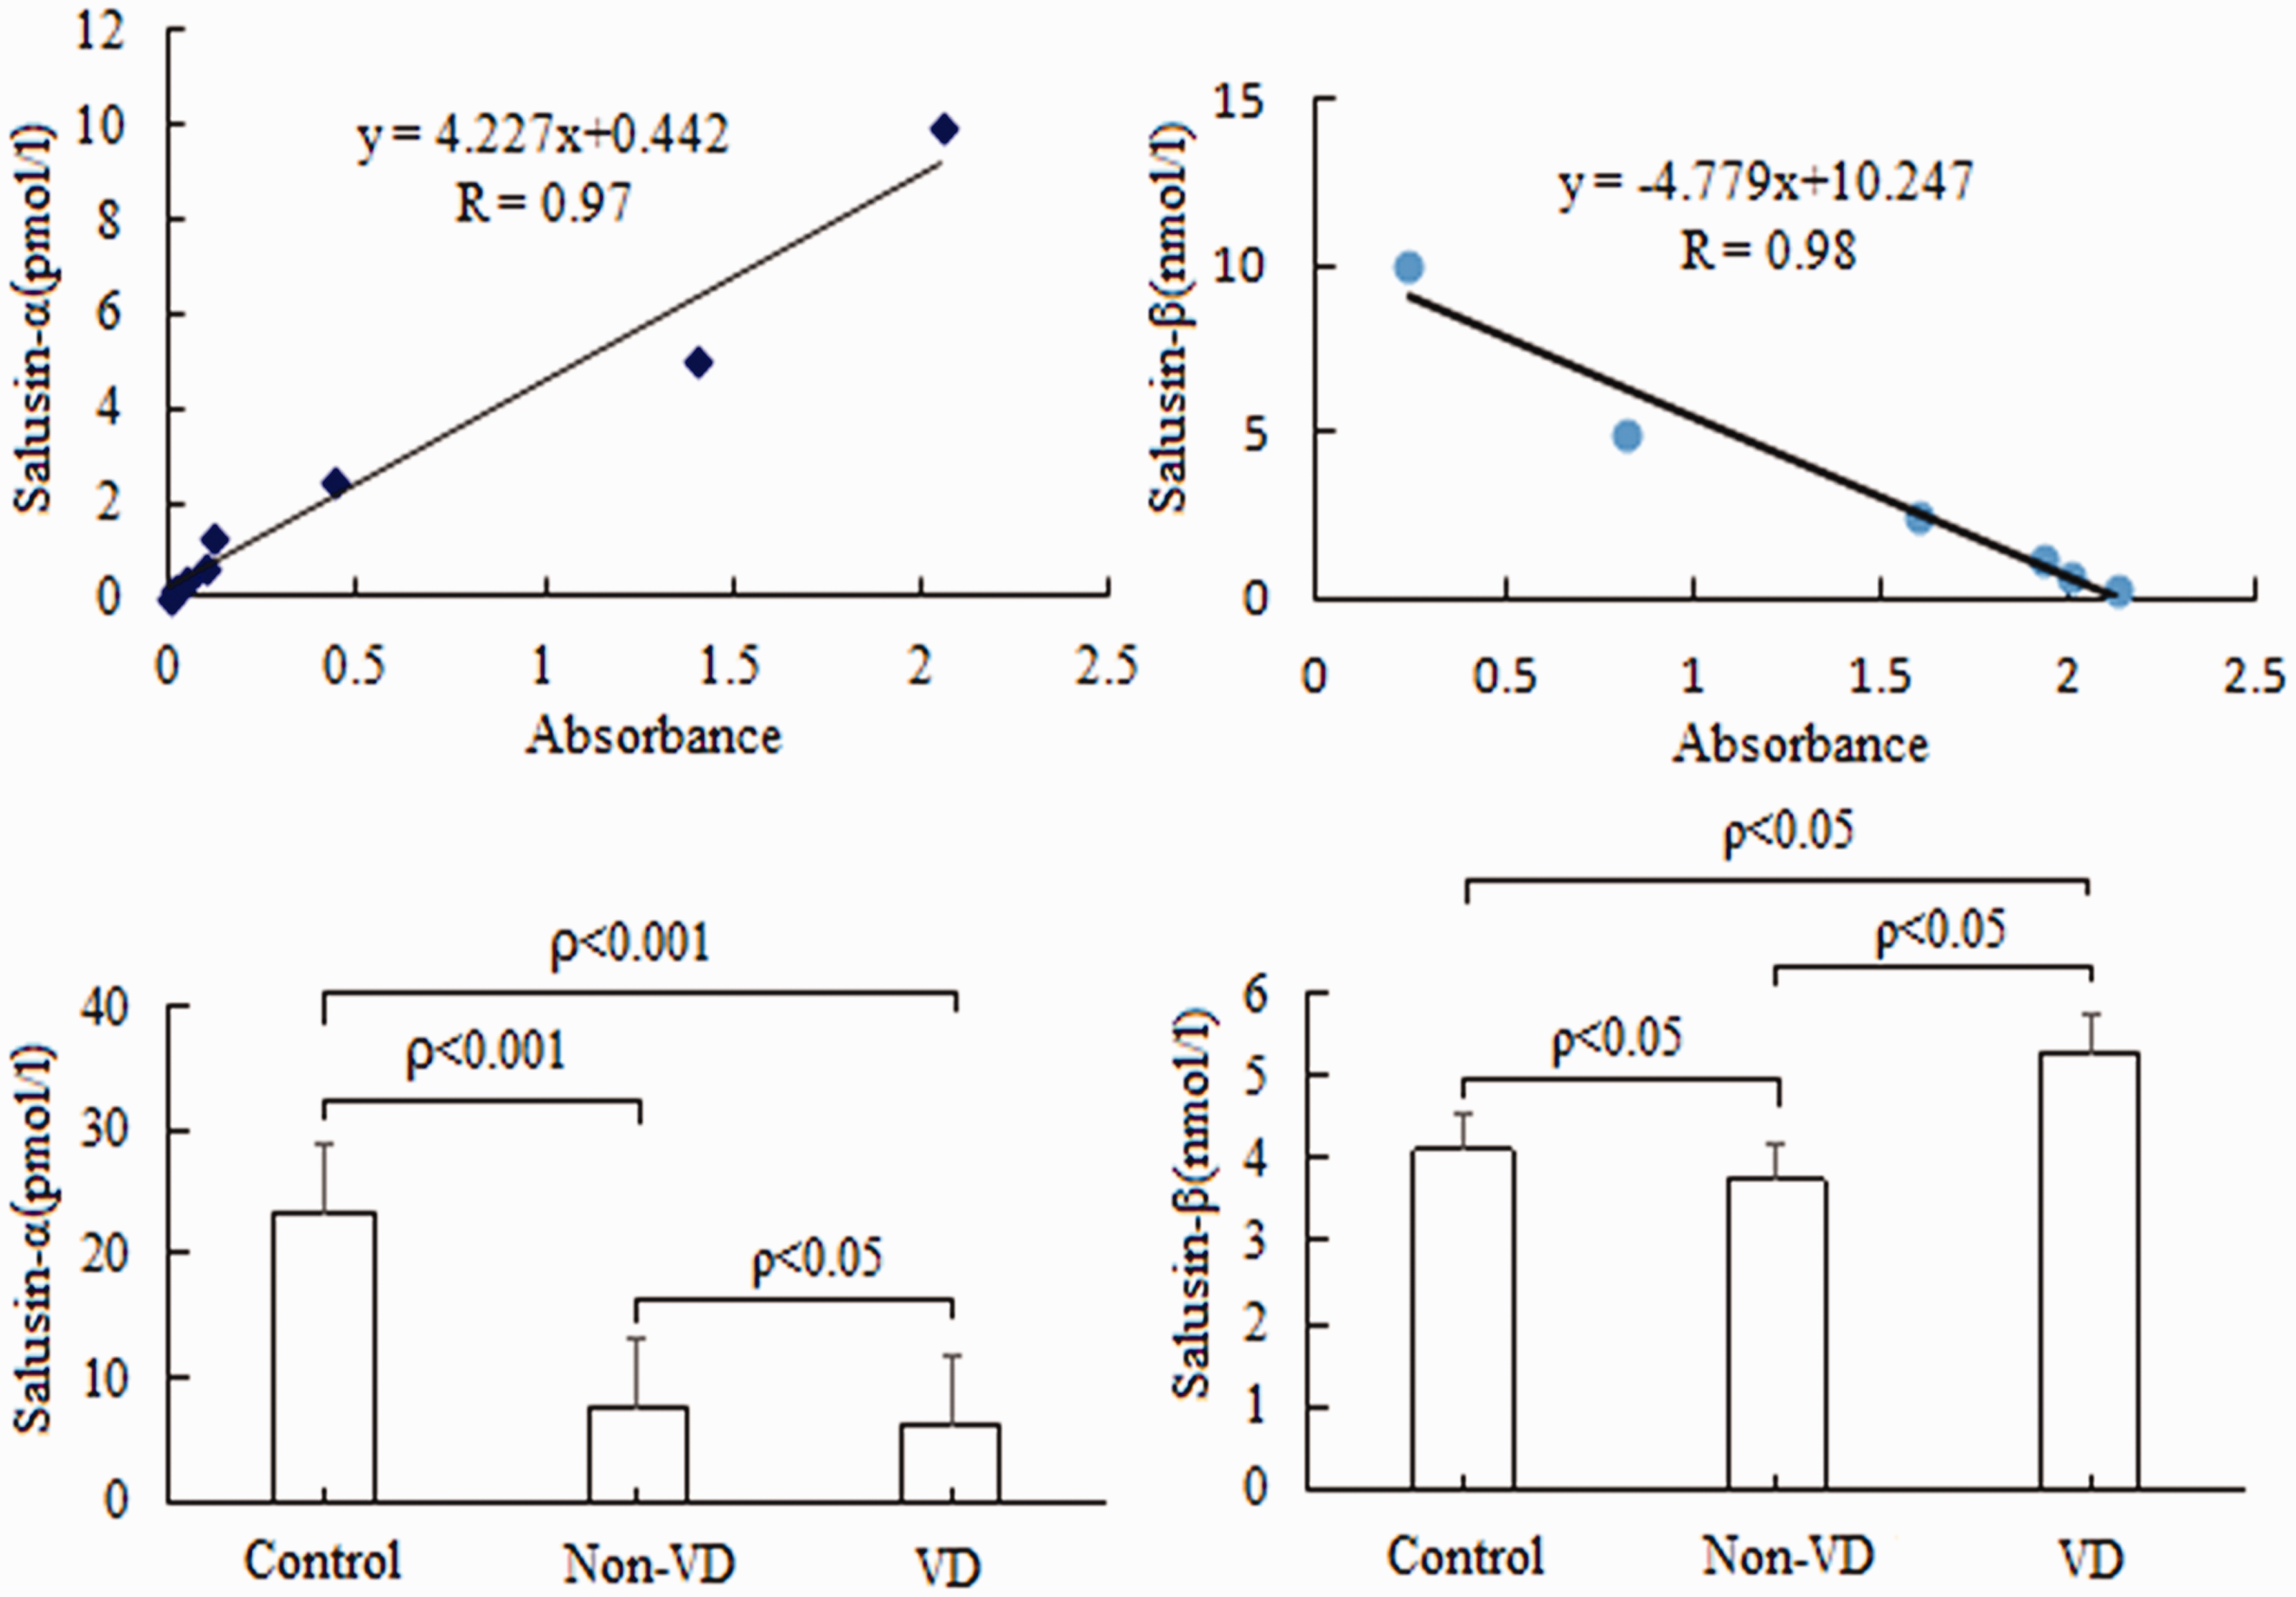
Salusin concentrations in different groups. Upper left plot shows the standard curve for salusin-α, and upper right plot shows the standard curve for salusin-β. Lower left plot shows the comparison of mean salusin-α concentrations in different groups, and lower right plot shows the comparison of mean salusin-β levels. Non-VD, no coronary artery lesions or stenosis of <50%; VD, coronary artery lesions and stenosis of >50%.

Comparison of mean salusin concentrations in different subgroups. Upper plot shows the comparison of mean salusin-α concentrations in different subgroups, and lower plot shows the comparison of mean salusin-β levels. Non-VD, no coronary artery lesions or stenosis of <50%; 1-VD, single-vessel coronary artery disease; 2-VD, two-vessel coronary artery disease; 3-VD, three-vessel coronary artery disease and above.
Table 2 summarizes the relationships between clinical variables (independent variables) and coronary artery stenosis (dependent variable) for all 256 patients as determined by multiple logistic regression. In addition to age and the triglyceride concentration, we confirmed that salusin-α (OR, 0.654; 95% CI, 0.545–0.786; P < 0.001) and salusin-β (OR, 8.740; 95% CI, 4.952–15.424; P < 0.001) were significantly correlated with coronary artery stenosis, while the other variables were not significantly correlated with coronary artery stenosis.
Summary of multiple logistic regression analysis of the correlations between clinical variables and coronary artery stenosis.
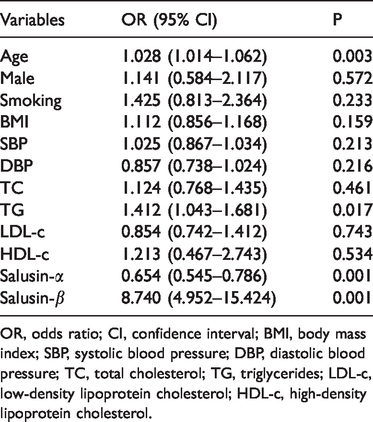
OR, odds ratio; CI, confidence interval; BMI, body mass index; SBP, systolic blood pressure; DBP, diastolic blood pressure; TC, total cholesterol; TG, triglycerides; LDL-c, low-density lipoprotein cholesterol; HDL-c, high-density lipoprotein cholesterol.
Salusin-α and salusin-β were used as independent variables and the SYNTAX scores for the 256 patients were used as dependent variables in a multiple linear regression to analyze the synergistic effect of salusin-α and salusin-β. Table 3 summarizes the parameters for model construction. The R value was 0.863, revealing that the combined effect of salusin-α and salusin-β on the SYNTAX scores for the 256 patients was large, with a better goodness of fit. The adjusted R2 value for the SYNTAX scores was 0.743. This result indicated that the synergistic effect of salusin-α and salusin-β could explain 74.3% of the variance in the SYNTAX scores. The regression model in the ANOVA showed an F-value of 368.831 with a significant P-value of 0.001, clearly indicating that the constructed regression model was useful, and the synergistic effect of salusin-α and salusin-β on the SYNTAX scores was significant (F > Fα = 3.031485935, P < 0.001). Furthermore, the effects of salusin-α and salusin-β on the SYNTAX scores were reviewed based on the regression coefficients. We found that salusin-α and salusin-β had significant effects on the SYNTAX scores (P < 0.001) and that the effect of salusin-β (beta value = 0.797) was greater than that of salusin-α (beta value = −0.367).
Summary of multiple linear regression analysis of the synergistic effects of salusin-α and salusin-β on SYNTAX scores.

aRelative regression coefficients of the independent variable salusin-α (t = −11.541, Sig = 0.001).
bRelative regression coefficients of the independent variable salusin-β (t = 25.057, Sig = 0.001).
ANOVA, analysis of variance; Sig, significance.
Discussion
The results of this retrospective study confirmed the significant interaction effect of the serum salusin-α and salusin-β concentrations on coronary artery stenosis. Furthermore, the effect of the serum salusin-β concentration on coronary artery stenosis was almost double that of salusin-α. Therefore, we believe that salusin-β is more effective than salusin-α as a potential indicator of coronary artery injury or stenosis. These data show that coronary artery stenosis should be evaluated by combining the salusin-α and salusin-β concentrations and that particular attention should be paid to the serum concentration of salusin-β.
Many factors affect atherosclerosis18,19; however, recent studies have emphasized the influence of the serum concentrations of the small peptide molecules salusin-α and salusin-β.1,6–8 A reduction in the serum salusin-α concentration or an increase in the serum salusin-β concentration promotes the progression of atherosclerosis.3,20 It is possible that salusin-β upregulates the expression of acyl-coenzyme A:cholesterol acyltransferase 1 (ACAT-1) via different pathways,4,21 stimulating the proliferation of vascular smooth muscle cells and fibroblasts, while salusin-α inhibits the expression of ACAT-1. 21 Salusin-β can reportedly upregulate the secretion of inflammatory factors and accelerate the development of atherosclerosis, but salusin-α has no such effect.22,23 Other reports have shown that salusin-α inhibits foam cell formation from monocytes and that salusin-β has the opposite effect.4,21 These studies suggest that salusin-α and salusin-β are associated with atherosclerosis and support their clinical application. Clinical investigations have shown that the serum salusin-α concentration in patients with mild hypertension is lower than that in healthy volunteers, and this might explain the development of mild carotid atherosclerosis.10,24 The salusin-α serum concentration in patients with acute carotid syndrome is inversely correlated with the severity of coronary atherosclerosis.13,21 Therefore, salusin-α is likely to be useful for the diagnosis, treatment, and prevention of atherosclerosis and cardiovascular diseases. Other studies have revealed that an increased salusin-β serum concentration is associated with the severity of cardiovascular disease.14,25 Salusin-β is a potential marker of the process of cardiovascular disease, and blocking salusin-β expression could help prevent atherosclerosis. 14 However, further investigations are needed to evaluate the treatment of cardiovascular diseases by inhibiting salusin-β expression. 25 We believe that salusin-α and salusin-β have many biological functions and have opposite effects on atherosclerosis. It is therefore inappropriate to evaluate cardiovascular diseases based on one of the two indices alone.
To evaluate the association between the salusin-α and salusin-β concentrations and atherosclerosis, we selected 256 patients who underwent ICA for chest pain. The salusin-α and salusin-β serum concentrations were determined by ELISA in all 256 patients as well as in 37 healthy volunteers. The interaction between coronary atherosclerosis and these two peptide molecules (salusin-α and salusin-β) has not been previously reported. The SYNTAX score is an internationally recognized standard for evaluating coronary artery injury or stenosis. 26 In this study, each patient was scored by three experienced experts using the SYNTAX scoring system,17,26 and continuous variables for coronary artery injury or stenosis that were suitable for the multivariate linear regression analysis were obtained. The 37 healthy volunteers did not agree to undergo ICA, and their SYNTAX scores were not obtained for comparative analyses. The differences in the basic characteristics among the groups in the present study (Table 1) were consistent with those of previous reports.13,14 The mean SYNTAX score in the non-VD group was significantly lower than that in the VD group (Figure 1). The VD group comprised the 1-VD, 2-VD, and 3-VD groups, and there were differences in the SYNTAX scores among these three subgroups (data not shown). We also compared the mean salusin-α and salusin-β concentrations among the healthy volunteers, non-VD group, and VD group (Figure 2), and the results were consistent with those reported previously.13,14 Further comparisons of the differences in the mean salusin-α and salusin-β concentrations among the non-VD, 1-VD, 2-VD, and 3-VD groups showed no significant differences in salusin-α between two adjacent groups (Figure 3). This was not observed in previous studies, 1 probably because of the small sample sizes. However, there were significant differences in the mean salusin-β concentration among the four groups. We further explored the interaction effect of salusin-α and salusin-β on coronary artery injury or stenosis and the relative importance of the two factors. The multiple logistic regression analysis showed that age, triglycerides, salusin-α, and salusin-β were significantly correlated with coronary artery stenosis (Table 2), consistent with the results of previous reports.13,14 The effect of the interaction of salusin-α and salusin-β on coronary artery injury or stenosis was significant according to the multivariate linear regression analysis, and the effect of salusin-β was significantly greater than that of salusin-α (Table 3). These results suggest that the combination of salusin-α and salusin-β is more reliable than either peptide alone in analyses of coronary artery injury or stenosis and that more attention should be given to the salusin-β serum concentration.
Although an interaction effect of salusin-α and salusin-β on coronary artery injury or stenosis was successfully demonstrated in 256 patients, our study had several limitations. First, although the relationship between multiple basic variables and SYNTAX scores was analyzed in all 256 patients, it was not analyzed with respect to the correlations between variables, especially the correlations of salusins with other variables. Second, we evaluated 256 patients, which represents only a small portion of the population of Wuhan, and most patients were Han Chinese. Third, many factors affect coronary artery injury or stenosis, but we only directly evaluated two factors (salusin-α and salusin-β), and the study duration was only 2 years. Finally, the effects of antiatherogenic medical therapy (such as statins) on the concentrations of salusin-α and salusin-β were not explored in this study. Further analyses of the factors that affect coronary artery injury or stenosis are required.
In conclusion, our study established the interaction effect of salusin-α and salusin-β on coronary artery injury or stenosis based on an analysis of 256 patients and showed that salusin-β is superior to salusin-α as a potential marker for assessing coronary atherosclerosis. Although additional clinical data and feedback are needed, our findings will be helpful for future studies of the mechanism underlying coronary artery injury or stenosis.
Footnotes
Acknowledgments
We thank Dr. Yujie Sun for providing technical assistance. We are also grateful to Dr. Cao Yang for the helpful analysis and to the study participants for their cooperation.
Declaration of conflicting interest
The authors declare that there is no conflict of interest.
Funding
This work was supported by grants from Natural Science Foundation of Hubei Province, Hubei, China (Grant no. 2015CFB291); the Natural Science Foundation of Hubei Province, Hubei, China (Grant no. 2016CKB709); and the Scientific Research Fund Project of Health Commission of Hubei Province, Hubei, China (Grant no. WJ2015MB088).