
Abstract
Objective
We developed a simple, rapid predictive model to evaluate the prognosis of older patients with lung adenocarcinoma.
Methods
Demographic characteristics and clinical information of patients with lung adenocarcinoma aged ≥60 years were retrospectively analyzed using Surveillance, Epidemiology, and End Results (SEER) data. We built nomograms of overall survival and cancer-specific survival using Cox single-factor and multi-factor regression. We used the C-index, calibration curve, receiver operating characteristic (ROC) curves, and decision curve analysis (DCA) to evaluate performance of the nomograms.
Results
We included 14,117 patients, divided into a training set and validation set. We used the chi-square test to compare baseline data between groups and found no significant differences. We used Cox regression analysis to screen out independent prognostic factors affecting survival time and used these factors to construct the nomogram. The ROC curve, calibration curve, C-index, and DCA curve were used to verify the model. The final results showed that our predictive model had good predictive ability, and showed better predictive ability compared with tumor-node-metastasis (TNM) staging. We also achieved good results using data of our center for external verification.
Conclusion
The present nomogram could accurately predict prognosis in older patients with lung adenocarcinoma.
Introduction
According to global cancer statistics published in 2021, lung cancer is the second most common malignancy, with an incidence of 11.4%. Lung cancer is the leading malignancy causing death with a mortality rate of 18.0%, which is much higher than that of the second most common (hepatic) malignancy (8.3%). 1 Approximately 91.7% of patients with lung cancer in the United States are over 55 years of age, and the incidence and mortality rates of lung cancer are positively correlated with patients’ age and increase with age, making older people a main patient population in lung cancer. 2 The most common of all pathological subtypes of lung malignancy is lung adenocarcinoma (LUAD), accounting for 54.7% of all lung malignancies. Although the development of clinical therapeutic agents and individualized treatment regimens have improved the survival of many patients with LUAD, the 5-year survival rate for LUAD is only approximately 15%.3,4 These data indicate that LUAD has become a main group of lung malignant tumors in people above 55 years of age, and this population has a higher mortality rate owing to the presence of underlying diseases and the decline of physiological functions. 5
Providing an accurate assessment of the prognosis of older patients with LUAD can improve their prognosis as well as medical resource utilization, and such prediction can provide a certain reference for clinicians in selecting the treatment plan. Currently, the American Joint Committee on Cancer (AJCC) staging system is most commonly used, but this system does not provide further staging for specific groups of lung cancer. Therefore, the AJCC staging system cannot accurately predict the prognosis for certain specific groups with lung cancer.6,7 The nomogram is a novel prognostic predictive model that is well in line with each lung cancer subtype group, which incorporates a wide range of common clinical data. The nomogram can be intuitively and easily applied so as to assist both doctors and patients in making appropriate clinical decisions, and it has been widely used for a wide range of solid tumors. 8 We searched PubMed and found several relevant studies on use of the nomogram in the prediction of LUAD prognosis; however, the related studies have not examined patients with LUAD aged ≥60 years in detail.9,10 We therefore constructed predictive models for the prognosis of patients with LUAD ≥60 years of age using information from the Surveillance, Epidemiology, and End Results (SEER) database. The SEER database covers approximately 30% of the North American population and can provide diverse and reliable data for research. 11 We aim to assist clinicians in more accurately predicting the prognosis of patients with LUAD by constructing a prediction model that will provide a basis for the individualized management of patients.
Methods
Data sources and study design
We conducted a regression analysis using lung malignancy-related SEER data. We used Surveillance Research Program, National Cancer Institute SEER*Stat software (seer.cancer.gov/seerstat) version 8.4.0.1 to obtain data on patients with lung malignancies from the February 2023 release of the SEER database, which includes tumor stage, clinicopathology, and survival information. Prior to initiating this study, we submitted a data use agreement to the SEER program and were formally granted access to the database under approval number 14038-Nov2021. SEER is a database for public research use and personal data in the database are completely confidential; therefore. ethical approval and informed consent were not required for this study. The study was conducted in accordance with the Declaration of Helsinki (revised in 2013). The reporting of this study is in accordance with the Transparent Reporting of a Multivariable Prediction Model for Individual Prognosis or Diagnosis (TRIPOD) guidelines. 12 LUAD was classified according to the 2021 World Health Organization classification system. International Classification of Diseases for Oncology, 3rd Edition (ICD-O-3) histology codes were used to identify patients. The inclusion criteria were as follows: (1) patients aged ≥60 years at the time of diagnosis; (2) year of diagnosis 2010–2019; (3) ICD-O-3 Hist/behav, malignant 8140/3: Adenocarcinoma, NOS. The exclusion criteria were: (1) patients with survival <1 month; (2) patients with unclear clinicopathologic data.
Research variables
Eligible patients were screened according to the above criteria, and these patients were divided into a training set and a validation set at a ratio of 7:3 using R software version 4.2.2 (www.r-project.org), with the random number seed of the grouping set to 12345. The basis for the selection of candidate variables in this study was primarily according to previous LUAD research and clinical experience. The candidate variables comprised demographic data and tumor characteristics. Demographic data included sex (male, female), race and ethnicity (Black, White, other), and marital status (divorced, married, single). Tumor characteristics included tumor location (left lung, right lung), AJCC 7th edition staging (I, II, III, and IV), surgery (yes, no), radiation therapy (yes, no), chemotherapy (yes, no), and distant metastasis information (lung metastasis, bone metastasis, brain metastasis, liver metastasis). We also collected information on each patient's survival time and survival status. We deidentified all patient details before performing the analysis.
Statistical analysis
Demographics and tumor characteristics of the training and validation sets were compared using the chi-square test. Independent prognostic factors for overall survival (OS) and cancer-specific survival (CSS) were determined using univariate and multivariate Cox regression models parameterized by hazard ratios (HRs), with corresponding 95% confidence intervals (CIs). A nomogram was plotted based on the established Cox regression model and was used to predict 1-year, 3-year, and 5-year OS and CSS. We used the C-index to assess the model's discriminatory power. The C-index thresholds for nomogram prediction accuracy were defined as low (0.50–0.70), medium (0.71–0.90), and high accuracy (>0.90). 13 Evaluation was done using receiver operating characteristic (ROC) curves and the area under the ROC curve (AUC). An AUC of 0.50–0.70 was considered low accuracy, AUC 0.71–0.90 was considered medium accuracy, and AUC above 0.90 was considered high accuracy. 14 Calibration of the model was tested by plotting a calibration curve using the bootstrap method with 1000 repetitive samples to ensure the accuracy and reliability of the model. Clinical decision curves were plotted for the model to test the clinical benefit and application value of this model. The model was validated using a validation set, and we compared this model with the AJCC staging system. We then used data from our center to externally validate the constructed predictive model. All statistical analyses were performed using R software version 4.2.2 and P < 0.05 was considered statistically significant.
Results
Patient characteristics
In this study, a total of 39,841 patients from the SEER database were screened, and 14,117 patients who met the inclusion criteria and those who did not meet the exclusion criteria were categorized into a training set (N = 9881) and a validation set (N = 4236), respectively, at a 7:3 ratio (Figure 1). The sex ratio in both the training and validation sets was approximately 50%. The study population was predominantly White (>75%) in both the training and validation sets. Approximately half of patients (55.03%) were married at the time of diagnosis, and 45% of patients had undergone radiotherapy or chemotherapy. In terms of AJCC staging, patients with stage IV accounted for approximately 43% of all stages in both the training set and validation set. The baseline data of the two groups of patients were similar and there was no significant differences; see Table 1 for specific data.

Flowchart of participant selection. SEER, Surveillance, Epidemiology, and End Results; AJCC, American Joint Committee on Cancer; T, tumor; N, node.
Clinicopathologic features of older patients with lung adenocarcinoma.

Includes American Indian/Alaska Native, Asian/Pacific Islander.
Independent prognostic factors for overall survival (OS) and cancer-specific survival (CSS) in older patients with LUAD
Univariate Cox regression analysis of variables affecting OS and CSS in the training set showed that sex, race and ethnicity, marital status, AJCC stage, surgery, radiotherapy, chemotherapy, and distant metastasis (bone, brain, liver, and lungs) were significant prognostic factors for OS and CSS (all P < 0.001. Multifactorial Cox regression analyses were performed using these variables, and Cox regression models of OS and CSS were constructed (Tables 2 and 3).
Univariate and multivariate analyses of OS in training set.

Includes American Indian/Alaska Native, Asian/Pacific Islander.
HR, hazard ratio; CI, confidence interval.
Univariate and multivariate analyses of CSS in training set.

Includes American Indian/Alaska Native, Asian/Pacific Islander.
HR, hazard ratio; CI, confidence interval.
Construction of prognostic nomogram
Based on the results of Cox multifactorial regression analysis in the training set, the 11 variables screened were used to construct a prognostic nomogram for OS and CSS in older patients with LUAD (Figure 2). Patients’ 1-year, 3-year, and 5-year survival was predicted by integrating all predictors. The total score obtained by summing the scores from each variable was used to predict the patient's 1-year, 3-year, and 5-year survival.
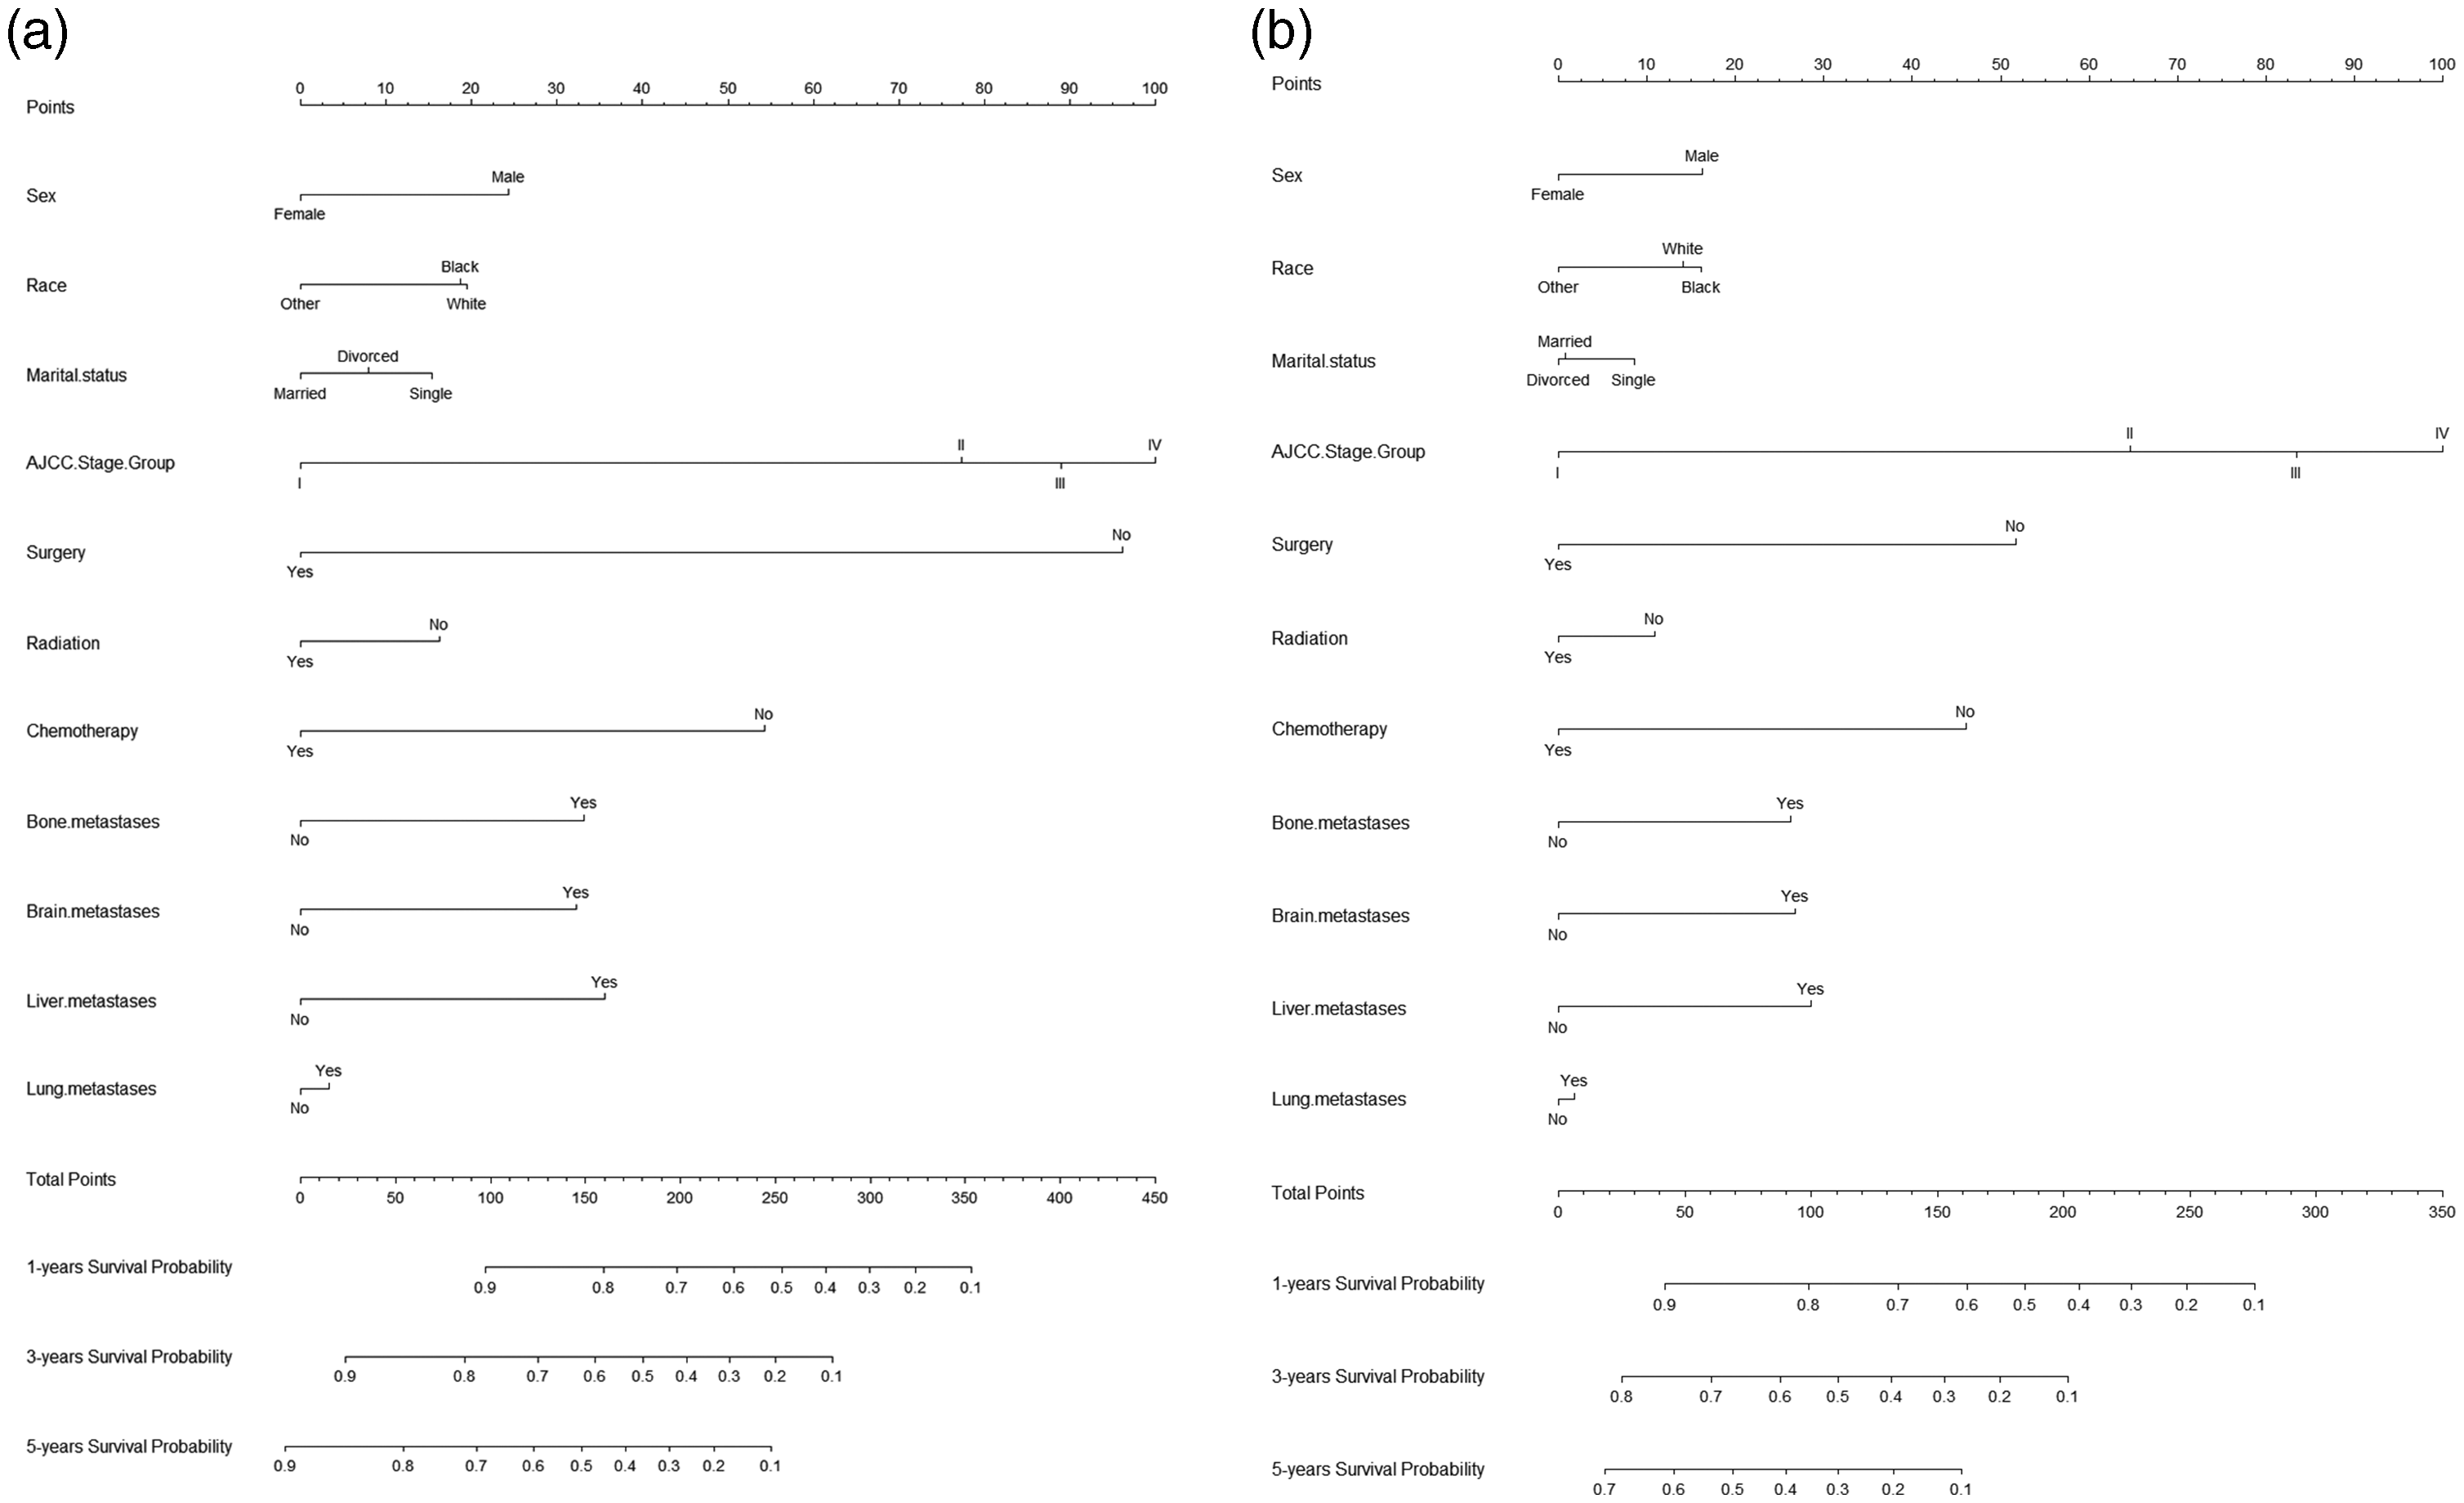
Prognostic nomograms of 1-, 3-, and 5-year (a) overall survival and (b) cancer-specific survival.
Validation of the nomogram
Using R software, we calculated the C-index for the OS training set and validation set as 0.753 and 0.758; the C-indexes for the CSS training set and validation set were 0.721 and 0.730, respectively, suggesting good predictive value (Table 4). Risk scores for each independent prognostic factor were calculated using R software. OS and CSS ROC curves for 1-, 3-, and 5-year survival were plotted for the training set and validated using the validation set by plotting the ROC for 1-, 3-, and 5-year survival. The 1-, 3-, and 5-year AUC values were 0.822, 0.840, and 0.849 for the OS training set and 0.831, 0.839, and 0.852 for the OS validation set. The 1-, 3-, and 5-year AUC values were 0.784, 0.801, and 0.831 for the CSS training set and 0.794, 0.798, and 0.827 for the CSS validation set (Figure 3). The above results demonstrated the ability of this model to predict the 1-, 3-, and 5-year OS and CSS rates in older patients with LUAD relatively reliably. Finally, the model was validated using the bootstrap method, setting the sampling number to 1000. The validation results showed that the 1-, 3-, and 5-year survival correction curves for OS and CSS were similar to the 45° reference line, suggesting an accurate prediction (Figure 4).
C-index results

OS, overall survival; CSS, cancer-specific survival; TNM, tumor-node-metastasis.

ROC curves of the prediction model. (a1, b1) OS training set and validation set ROC curves and (a2, b2) OS training set and validation set ROC curves with AJCC staging, respectively. (c1 and d1) CSS training set and validation set ROC curves and (c2, d2) CSS training set and validation set ROC curves with AJCC staging, respectively. ROC, receiver operating characteristic; AUC, AUC, area under the ROC curve; OS, overall survival; CSS, cancer-specific survival; AJCC, American Joint Committee on Cancer.

Correction curves for overall survival when validating the nomogram model for the (a1, a2, a3) training set and (b1, b2, b3) validation set. Correction curves for cancer-specific survival when validating the nomogram model for the (c1, c2, c3) training set and (d1, d2, d3) validation set.
Decision curve analysis (DCA)
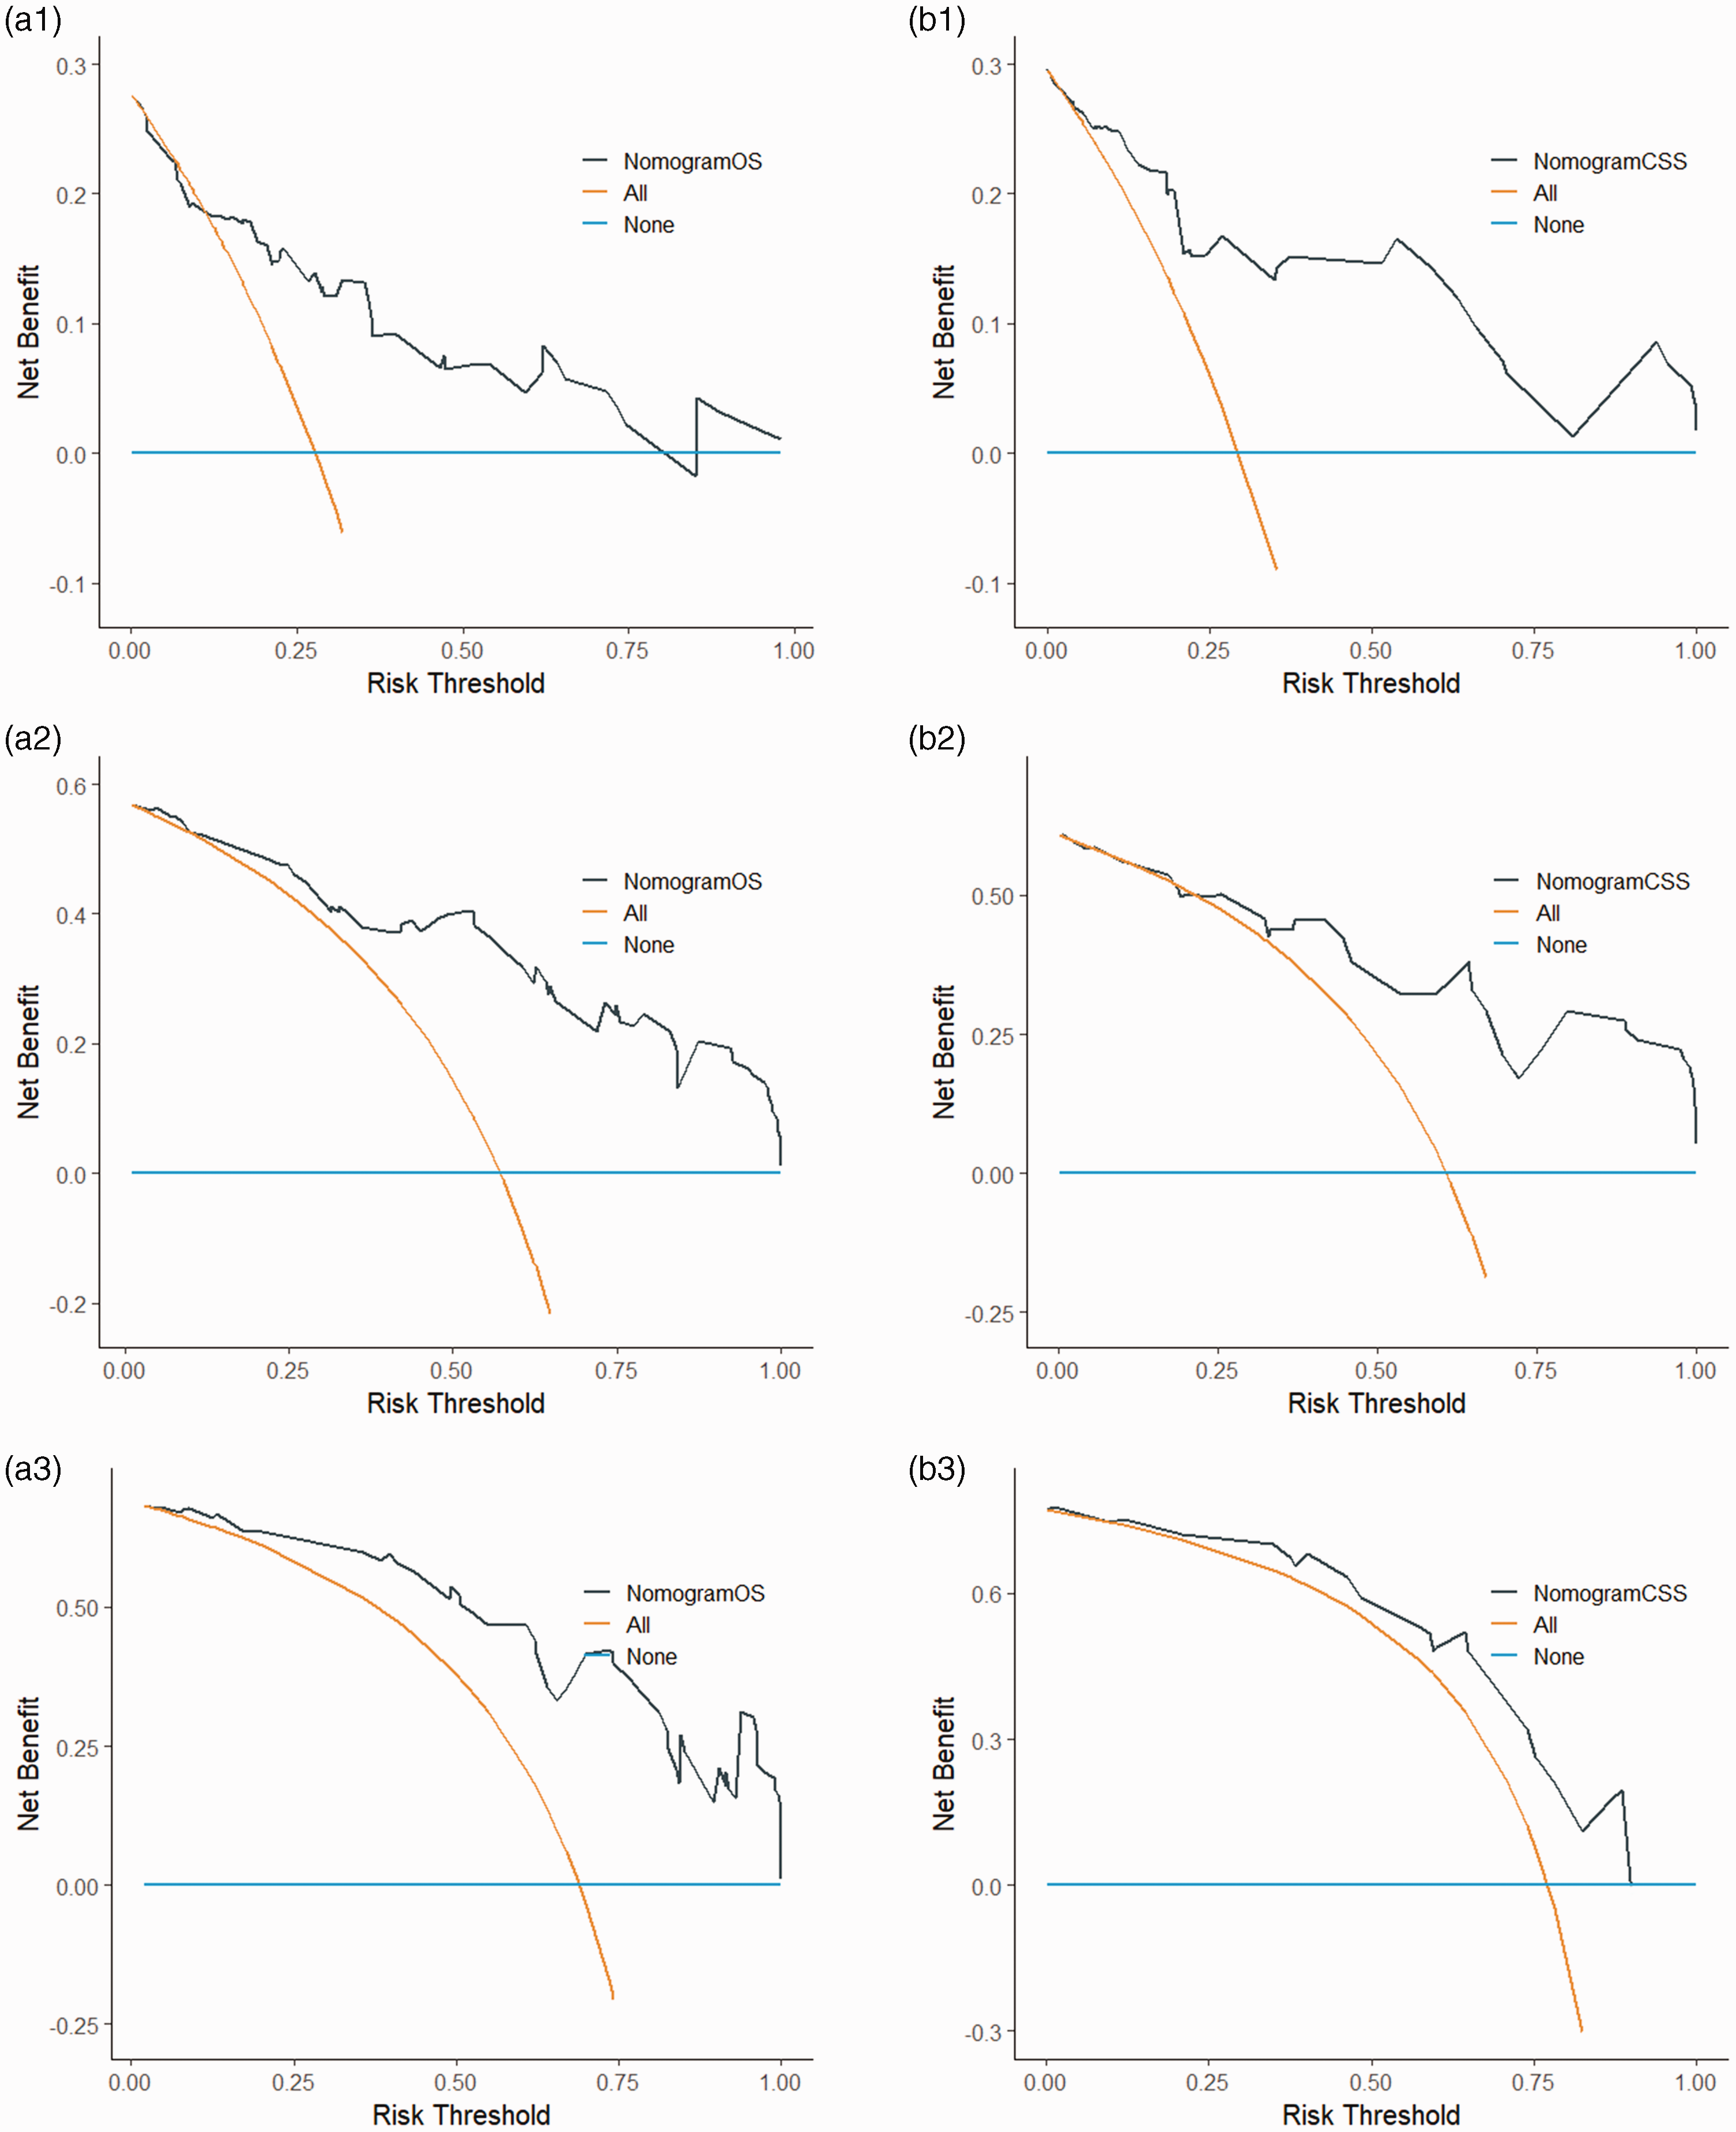
DCA is an assessment method used to evaluate the degree of patient benefit. The AUC only measures the diagnostic accuracy of the predictive model and fails to take into account the clinical utility of a particular model, which may lead to overmedication; this issue can be well addressed by DCA. 15 In this study, DCA curves were plotted based on 1-, 3-, and 5-year patient survival in the OS and CSS models, respectively. The results showed higher 1-, 3-, and 5-year net clinical benefit in both models established in this study (Figure 5).

1-, 3-, and 5-year DCA curves of OS when validating the nomogram model for the (a1, a2, a3) training set and (b1, b2, b3) validation set, respectively. 1-, 3-, and 5-year DCA curves of CSS when validating the nomogram model for the (c1, c2, c3) training set and (d1, d2, d3) validation set, respectively. DCA, decision curve analysis; OS, overall survival; CSS, cancer-specific survival; AJCC, American Joint Committee on Cancer; TNM, tumor-node-metastasis.
Comparison with AJCC staging system
We used the AJCC staging system with the SEER data to construct models for OSS and CSS; the C-indexes for the two models were calculated to be 0.699 and 0.668, respectively (Table 4). We plotted ROC curves for OS and CSS, with AUC values of 0.765, 0.793, and 0.800 for 1, 3, and 5 years of OS, and 0.784, 0.801, and 0.831 for 1, 3, and 5 years of CSS, respectively (Figure 3). We plotted DCA curves for OS and CSS, and the net clinical benefit rate was significantly lower for AJCC staging compared with our constructed model (Figure 4). Thus, our model could predict survival in older patients with LUAD more accurately than the AJCC staging system.
External validation
We collected data from older patients with LUAD in our center for external validation. The final validation results showed that the C-indexes of OS and CSS were 0.769 and 0.812, respectively (Table 4). The 1-, 3-, and 5-year AUC was 0.799, 0.871, and 0.891 for OS and 0.868, 0.846, and 0.781 for CSS, respectively (Figure 6). Calibration curves were validated for this model using external data, and the 1-year, 3-year, and 5-year survival calibration curves for OS and CSS were similar to the 45° reference line (Figure 7). Additionally, DCA curves were plotted using external data, and the final results showed higher net clinical benefit at 1, 3, and 5 years (Figure 8). Therefore, we demonstrated that our model could more accurately predict survival in older patients with LUAD through the validation of external data, which further proved the feasibility of the model in clinical application.

Receiver operating characteristic (ROC) curves for the external validation set. (a) Overall survival external validation set ROC curve and (b) cancer-specific survival external validation set ROC curve.

1-, 3-, and 5-year calibration curves for the external validation set (a1, a2, and a3) overall survival and (b1, b2, and b3) cancer-specific survival, respectively.
1-, 3-, and 5-year decision curve analysis (DCA) curves for the external validation set (a1, a2, and a3) overall survival (OS) and (b1, b2, and b3) cancer-specific survival (CSS), respectively.
Discussion
Patients with LUAD ≥60 years of age account for the highest proportion of patients with lung malignancies.2,3 However, few previous studies exist in this group of patients. Of 248 phase III clinical trials on non-small cell lung cancer from 1980 to 2010, one-third excluded patients >65 years of age. Therefore, data on older patients with LUAD are missing both in terms of treatment and prediction of survival. 16 We used SEER data with the aim to construct an accurate prognostic model for this group of patients, to better help patients and clinicians make appropriate treatment decisions. Sex, race and ethnicity, marital status, AJCC stage, surgery, radiotherapy, chemotherapy, and distant metastases (bone, brain, liver, and lung) were found to be significant prognostic factors for OS and CSS in this study. We used a Cox multifactorial regression model and constructed a nomogram using these prognostic factors.
It has been previously reported that men are more likely than women to have a higher mortality rate from pulmonary malignancies. In our study, men had an approximately 30% increased risk of disease progression and death compared with women. A cohort study in Sweden by Radkiewicz et al. 17 showed that among LUAD subtypes, male patients had a worse prognosis and shorter survival, which is the same finding as that in our study. An analysis of five phase III clinical trials investigating chemotherapy for non-small cell lung cancer found that with platinum-based chemotherapy regimens, female patients with LUAD achieved a higher overall response rate and had longer survival, and the prognosis of LUAD in female patients was better than that in their male counterparts; however, this sex difference was not reflected in squamous carcinoma. 18 Additionally, Behrens et al. 19 pointed out that the number of tumor-associated immune-infiltrating cells in female patients with LUAD was greater than that in male patients with LUAD and that such tumor-associated immune-infiltrating cells could bring about better treatment efficacy with immune checkpoint inhibitors. These two points may be why the prognosis of female patients with LUAD is better than that of male patients. The prognostic differences by sex can be further verified by grouping and comparing the variable of sex using the SEER database. Race and ethnicity is another important indicator of lung cancer prognosis, although some previous studies have concluded that there is no effect of race and ethnicity on the prognosis of lung cancer. However, the multivariate Cox proportional risk model has been used in most past studies, which ignores the existence of competing risks, thereby yielding unexpected results.20,21 Although the same multivariate Cox proportional risk model was used to construct the nomogram in our study, we found a difference in survival according to race and ethnicity, which differs from the above studies.
Differences in marital status among demographic indicators also affect the prognosis of patients with LUAD, and many previous studies have been conducted in this regard. A study by Zhao et al. 22 using the SEER database showed that single and unmarried patients may have worse prognosis compared with married individuals. Those authors obtained the same results after correcting for baseline information using propensity score matching. Another study examining the effect of marital status on survival in patients with lung cancer also used the SEER database and found that married patients have higher CSS rates. 23 The two above studies reported results similar to ours. We speculate that the main reason for this is that married patients may receive more support and care from family members who help them have a more optimistic mindset, which may affect the immune microenvironment, possibly leading to a reduced mortality rate in these patients.24,25
In our modeling, we also incorporated some common clinical factors that affect prognosis, including AJCC staging, surgery, radiotherapy, chemotherapy, and distant metastasis. AJCC staging has been revised many times to more accurately predict the prognosis of lung malignancies. 26 However, this staging system is imperfect, and advances in genetic testing and molecularly targeted drug therapy for LUAD in recent years have led to a better prognosis for LUAD than for other types of tumor, which is not taken into account in the AJCC staging system. In addition, the same AJCC stage of lung malignant tumor may result in a different prognosis owing to different pathologic types.27,28 For this reason, we developed this prognostic prediction model. However, we incorporated the AJCC staging system into our model because it has good prognostic predictive power in the same type of pathology. The second type of independent influencing factor included in our model that affects the prognosis of LUAD in older patients is treatment-related factors. Current treatments for LUAD include surgery, chemotherapy, radiotherapy, targeted therapy, and immunotherapy; however, only data for surgery, chemotherapy, and radiotherapy are available in the SEER database. Surgery clearly improves the prognosis of patients with LUAD; however, the risk of surgery is significantly increased in older patients. For this reason, many clinicians avoid surgical operations in this group of patients. But with improvement in surgical and anesthesia techniques, the mortality rate owing to surgery has been reduced to an acceptable range, such that surgery can also improve prognosis in older patients with LUAD. 29 A retrospective study on the benefit of surgery for lung cancer in older patients 30 showed that surgery can be equally beneficial in older patients and that differences in staging may lead to a different prognosis in older patients. This also applies in middle-aged patients with lung cancer and is not unique to older patients. In middle- or late-stage LUAD, only chemotherapy and radiotherapy can be used to prolong survival in patients who have received previous treatments. Many clinical trials have shown that platinum-based chemotherapy regimens are more effective in prolonging patient survival relative to supportive care. With the development of third-generation chemotherapeutic agents, such as paclitaxel and gemcitabine, many patients can still benefit from chemotherapy in second- and third-line treatments. 31 Radiotherapy plays an important role in both radical and palliative treatment of non-small cell lung cancer and can be used in postoperative adjuvant therapy and palliative treatment of advanced metastases, all of which can prolong patients’ OS. 32 This evidence is also consistent with our model; however, this is a shortcoming in our model given that non-small cell lung cancer has now entered the era of immunotherapy and targeted therapies and has even reached the stage of removing chemotherapy from the first line of treatment in intermediate to advanced LUAD, which is missing from the SEER data.
Data related to distant metastasis of LUAD were included in our model. Patients with metastatic LUAD have a worse prognosis compared with patients who do not have metastasis. 33 In an observational study conducted in Sweden including 17,431 patients who died of lung cancer, the data showed that brain metastasis (47%), bone metastasis (39%), liver metastasis (35%), and respiratory metastasis (22%) were common sites of metastasis in pulmonary malignancies. In that study, the median survival after diagnosis of non-metastatic lung cancer was 13 months, compared with 5 months for metastatic lung cancer and only 3 months for patients with hepatic metastases. 34 In our study, although the baseline information showed a low percentage of patients with metastases, distant metastases were found to be an independent influencing factor in the prognosis of older patients with LUAD after screening via Cox regression modeling, which is in line with the above retrospective study.
We used SEER data to construct a prediction model that was more consistent with the prognosis of older patients with LUAD. Through comparison, we found that our model was superior to AJCC staging, and this predictive model could provide more accurate prediction of survival in older patients with LUAD. We performed external validation using data on older patients with LUAD from our center, which also yielded superior results, further confirming the accuracy of the present model. Currently, there are few studies among older patients with LUAD, and many guidelines are formulated based on LUAD guidelines. However, older patients are a special group, and existing LUAD guidelines are not completely applicable to this group of patients. Therefore, guideline formulation for older patients with LUAD is important, and the establishment of this prediction model can provide a certain reference in formulating guidelines for older patients with LUAD. Despite this, the present model has some shortcomings. First, we excluded some patients in the SEER database with missing data, which may lead to biased results. Second, some factors that may be associated with the prognosis of LUAD in older patients are missing from our prediction model, such as family history, tumor markers, mutation status of the driver genes, and information on immunotherapy and targeted therapies. We were unable to incorporate these data because they were not recorded in the SEER database. Finally, because the SEER database contained no specific information on treatment modalities such as the mode of surgery, chemotherapy regimen, cycle of chemotherapy, and dose of radiotherapy, we could not analyze certain factors influencing the prognosis of LUAD in older patients. Therefore, data from multiple research centers in needed for more in-depth investigation.
Conclusions
We conducted a population-based study using the SEER database to predict OS and CSS in older patients with LUAD by creating a nomogram. We demonstrated the accuracy and utility of this nomogram through multiple validation methods. The present nomogram may more accurately predict survival in older patients with LUAD.
Footnotes
Acknowledgements
We thank all colleagues who have helped with this manuscript. We also thank the anonymous reviewers and the editor for their valuable comments.
Authors’ contributions
Feiyang Li and Fang Li: collection of materials and manuscript writing. Dong Zhao: manuscript supervision. All authors contributed to the article and read approved the submitted version. Haowei Lu: collection of data from the center and helping with external verification.
Declaration of conflicting interest
The authors declare that there is no conflict of interest.
Funding
No specific funding sources were used for this work.