
Abstract
Objective
We aimed to develop a nomogram to predict the risk of severe influenza in previously healthy children.
Methods
In this retrospective cohort study, we reviewed the clinical data of 1135 previously healthy children infected with influenza who were hospitalized in the Children's Hospital of Soochow University between 1 January 2017 and 30 June 2021. Children were randomly assigned in a 7:3 ratio to a training or validation cohort. In the training cohort, univariate and multivariate logistic regression analyses were used to identify risk factors, and a nomogram was established. The validation cohort was used to evaluate the predictive ability of the model.
Result
Wheezing rales, neutrophils, procalcitonin > 0.25 ng/mL, Mycoplasma pneumoniae infection, fever, and albumin were selected as predictors. The areas under the curve were 0.725 (95% CI: 0.686–0.765) and 0.721 (95% CI: 0.659–0.784) for the training and validation cohorts, respectively. The calibration curve showed that the nomogram was well calibrated.
Conclusion
The nomogram may predict the risk of severe influenza in previously healthy children.
Introduction
All populations are susceptible to infection with influenza viruses. Seasonal influenza epidemics occur worldwide every year and can lead to millions of cases of severe illness. Children are a high-risk group for influenza. A 2018 meta-analysis showed that approximately 109.5 million children aged <5 years were infected with influenza and approximately 870,000 children were hospitalized with influenza-related acute lower respiratory tract infection. Moreover, up to 34,800 children aged <5 years died from influenza-related acute lower respiratory tract infection, accounting for 4% of all deaths from acute lower respiratory tract infection in this age group. 1 The high incidence of influenza among children aged <5 years in China is a considerable burden. 2 Children <5 years of age or those with underlying medical conditions are also at increased risk for influenza-related extrapulmonary complications such as acute renal failure, myocarditis/myositis, rhabdomyolysis, and encephalitis/encephalopathy.3–5 The American Academy of Pediatrics states that individuals with underlying medical conditions including asthma, cardiovascular disease (except hypertension), and renal, hematologic, metabolic, and neurologic diseases (including moderate to severe developmental delay) may have a higher risk of contracting critical influenza illness. 6 However, most children with influenza infection were previously healthy. Few studies have been conducted on the risk factors for severe influenza in previously healthy children.
In this study, to determine risk factors for severe influenza in previously healthy children, we collected and summarized the clinical data of influenza-infected children who were previously healthy and were hospitalized at the Children's Hospital of Soochow University. We developed a predictive model of severe influenza in previously healthy children to help clinicians identify severe influenza early, reduce the incidence of severe influenza, and improve outcomes for pediatric patients.
Methods
This was a retrospective cohort study. This study was approved by the Ethics Committee of the Children’s Hospital of Soochow University (Suzhou, China; approval no. 2021CS128) in accordance with the Declaration of Helsinki. The requirement for informed consent was waived by the Ethics Committee of the Children’s Hospital of Soochow University because of the retrospective nature of the study. Details of all patients were removed. The reporting of this study conforms to STROBE guidelines. 7
Patients and definitions
Patients
We collected data on children who were influenza-infected, previously healthy, and hospitalized at the Children's Hospital of Soochow University between 1 January 2017 and 30 June 2021. All personal patient details were deleted.
Definitions
Influenza diagnosis was based on the positive result of an influenza virus nucleic acid test or an influenza virus rapid antigen test.
Previously healthy children were defined as children without one or more (but not limited to) the following underlying medical conditions: autoimmune disease; use of immunosuppressants, connective tissue disease; tumors; hematological, renal, or cardiovascular diseases (except hypertension); endocrine and metabolic disease; neurologic disease (including moderate to severe developmental delay); bronchial foreign body; congenital bronchopulmonary dysplasia; bronchomalacia; asthma; and tuberculosis.
Influenza infections within our study population were divided into three types of illness: mild, severe, and critical. Children with mild influenza illness were defined as the non-severe group, and those with severe and critical illness were defined as the severe group.
Severe influenza illness was confirmed with one or more of the following presentations:
(1) dyspnea and/or increased respiratory rate: children aged >5 years (>30 breaths/minute), children aged 1 to 5 years (>40 breaths/minute), infants aged 2 to 12 months (>50 breaths/minute), and neonates to 2-month-old infants (>60 breaths/minute); (2) changes in consciousness: unresponsiveness, lethargy, restlessness, and convulsions; (3) severe vomiting, severe diarrhea, or severe dehydration; (4) oliguria: urine volume in children <0.8 mL/kg/hour (i.e., for children aged over 14 years <17 mL/hour, infants <200 mL/24 hours, preschool children <300 mL/24 hours, and school-aged children 400 mL/24 hours) or acute renal failure; (5) pneumonia confirmed by X-ray or computed tomography; (6) the original underlying medical condition is seriously aggravated.
8
Critical influenza illness was confirmed with one or more of the following presentations: (1) respiratory failure, (2) acute necrotizing encephalopathy, (3) septic shock, (4) multiple organ insufficiency, and (5) other serious clinical conditions requiring admission to the intensive care unit. 8
Clinical data collection
Clinical data included demographic data (age, sex, and underlying medical condition), clinical presentation and complications (fever, highest temperature, fever duration, hyperpyrexia ≥39.1°C, cough, wheezing, gastrointestinal symptoms, convulsions/disturbances of consciousness, headaches, sore throat, rash, myalgia/fatigue, hoarseness, tachypnea, three-concave sign, dyspnea, wet rales, wheezing rales, and pneumonia), laboratory findings (white blood cell count, neutrophils, hemoglobin, platelets, C-reactive protein, erythrocyte sedimentation rate, procalcitonin, serum sodium, serum potassium, lactic acid, albumin, prealbumin, alanine aminotransferase, aspartate aminotransferase, creatine kinase isoenzyme, creatine kinase, lactate dehydrogenase, serum creatinine, blood urea nitrogen, lymphocyte subsets, and immunoglobulins A, G, and M), and radiologic findings.
Etiological detection
We collected nasopharyngeal secretions within 24 hours of admission from all children. Because of their medical conditions, some children were treated with electronic bronchoscopy after obtaining their parents' consent; samples of bronchoalveolar lavage fluid were collected at the same time. All samples were subjected to the following: antigen detection for adenovirus, respiratory syncytial virus, and influenza A and B viruses; nucleic acid amplification testing for influenza A and B viruses, human bocavirus, Mycoplasma pneumoniae, cytomegalovirus, human metapneumovirus, human rhinovirus; and bacterial culture identification (including Streptococcus pneumoniae and Haemophilus influenzae).
Statistical analysis
In this study, model establishment and all statistical analyses were performed using IBM SPSS 26.0 (IBM Corp., Armonk, NY, USA) and R version 4.1.2 (http://www.R-project.org). Categorical data were expressed as frequency (percentage) and normally distributed continuous measurement data were expressed as mean ± standard deviation. Non-normally distributed continuous measurement data were expressed as median (interquartile range). The chi-square test or Fisher's exact test was used for categorical data. For comparisons of normally distributed continuous variables, t-tests, one-way analysis of variance, and Welsh’s analysis of variance were used. Additionally, for non-normally distributed continuous variables, the Mann–Whitney U test, the Kruskal–Wallis H test, and the Bonferroni post hoc test were applied. Only a two-tailed P value of <0.05 was considered statistically significant.
The study population was randomly assigned in a 7:3 ratio to the training cohort or the validation cohort. The training and validation cohorts were used to derive and validate the model, respectively.
In the training cohort, univariate analysis was applied to investigate the risk factors for severe influenza among previously healthy children, whereas independent risk factors and a regression equation prediction model were obtained using multivariate logistic regression (with a 0.05 probability of inclusion and a 0.10 probability of exclusion). The logistic regression prediction model was visualized as a nomogram using the rms package in R.
In the validation cohort, the area under the receiver operating characteristic curve (AUC) was used to quantify the model’s prediction ability, and the calibration curve was applied to evaluate accuracy and discriminativeness.
Results
Patient characteristics
The study included a total of 1135 children, among which 803 had mild influenza illness, 281 had severe illness, and 51 had critical illness. Three children with critical illness died from influenza-associated encephalopathy. Pediatric patients were randomized into training (777 patients) and validation (358 patients) cohorts. The general characteristics and clinical data of the children with influenza in training and validation cohorts are shown in Table 1. The P values suggested that variables were not statistically different between training and validation cohorts, signifying that the partition of data across the training and validation cohorts was balanced.
Variables of the children with influenza.

t, test; Z, Mann–Whitney U test; χ2 ,Chi-square test; *, Fisher’s exact test, SPSS26.0 did not display statistics.
WBC, white blood cells; N, neutrophils; Hb, hemoglobin; Plt, platelets; CRP, C-reactive protein; ESR, erythrocyte sedimentation rate; PCT, procalcitonin; Na+, serum sodium; K+, serum potassium; Lac, lactic acid; ALT, alanine aminotransferase; AST, aspartate aminotransferase; CKMB, creatine kinase isoenzyme; CK, creatine kinase; LDH, lactate dehydrogenase; Cr, serum creatinine; BUN, blood urea nitrogen; IgA, immunoglobulin A; IgM, immunoglobulin M; IgG, immunoglobulin G; ADV, adenovirus; RSV, respiratory syncytial virus; IV-A, influenza A virus; IV-B, influenza B virus; HBoV, human bocavirus; MP, Mycoplasma pneumoniae; CMV, cytomegalovirus; HMPV, human metapneumovirus; HRV, human rhinovirus; SP, Streptococcus pneumoniae; HI, Haemophilus influenzae.
Risk factors for severe influenza
Univariate analysis
General information and clinical features
No significant differences were observed by sex and average age across the three types of illness (P > 0.05; Table 2).
Comparison of general patient information and clinical features.

F*, one-way analysis of variance; W, Welsh’s analysis of variance; F, Fisher's exact test; H, nonparametric Kruskal–Wallis H test; χ2, Chi-square test. Different combinations of a, b, and c represent statistically significant differences across illness types.
As shown in Table 2, significant differences were observed across the types of illness in fever, highest temperature, wheezing, gastrointestinal symptoms, convulsions/disturbances of consciousness, headache, rash, hoarseness, tachypnea, three-concave sign, dyspnea, wet rales, wheezing rales, and pneumonia (P < 0.05).
Laboratory and radiologic findings
Significant differences were observed across the three illness types in white blood cell counts, neutrophils, hemoglobin, platelets, C-reactive protein, procalcitonin >0.25 ng/mL, serum sodium, lactic acid, albumin, alanine aminotransferase, creatine kinase isoenzyme, creatine kinase, serum creatinine, CD3−/CD16+% and immunoglobulin M (P < 0.05). Table 3 illustrates that the more severe the disease, the higher the levels of neutrophils, C-reactive protein, alanine aminotransferase, and serum creatinine, and the lower the levels of hemoglobin, serum sodium, lactic acid, albumin, and immunoglobulin M.
Comparison of laboratory and radiologic findings.

F*, one-way analysis of variance; W, Welsh’s analysis of variance; F, Fisher's exact test; H, nonparametric Kruskal–Wallis H test. Different combinations of a, b, and c represent statistically significant differences across illness types. WBC, white blood cells; N, neutrophils; Hb, hemoglobin; Plt, platelets; CRP, C-reactive protein; ESR, erythrocyte sedimentation rate; PCT, procalcitonin; Na+, serum sodium; K+, serum potassium; Lac, lactic acid; ALT, alanine aminotransferase; AST, aspartate aminotransferase; CKMB, creatine kinase isoenzyme; CK, creatine kinase; LDH, lactate dehydrogenase; Cr, serum creatinine; BUN, blood urea nitrogen; IgA, immunoglobulin A; IgM, immunoglobulin M; IgG, immunoglobulin G.
As for radiological findings, all cases of hydrothorax and consolidation visible on X-ray or computed tomography scans occurred in the severe and critical illness groups. The consolidation rate was higher in the severe (40.0%) than in critical illness group, whereas the proportion of hydrothorax was higher in the critical (8.8%; P < 0.05) than in the severe illness group (Table 3).
Etiological findings
No significant differences (P > 0.05) were observed in the rates of infection with the respiratory syncytial virus, influenza A and B viruses, human bocavirus, cytomegalovirus, human metapneumovirus, human rhinovirus, Streptococcus pneumoniae, and Haemophilus influenzae across the three illness types groups, whereas infection rates for Mycoplasma pneumoniae and adenovirus were significantly different across the groups (P < 0.05; Table 4).
Etiological findings.

F, Fisher's exact test; χ2, Chi-square test. Different combinations of a, b, and c represent statistically significant differences across illness types. ADV, adenovirus; RSV, respiratory syncytial virus; IV-A, influenza A virus; IV-B, influenza B virus; HBoV, human bocavirus; MP, Mycoplasma pneumoniae; CMV, cytomegalovirus; HMPV, human metapneumovirus; HRV, human rhinovirus; SP, Streptococcus pneumoniae; HI, Haemophilus influenzae.
Multivariate analysis
We divided the training cohort into non-severe (mild illness) and severe (severe illness and critical illness) groups. Taking whether the patient was included in the severe group as the response variable, we performed a logistic regression analysis on variables with statistical significance in the above univariate analysis. The results showed that wheezing rales (odds ratio [OR]: 2.959, 95% confidence interval [CI]: 1.977–4.428), neutrophils (OR: 1.024, 95% CI: 1.015–1.033), procalcitonin >0.25 ng/mL (OR: 2.338, 95% CI:1.462–3.739), and Mycoplasma pneumoniae (OR: 4.351, 95% CI: 2.695–7.026) were independent risk factors for severe influenza in previously healthy children; fever (OR: 0.440, 95% CI: 0.229–0.843) and albumin (OR: 0.929, 95% CI: 0.876–0.985) were protective factors (Table 5).
Risk factors for severe influenza in previously healthy children.

Because hydrothorax and consolidation were the diagnostic criteria for pneumonia, and tachypnea, three-concave signs, and dyspnea were the diagnostic criteria for severe influenza, these were not included in logistic regression. B, regression coefficient; SE, standard error; OR, odds ratio; CI, confidence interval; N, neutrophils; PCT, procalcitonin; MP, Mycoplasma pneumoniae.
Development of a predictive model for severe influenza
Logistic regression model
We established a logistic regression model as follows: logistic (P) = eX/(1 + eX), X = 1.216–0.882 fever (no = 0, yes = 1) + 1.085 wheezing rales (no = 0, yes = 1) + 0.024 neutrophils (%) + 0.849 PCT > 0.25 ng/mL (no = 0, yes = 1)− 0.074 albumin (g/L) + 1.470 Mycoplasma pneumoniae infection (no = 0, yes = 1).
Nomogram for severe influenza
We visualized the logistic regression prediction model as a nomogram (Figure 1). Each factor in the nomogram had a scoring scale, with a high total score indicating a great risk of severe influenza. The application method of the nomogram was as follows. First, based on the level of severe influenza risk items, we found the point on the corresponding axis in the nomogram and drew a straight line perpendicular to the score axis, with the point as the origin. The point of intersection was the corresponding score for this item. Then, we added the scores for each predictor to obtain the total score. Finally, based on the total score on the risk probability axis, we obtained the current risk probability of severe influenza in a previously healthy child.
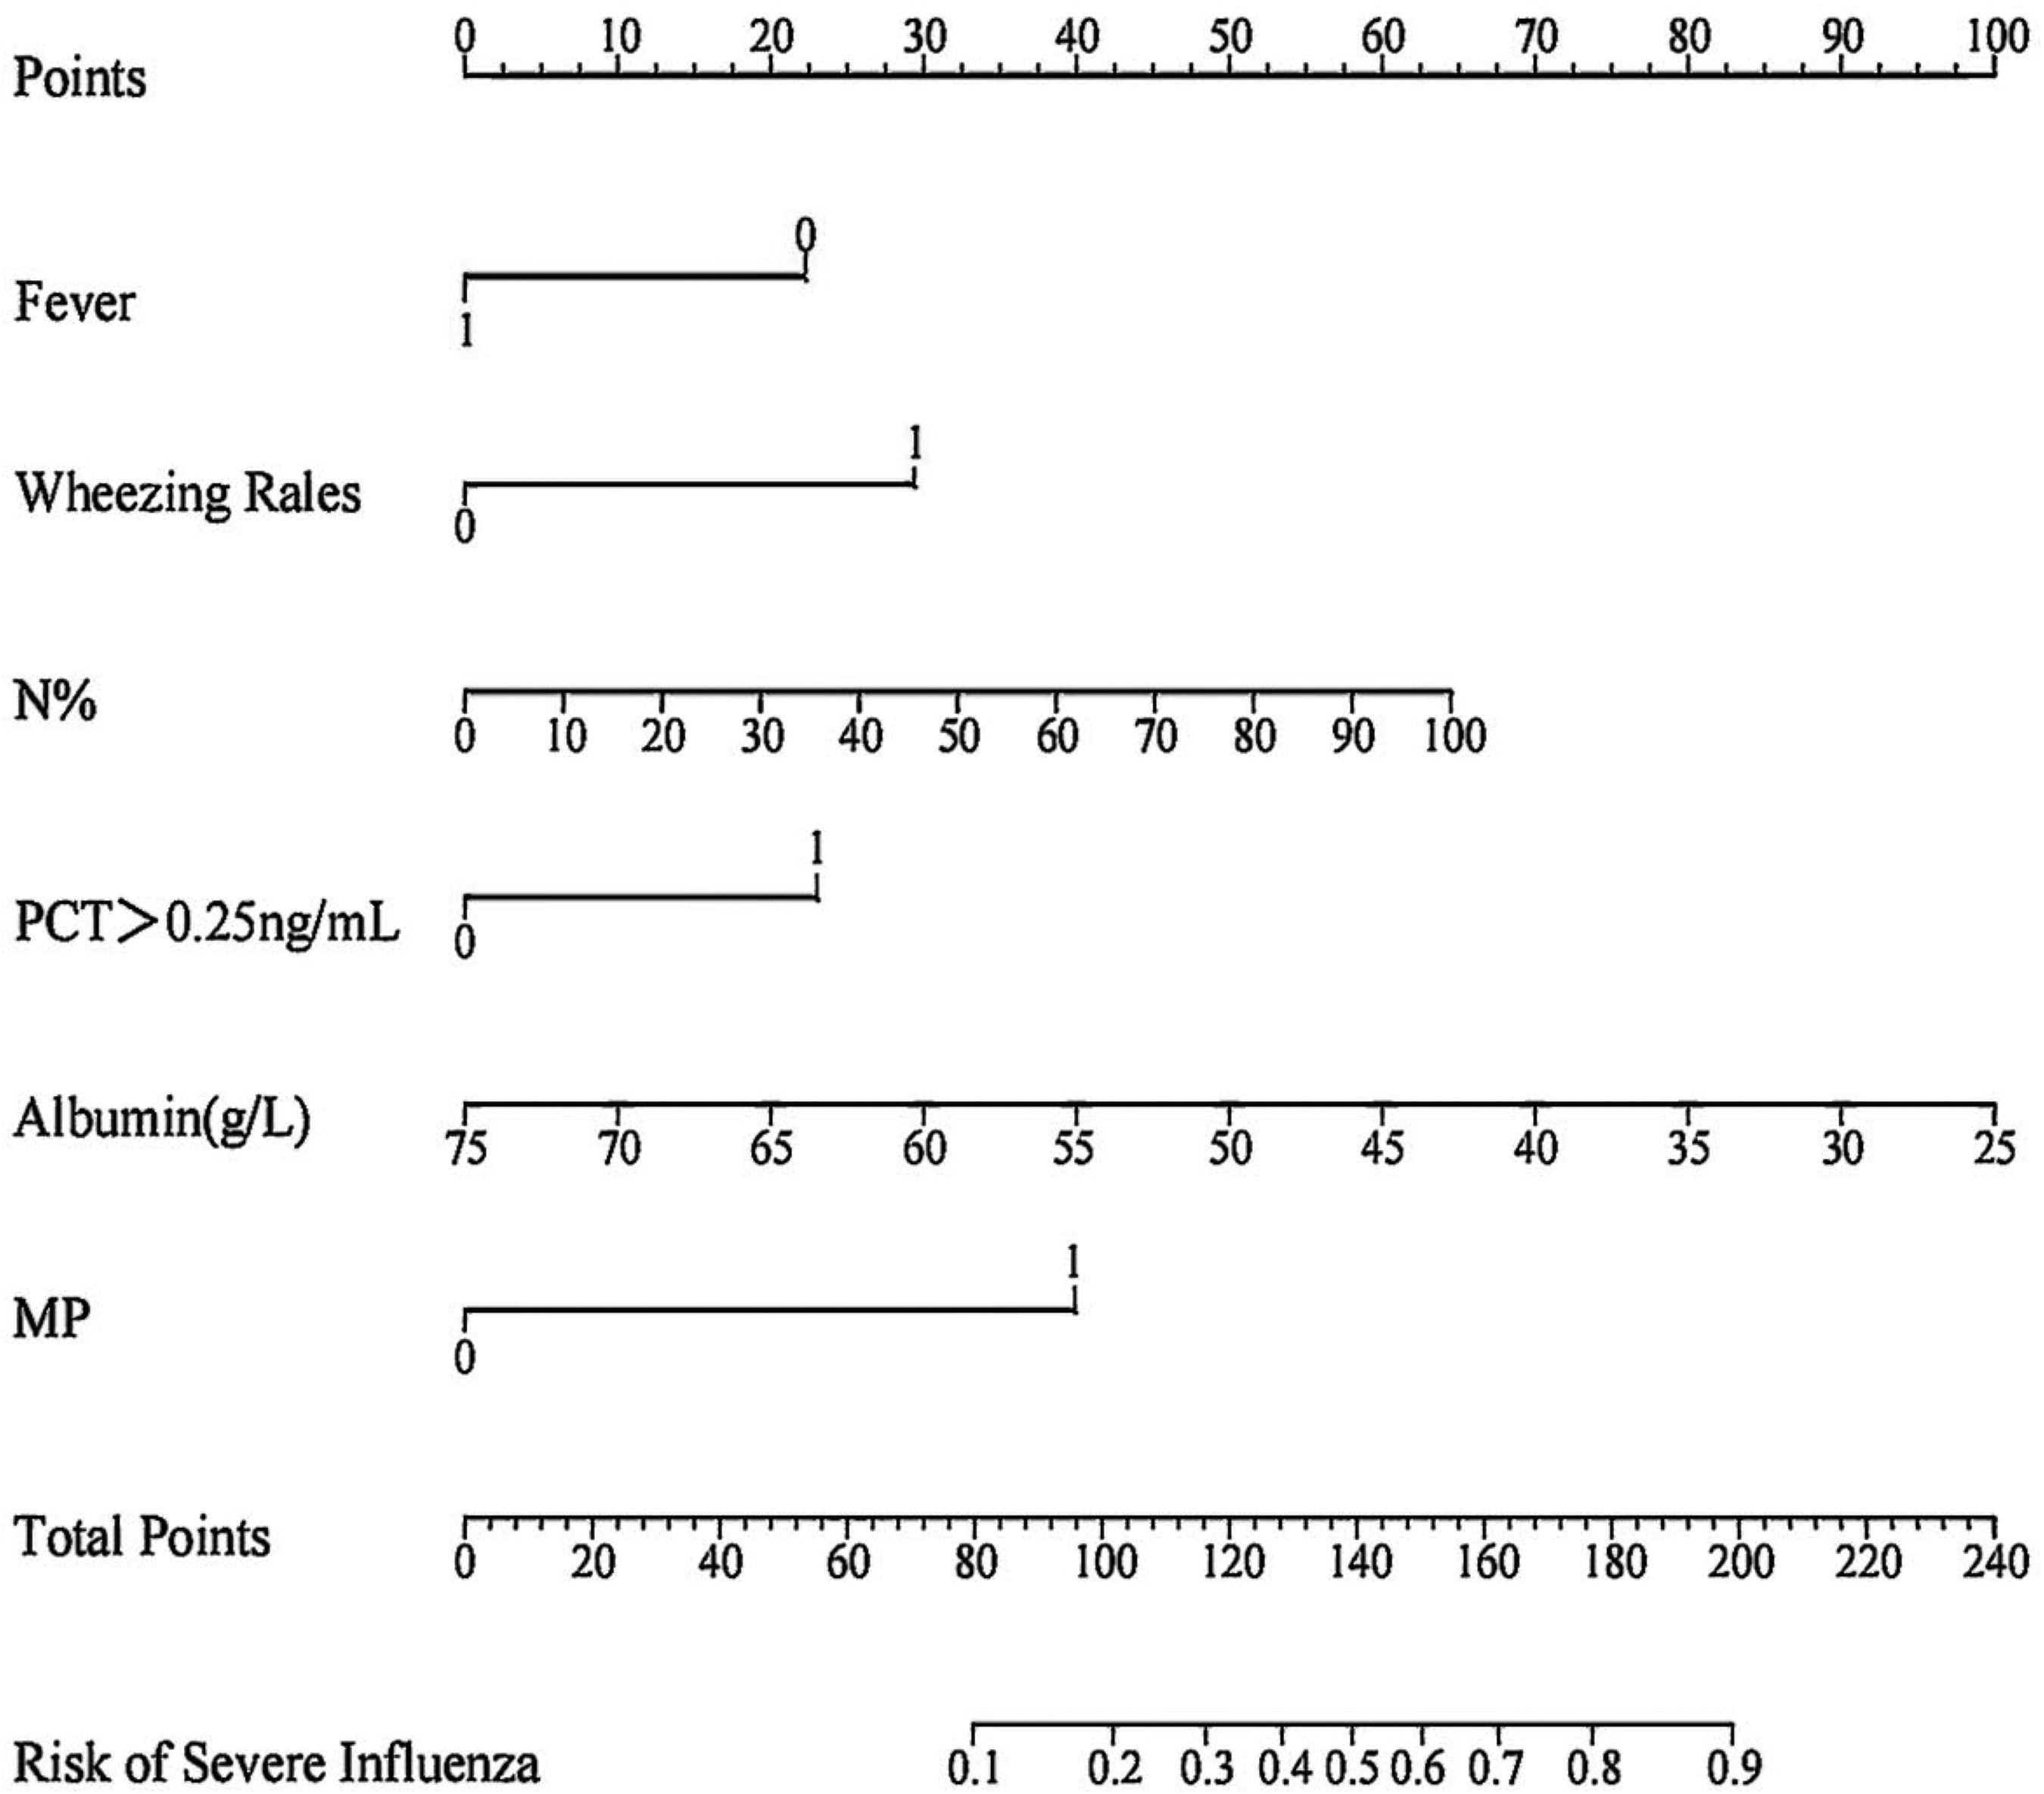
Nomogram for predicting severe influenza risk in previously healthy children. On the axes of wheezing rales, PCT > 0.25 ng/mL, MP 0 means the predicted one does not have the factor, and 1 means the one has the factor.
Validation of a prediction model for severe influenza
Performance of nomogram in the training cohort
The receiver operating characteristic curve showed that the AUC of the predicted probability was 0.725 (95% CI: 0.686–0.765), the sensitivity of the prediction model was 0.651, and the specificity was 0.690 (Table 6, Figure 2a).
Comparison of ROC curve performance.

The cut-off value was calculated according to the Youden index maximization.
Youden index = sensitivity + specificity − 1. ROC, receiver operating characteristic; AUC, area under the receiver operating characteristic curve; N, neutrophils, CI, confidence interval.

Receiver operator characteristic curve and a calibration curve of the nomogram prediction in the training cohort. (a) The area under the receiver operating characteristic curve was 0.725 (95% confidence interval: 0.686–0.765), with a sensitivity of 0.651 and a specificity of 0.690 and (b) The x-axis represents the estimated probability and the y-axis represents the actual probability of severe influenza. The solid line represents the performance of the nomogram, with a closer fit to the diagonal dotted line representing a better prediction.
After 1000 bootstrap resamples, the calibration curve showed that the predicted probability was consistent with the actual probability and was close to the ideal state (Figure 2b).
Performance of nomogram in the validation cohort
In the validation cohort, the AUC was 0.721 (95% CI: 0.659–0.784) and the sensitivity and specificity were 0.631 and 0.737, respectively (Figure 3a). The calibration curves showed good agreement between predicted and actual probabilities in the validation cohort (Figure 3b).

Receiver operator characteristic curve and calibration curve of the nomogram prediction in the training set. (a) The area under the receiver operating characteristic curve was 0.721 (95% confidence interval: 0.659–0.784), with a sensitivity of 0.631 and a specificity of 0.737 and (b) The x-axis represents the estimated probability and the y-axis represents the actual probability of severe influenza. The predicted probability was consistent with the actual probability and was close to the ideal state.
Discussion
In our study, we found that independent risk factors for severe influenza were wheezing rales, neutrophils, procalcitonin > 0.25 ng/mL, and Mycoplasma pneumoniae infection, whereas fever and albumin were protective factors. We established and verified a nomogram for severe influenza based on the factors. The sensitivity of the prediction model was 0.651 and the specificity was 0.690. The calibration curves in the training and validation cohorts showed that the predicted probability was consistent with the actual predicted probability and was close to the reference line. Results showed that the nomogram had strong predictive ability.
The main symptoms of influenza in our study population were fever and cough, followed by wheezing and gastrointestinal symptoms; a small number of children had headaches, sore throat, myalgia/fatigue, rash, and other symptoms. The 2020 Chinese version of the childhood influenza expert consensus 8 indicated that children with influenza are more likely to have a fever—especially hyperpyrexia—and often have symptoms of cough, sore throat, runny/stuffy nose, vomiting, and diarrhea, occasionally with additional symptoms including headache, myalgia, and fatigue. The difference in symptomology may be attributable to the fact that most children in this study were young and had a poor ability to express pain or discomfort. Additionally, severe influenza is more common in children under 5 years of age. 8 Moreover, Rao observed that children with severe influenza were younger and had a higher rate of influenza A virus infection compared with those who had mild influenza. 9
We observed that in the critical illness group, the rates of tachypnea (17.6%), three-concave sign (15.7%), dyspnea (35.3%), and hydrothorax (7.8%) were significantly higher than in the severe illness group, whereas the proportions of wet rales (17.6%), wheezing rales (21.6%), pneumonia (60.8%), and consolidation (25.5%) were lower than in the severe illness group. Shi et al. reported that 46.2% of patients with influenza who died had acute respiratory distress syndrome and 38.5% had pneumonia, 10 indicating that flu-related pulmonary complications may cause serious consequences. Song et al. concluded that influenza may cause severe neurological complications in previously healthy children. 11 Moreover, the influenza A virus can cause isolated or predominantly neurologic manifestations that can lead to poor outcomes. 12 In a study of 100 pediatric patients with febrile seizures (FS), Esen et al. observed that the influenza A virus was detectable in 16% of patients with simple FS and 30% of patients with complex FS. 13 Nevertheless, because convulsions/disturbances of consciousness were the diagnostic criteria for severe influenza in our study, these symptoms were not included in the logistic regression. Notably, 52.9% (13/34) of the critically ill patients in our training cohort had convulsions/disorders of consciousness—significantly higher than that of children with severe influenza illness (11.8%)—and the three children in this study who died had influenza-related encephalopathy. Furthermore, the rate of convulsions/disturbances of consciousness was significantly different between the severe illness (11.4%) and critical illness (51.0%) groups, signifying that this symptom might be a risk factor for critical illness (P < 0.01). In radiologic findings, compared with that in the severe illness group, the proportion of patients in the training cohort with hydrothorax (8.8%) was significantly higher in the critical illness group whereas the proportion with consolidation (23.5%) was significantly lower. Ma et al. observed that shadows or pleural effusions on radiographs were associated with severe influenza infection (P = 0.02). 14 Similarly, we found that fever was a protective factor for severe influenza. This may be because children are more likely to receive early treatment when fever attracts the attention of parents.
A study of 36,047 patients in Shanghai reported 15 that levels of hemoglobin, C-reactive protein, alanine aminotransferase, aspartate aminotransferase, serum creatinine, blood urea nitrogen, and lactic acid in those with severe influenza were significantly higher than levels in patients without severe influenza. Moreover, decreased hemoglobin and increased alanine aminotransferase, blood urea nitrogen, and lactic acid levels were risk factors for death in children with influenza. In our study, the mean/median values of neutrophils, C-reactive protein, alanine aminotransferase, and serum creatinine increased with disease severity, whereas the mean/median of hemoglobin, serum sodium, lactic acid, albumin, and immunoglobulin M showed the opposite trend. Among these laboratory findings, risk factors for severe influenza were neutrophils and procalcitonin >0.25 ng/mL, whereas albumin was a protective factor.
One study concluded that the aggravation of influenza may be related to an inflammatory factor storm. 16 However, in our study, all of the immunological indicators were not independent risk factors for severe influenza. Among them, immunoglobulin M decreased with disease severity. This might be related to the complicated immune response in severe influenza. Furthermore, this study only collected known clinical data on cellular and humoral immunity and many immune factors were not included; therefore, our findings are only partially informative.
In terms of etiology, only Mycoplasma pneumoniae was an independent risk factor for severe influenza in our study. In children under 5 years of age, Mycoplasma pneumoniae coinfection with influenza B virus was common and was an important cause of community-acquired pneumonia, which itself could lead to severe disease.17,18 Hypoxemia, acute lung injury, and multiorgan involvement are also reported to occur in Mycoplasma pneumoniae-associated pneumonia. 19 Although respiratory syncytial virus, human bocavirus, cytomegalovirus, human metapneumovirus, and human rhinovirus were not independent risk factors, the infection rates of respiratory syncytial virus (5.9%), human bocavirus (8.8%), and adenovirus (2.9%) were significantly higher in the critical illness group than in those in the other two groups. In addition, children with critical illness were more likely to be coinfected with respiratory syncytial virus and human bocavirus. Edyta et al. 20 further observed a high incidence of respiratory syncytial virus infection combined with influenza virus infection; patients with coinfection had more severe disease and were at high risk for complications, especially when the influenza A virus was involved. Furthermore, severe influenza-associated pneumonia is often complicated with bacterial infection and is associated with a high mortality rate. 21 The most common bacterial coinfection with influenza A virus is Streptococcus pneumoniae infection; 22 this may be because the influenza A virus promotes the attachment of Streptococcus pneumoniae to alveolar epithelial cells, resulting in severe post-influenza bacterial pneumonia. 23 However, no statistically significant differences were observed between Streptococcus pneumoniae and Haemophilus influenzae and the proportions of Streptococcus pneumoniae and Haemophilus influenzae in the critical illness group were lower than those in the other two types. This may be because Streptococcus pneumoniae and Haemophilus influenzae were the only bacterial pathogens studied.
The study had some limitations. Because of the single-center design of the current study, we could not avoid potential selection bias. Second, the fact that data for both the training and validation cohorts were from retrospective studies may have led to additional bias. Therefore, further studies based on another independent prospective cohort are required. When applying the model in practice, the issue of overfitting requires vigilance. We will seek multi-center collaboration in follow-up studies to further examine the performance of the model.
Conclusion
In this study, we investigated risk factors for severe influenza among previously healthy children using univariate analysis and obtained predictive factors using multivariate logistic regression. On this basis, we established a novel nomogram prediction model. The model has good discrimination and validity and can help clinicians identify the risk of severe influenza in previously healthy children and provide early treatment.
Footnotes
Acknowledgement
We thank all participants for their contributions to this study.
Author contributions
WYH: Conceptualization, Methodology, Investigation, Data curation, Formal analysis, Software, Visualization, Writing-original draft.
WSN: Conceptualization, Methodology, Validation, Supervision
HMC: Resources, Methodology, Supervision
WJJ: Methodology, Supervision, Funding acquisition
YBF, XXL, and MLL: Investigation, Data curation
JH: Conceptualization, Project administration, Supervision, Writing-review& editing
CXH: Funding acquisition, Supervision
Declaration of conflicting interests
The authors declare that they have no competing interests.
Funding
The authors disclose receipt of the following financial support for the research, authorship, and/or publication of this article: This study was supported by a grant from the Medical Key Support Disciplines Foundation of Suzhou (No. SZFCXK202134) and the Science and Technology Program of Suzhou (No. SYS2020069).