
Abstract
Objective
This study aimed to establish a new prognostic nomogram for bone metastasis in patients with prostate cancer (PCa).
Methods
This study retrospectively analyzed clinical data from 332 patients diagnosed with PCa from 2014 to 2019, and patients were randomly divided into a training set (n = 184) and a validation set (n = 148). Multivariate logistic regression analysis was used to establish a prediction model based on the training set, and a nomogram was constructed for visual presentation. The calibration, discrimination and clinical usefulness of the model were evaluated using the validation set.
Results
Total prostate-specific antigen, clinical tumor stage, Gleason score, prostate volume, red cell distribution width and serum alkaline phosphatase were selected as predictors to develop a prediction model of bone metastasis. After evaluation, the model developed in our study exhibited good discrimination (area under the curve: 0.958; 95% confidence interval: 0.93–0.98), calibration (U = 0.01) and clinical usefulness.
Conclusions
The new proposed model showed high accuracy for bone metastasis prediction in patients with PCa and good clinical usefulness.
Introduction
Prostate cancer (PCa) is a common tumor in men, and its incidence is gradually increasing. 1 Owing to a lack of typical clinical manifestations in the early stages, PCa is usually diagnosed in the middle or late stages when bone metastasis has developed. Bone is a common metastatic site of PCa.2,3 Once bone metastasis occurs, the survival rate of patients is significantly reduced, and their quality of life is decreased because of bone-related events.2,3 Bone scanning with technetium-99m methylene diphosphonate (99m Tc-MDP) is the most common examination used to detect bone metastases of PCa before the development of apparent clinical symptoms. 4 However, various shortcomings limit its application in patients with potential bone metastasis, including high cost and overexposure, because not all patients newly diagnosed with PCa have bone metastases. Therefore, methods to identify patients with PCa who require examination for bone metastasis are urgently needed.
A clinical prediction model based on PCa-related risk factors provides a useful tool to screen patients with PCa and identify those who require examination for bone metastasis. 5 To date, only a few PCa bone metastasis models have been developed, with markedly heterogeneous results.5–7 One important explanation may be the inconsistencies in the criteria for converting continuous variables into categorical variables. As a result, the guidelines developed by different associations, including the European Association of Urology, American Urological Association and National Comprehensive Cancer Network, regarding the examination of bone metastasis in patients with PCa are not uniform. 5 In addition, although the above prediction models provide important value for PCa bone metastasis screening, there are still deficiencies, such as a small number of risk factors and a lack of assessment regarding clinical usefulness.
In this study, based on objective clinical data, a new prediction model of PCa bone metastasis was established. Total prostate-specific antigen (tPSA), clinical tumor stage (cTx), Gleason score (GS) values, prostate volume (PV), red cell distribution width (RDW) and serum alkaline phosphatase (ALP) were screened as predictors. By evaluating the prediction model in the validation set, we found that the model had high discrimination, calibration and clinical usefulness. In addition, the predictors included in the model are routine detection indicators of PCa, and the model avoids converting continuous variables into categorical variables to ensure that complete information is retained as far as possible.
Materials and methods
Study population and design
The study retrospectively collected consecutive patients who were histologically diagnosed with PCa at a tertiary health care center from 2014 to 2019. These patients were randomly divided into a training set for developing the model and a validation set for evaluating the model. Patients who were newly diagnosed with PCa for the first time and had all clinical data records required by the study were included, and those who had a history of hormone therapy at the time of staging imaging or a history of 5-alpha reductase inhibitor use were excluded. All patients underwent bone scans using 99m Tc-MDP regardless of baseline PCa characteristics. This was a retrospective study, and no intervention was performed in patients. Therefore, ethics approval was not required. This study was conducted in accordance with the Declaration of Helsinki. Because of the retrospective nature of this study, the requirement for patient informed consent was waived, and the confidentiality of patient data was protected. The reporting of this study conforms to the STROBE statement. 8
Outcome definition
As an outcome event in patients with PCa, bone metastasis was diagnosed by a positive bone scan. For patients with ambiguous bone scans, computed tomography and/or magnetic resonance imaging were performed to further confirm the diagnosis of bone metastasis.
Candidate predictors
Clinical data for potential predictors were collected, including age, cTx according to the TNM 2002 staging system, GS and PV. Data first recorded after hospitalization, including serum calcium level (sCa), serum phosphorus level (sP), RDW, ALP, neutrophil/lymphocyte percentage (N/L) and tPSA, were also evaluated. According to the European Association of Urology 9 and the American Urological Association guidelines, 10 tPSA was divided into four categories (tPSA ≤ 4, 4<tPSA ≤ 10, 10 < tPSA ≤ 20 and tPSA > 20), and GS was divided into three categories (GS ≤ 6, GS = 7 and GS ≥ 8). The time interval between hematological and imaging examinations was 7 to 10 days.
Statistical analysis
The software programs Stata 15.0 (StataCorp LLC, College Station, TX, USA) and R version 3.5.1 (www.r-project.org) were applied for statistical analysis of the relevant variables mentioned above.
For baseline characteristics, bivariate analysis of continuous or ordered distribution variables was conducted by the Wilcoxon rank-sum test, and bivariate analysis of categorical variables was conducted by the chi-squared test. All statistical tests were two-sided, and P-values of <0.05 were considered significant.
In the training set, multivariate logistic regression analysis was applied to screen the predictors and develop prediction models. The best model was selected by a forward stepwise selection process with the Akaike information criterion (AIC) as the stop rule. 11 The model was visually presented as a nomogram.
In the validation set, receiver operating characteristic (ROC) analysis was used to evaluate the discriminatory ability of the developed model by the area under the curve (AUC). In addition, the calibration degree of the model was evaluated by calibration curve analysis via the unreliability U test. Moreover, decision curve analysis (DCA) was used to evaluate the clinical usefulness of the model by the net benefits quantified under the differential threshold probabilities. 12
Results
Clinical characteristics of patients in the training and validation sets
This study evaluated 332 patients with PCa, including 184 used as the training set and 148 used as the validation set. Among 332 patients with PCa, 151 patients suffered from bone metastasis, with 82 cases in the training set and 69 cases in the validation set. In the two datasets, age, sCa, sP and RDW were not significantly different between the non-bone metastasis group and the bone metastasis group. However, tPSA, GS, cTx and ALP showed significant differences between the two groups (all P < 0.01), suggesting that patients with bone metastases were more likely to have high tPSA levels, high GS scores, and advanced tumors (Table 1).
Clinical characteristics of patients with PCa.

PCa = prostate cancer; BM = bone metastasis; IQR = interquartile range; tPSA = total prostate-specific antigen; GS = Gleason score; cTx = clinical tumor stage; PV = prostate volume; sCA = serum calcium; sP = serum phosphorus; RDW = red cell distribution width; ALP = alkaline phosphatase; N/L = neutrophil/lymphocyte percentage.
Risk prediction model development and visual presentation
In the training set, multivariate logistic regression analysis was applied to screen predictors and develop models. Among all developed models, the AIC value of the model developed with cTx, GS, tPSA, ALP, RDW and PV as predictors (termed model 1) was the lowest. Among them, the P-values of RDW and PV were greater than 0.05. Considering that risk factors are not necessarily predictive factors and that the predictive model takes into account the comprehensive predictive ability of all selected factors, we initially considered model 1 an ideal predictive model. To further clarify whether the removal of RDW and PV improved model 1, we established model 2 without RDW and PV. We used the AIC value as an indicator to screen the prediction models. The AIC of model 2 was slightly higher than that of model 1, suggesting that model 2 is inferior to model 1. A prediction model should have few independent variables whenever possible. Therefore, to clarify if the value of removing RDW and PV in model 2 exceeded the value of the slight AIC difference between the two models, the likelihood ratio (LR) test was used to evaluate the potential value of the two models. The results showed a significant difference between these two models (P < 0.05), suggesting that model 1 is better than model 2, despite having two more independent variables (Table 2). Therefore, we selected model 1 as the risk prediction model and visually presented model 1 by establishing a nomogram (Figure 1).
Multivariate analysis in the training set.
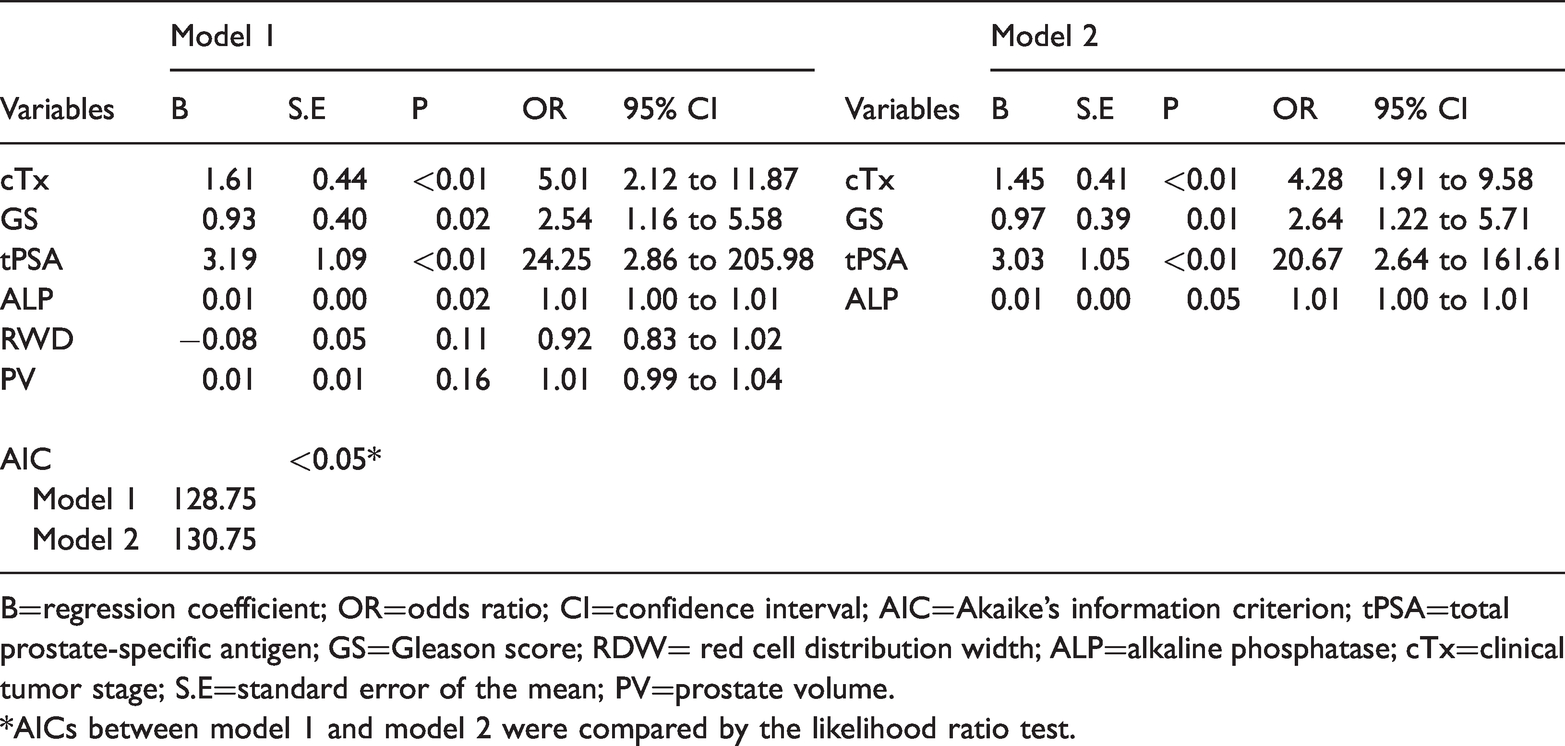
B=regression coefficient; OR=odds ratio; CI=confidence interval; AIC=Akaike’s information criterion; tPSA=total prostate-specific antigen; GS=Gleason score; RDW= red cell distribution width; ALP=alkaline phosphatase; cTx=clinical tumor stage; S.E=standard error of the mean; PV=prostate volume.
*AICs between model 1 and model 2 were compared by the likelihood ratio test.

Nomogram to predict bone metastasis in patients with PCa. The points for each predictor were calculated by drawing a straight line from the patient’s variable value to the axis labeled “Points”. The sum is converted to a probability of bone metastasis in the lowest axis.
Evaluation of the risk prediction model
To evaluate model 1, discrimination, calibration and clinical usefulness were validated by ROC analysis, calibration curve analysis and DCA. In the training set, the AUC was 0.936 (95% confidence interval [CI], 0.90–0.97) (Figure 2a), which was greater than the threshold of 0.75, indicating high discrimination and good performance. The calibration plot showed good agreement between the ideal reference line and bias-corrected prediction (mean absolute error = 0.02). The unreliability U test resulted in a P-value of 0.95 (U = −0.01) (Figure 3), suggesting that the model was well fitted. To further validate model 1, a validation set was used to evaluate the discrimination and calibration of model 1. The AUC in the validation set was 0.958 (95% CI, 0.93–0.98) (Figure 2b), and calibration analysis showed that the U test resulted in a P-value of 0.613 (U = 0.01) (mean absolute error = 0.04) (Figure 3). Both results further demonstrated that model 1 has good performance, discrimination and calibration. Finally, to evaluate the clinical usefulness of the model, we conducted DCA in the validation set (Figure 4). The results showed that the model achieved a net benefit across all threshold probabilities. When the threshold probability was set to more than 2%, model 1 obtained a better net benefit and benefit in at least approximately 7 of 100 people and did not negatively affect the interests of others. Together, these results indicate that model 1 has good clinical usefulness for predicting the bone metastasis of PCa.
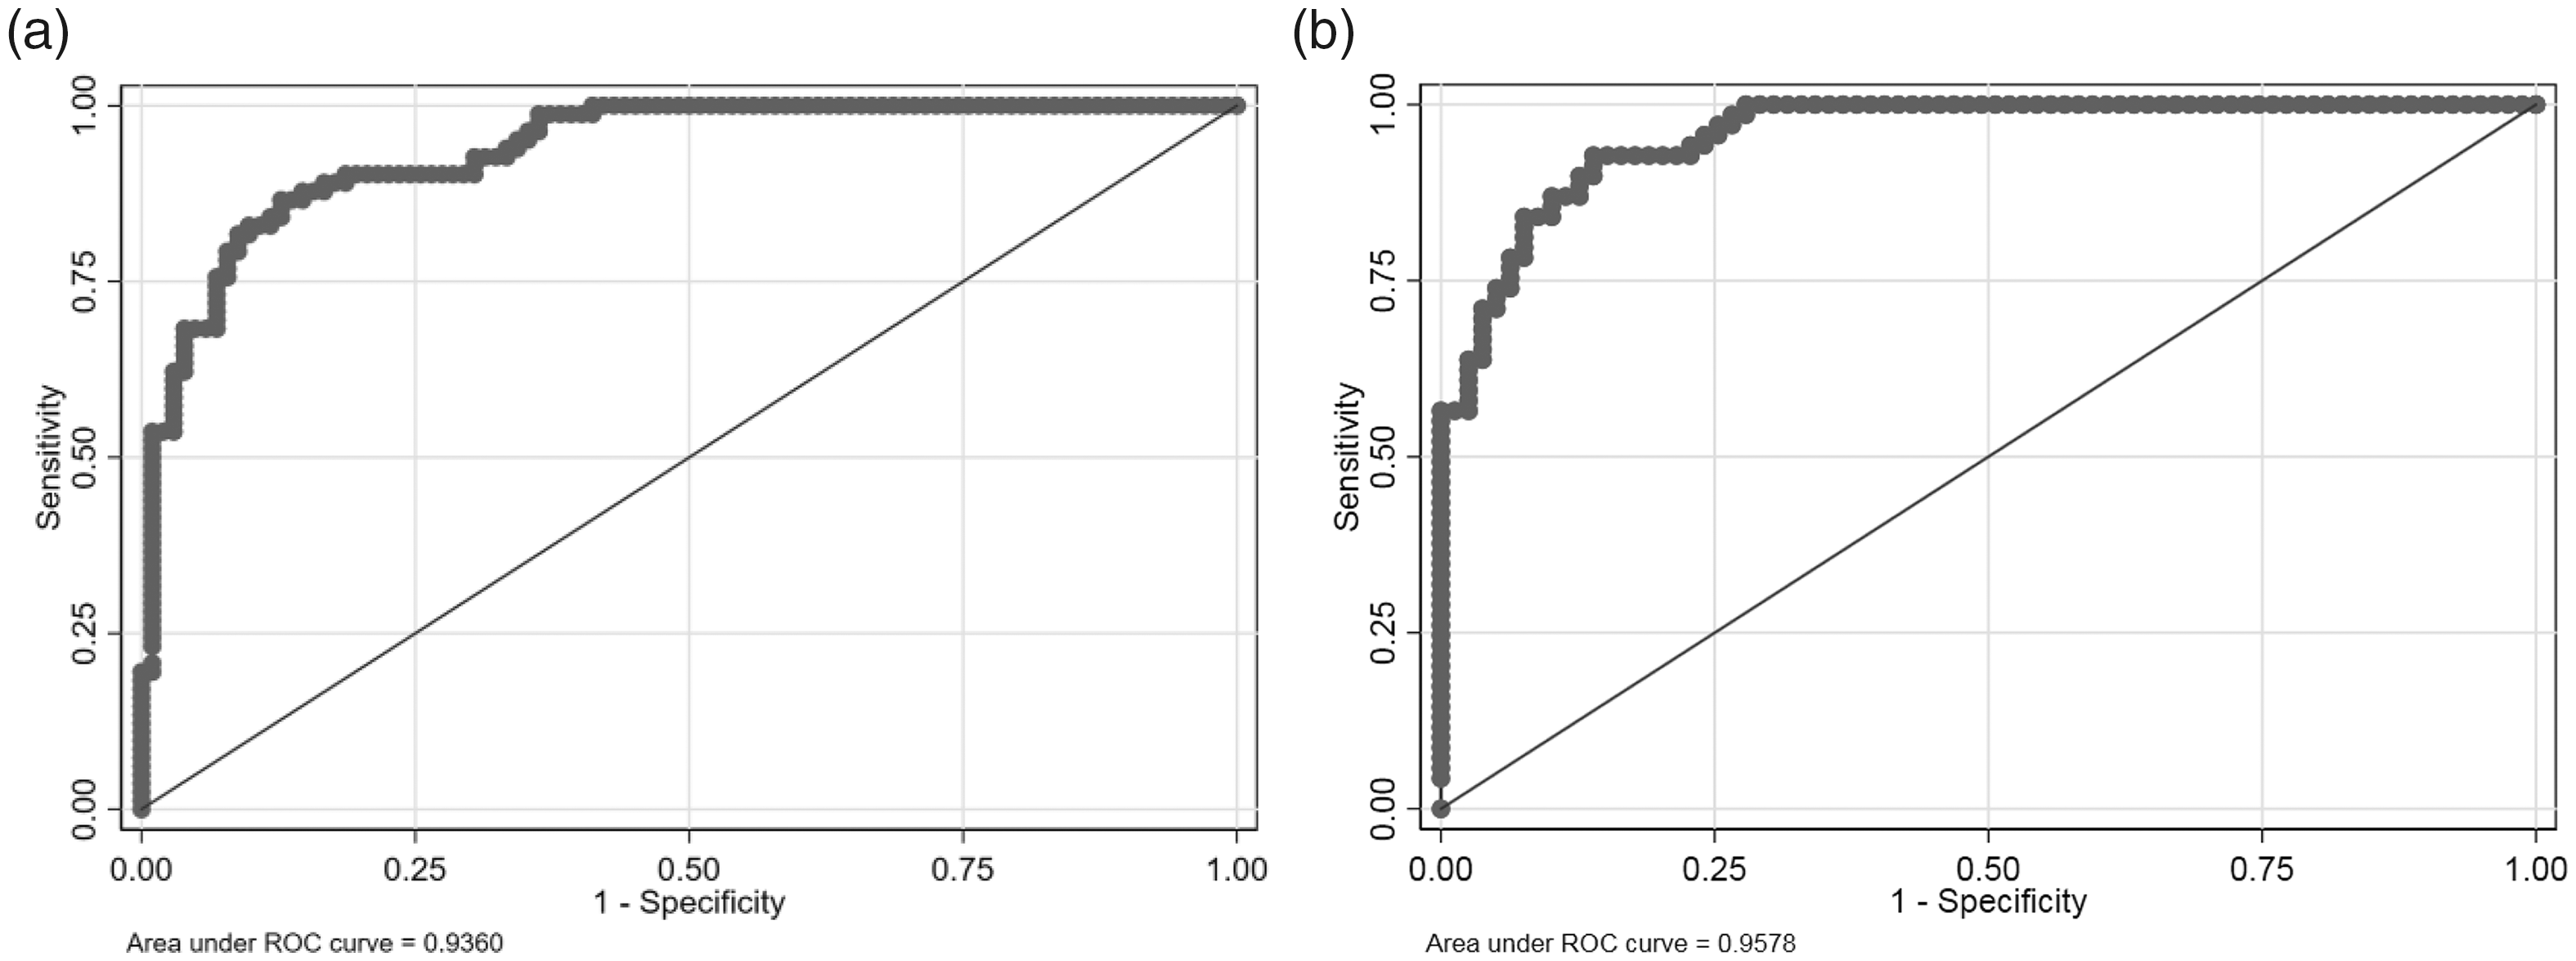
ROC analysis for evaluating the discrimination of model 1. (a) ROC in the training set. The AUC was 0.936 (95% CI, 0.90–0.97). (b) ROC in the validation set. The AUC was 0.958 (95% CI, 0.93–0.98)

Calibration curve analysis for evaluating the calibration of model 1. (a) Calibration curve in the training set. Mean absolute error = 0.02. (b) Calibration curve in the validation set. Mean absolute error = 0.04. The X-axis is the predicted probability, and the Y-axis is the actual probability. The logistic calibration curve represented by the black solid line was closer to the ideal reference line represented by the gray solid line, suggesting that model 1 performed well.
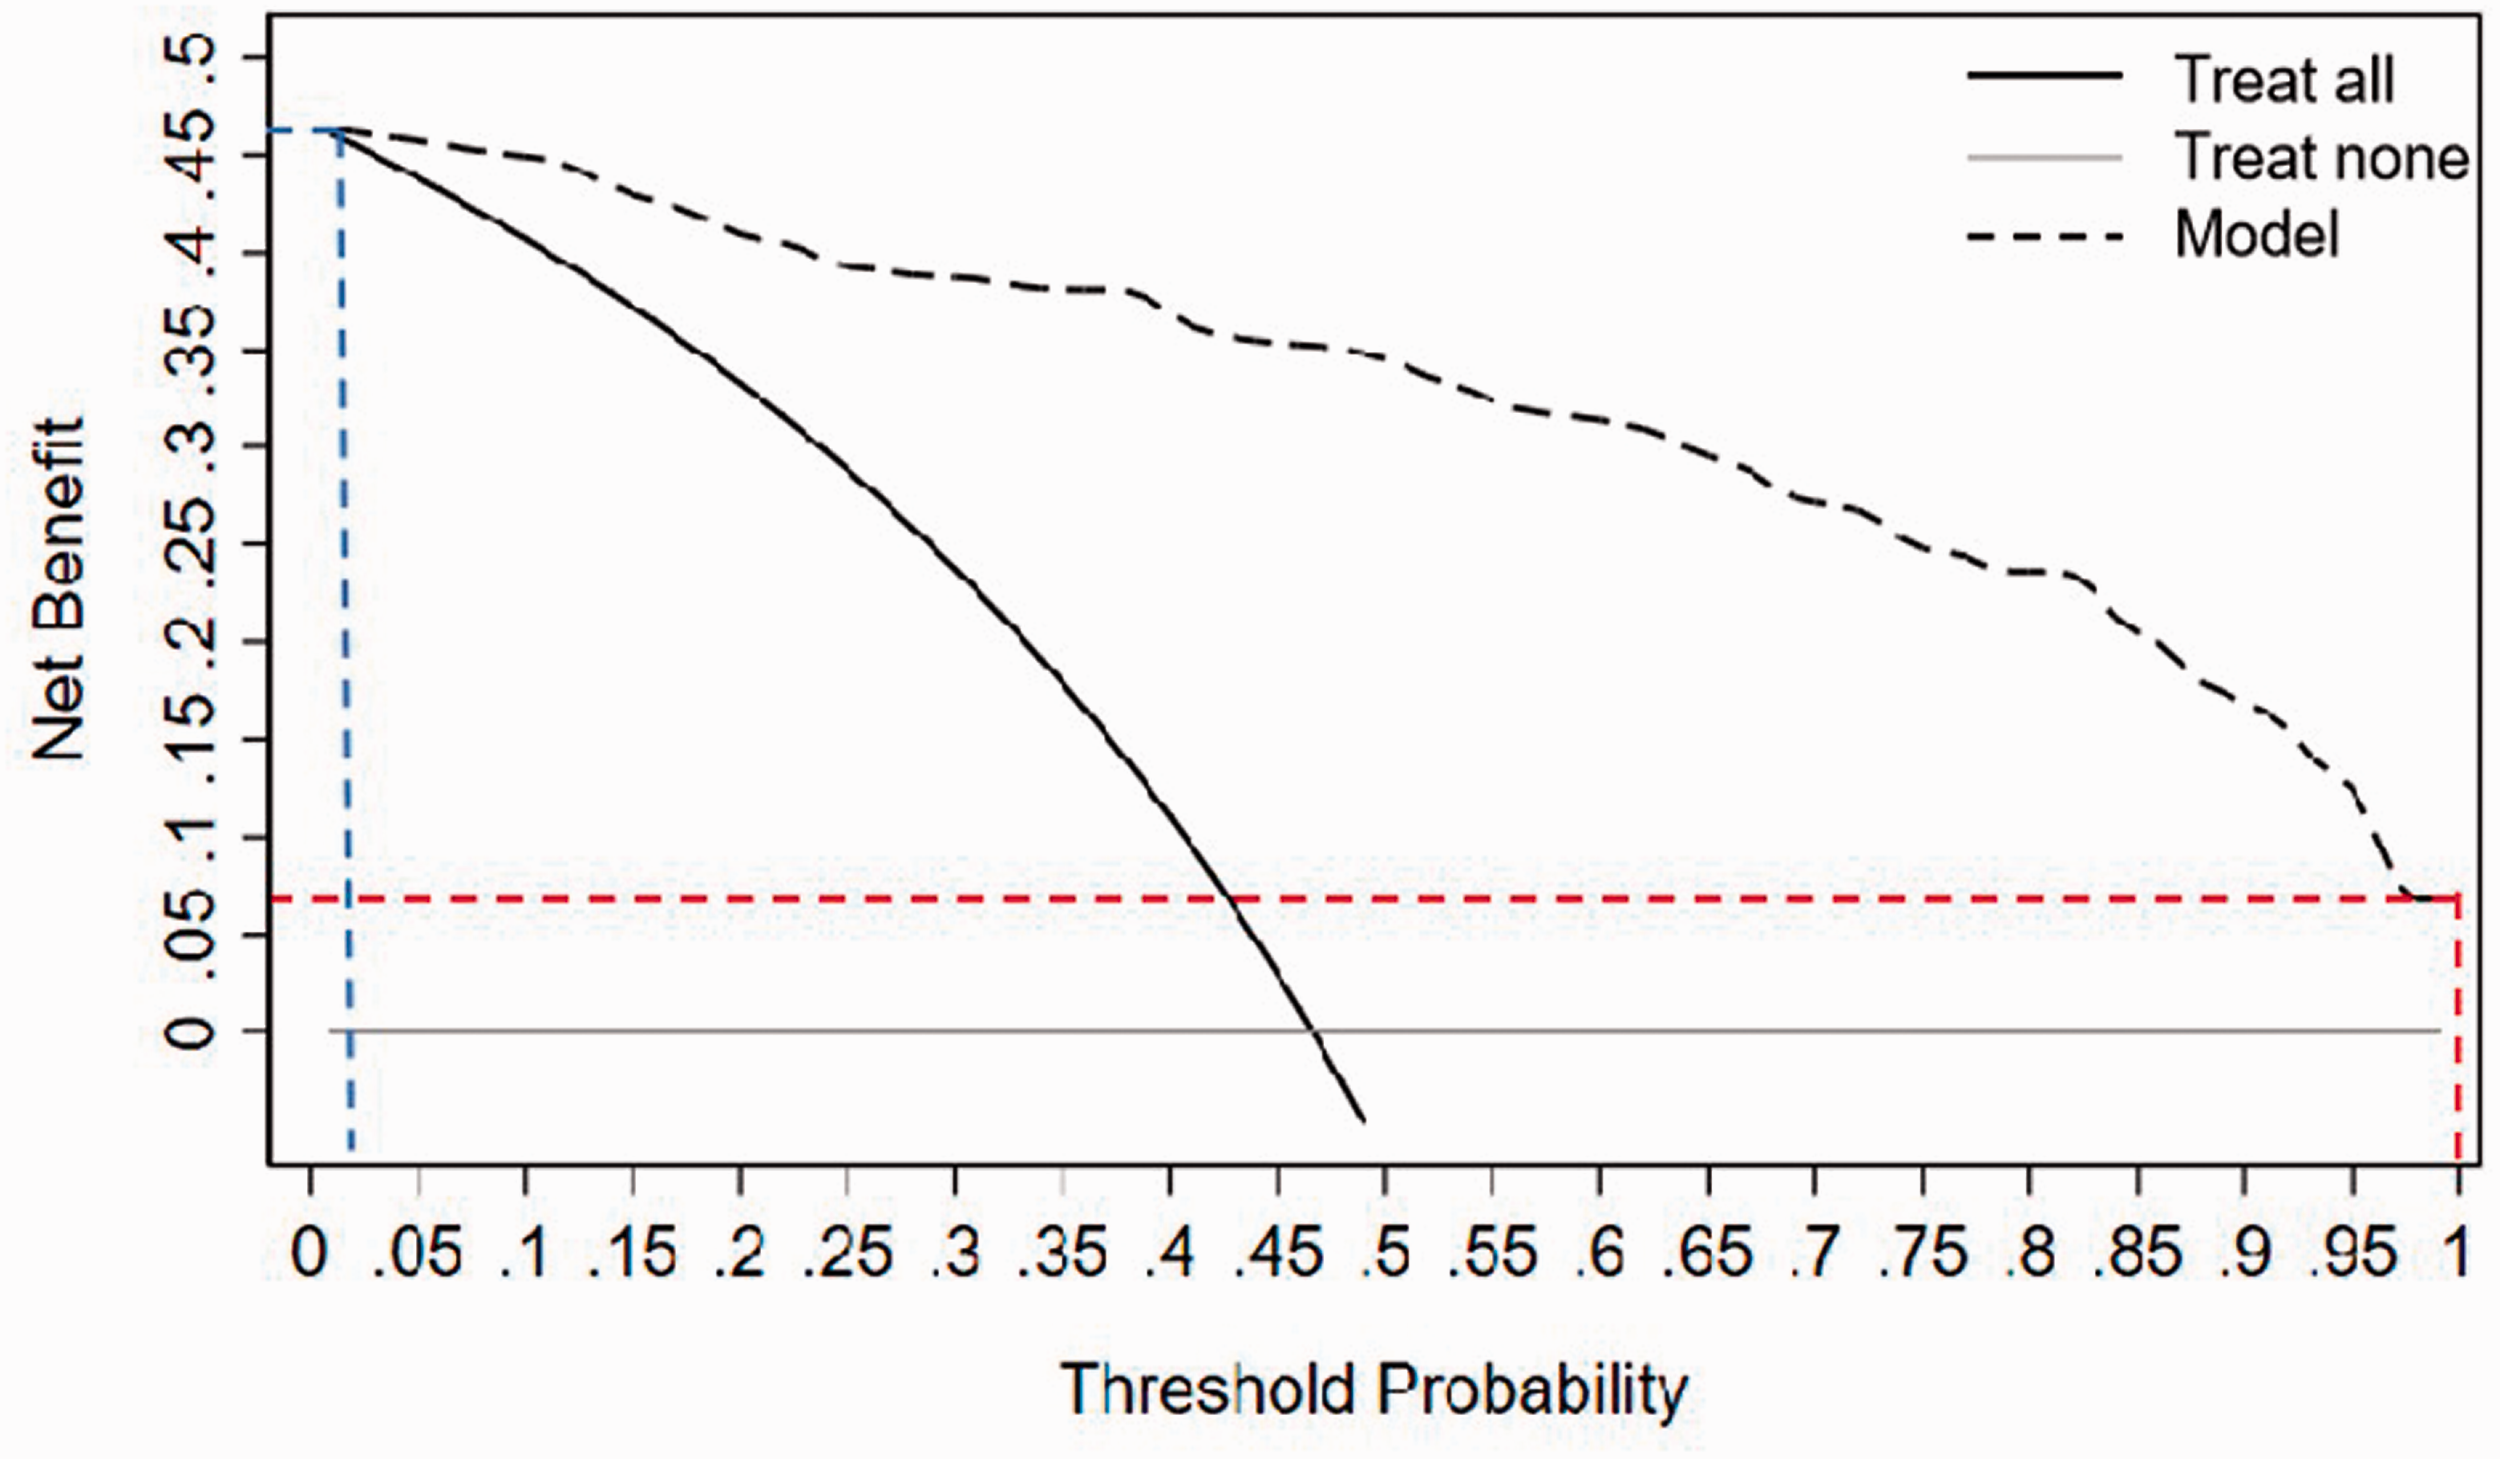
Decision curve analysis for evaluating clinical usefulness. The X-axis is the probability threshold. When a probability threshold is used as the cutoff value, the corresponding Y-axis value indicates the net benefit value, suggesting how many people per 100 people will benefit without negatively influencing other patients. The blue vertical dashed line is when 2% is used as the probability threshold, and the blue horizontal dashed line shows the net benefit value (∼47%). The red vertical dashed line is when 100% is used as the probability threshold, and the red horizontal dashed line shows the corresponding net benefit value (∼7%).
Discussion
Recently, with the extension of the human lifespan, the incidence of tumors has gradually increased. 13 PCa is a common neoplastic disease in elderly men. With advanced age, the incidence of PCa gradually increases.1,13 Therefore, the monitoring of PCa in men, especially elderly men, is particularly urgent. Although PCa grows slowly compared with most other tumors, it is impossible to completely cure the tumor in the elderly. Furthermore, when bone metastasis occurs in PCa, it significantly reduces the survival rate and quality of life for patients because of bone-related events.14,15 Therefore, clarifying the situation of bone metastasis in patients with PCa is urgently needed to avoid delayed treatment.
At present, bone scanning using 99m Tc-MDP is an important method to detect bone metastasis in patients with PCa. 4 Although bone scans help identify bone metastases as soon as possible for patients newly diagnosed with PCa, 16 not all patients require a bone scan. Excessive examination not only increases the financial burden for patients and insurance providers but also increases the associated exposure risks. To address these issues, identifying patients with PCa who require bone metastasis detection is essential. A risk prediction model based on various risk factors is an effective method for screening high-risk patients with bone metastasis. To date, based on risk factors related to the bone metastasis of PCa, such as clinical stage, PSA, ALP, GS, sCa and others, multiple risk prediction models for bone metastasis have been developed to identify patients with PCa who need to be scanned for bone metastasis.5–7 These studies have stratified the risk of bone metastasis in patients with PCa. Although the developed models significantly improved the ability to assess the risk of bone metastases, their use is limited by several factors: 1) Few candidate predictors were included in these studies. As a result, they do not fully reflect the characteristics of bone metastasis or form the basis for an optimal model. 2) Excessive conversion of continuous variables into categorical variables decreases the predictive accuracy of the prediction model. 3) Although the classification of multiple predictors to stratify the risk of bone metastasis is highly convenient for clinical application, inconsistencies in identifying bone metastasis risk from multiple associations show that variable classification loses important information and increases the heterogeneity of results.
A nomogram is a relatively intuitive presentation form for prediction models and has been widely used in the field of tumor risk prediction. Although a nomogram for the bone metastasis of PCa has been developed, the study included few candidate predictors and lacked evaluation of clinical usefulness. 7 In addition, prediction factors were screened according to the P-value, which resulted in the exclusion of several important prediction factors and reduced the predictive ability of the model. In our study, we included 10 candidate predictors, which is significantly more than previous studies. Most candidate predictors are risk factors for PCa and bone metastasis.17–21 Whether tPSA is a risk factor remains to be verified.5,7,8 However, during prediction model development, predictors are not necessarily risk factors. Therefore, tPSA was selected to develop the model in this study. Finally, six predictors, including cTx, tPSA, GS, PV, ALP and RDW, were selected to develop model 1. Moreover, we developed model 2 with four of the above predictors (cTx, tPSA, GS and ALP) with P < 0.05 and compared it with model 1. The addition of PV and RDW (both P > 0.05) improved the prediction ability of model 1 compared with model 2, indicating that these two predictive factors have important value for the prediction ability of the model. ROC curve analysis showed that the AUC of model 1 in the training set was 0.936, and calibration curve analysis in the training set showed that model 1 had high calibration. These findings suggest that model 1 developed in this study has a satisfactory and effective predictive ability for the training set. To further validate model 1, a validation set was applied. The AUC of model 1 was higher in the validation set than that in the training set and significantly higher than that of a model developed in a previous study (AUC = 0.91). 7 Additionally, calibration curve analysis further showed good calibration of our model in the validation set. Finally, we evaluated the clinical usefulness of the model by DCA and found that when >2% was used as the predicted probability cutoff value, at least approximately 7 out of 100 people would benefit, indicating that it obtains a greater net benefit and has higher clinical usefulness. Therefore, the prediction model developed in our study is superior to the previously developed prediction model of bone metastasis in PCa.
Although the bone metastasis risk prediction model developed in our study has good performance and fitness, there are some limitations. First, the data were collected from a single center, and external verification was not performed. Second, although more candidate predictors were included in our study compared with previous studies, we did not include new risk factors as candidate predictors, such as the Prostate Imaging Reporting and Data System score. Additionally, based on the trend of big data, the use of multiomics to build prediction models will greatly improve the accuracy of prediction. Third, the data in this study were not used to validate the published model to directly assess the pros and cons of each model.
Conclusion
In our study, several risk factors for PCa and bone metastasis, including tPSA, cTx, GS, ALP, PV and RDW, were identified as predictors to construct a prediction model for bone metastasis in patients with PCa. The model shows high discrimination, calibration and clinical usefulness and will contribute to the successful screening of patients with PCa who require bone metastasis detection.
Footnotes
Author contributions
GB designed the study, wrote and revised manuscript. ZLC design the study and analyzed the data. XXZ wrote and revised manuscript and organized the data. JX organized data. FZ collected the data. HJL designed and supervised the study. All authors read and approved the final version of the manuscript.
Declaration of conflicting interest
The authors declare that there is no conflict of interest.
Funding
The authors disclosed receipt of the following financial support for the research, authorship, and publication of this article: This study was supported by the Shandong Province Medical and Health Technology Development Plan (Number: 202004050054).